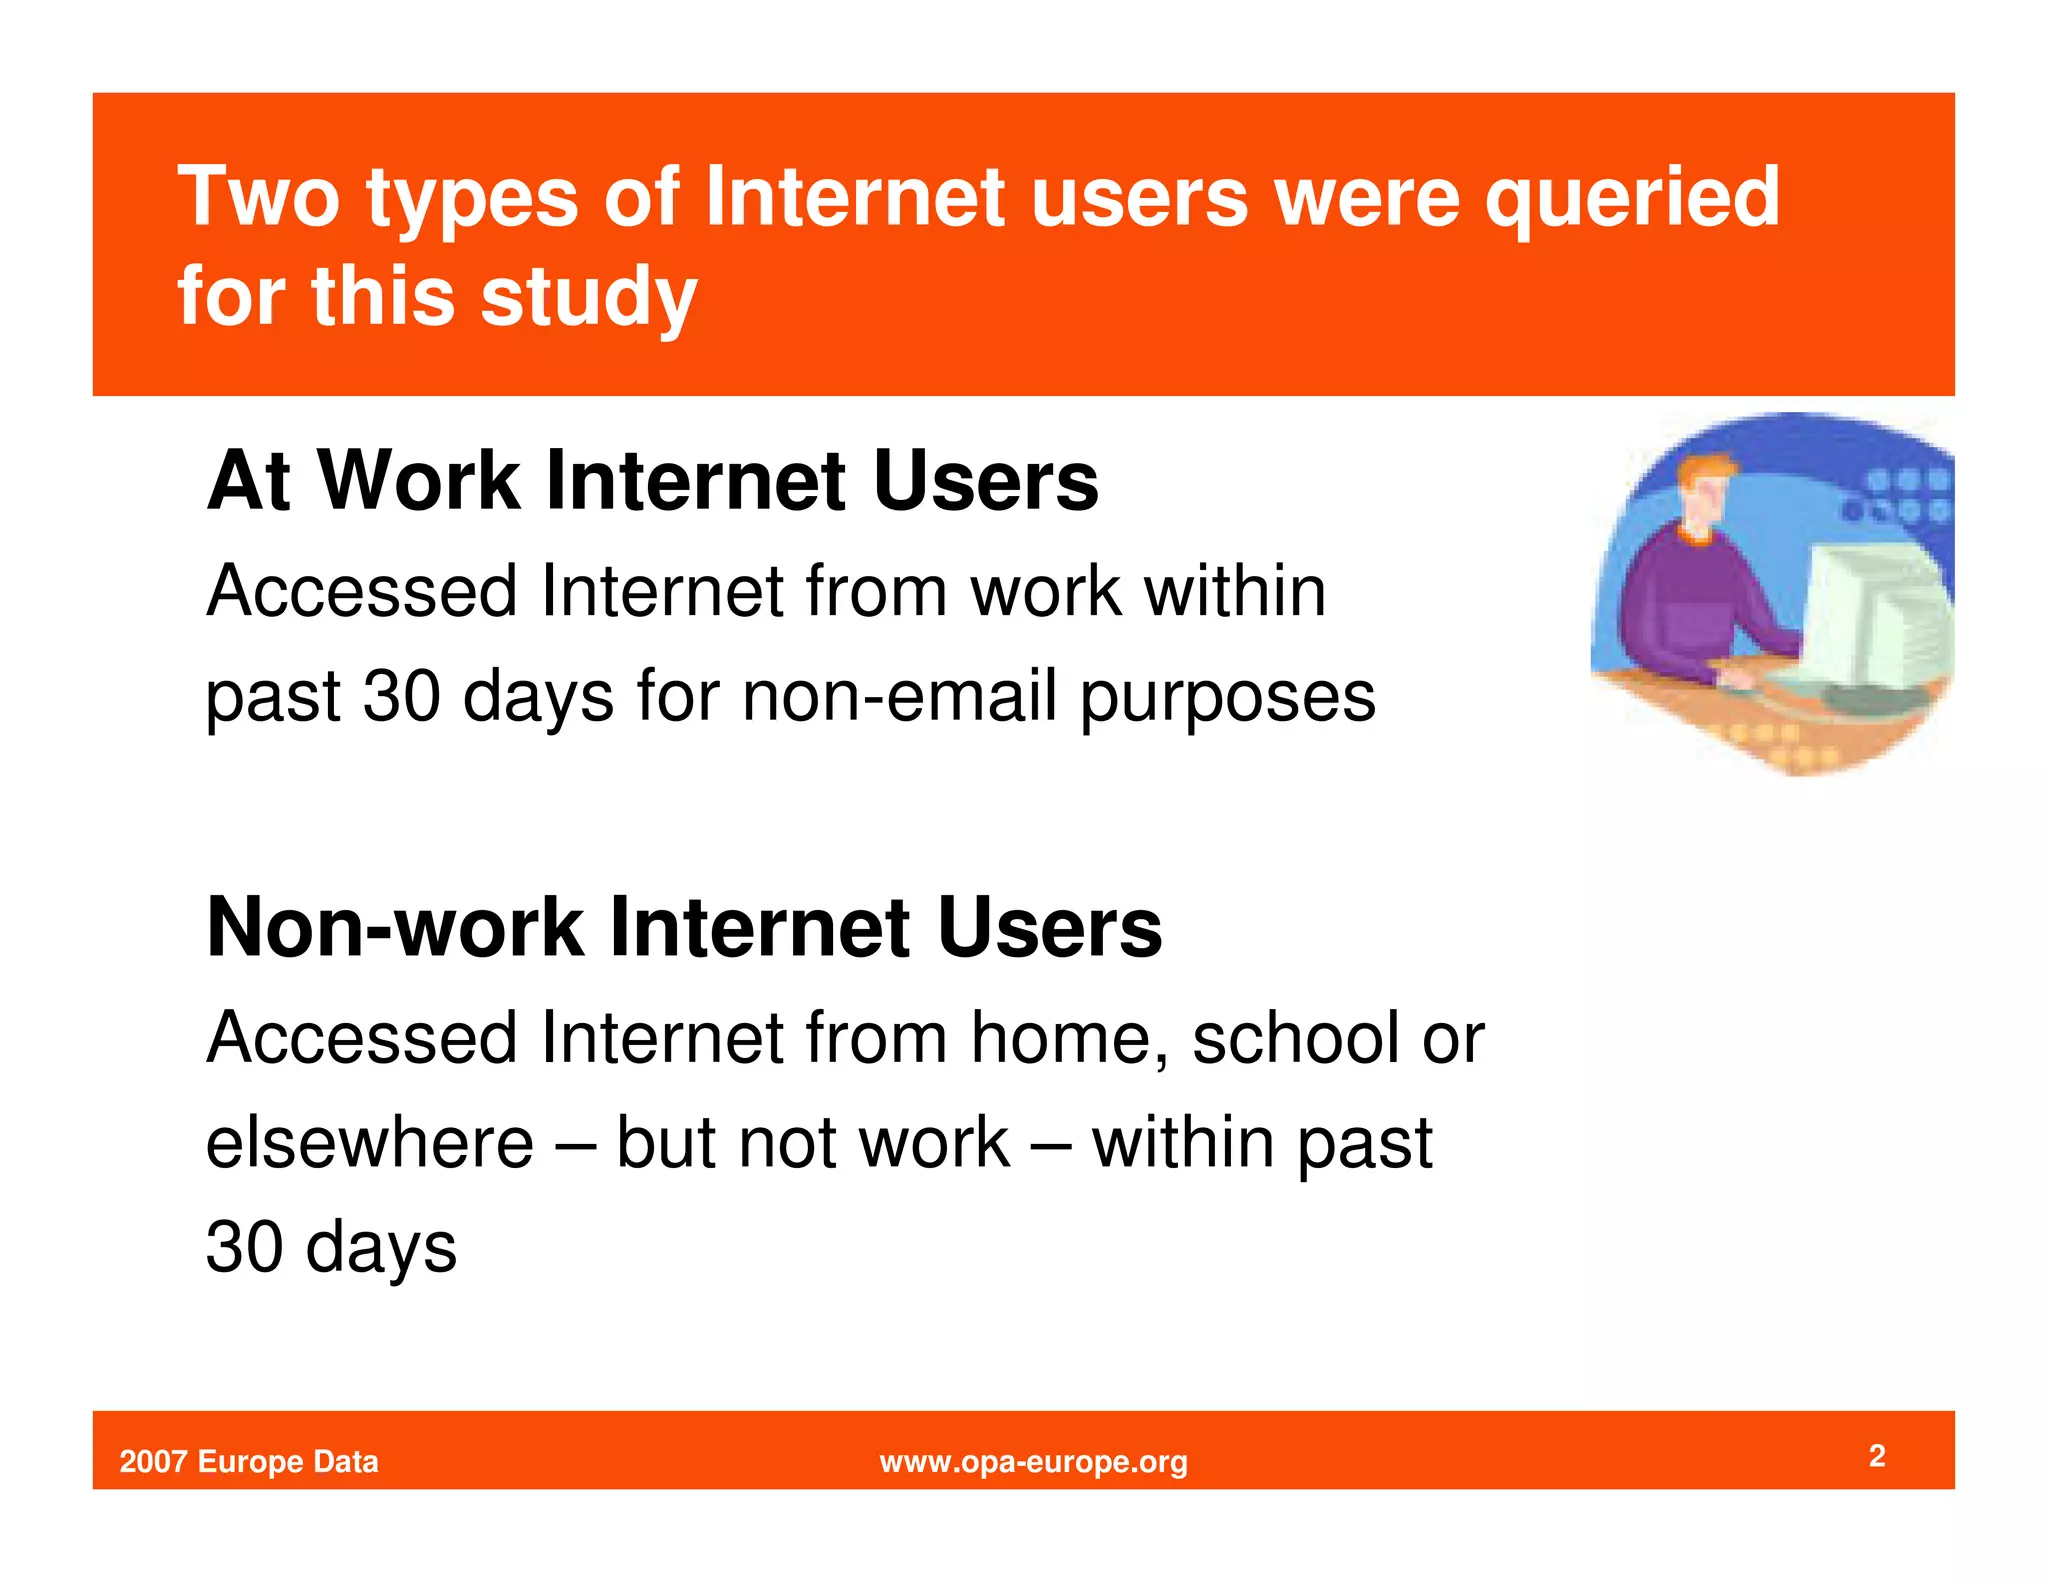
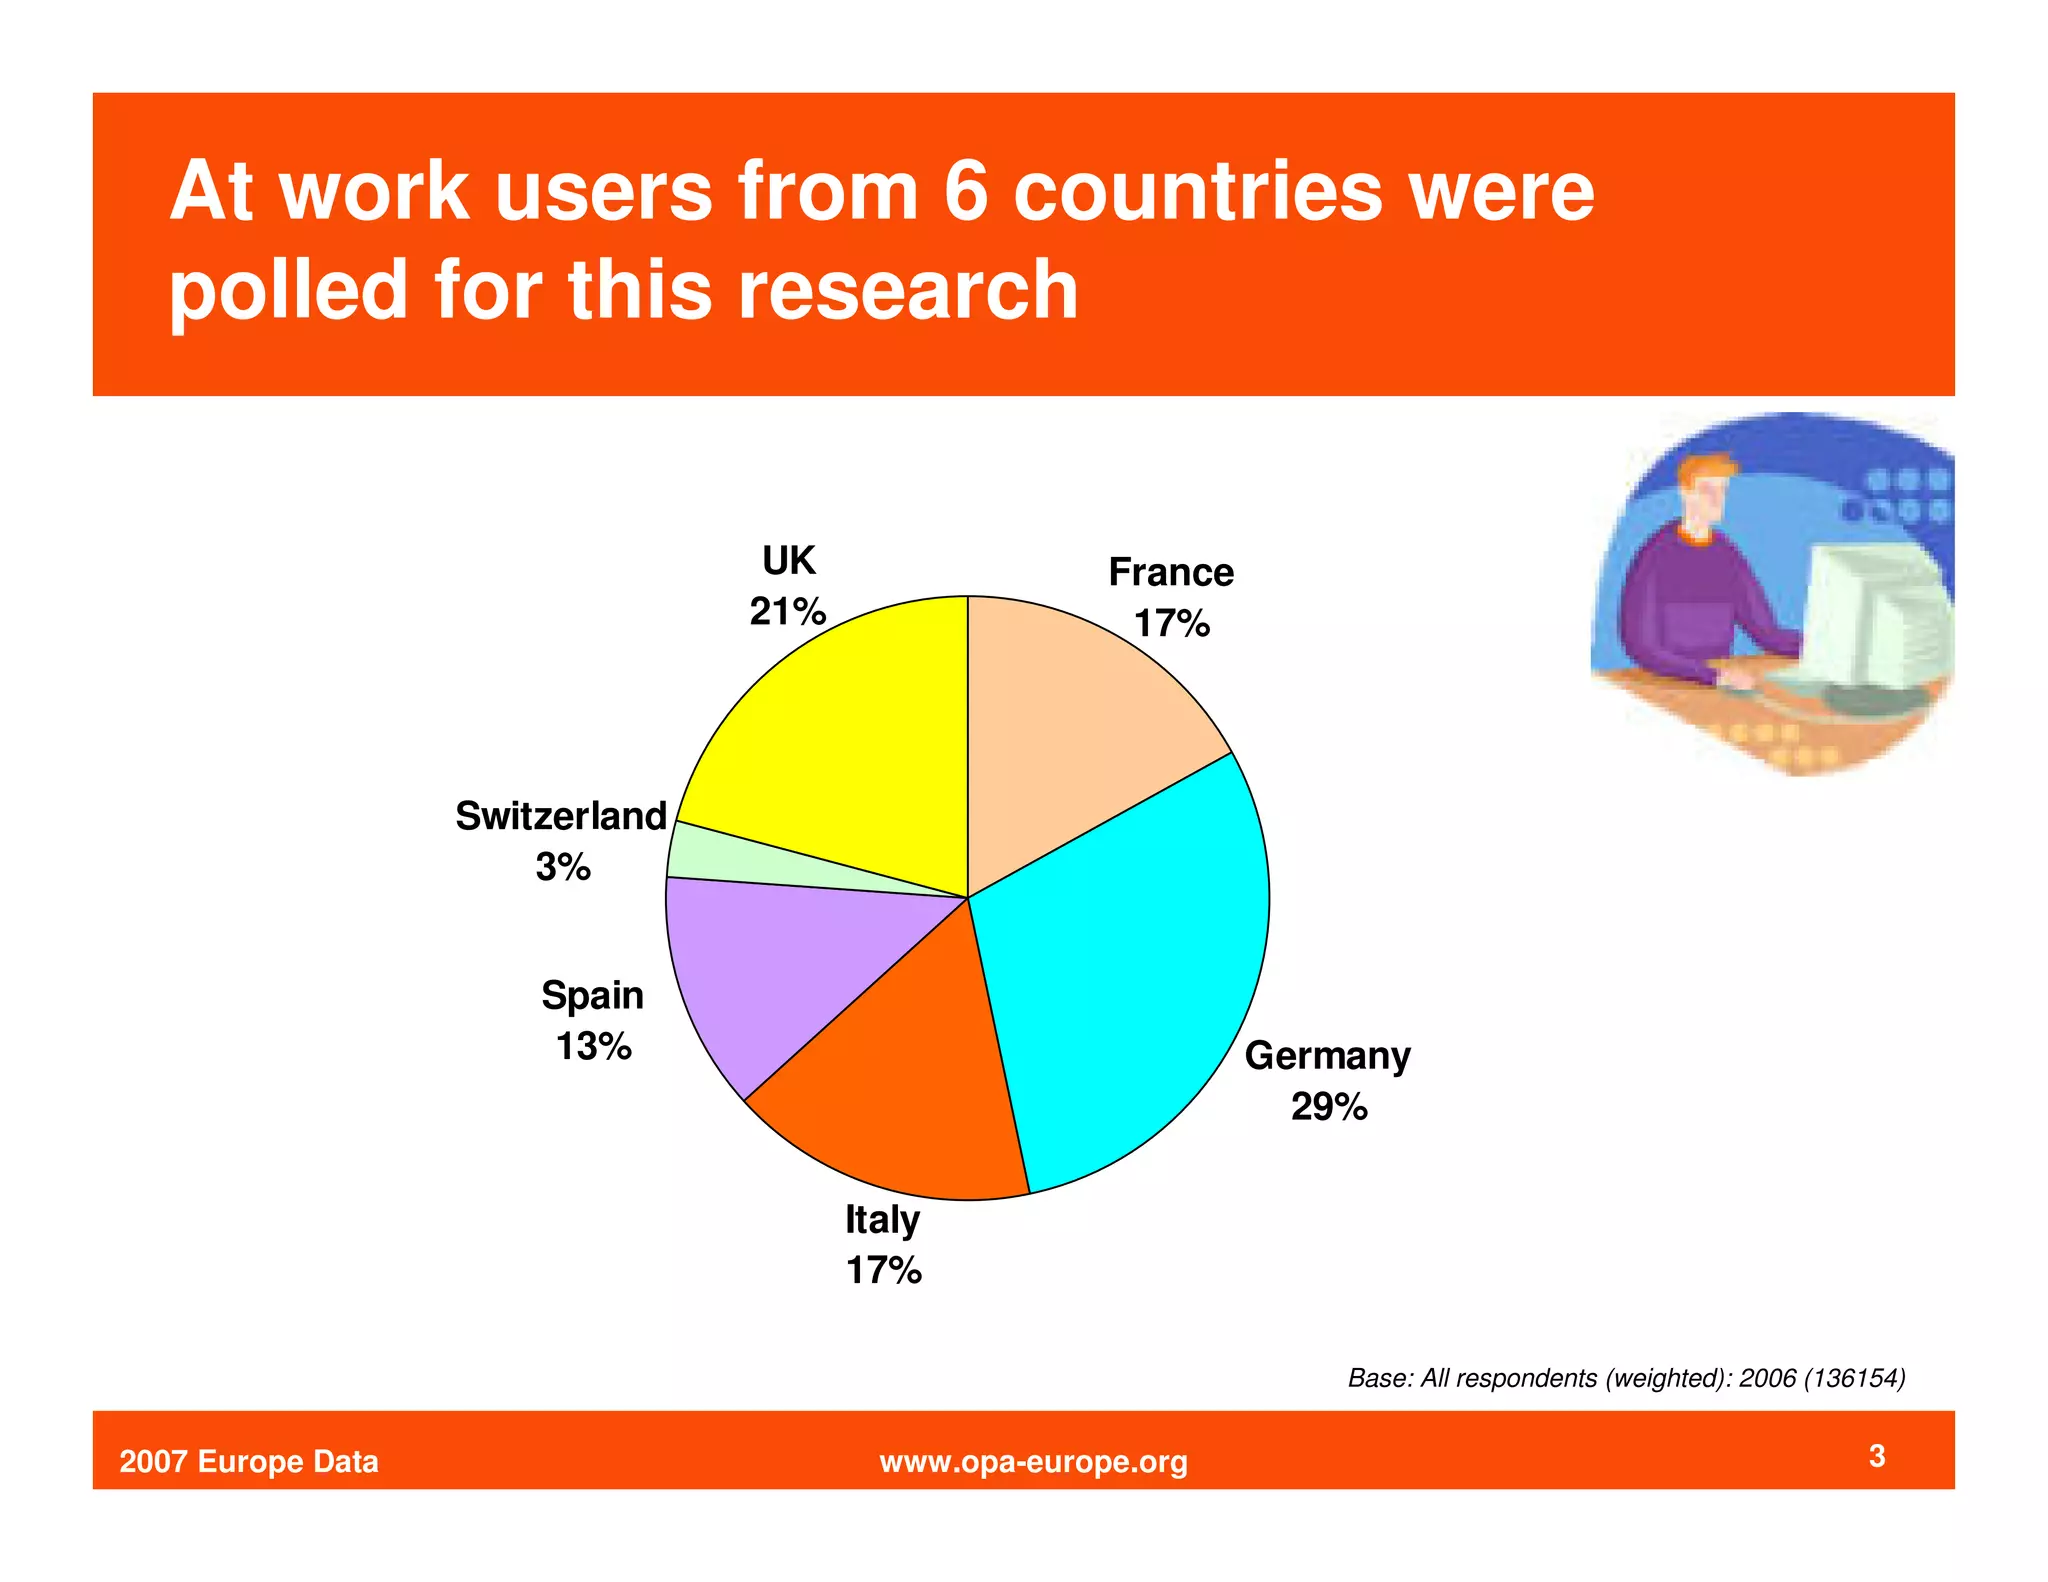
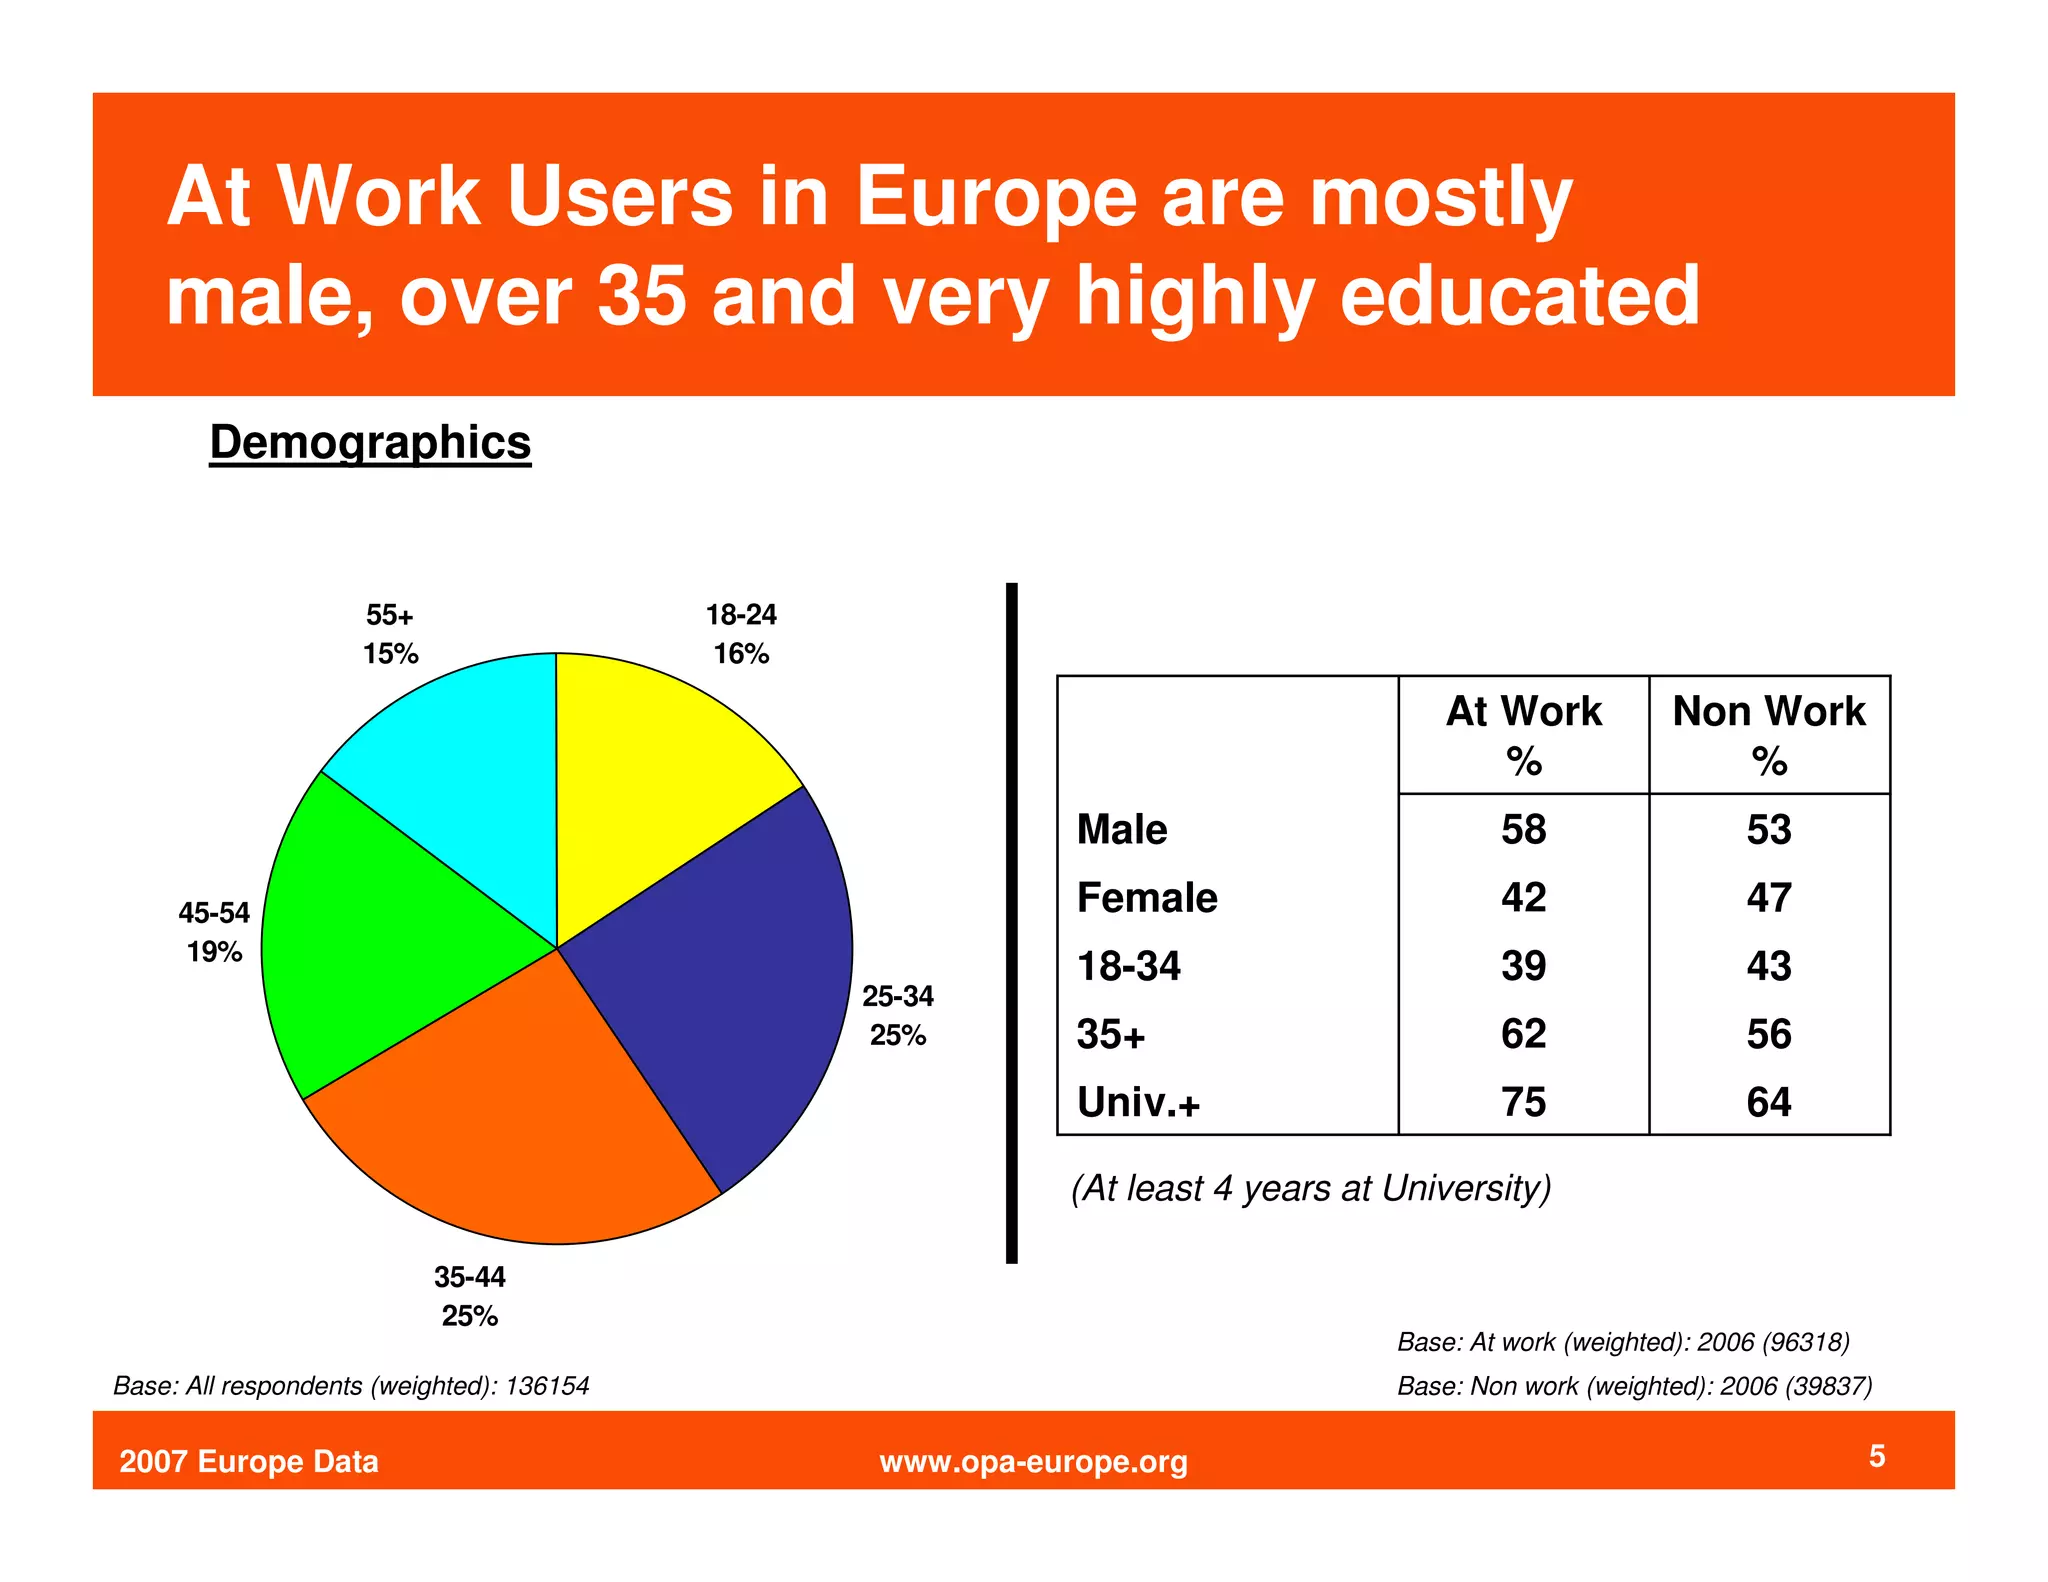
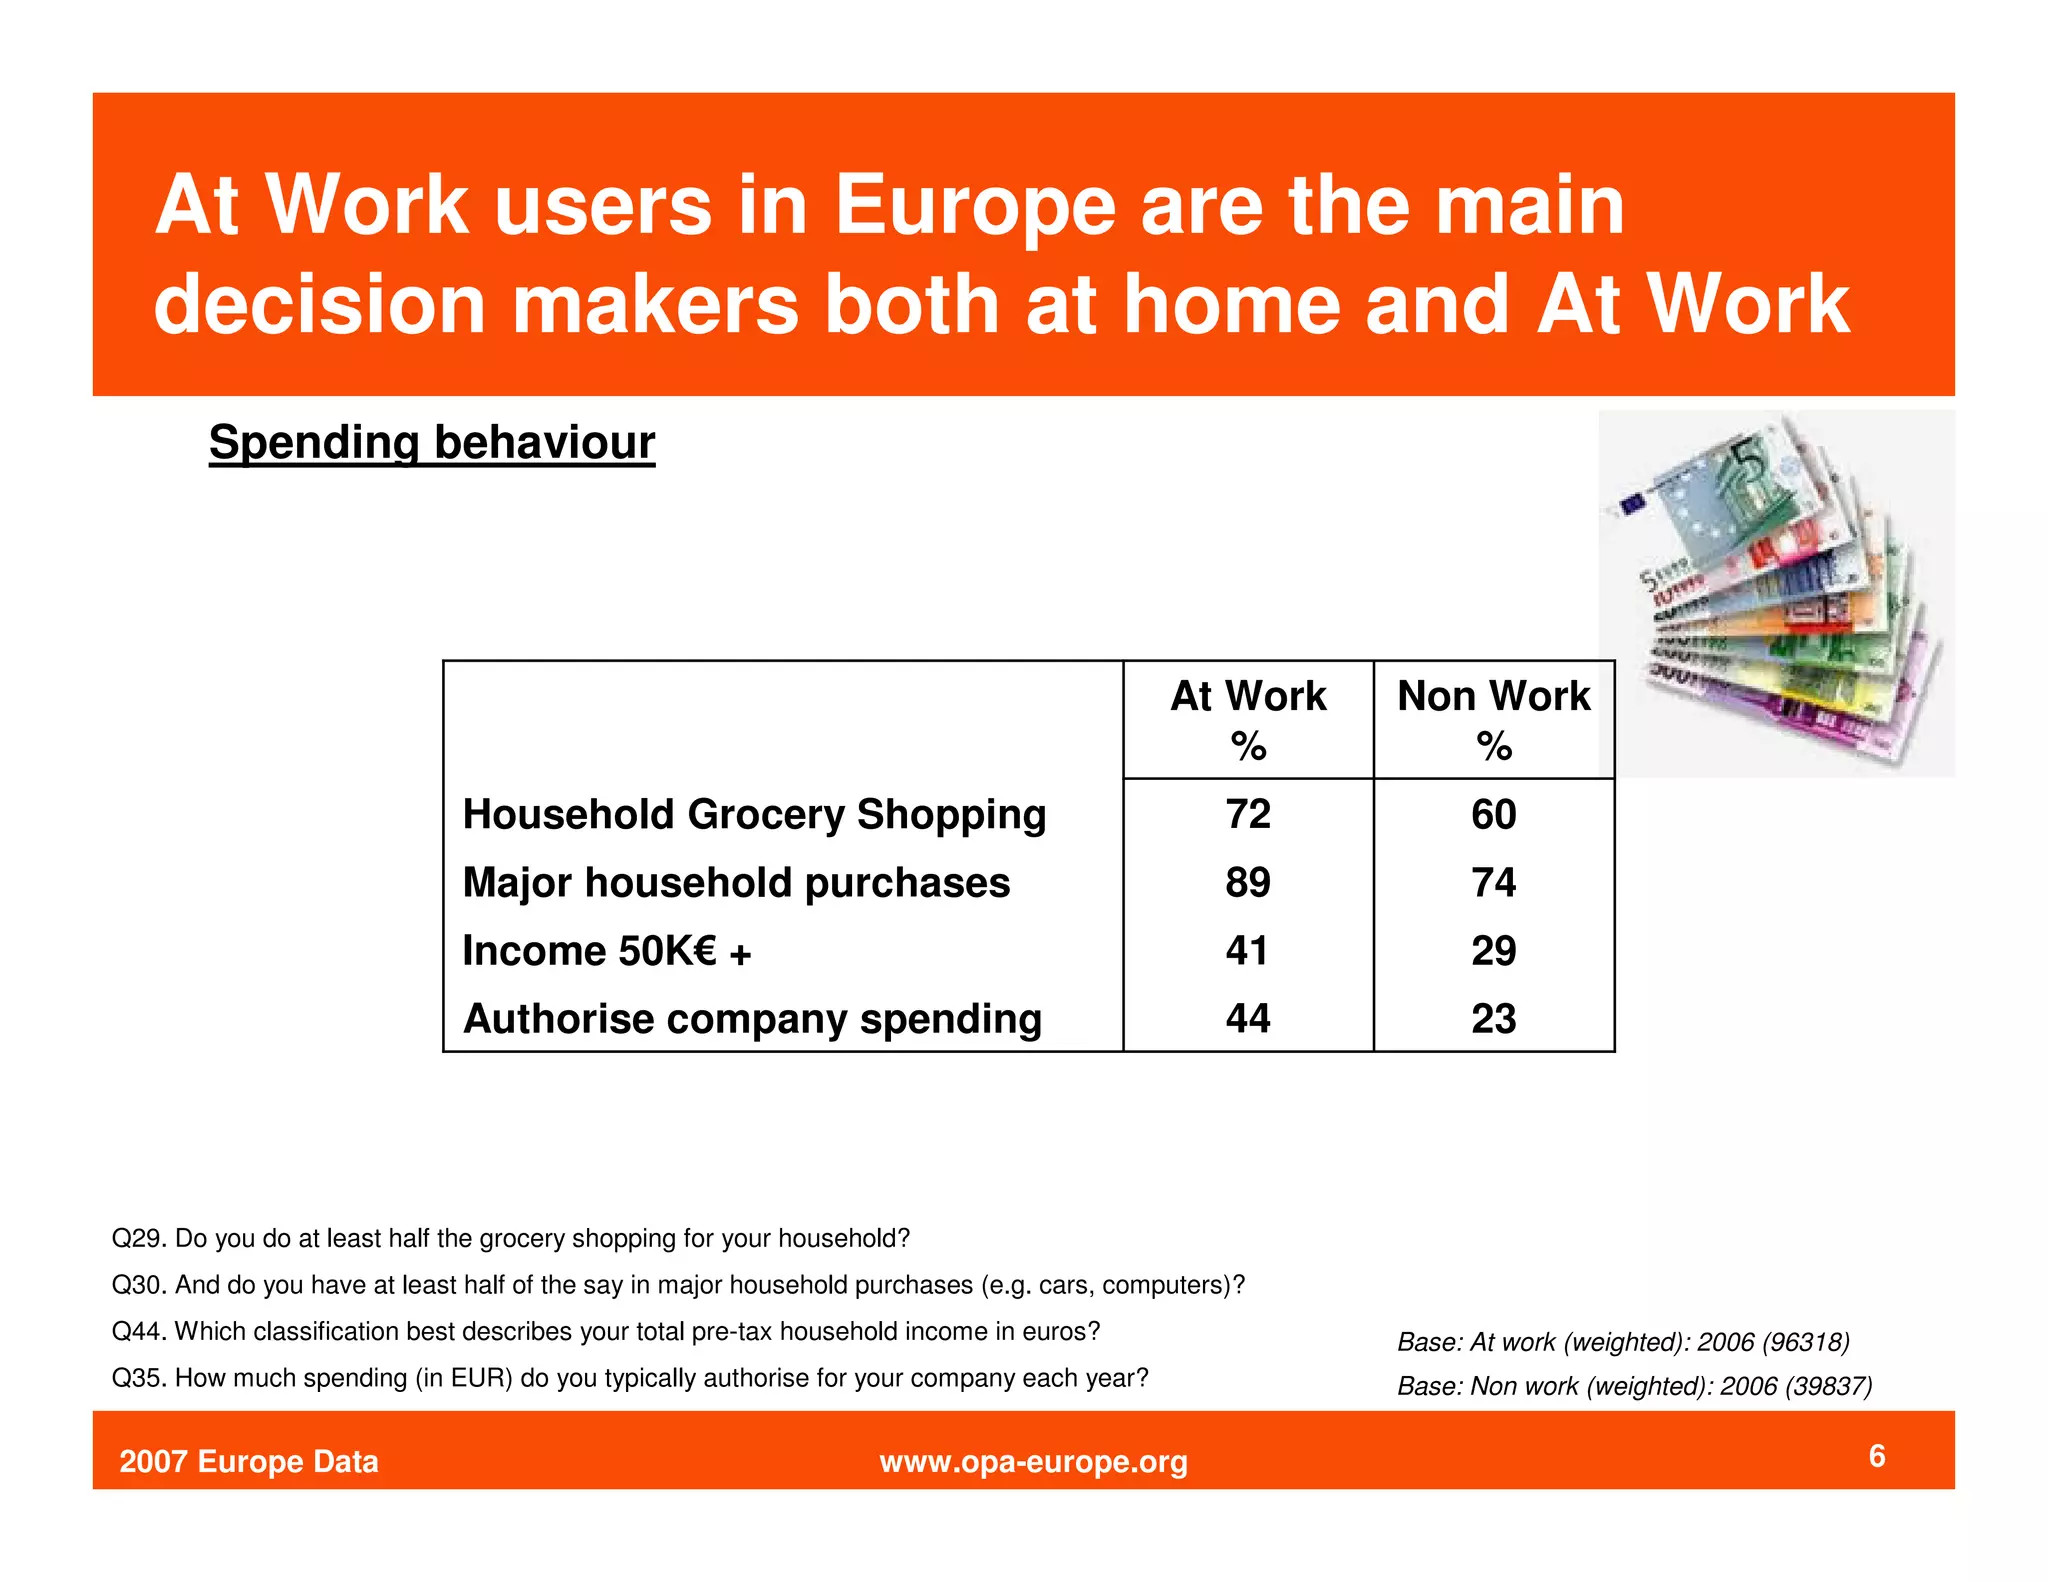
SlideShare a Scribd company logo
1 of 32
Download to read offline
Internet Access At Work
                    A Media Consumption study
                         Results for Europe
                         2006/2007 (Wave 2)
                        Conducted by SKOPOS market insight


                                                             (Wave 1 completed in 2004)

2007 Europe Data                  www.opa-europe.org                               1
Two types of Internet users were queried
   for this study

     At Work Internet Users
     Accessed Internet from work within
     past 30 days for non-email purposes


     Non-work Internet Users
     Accessed Internet from home, school or
     elsewhere – but not work – within past
     30 days

2007 Europe Data         www.opa-europe.org   2
At work users from 6 countries were
  polled for this research


                                  UK                  France
                                 21%                   17%


                   Switzerland
                       3%


                       Spain
                        13%                                    Germany
                                                                 29%

                                       Italy
                                       17%

                                                                   Base: All respondents (weighted): 2006 (136154)


2007 Europe Data                         www.opa-europe.org                                                   3
Demographics
   Europe


   www.opa-europe.org
At Work Users in Europe are mostly
    male, over 35 and very highly educated
        Demographics


                     55+                   18-24
                     15%                    16%

                                                                                        At Work            Non Work
                                                                                           %                  %
                                                               Male                         58                   53
     45-54                                                     Female                       42                   47
      19%
                                                               18-34                        39                   43
                                                   25-34
                                                    25%        35+                          62                   56
                                                               Univ.+                       75                   64

                                                               (At least 4 years at University)

                           35-44
                            25%
                                                                                    Base: At work (weighted): 2006 (96318)
Base: All respondents (weighted): 136154                                            Base: Non work (weighted): 2006 (39837)

2007 Europe Data                                    www.opa-europe.org                                                       5
At Work users in Europe are the main
   decision makers both at home and At Work
        Spending behaviour


                                                                                           At Work   Non Work
                                                                                              %         %
                              Household Grocery Shopping                                        72         60
                              Major household purchases                                         89         74
                              Income 50K€ +                                                     41         29
                              Authorise company spending                                        44         23


Q29. Do you do at least half the grocery shopping for your household?
Q30. And do you have at least half of the say in major household purchases (e.g. cars, computers)?
Q44. Which classification best describes your total pre-tax household income in euros?               Base: At work (weighted): 2006 (96318)
Q35. How much spending (in EUR) do you typically authorise for your company each year?               Base: Non work (weighted): 2006 (39837)

2007 Europe Data                                                  www.opa-europe.org                                                          6
Internet Behaviour and
                     Attitudes


2007 Europe Data      www.opa-europe.org   7
At Work Internet use in Europe has
  remained stable since 2004
       Things At Work users do LESS often as a result of using the internet
                                                                                                            24%
                       Read newspapers
                                                                                                                   27%
                                                                                                                   27%
                        Talk on the phone
                                                                                                          23%
                                                                                                    20%
                          Read magazines
                                                                                                          23%
                                                                                                19%
           Leave office to run errands
                                                                                                 20%
                                                                                      13%
                                Read books
                                                                                                19%
                                                                                    12%
                          Watch television
                                                                                                19%
                                                                                    12%
          Spend time with colleagues
                                                                                              17%
                                                                            9%
                             Listen to radio
                                                                                    12%                                 2004
                                                                       7%                                               2007
                                          Work
                                                                               10%
                                                                       7%
                            Listen to music
                                                                               10%
                                                                    6%
            Attend meetings in person
                                                                    6%

Q25. Which of the following do you do less often at work as a result of using the Internet?               Base: At work users (weighted):2006 (96318)


2007 Europe Data                                                    www.opa-europe.org                                                             8
In 2007, more European users feel the
    Internet improves their productivity At Work
                                                                                                                                            Chart 1 of 2

       Agreement with statements related to use of Internet at work
        I have a set of web sites I regularly visit while at                                                                              88%
                              work                                                                                                        89%

     Internet news is the main way I keep in touch with                                                                             82%
               world events while I’m at work                                                                                       81%

                                                                                                                                 76%
   The Internet has improved my productivity at work
                                                                                                                                    80%

       The Internet is the main way I keep in touch with                                                                   68%
             technology news while I’m at work                                                                                72%

        The Internet allows me to take care of personal                                                              60%
                      tasks while at work                                                                                  69%
                                                                                                                                                2004
       The Internet is the main way I keep in touch with                                                                64%
                                                                                                                                                2007
         business/financial news while I’m at work                                                                         69%

     I tend to use the Web for short bursts of focused                                                                62%
                       activity at work                                                                                   67%

Q23. Please indicate your agreement with the following statements related to your use of the Internet at   Base: At work users (weighted): 2006 (96318)
work (agree net % shown)

2007 Europe Data                                                   www.opa-europe.org                                                               9
European users spend more time on
News and Information sites in 2007
                                                                                                                                                  Chart 2 of 2

       Agreement with statements related to use of internet at work
                                                                                                                              59%
             I often use the Internet to work while I’m at home
                                                                                                                                62%

      Internet news is the main way I keep in touch with local                                                           53%
                      news while I’m at work                                                                                    62%

  I am more likely to navigate deeper into a web site while at                                              37%
                             work                                                                            39%

    Internet sports news is the main way I keep in touch with                                          31%
            sports news and events while I’m at work                                                       33%

                                                                                                                 41%
      I am more involved in the web sites I visit while at work
                                                                                                           32%
                                                                                                                                                        2004
   I tend to spend more time on a web site when I’m at work                                                  38%
                                                                                                                                                        2007
                        than at home                                                                27%

    I spend more time at the office because of my access to                                   20%
                          the Internet                                                        19%

Q23. Please indicate your agreement with the following statements related to your use of the Internet at         Base: At work users (weighted): 2006 (96318)
work (agree net % shown)

2007 Europe Data                                                   www.opa-europe.org                                                                     10
Visiting news and information sites is the number
 one reason European At Work users access the
 Internet                                      Chart 1 of 3
                                               Reasons for accessing the Internet
                                                           At Work Users (%)

                                                                                           From home/school/
                                                                               From work       elsewhere

              News/current events                                                     78           69

              Education/Learning                                                      61           49

              Local or regional information                                           60           62

              Research companies or vendors                                           56           33

              Check weather                                                           51           54
              Research products or services for purchases                             50           56

              Travel planning/reservations                                            47           71

              Other                                                                   44           49

              Customer service/technical support                                      44           43

              Get information on special interest/hobbies                             42           35


Q17. For which of the following reasons do you access the Internet?                           Base: At work (weighted): 2007 (96318)

2007 Europe Data                                                 www.opa-europe.org                                              11
Visiting news and information sites is the
number one reason European At Work users
access the Internet                                                                                                 Chart 2 of 3
                                               Reasons for accessing the Internet
                                                             At Work Users (%)
                                                                                                From
                                                                                            home/school/
                                                                                From work    elsewhere

                  Investment/transactions/online banking                              39         56

                  Buy products or services                                            38         65

                  Entertainment planning (dining, movies, etc.)                       33         68

                  Buy tickets                                                         28         53

                  Get information on sports/check sports scores                       25         35

                  Find/research employment opportunities                              24         38

                  Read blogs or make blog entries                                     23         38

                  Health and health-related information                               20         44

                  Listen to music                                                     19         46
                  Find used goods for purchase (online auctions,
                  classifieds, etc.)                                                  19         40


Q17. For which of the following reasons do you access the Internet?                         Base: At work (weighted): 2007 (96318)

2007 Europe Data                                                 www.opa-europe.org                                            12
Visiting news and information sites is the
number one reason European At Work users
access the Internet                                                                                                 Chart 3 of 3
                                               Reasons for accessing the Internet
                                                             At Work Users (%)
                                                                                                From
                                                                                            home/school/
                                                                                From work    elsewhere
                   Download music/ multimedia files/software
                   utilities                                                          16          55

                   Watch online video                                                 16          41

                   Get information on food and cooking                                15          40

                   Check RSS-feed via RSS-reader                                      14          16

                   Make phone calls (e.g. Skype)                                      12          34

                   Get information on automobiles                                     10          24

                   Home improvement/decorating                                        10          29

                   Online games                                                       8           28

                   Download Podcasting-files                                          7           18

                   Participate in personals/dating services                           5           14

                   Get information on parenting/babies                                5           13
Q17. For which of the following reasons do you access the Internet?                         Base: At work (weighted): 2007 (96318)

2007 Europe Data                                                 www.opa-europe.org                                            13
European users still spend the majority of
  their time on News and Information sites
                                                                                                                                  Chart 1 of 3

                                     Sites visited in a typical week 7-day week
                         At Work Users (%)                                                     Non Work Users (%)
                                                    2007          2004                                               2007         2004
      News                                            82           80            News                                 81           76
      Search engines                                  77            -            Search engines                       71            -
      Weather                                         57           46            Weather                              50           41
      Entertainment planning                          52           37            Entertainment planning               48           42
      Hobbies                                         48           36            Hobbies                              54           44
      Computer / SW                                   47           44            Computer / SW                        46           43
      Travel                                          46           40            Travel                               41           36
      Educational                                     41           31            Educational                          43           37
      Blogs                                           34            -            Blogs                                39            -
      Music                                           31           21            Music                                45           32
      Ticketing services                              35           24            Ticketing services                   34           20
      Radio                                           31           19            Radio                                38           23
                                                                                                          Base: At work (weighted): 2006 (96318)
Q18. Which types of web sites do you typically visit in an average 7-day week?                            Base: Non work (weighted): 2006 (39837)

2007 Europe Data                                                 www.opa-europe.org                                                         14
European users still spend the majority of
their time on News and Information sites
                                                                                                                                    Chart 2 of 3

                                     Sites visited in a typical week 7-day week
                         At Work Users (%)                                                      Non Work Users (%)
                                                    2007          2004                                               2007         2004
      Business News Websites                          37            -            Business News Websites               20            -
      Sports                                          29           24            Sports                               33           26
      Retail shopping                                 30           21            Retail shopping                      25           25
      Financial services                              32           39            Financial services                   19           36
      Popular Culture                                 26           30            Popular Culture                      27           34
      Job listings                                    26           21            Job listings                         28           28
      Food/cooking                                    25           13            Food/cooking                         29           21
      Online auctions                                 25           22            Online auctions                      26           26
      Games                                           21           13            Games                                29           26
      Message boards                                  24           25            Message boards                       21           30
      Electronics                                     24           15            Electronics                          21           19
      Health/Fitness                                  21           16            Health/Fitness                       25           16
      Real Estate                                     16           10            Real Estate                          13           10
                                                                                                          Base: At work (weighted): 2006 (96318)
Q18. Which types of web sites do you typically visit in an average 7-day week?
                                                                                                          Base: Non work (weighted): 2006 (39837)

2007 Europe Data                                                 www.opa-europe.org                                                         15
European users still spend the majority of
their time on News and Information sites
                                                                                                                              Chart 3 of 3

                                     Sites visited in a typical week 7-day week
                         At Work Users (%)                                                     Non Work Users (%)
                                                    2007          2004                                            2007         2004
      Classifieds                                     13            9            Classifieds                       13           12
      Home Improvement                                13            -            Home Improvement                  10            -
      Automobile                                      10           10            Automobile                        14           15
      Dating Services                                 9             9            Dating Services                    7           18
      Parenting/Babies                                7             -            Parenting/Babies                   5            -


                                                                                                       Base: At work (weighted): 2006 (96318)
Q18. Which types of web sites do you typically visit in an average 7-day week?
                                                                                                       Base: Non work (weighted): 2006 (39837)

2007 Europe Data                                                 www.opa-europe.org                                                      16
Media Consumption
                      differences


2007 Europe Data         www.opa-europe.org   17
Internet use has remained stable – and very
   high - amongst European At Work users
      Media usage
                               At Work Users                                               Non Work Users

                                                    97%                                                                  94%
             Internet                                                           Internet
                                                    95%                                                                  94%

                                            69%                                                              67%
                  TV                                                                 TV
                                          64%                                                                  71%

                                            66%                                                          59%
               Radio                                                             Radio
                                          63%                                                            59%

                                         60%                                                            57%
          Magazines                                                         Magazines
                                         58%                                                              61%

                                       53%                                                             54%
         Newspapers                                                       Newspapers
                                      49%                                                          46%
                                                               2007

Q4/6/8/10/12 Did you read any magazines yesterday? Read newspapers? Watch TV?               Base: At work (weighted): 2006 (96318)
Listen to radio? Use internet?                                                              Base: Non work (weighted): 2006 (39837)

2007 Europe Data                                           www.opa-europe.org                                                   18
TV consumption has dropped in Europe
  since 2004, except during primetime
                                                                                                                                Chart 3 of 5

        Total Media Audience by Day Part - At Work Users - TV


        100%

         90%
                                                                                                                        TV 2004
         80%
                                                                                      75%
         70%                                                                          69%
                                                                                                                        TV 2007
         60%

         50%

         40%                                                                                      38%
         30%                                                               29%
                                                   25%                                            25%
         20%                                                   20%
                        16%           15%
                                                   12%                     11%                                   13%
         10%                                                   8%
                        6%            4%                                                                         3%
           0%
                 Morning       Daytime    Daytime II        Early       Early    Primetime Late Fringe Late Night
                6.00 - 9.00   9.00-12.00 12.00-16.30       Fringe     Fringe II 19.00-23.00 23.00-1.00  1.00-6.00
                                                         16.30-18.00 18.00 19.00


Q5. Between which hours did you watch TV yesterday...?                                                  Base: At work (weighted): 2006 (61167)


2007 Europe Data                                            www.opa-europe.org                                                          19
Magazine reading has mainly dropped
 throughout the day in Europe
                                                                                                                             Chart 2 of 5

        Total Media Audience by Day Part - At Work Users - MAGAZINES


 100%
  90%
  80%                                                                                                             Magazines 2004
  70%
  60%
                                                                                                                  Magazines 2007
  50%
  40%                                                                                  41%
                                 37%
  30%                                                                      29%         30%
                  24%            24%            25%
                                                23%
  20%                                                          19%
                  16%                                          16%         16%                    14%
  10%                                                                                             9%             7%
                                                                                                                 2%
   0%
          Morning     Daytime           Daytime II        Early       Early      Primetime Late Fringe Late Night
         6.00 - 9.00 9.00-12.00          12.00-          Fringe      Fringe II     19.00-  23.00-1.00 1.00-6.00
                                         16.30           16.30-       18.00        23.00
                                                         18.00        19.00


Q7. Between which hours did you read magazines yesterday...?                                      Base: At work (weighted): 2006 (56275)


2007 Europe Data                                               www.opa-europe.org                                                     20
Newspaper reading has mainly dropped
 throughout the day in Europe
                                                                                                                                   Chart 4 of 5

        Total Media Audience by Day Part - At Work Users - NEWSPAPERS


     100%
      90%                                                                                                         Newspapers 2004
      80%
      70%                                                                                                         Newspapers 2007
      60%
      50%                           48%
      40%
                     35%            33%
      30%            31%                        23%
                                                                         20%          22%
      20%                                                      17%
                                              22%
                                                                 10%         11%      18%           6%
      10%                                                                                                              8%
       0%                                                                                      3%                      1%

              Morning     Daytime Daytime II               Early        Early      Primetime    Late    Late Night
             6.00 - 9.00 9.00-12.00 12.00-                 Fringe      Fringe II     19.00-    Fringe    1.00-6.00
                                    16.30                  16.30-       18.00        23.00   23.00-1.00
                                                           18.00        19.00


Q9. Between which hours did you read newspaper yesterday...?                                             Base: At work (weighted): 2006 (46780)


2007 Europe Data                                               www.opa-europe.org                                                          21
Radio listening has dropped significantly
 throughout the day in Europe
                                                                                                                                Chart 5 of 5

        Total Media Audience by Day Part - At Work Users - RADIO


       100%
         90%
                                                                                                                       Radio 2004
         80%

         70%
                        66%                                                                                            Radio 2007
         60%
                        54%
         50%
                                       44%
         40%                                                                      38%
                                                                        32%               32%
         30%                           30%             29%
                                                       23%                                21%
         20%                                                            20%       20%
                                                                                                      15%
         10%                                                                                          8%             10%
                                                                                                                     3%
          0%
                 Morning        Daytime    Daytime II           Early       Early    Primetime Late Fringe Late Night
                6.00 - 9.00    9.00-12.00 12.00-16.30          Fringe     Fringe II 19.00-23.00 23.00-1.00 1.00-6.00
                                                             16.30-18.00 18.00 19.00


Q11. Between which hours did you listen to the radio yesterday...?                                   Base: At work (weighted): 2006 (60741)


2007 Europe Data                                                     www.opa-europe.org                                                 22
European Internet use still highest in the
  morning, with a new peak during primetime
                                                                                                                               Chart 1 of 5

        Total Media Audience by Day Part - At Work Users - INTERNET


     100%
       90%                       84%                83%                                                                    Internet 2004
       80%
                                   84%
       70%                                                           68%                                                   Internet 2007
                                                                                              67%
       60%                                        67%                61%
                                                                                46%
       50%
                                                                                              44%
       40%                                                                      46%                   31%
                 31%
       30%
                     37%
       20%                                                                                                        14%
                                                                                                    22%
       10%                                                                                                            10%
        0%
               Morning         Daytime    Daytime II           Early       Early    Primetime Late Fringe Late Night
              6.00 - 9.00     9.00-12.00 12.00-16.30          Fringe     Fringe II 19.00-23.00 23.00-1.00 1.00-6.00
                                                            16.30-18.00 18.00 19.00


Q13. How long did you spend on the Internet (for non-email purposes) yesterday, between...?          Base: At work (weighted): 2006 (91824)


2007 Europe Data                                                www.opa-europe.org                                                     23
Attitudes toward
                   Online Advertising


2007 Europe Data         www.opa-europe.org   24
In 2007, European Internet users still
   notice online advertising At Work
          Location for internet based activities
                                        2004                                                              2007
 Notice advertising                                                         Notice advertising
    for business       28%               44%                25%                for business      28%             44%                 27%
 products/services                                                          products/services

                                                                            Notice advertising
 Notice advertising                                                           for consumer         43%                   45%               12%
   for consumer           39%                   49%               8%        products/services
 products/services

                                                                                Notice online
                                                                                                  37%                   52%                11%
      Notice online                                                              advertising
      advertising        35%                   51%            11%

                                                                                  Make online
                                                                                                         65%                   24%         10%
                                                                                  purchases
       Make online
       purchases                63%                   25%         9%
                                                                          Click on advertising
                                                                                                   44%                   44%               12%
                                                                                  links
Click on advertising
       links              39%                   48%           10%
                                                                           Conduct searches      32%             36%              32%


Q28. Thinking about your typical use of the Internet at work and home, where are you most
                                                                                                        Base: All respondents (weighted): 2006 (136154)
likely to do the following?


2007 Europe Data                                                   www.opa-europe.org                                                              25
European At Work users largely prefer the
 Internet for new product information…
                                                                                                                                           Chart 1 of 4

        Preferences for advertising aspects by media type

                 Where I prefer to receive                                                  Where I prefer to find
                   information about                                                          out about new
                       companies                                                                 products
                                               52%                                                                      48%
              Internet                                                                     Internet
                                             48%                                                                           57%

                               13%                                                                          19%
         Newspapers                                                                 Newspapers
                               14%                                                                     8%

                              10%                                                                           18%
           Magazines                                                                  Magazines
                              11%                                                                           18%

                          3%                                                                           8%
                   TV                                                                           TV
                          4%                                                                           8%

                         1%                                                                           2%
                Radio                                                                        Radio
                         2%                                                                           2%
                                                                 2007

Q26. Please give your impressions of advertising you see on each of the following media.                    Base: At work users (weighted): 2006 (96318)
For each statement select all the media types you think apply

2007 Europe Data                                                 www.opa-europe.org                                                                  26
… and increasingly use online
 advertising to make purchase decisions
                                                                                                                                             Chart 2 of 4

        Preferences for advertising aspects by media type

           Have advertising that is                                                 Have advertising that helps
             rich in information                                                     me to decide what to buy

                                       30%                                                                       25%
              Internet                                                                     Internet
                                       31%                                                                       27%

                                 18%                                                                       11%
         Newspapers                                                                 Newspapers
                                15%                                                                        12%

                                 20%                                                                         19%
           Magazines                                                                  Magazines
                                 20%                                                                        17%

                            7%                                                                             11%
                   TV                                                                           TV
                           5%                                                                          10%

                          4%                                                                          3%
                Radio                                                                        Radio
                          3%                                                                          2%
                                                               2007


Q26. Please give your impressions of advertising you see on each of the following media.                     Base: At work users (weighted): 2006 (96318)


2007 Europe Data                                                 www.opa-europe.org                                                                   27
European At Work users more tolerant
 of online advertising than in 2004…
                                                                                                                                           Chart 3 of 4

        Preferences for advertising aspects by media type
                          Have too much                                            Have advertising I remember
                           advertising                                                   for a long time

                                                53%                                                   8%
               Internet                                                                    Internet
                                          38%                                                         8%

                                   23%                                                                7%
          Newspapers                                                                 Newspapers
                                  21%                                                                 6%

                                        34%                                                            13%
            Magazines                                                                 Magazines
                                         36%                                                          10%

                                                    61%                                                               44%
                    TV                                                                          TV
                                                      68%                                                           40%

                                         35%                                                          10%
                 Radio                                                                       Radio
                                      28%                                                             9%
                                                                     2007


Q26. Please give your impressions of advertising you see on each of the following media.                   Base: At work users (weighted): 2006 (96318)


2007 Europe Data                                                 www.opa-europe.org                                                                 28
European At Work users find online
  advertising more interesting than any other
                                                                                                                            Chart 4 of 4

   Preferences for advertising aspects by media type

                                                   Have interesting
                                                     advertising

                                                                      19%
                                                   Internet
                                                                        22%

                                                                   11%
                                              Newspapers
                                                                  10%

                                                                       21%
                                                Magazines
                                                                       21%

                                                                         27%               2007
                                                         TV
                                                                      20%

                                                                 8%
                                                     Radio
                                                                 6%


Q26. Please give your impressions of advertising you see on each of the following media.    Base: At work users (weighted): 2006 (96318)


2007 Europe Data                                                 www.opa-europe.org                                                  29
Conclusions – online advertising reaches
 a high potential client base At Work

 • Media consumption habits have definitively
   changed – Internet now dominates daytime
   AND primetime media consumption in Europe

 • Visiting news and information sites is the
   number one reason European “At Work” users
   access the Internet

 • Internet advertising considered the most
   innovative, informative and relevant

2007 Europe Data      www.opa-europe.org        30
Notes on Methodology


   • Study conducted online on several OPA Europe member
     websites between June 2006 and January 2007
   • More than 7000 responses were analysed across
     Europe
   • Data from respondents residing outside the 6 countries
     polled – France, Germany, Italy, Spain, Switzerland and
     the UK– were not used
   _______________________________________
             When reproducing results, please cite your source as
       “OPA Europe Internet Use At Work Media Consumption Study 2007”
                                     (NB: Switzerland was not included in the 2004 study)


2007 Europe Data                 www.opa-europe.org                                         31
For more information on the
           Internet At Work Media Consumption
                     study, please visit
                    www.opa-europe.org


2007 Europe Data        www.opa-europe.org      32

More Related Content

What's hot

Cimigo NetCitizens 2012 (English)
Cimigo NetCitizens 2012 (English)Cimigo NetCitizens 2012 (English)
Cimigo NetCitizens 2012 (English)Toan Bach Quang Bao
 
Nghiên cứu Người dùng Internet Việt Nam 2012
Nghiên cứu Người dùng Internet Việt Nam 2012Nghiên cứu Người dùng Internet Việt Nam 2012
Nghiên cứu Người dùng Internet Việt Nam 2012ISC Marketing Corporation
 
Cimigo net citizens 2012
Cimigo net citizens 2012Cimigo net citizens 2012
Cimigo net citizens 2012Duong The Vinh
 
Cimigo net citizens-2012
Cimigo net citizens-2012Cimigo net citizens-2012
Cimigo net citizens-2012Bui Hang
 
Net Citizens in Vietnam 2012 (Cimigo)
Net Citizens in Vietnam 2012 (Cimigo)Net Citizens in Vietnam 2012 (Cimigo)
Net Citizens in Vietnam 2012 (Cimigo)Maple Aikon
 
Ipsos MORI: Best Party on Key Issues: September 2012
Ipsos MORI: Best Party on Key Issues: September 2012Ipsos MORI: Best Party on Key Issues: September 2012
Ipsos MORI: Best Party on Key Issues: September 2012Ipsos UK
 
China, Rethink - Why China needs to rethink its modern 'Journey to the West'
China, Rethink - Why China needs to rethink its modern 'Journey to the West'China, Rethink - Why China needs to rethink its modern 'Journey to the West'
China, Rethink - Why China needs to rethink its modern 'Journey to the West'Morry Morgan
 
Uk C-Suite presentation
Uk C-Suite presentationUk C-Suite presentation
Uk C-Suite presentationChris Elder
 
C Suite Media Consumption Habits: Business Elite 2012 results
C Suite Media Consumption Habits: Business Elite 2012 results C Suite Media Consumption Habits: Business Elite 2012 results
C Suite Media Consumption Habits: Business Elite 2012 results Mark Treacy
 

What's hot (11)

Cimigo NetCitizens 2012 (English)
Cimigo NetCitizens 2012 (English)Cimigo NetCitizens 2012 (English)
Cimigo NetCitizens 2012 (English)
 
Nghiên cứu Người dùng Internet Việt Nam 2012
Nghiên cứu Người dùng Internet Việt Nam 2012Nghiên cứu Người dùng Internet Việt Nam 2012
Nghiên cứu Người dùng Internet Việt Nam 2012
 
Cimigo net citizens 2012
Cimigo net citizens 2012Cimigo net citizens 2012
Cimigo net citizens 2012
 
Cimigo net citizens-2012
Cimigo net citizens-2012Cimigo net citizens-2012
Cimigo net citizens-2012
 
Net Citizens in Vietnam 2012 (Cimigo)
Net Citizens in Vietnam 2012 (Cimigo)Net Citizens in Vietnam 2012 (Cimigo)
Net Citizens in Vietnam 2012 (Cimigo)
 
Vietnam NetCitizens 2012 (Cimigo)
Vietnam NetCitizens 2012 (Cimigo)Vietnam NetCitizens 2012 (Cimigo)
Vietnam NetCitizens 2012 (Cimigo)
 
Cimigo net citizens-2012
Cimigo net citizens-2012Cimigo net citizens-2012
Cimigo net citizens-2012
 
Ipsos MORI: Best Party on Key Issues: September 2012
Ipsos MORI: Best Party on Key Issues: September 2012Ipsos MORI: Best Party on Key Issues: September 2012
Ipsos MORI: Best Party on Key Issues: September 2012
 
China, Rethink - Why China needs to rethink its modern 'Journey to the West'
China, Rethink - Why China needs to rethink its modern 'Journey to the West'China, Rethink - Why China needs to rethink its modern 'Journey to the West'
China, Rethink - Why China needs to rethink its modern 'Journey to the West'
 
Uk C-Suite presentation
Uk C-Suite presentationUk C-Suite presentation
Uk C-Suite presentation
 
C Suite Media Consumption Habits: Business Elite 2012 results
C Suite Media Consumption Habits: Business Elite 2012 results C Suite Media Consumption Habits: Business Elite 2012 results
C Suite Media Consumption Habits: Business Elite 2012 results
 

Viewers also liked

Don’t Go It Alone: Using Collaboration to Solve Creative Design Problems
Don’t Go It Alone: Using Collaboration to Solve Creative Design ProblemsDon’t Go It Alone: Using Collaboration to Solve Creative Design Problems
Don’t Go It Alone: Using Collaboration to Solve Creative Design ProblemsAutodesk
 
Google Web Toolkit (GWT)
Google Web Toolkit (GWT)Google Web Toolkit (GWT)
Google Web Toolkit (GWT)Hacen Dadda
 
Computer English
Computer EnglishComputer English
Computer EnglishWTCCaec
 
SME's in Laos
SME's in LaosSME's in Laos
SME's in Laoslaoplanet
 
digital marketing
digital marketingdigital marketing
digital marketingpravin koli
 

Viewers also liked (6)

Don’t Go It Alone: Using Collaboration to Solve Creative Design Problems
Don’t Go It Alone: Using Collaboration to Solve Creative Design ProblemsDon’t Go It Alone: Using Collaboration to Solve Creative Design Problems
Don’t Go It Alone: Using Collaboration to Solve Creative Design Problems
 
Google Web Toolkit (GWT)
Google Web Toolkit (GWT)Google Web Toolkit (GWT)
Google Web Toolkit (GWT)
 
Grade 8, Lesson 3: Graphics
Grade 8, Lesson 3: GraphicsGrade 8, Lesson 3: Graphics
Grade 8, Lesson 3: Graphics
 
Computer English
Computer EnglishComputer English
Computer English
 
SME's in Laos
SME's in LaosSME's in Laos
SME's in Laos
 
digital marketing
digital marketingdigital marketing
digital marketing
 

Similar to Internet at work

How Social are Social Media Audiences Really
How Social are Social Media Audiences ReallyHow Social are Social Media Audiences Really
How Social are Social Media Audiences ReallyKeller Fay Group
 
Online Reputation in a Connected World
Online Reputation in a Connected WorldOnline Reputation in a Connected World
Online Reputation in a Connected WorldNick Braak
 
Data Privacy Day Online Reputation Research
Data Privacy Day Online Reputation ResearchData Privacy Day Online Reputation Research
Data Privacy Day Online Reputation ResearchElizabeth Lupfer
 
Client Event Presentation Norway 2011
Client Event Presentation Norway 2011Client Event Presentation Norway 2011
Client Event Presentation Norway 2011Alexander Hagen
 
Keller fay conde nast arf paper 3 24-10
Keller fay conde nast arf paper 3 24-10Keller fay conde nast arf paper 3 24-10
Keller fay conde nast arf paper 3 24-10gsweeton
 
Return on Influence: From Buzz to Buy
Return on Influence: From Buzz to BuyReturn on Influence: From Buzz to Buy
Return on Influence: From Buzz to BuyKeller Fay Group
 
Connecting and Engaging Customers Through Social Media - John Fetto
Connecting and Engaging Customers Through Social Media - John FettoConnecting and Engaging Customers Through Social Media - John Fetto
Connecting and Engaging Customers Through Social Media - John FettoSFIMA
 
Pew internet older adults and social media
Pew internet   older adults and social mediaPew internet   older adults and social media
Pew internet older adults and social media24x7 COMUNICAÇÃO
 
Pew internet older adults and social media
Pew internet   older adults and social mediaPew internet   older adults and social media
Pew internet older adults and social mediaSumit Roy
 
Bazaarvoice - The Conversation Index, Volume 2
Bazaarvoice - The Conversation Index, Volume 2Bazaarvoice - The Conversation Index, Volume 2
Bazaarvoice - The Conversation Index, Volume 2Brett Hurt
 
Bazaarvoice Conversation Index Volume 2
Bazaarvoice Conversation Index Volume 2Bazaarvoice Conversation Index Volume 2
Bazaarvoice Conversation Index Volume 2Erin Mulligan Nelson
 
The Conversation Index - Q3 Insights
The Conversation Index - Q3 InsightsThe Conversation Index - Q3 Insights
The Conversation Index - Q3 InsightsBazaarvoice
 
Conversation Index: Mapping the Value of the Social World by Bazaar Voice
Conversation Index: Mapping the Value of the Social World by Bazaar VoiceConversation Index: Mapping the Value of the Social World by Bazaar Voice
Conversation Index: Mapping the Value of the Social World by Bazaar VoiceWaqar Riaz
 
How youth connect on social media?
How youth connect on social media?How youth connect on social media?
How youth connect on social media?Simon Schnetzer
 
To Go or Not to Go Social? A Strategic Approach to Social Media
To Go or Not to Go Social? A Strategic Approach to Social MediaTo Go or Not to Go Social? A Strategic Approach to Social Media
To Go or Not to Go Social? A Strategic Approach to Social MediaGeorgia Zouni
 
The Conversation Index - Germany
The Conversation Index - GermanyThe Conversation Index - Germany
The Conversation Index - GermanyBazaarvoice
 
Mis tue 1000 david gill
Mis tue 1000 david gillMis tue 1000 david gill
Mis tue 1000 david gillMediaPost
 
Eclipse survey 2012 report [final]
Eclipse survey 2012 report [final]Eclipse survey 2012 report [final]
Eclipse survey 2012 report [final]Ian Skerrett
 

Similar to Internet at work (20)

How Social are Social Media Audiences Really
How Social are Social Media Audiences ReallyHow Social are Social Media Audiences Really
How Social are Social Media Audiences Really
 
How Social Are Social Media Audiences, Really?
How Social Are Social Media Audiences, Really? How Social Are Social Media Audiences, Really?
How Social Are Social Media Audiences, Really?
 
Online Reputation in a Connected World
Online Reputation in a Connected WorldOnline Reputation in a Connected World
Online Reputation in a Connected World
 
Data Privacy Day Online Reputation Research
Data Privacy Day Online Reputation ResearchData Privacy Day Online Reputation Research
Data Privacy Day Online Reputation Research
 
Client Event Presentation Norway 2011
Client Event Presentation Norway 2011Client Event Presentation Norway 2011
Client Event Presentation Norway 2011
 
Keller fay conde nast arf paper 3 24-10
Keller fay conde nast arf paper 3 24-10Keller fay conde nast arf paper 3 24-10
Keller fay conde nast arf paper 3 24-10
 
Return on Influence: From Buzz to Buy
Return on Influence: From Buzz to BuyReturn on Influence: From Buzz to Buy
Return on Influence: From Buzz to Buy
 
Présentation 2nd screen_public
Présentation 2nd screen_publicPrésentation 2nd screen_public
Présentation 2nd screen_public
 
Connecting and Engaging Customers Through Social Media - John Fetto
Connecting and Engaging Customers Through Social Media - John FettoConnecting and Engaging Customers Through Social Media - John Fetto
Connecting and Engaging Customers Through Social Media - John Fetto
 
Pew internet older adults and social media
Pew internet   older adults and social mediaPew internet   older adults and social media
Pew internet older adults and social media
 
Pew internet older adults and social media
Pew internet   older adults and social mediaPew internet   older adults and social media
Pew internet older adults and social media
 
Bazaarvoice - The Conversation Index, Volume 2
Bazaarvoice - The Conversation Index, Volume 2Bazaarvoice - The Conversation Index, Volume 2
Bazaarvoice - The Conversation Index, Volume 2
 
Bazaarvoice Conversation Index Volume 2
Bazaarvoice Conversation Index Volume 2Bazaarvoice Conversation Index Volume 2
Bazaarvoice Conversation Index Volume 2
 
The Conversation Index - Q3 Insights
The Conversation Index - Q3 InsightsThe Conversation Index - Q3 Insights
The Conversation Index - Q3 Insights
 
Conversation Index: Mapping the Value of the Social World by Bazaar Voice
Conversation Index: Mapping the Value of the Social World by Bazaar VoiceConversation Index: Mapping the Value of the Social World by Bazaar Voice
Conversation Index: Mapping the Value of the Social World by Bazaar Voice
 
How youth connect on social media?
How youth connect on social media?How youth connect on social media?
How youth connect on social media?
 
To Go or Not to Go Social? A Strategic Approach to Social Media
To Go or Not to Go Social? A Strategic Approach to Social MediaTo Go or Not to Go Social? A Strategic Approach to Social Media
To Go or Not to Go Social? A Strategic Approach to Social Media
 
The Conversation Index - Germany
The Conversation Index - GermanyThe Conversation Index - Germany
The Conversation Index - Germany
 
Mis tue 1000 david gill
Mis tue 1000 david gillMis tue 1000 david gill
Mis tue 1000 david gill
 
Eclipse survey 2012 report [final]
Eclipse survey 2012 report [final]Eclipse survey 2012 report [final]
Eclipse survey 2012 report [final]
 

More from innovActing

LE NUOVE STRATEGIE DI RELAZIONE ONLINE E MOBILE CON I TURISTI: QUALI OPPORTU...
LE NUOVE STRATEGIE DI RELAZIONE  ONLINE E MOBILE CON I TURISTI: QUALI OPPORTU...LE NUOVE STRATEGIE DI RELAZIONE  ONLINE E MOBILE CON I TURISTI: QUALI OPPORTU...
LE NUOVE STRATEGIE DI RELAZIONE ONLINE E MOBILE CON I TURISTI: QUALI OPPORTU...innovActing
 
Tourist Experience Design: recensione di Laura Gemini
Tourist Experience Design: recensione di Laura GeminiTourist Experience Design: recensione di Laura Gemini
Tourist Experience Design: recensione di Laura GeminiinnovActing
 
Dalla conservazione alla valorizzazione dei beni culturali attraverso il Tour...
Dalla conservazione alla valorizzazione dei beni culturali attraverso il Tour...Dalla conservazione alla valorizzazione dei beni culturali attraverso il Tour...
Dalla conservazione alla valorizzazione dei beni culturali attraverso il Tour...innovActing
 
Destination Experience Design & Meeting Industry rimini luglio 2011
Destination Experience Design & Meeting Industry  rimini   luglio 2011Destination Experience Design & Meeting Industry  rimini   luglio 2011
Destination Experience Design & Meeting Industry rimini luglio 2011innovActing
 
I driver competitivi della meeting industry
I driver competitivi della meeting industryI driver competitivi della meeting industry
I driver competitivi della meeting industryinnovActing
 
Tourist Experience Design - Università Bicocca 16 Novembre 2011
Tourist Experience Design - Università   Bicocca 16 Novembre 2011Tourist Experience Design - Università   Bicocca 16 Novembre 2011
Tourist Experience Design - Università Bicocca 16 Novembre 2011innovActing
 
Tourist Experience Design
Tourist Experience DesignTourist Experience Design
Tourist Experience DesigninnovActing
 
La progettazione degli ecosistemi turistici esperienziali -bicocca - 16.11....
La  progettazione degli  ecosistemi turistici esperienziali -bicocca - 16.11....La  progettazione degli  ecosistemi turistici esperienziali -bicocca - 16.11....
La progettazione degli ecosistemi turistici esperienziali -bicocca - 16.11....innovActing
 
Destinazioni e comunicazione dell'esperienza turistica
Destinazioni e comunicazione dell'esperienza turisticaDestinazioni e comunicazione dell'esperienza turistica
Destinazioni e comunicazione dell'esperienza turisticainnovActing
 
Summit del marketing e della comunicazione turistica bit 2011 maurizio goetz
Summit del marketing e della comunicazione turistica bit 2011 maurizio goetzSummit del marketing e della comunicazione turistica bit 2011 maurizio goetz
Summit del marketing e della comunicazione turistica bit 2011 maurizio goetzinnovActing
 
Summit del Turismo delle Regioni a Vicenza Novembre 2010
Summit del Turismo delle Regioni a Vicenza Novembre 2010Summit del Turismo delle Regioni a Vicenza Novembre 2010
Summit del Turismo delle Regioni a Vicenza Novembre 2010innovActing
 
From Cool to Good
From Cool to GoodFrom Cool to Good
From Cool to GoodinnovActing
 
A Rossi Reti Di Imprese Bicocca 02 02 2010 Rev 2
A  Rossi   Reti Di Imprese  Bicocca   02 02 2010   Rev 2A  Rossi   Reti Di Imprese  Bicocca   02 02 2010   Rev 2
A Rossi Reti Di Imprese Bicocca 02 02 2010 Rev 2innovActing
 
Comunicare è Facile, Farsi capire è un'impresa
Comunicare è Facile, Farsi capire è un'impresaComunicare è Facile, Farsi capire è un'impresa
Comunicare è Facile, Farsi capire è un'impresainnovActing
 
L'azienda diventa Customer Driven?
L'azienda diventa Customer Driven?L'azienda diventa Customer Driven?
L'azienda diventa Customer Driven?innovActing
 
Mtm Iulm Web 2 0 Tourism
Mtm Iulm Web 2 0 TourismMtm Iulm Web 2 0 Tourism
Mtm Iulm Web 2 0 TourisminnovActing
 
Knowledge Governance IULM - 2
 Knowledge Governance IULM - 2 Knowledge Governance IULM - 2
Knowledge Governance IULM - 2innovActing
 
Knowledge Governance IULM - 3
Knowledge Governance IULM - 3Knowledge Governance IULM - 3
Knowledge Governance IULM - 3innovActing
 

More from innovActing (20)

LE NUOVE STRATEGIE DI RELAZIONE ONLINE E MOBILE CON I TURISTI: QUALI OPPORTU...
LE NUOVE STRATEGIE DI RELAZIONE  ONLINE E MOBILE CON I TURISTI: QUALI OPPORTU...LE NUOVE STRATEGIE DI RELAZIONE  ONLINE E MOBILE CON I TURISTI: QUALI OPPORTU...
LE NUOVE STRATEGIE DI RELAZIONE ONLINE E MOBILE CON I TURISTI: QUALI OPPORTU...
 
Tourist Experience Design: recensione di Laura Gemini
Tourist Experience Design: recensione di Laura GeminiTourist Experience Design: recensione di Laura Gemini
Tourist Experience Design: recensione di Laura Gemini
 
Dalla conservazione alla valorizzazione dei beni culturali attraverso il Tour...
Dalla conservazione alla valorizzazione dei beni culturali attraverso il Tour...Dalla conservazione alla valorizzazione dei beni culturali attraverso il Tour...
Dalla conservazione alla valorizzazione dei beni culturali attraverso il Tour...
 
Destination Experience Design & Meeting Industry rimini luglio 2011
Destination Experience Design & Meeting Industry  rimini   luglio 2011Destination Experience Design & Meeting Industry  rimini   luglio 2011
Destination Experience Design & Meeting Industry rimini luglio 2011
 
I driver competitivi della meeting industry
I driver competitivi della meeting industryI driver competitivi della meeting industry
I driver competitivi della meeting industry
 
Tourist Experience Design - Università Bicocca 16 Novembre 2011
Tourist Experience Design - Università   Bicocca 16 Novembre 2011Tourist Experience Design - Università   Bicocca 16 Novembre 2011
Tourist Experience Design - Università Bicocca 16 Novembre 2011
 
Tourist Experience Design
Tourist Experience DesignTourist Experience Design
Tourist Experience Design
 
10 pensierini
10 pensierini10 pensierini
10 pensierini
 
La progettazione degli ecosistemi turistici esperienziali -bicocca - 16.11....
La  progettazione degli  ecosistemi turistici esperienziali -bicocca - 16.11....La  progettazione degli  ecosistemi turistici esperienziali -bicocca - 16.11....
La progettazione degli ecosistemi turistici esperienziali -bicocca - 16.11....
 
Destinazioni e comunicazione dell'esperienza turistica
Destinazioni e comunicazione dell'esperienza turisticaDestinazioni e comunicazione dell'esperienza turistica
Destinazioni e comunicazione dell'esperienza turistica
 
Summit del marketing e della comunicazione turistica bit 2011 maurizio goetz
Summit del marketing e della comunicazione turistica bit 2011 maurizio goetzSummit del marketing e della comunicazione turistica bit 2011 maurizio goetz
Summit del marketing e della comunicazione turistica bit 2011 maurizio goetz
 
Summit del Turismo delle Regioni a Vicenza Novembre 2010
Summit del Turismo delle Regioni a Vicenza Novembre 2010Summit del Turismo delle Regioni a Vicenza Novembre 2010
Summit del Turismo delle Regioni a Vicenza Novembre 2010
 
From Cool to Good
From Cool to GoodFrom Cool to Good
From Cool to Good
 
Raffaella Caso
Raffaella CasoRaffaella Caso
Raffaella Caso
 
A Rossi Reti Di Imprese Bicocca 02 02 2010 Rev 2
A  Rossi   Reti Di Imprese  Bicocca   02 02 2010   Rev 2A  Rossi   Reti Di Imprese  Bicocca   02 02 2010   Rev 2
A Rossi Reti Di Imprese Bicocca 02 02 2010 Rev 2
 
Comunicare è Facile, Farsi capire è un'impresa
Comunicare è Facile, Farsi capire è un'impresaComunicare è Facile, Farsi capire è un'impresa
Comunicare è Facile, Farsi capire è un'impresa
 
L'azienda diventa Customer Driven?
L'azienda diventa Customer Driven?L'azienda diventa Customer Driven?
L'azienda diventa Customer Driven?
 
Mtm Iulm Web 2 0 Tourism
Mtm Iulm Web 2 0 TourismMtm Iulm Web 2 0 Tourism
Mtm Iulm Web 2 0 Tourism
 
Knowledge Governance IULM - 2
 Knowledge Governance IULM - 2 Knowledge Governance IULM - 2
Knowledge Governance IULM - 2
 
Knowledge Governance IULM - 3
Knowledge Governance IULM - 3Knowledge Governance IULM - 3
Knowledge Governance IULM - 3
 

Recently uploaded

8447779800, Low rate Call girls in Shivaji Enclave Delhi NCR
8447779800, Low rate Call girls in Shivaji Enclave Delhi NCR8447779800, Low rate Call girls in Shivaji Enclave Delhi NCR
8447779800, Low rate Call girls in Shivaji Enclave Delhi NCRashishs7044
 
Call Girls In Connaught Place Delhi ❤️88604**77959_Russian 100% Genuine Escor...
Call Girls In Connaught Place Delhi ❤️88604**77959_Russian 100% Genuine Escor...Call Girls In Connaught Place Delhi ❤️88604**77959_Russian 100% Genuine Escor...
Call Girls In Connaught Place Delhi ❤️88604**77959_Russian 100% Genuine Escor...lizamodels9
 
Organizational Structure Running A Successful Business
Organizational Structure Running A Successful BusinessOrganizational Structure Running A Successful Business
Organizational Structure Running A Successful BusinessSeta Wicaksana
 
Independent Call Girls Andheri Nightlaila 9967584737
Independent Call Girls Andheri Nightlaila 9967584737Independent Call Girls Andheri Nightlaila 9967584737
Independent Call Girls Andheri Nightlaila 9967584737Riya Pathan
 
2024 Numerator Consumer Study of Cannabis Usage
2024 Numerator Consumer Study of Cannabis Usage2024 Numerator Consumer Study of Cannabis Usage
2024 Numerator Consumer Study of Cannabis UsageNeil Kimberley
 
Contemporary Economic Issues Facing the Filipino Entrepreneur (1).pptx
Contemporary Economic Issues Facing the Filipino Entrepreneur (1).pptxContemporary Economic Issues Facing the Filipino Entrepreneur (1).pptx
Contemporary Economic Issues Facing the Filipino Entrepreneur (1).pptxMarkAnthonyAurellano
 
Marketplace and Quality Assurance Presentation - Vincent Chirchir
Marketplace and Quality Assurance Presentation - Vincent ChirchirMarketplace and Quality Assurance Presentation - Vincent Chirchir
Marketplace and Quality Assurance Presentation - Vincent Chirchirictsugar
 
Call Girls In Sikandarpur Gurgaon ❤️8860477959_Russian 100% Genuine Escorts I...
Call Girls In Sikandarpur Gurgaon ❤️8860477959_Russian 100% Genuine Escorts I...Call Girls In Sikandarpur Gurgaon ❤️8860477959_Russian 100% Genuine Escorts I...
Call Girls In Sikandarpur Gurgaon ❤️8860477959_Russian 100% Genuine Escorts I...lizamodels9
 
Case study on tata clothing brand zudio in detail
Case study on tata clothing brand zudio in detailCase study on tata clothing brand zudio in detail
Case study on tata clothing brand zudio in detailAriel592675
 
Lowrate Call Girls In Sector 18 Noida ❤️8860477959 Escorts 100% Genuine Servi...
Lowrate Call Girls In Sector 18 Noida ❤️8860477959 Escorts 100% Genuine Servi...Lowrate Call Girls In Sector 18 Noida ❤️8860477959 Escorts 100% Genuine Servi...
Lowrate Call Girls In Sector 18 Noida ❤️8860477959 Escorts 100% Genuine Servi...lizamodels9
 
Intro to BCG's Carbon Emissions Benchmark_vF.pdf
Intro to BCG's Carbon Emissions Benchmark_vF.pdfIntro to BCG's Carbon Emissions Benchmark_vF.pdf
Intro to BCG's Carbon Emissions Benchmark_vF.pdfpollardmorgan
 
Kenya’s Coconut Value Chain by Gatsby Africa
Kenya’s Coconut Value Chain by Gatsby AfricaKenya’s Coconut Value Chain by Gatsby Africa
Kenya’s Coconut Value Chain by Gatsby Africaictsugar
 
Pitch Deck Teardown: Geodesic.Life's $500k Pre-seed deck
Pitch Deck Teardown: Geodesic.Life's $500k Pre-seed deckPitch Deck Teardown: Geodesic.Life's $500k Pre-seed deck
Pitch Deck Teardown: Geodesic.Life's $500k Pre-seed deckHajeJanKamps
 
Buy gmail accounts.pdf Buy Old Gmail Accounts
Buy gmail accounts.pdf Buy Old Gmail AccountsBuy gmail accounts.pdf Buy Old Gmail Accounts
Buy gmail accounts.pdf Buy Old Gmail AccountsBuy Verified Accounts
 
Call Us 📲8800102216📞 Call Girls In DLF City Gurgaon
Call Us 📲8800102216📞 Call Girls In DLF City GurgaonCall Us 📲8800102216📞 Call Girls In DLF City Gurgaon
Call Us 📲8800102216📞 Call Girls In DLF City Gurgaoncallgirls2057
 
8447779800, Low rate Call girls in Saket Delhi NCR
8447779800, Low rate Call girls in Saket Delhi NCR8447779800, Low rate Call girls in Saket Delhi NCR
8447779800, Low rate Call girls in Saket Delhi NCRashishs7044
 
Marketing Management Business Plan_My Sweet Creations
Marketing Management Business Plan_My Sweet CreationsMarketing Management Business Plan_My Sweet Creations
Marketing Management Business Plan_My Sweet Creationsnakalysalcedo61
 
BEST Call Girls In Greater Noida ✨ 9773824855 ✨ Escorts Service In Delhi Ncr,
BEST Call Girls In Greater Noida ✨ 9773824855 ✨ Escorts Service In Delhi Ncr,BEST Call Girls In Greater Noida ✨ 9773824855 ✨ Escorts Service In Delhi Ncr,
BEST Call Girls In Greater Noida ✨ 9773824855 ✨ Escorts Service In Delhi Ncr,noida100girls
 
Lean: From Theory to Practice — One City’s (and Library’s) Lean Story… Abridged
Lean: From Theory to Practice — One City’s (and Library’s) Lean Story… AbridgedLean: From Theory to Practice — One City’s (and Library’s) Lean Story… Abridged
Lean: From Theory to Practice — One City’s (and Library’s) Lean Story… AbridgedKaiNexus
 
(Best) ENJOY Call Girls in Faridabad Ex | 8377087607
(Best) ENJOY Call Girls in Faridabad Ex | 8377087607(Best) ENJOY Call Girls in Faridabad Ex | 8377087607
(Best) ENJOY Call Girls in Faridabad Ex | 8377087607dollysharma2066
 

Recently uploaded (20)

8447779800, Low rate Call girls in Shivaji Enclave Delhi NCR
8447779800, Low rate Call girls in Shivaji Enclave Delhi NCR8447779800, Low rate Call girls in Shivaji Enclave Delhi NCR
8447779800, Low rate Call girls in Shivaji Enclave Delhi NCR
 
Call Girls In Connaught Place Delhi ❤️88604**77959_Russian 100% Genuine Escor...
Call Girls In Connaught Place Delhi ❤️88604**77959_Russian 100% Genuine Escor...Call Girls In Connaught Place Delhi ❤️88604**77959_Russian 100% Genuine Escor...
Call Girls In Connaught Place Delhi ❤️88604**77959_Russian 100% Genuine Escor...
 
Organizational Structure Running A Successful Business
Organizational Structure Running A Successful BusinessOrganizational Structure Running A Successful Business
Organizational Structure Running A Successful Business
 
Independent Call Girls Andheri Nightlaila 9967584737
Independent Call Girls Andheri Nightlaila 9967584737Independent Call Girls Andheri Nightlaila 9967584737
Independent Call Girls Andheri Nightlaila 9967584737
 
2024 Numerator Consumer Study of Cannabis Usage
2024 Numerator Consumer Study of Cannabis Usage2024 Numerator Consumer Study of Cannabis Usage
2024 Numerator Consumer Study of Cannabis Usage
 
Contemporary Economic Issues Facing the Filipino Entrepreneur (1).pptx
Contemporary Economic Issues Facing the Filipino Entrepreneur (1).pptxContemporary Economic Issues Facing the Filipino Entrepreneur (1).pptx
Contemporary Economic Issues Facing the Filipino Entrepreneur (1).pptx
 
Marketplace and Quality Assurance Presentation - Vincent Chirchir
Marketplace and Quality Assurance Presentation - Vincent ChirchirMarketplace and Quality Assurance Presentation - Vincent Chirchir
Marketplace and Quality Assurance Presentation - Vincent Chirchir
 
Call Girls In Sikandarpur Gurgaon ❤️8860477959_Russian 100% Genuine Escorts I...
Call Girls In Sikandarpur Gurgaon ❤️8860477959_Russian 100% Genuine Escorts I...Call Girls In Sikandarpur Gurgaon ❤️8860477959_Russian 100% Genuine Escorts I...
Call Girls In Sikandarpur Gurgaon ❤️8860477959_Russian 100% Genuine Escorts I...
 
Case study on tata clothing brand zudio in detail
Case study on tata clothing brand zudio in detailCase study on tata clothing brand zudio in detail
Case study on tata clothing brand zudio in detail
 
Lowrate Call Girls In Sector 18 Noida ❤️8860477959 Escorts 100% Genuine Servi...
Lowrate Call Girls In Sector 18 Noida ❤️8860477959 Escorts 100% Genuine Servi...Lowrate Call Girls In Sector 18 Noida ❤️8860477959 Escorts 100% Genuine Servi...
Lowrate Call Girls In Sector 18 Noida ❤️8860477959 Escorts 100% Genuine Servi...
 
Intro to BCG's Carbon Emissions Benchmark_vF.pdf
Intro to BCG's Carbon Emissions Benchmark_vF.pdfIntro to BCG's Carbon Emissions Benchmark_vF.pdf
Intro to BCG's Carbon Emissions Benchmark_vF.pdf
 
Kenya’s Coconut Value Chain by Gatsby Africa
Kenya’s Coconut Value Chain by Gatsby AfricaKenya’s Coconut Value Chain by Gatsby Africa
Kenya’s Coconut Value Chain by Gatsby Africa
 
Pitch Deck Teardown: Geodesic.Life's $500k Pre-seed deck
Pitch Deck Teardown: Geodesic.Life's $500k Pre-seed deckPitch Deck Teardown: Geodesic.Life's $500k Pre-seed deck
Pitch Deck Teardown: Geodesic.Life's $500k Pre-seed deck
 
Buy gmail accounts.pdf Buy Old Gmail Accounts
Buy gmail accounts.pdf Buy Old Gmail AccountsBuy gmail accounts.pdf Buy Old Gmail Accounts
Buy gmail accounts.pdf Buy Old Gmail Accounts
 
Call Us 📲8800102216📞 Call Girls In DLF City Gurgaon
Call Us 📲8800102216📞 Call Girls In DLF City GurgaonCall Us 📲8800102216📞 Call Girls In DLF City Gurgaon
Call Us 📲8800102216📞 Call Girls In DLF City Gurgaon
 
8447779800, Low rate Call girls in Saket Delhi NCR
8447779800, Low rate Call girls in Saket Delhi NCR8447779800, Low rate Call girls in Saket Delhi NCR
8447779800, Low rate Call girls in Saket Delhi NCR
 
Marketing Management Business Plan_My Sweet Creations
Marketing Management Business Plan_My Sweet CreationsMarketing Management Business Plan_My Sweet Creations
Marketing Management Business Plan_My Sweet Creations
 
BEST Call Girls In Greater Noida ✨ 9773824855 ✨ Escorts Service In Delhi Ncr,
BEST Call Girls In Greater Noida ✨ 9773824855 ✨ Escorts Service In Delhi Ncr,BEST Call Girls In Greater Noida ✨ 9773824855 ✨ Escorts Service In Delhi Ncr,
BEST Call Girls In Greater Noida ✨ 9773824855 ✨ Escorts Service In Delhi Ncr,
 
Lean: From Theory to Practice — One City’s (and Library’s) Lean Story… Abridged
Lean: From Theory to Practice — One City’s (and Library’s) Lean Story… AbridgedLean: From Theory to Practice — One City’s (and Library’s) Lean Story… Abridged
Lean: From Theory to Practice — One City’s (and Library’s) Lean Story… Abridged
 
(Best) ENJOY Call Girls in Faridabad Ex | 8377087607
(Best) ENJOY Call Girls in Faridabad Ex | 8377087607(Best) ENJOY Call Girls in Faridabad Ex | 8377087607
(Best) ENJOY Call Girls in Faridabad Ex | 8377087607
 

Internet at work

  • 1. Internet Access At Work A Media Consumption study Results for Europe 2006/2007 (Wave 2) Conducted by SKOPOS market insight (Wave 1 completed in 2004) 2007 Europe Data www.opa-europe.org 1
  • 2. Two types of Internet users were queried for this study At Work Internet Users Accessed Internet from work within past 30 days for non-email purposes Non-work Internet Users Accessed Internet from home, school or elsewhere – but not work – within past 30 days 2007 Europe Data www.opa-europe.org 2
  • 3. At work users from 6 countries were polled for this research UK France 21% 17% Switzerland 3% Spain 13% Germany 29% Italy 17% Base: All respondents (weighted): 2006 (136154) 2007 Europe Data www.opa-europe.org 3
  • 4. Demographics Europe www.opa-europe.org
  • 5. At Work Users in Europe are mostly male, over 35 and very highly educated Demographics 55+ 18-24 15% 16% At Work Non Work % % Male 58 53 45-54 Female 42 47 19% 18-34 39 43 25-34 25% 35+ 62 56 Univ.+ 75 64 (At least 4 years at University) 35-44 25% Base: At work (weighted): 2006 (96318) Base: All respondents (weighted): 136154 Base: Non work (weighted): 2006 (39837) 2007 Europe Data www.opa-europe.org 5
  • 6. At Work users in Europe are the main decision makers both at home and At Work Spending behaviour At Work Non Work % % Household Grocery Shopping 72 60 Major household purchases 89 74 Income 50K€ + 41 29 Authorise company spending 44 23 Q29. Do you do at least half the grocery shopping for your household? Q30. And do you have at least half of the say in major household purchases (e.g. cars, computers)? Q44. Which classification best describes your total pre-tax household income in euros? Base: At work (weighted): 2006 (96318) Q35. How much spending (in EUR) do you typically authorise for your company each year? Base: Non work (weighted): 2006 (39837) 2007 Europe Data www.opa-europe.org 6
  • 7. Internet Behaviour and Attitudes 2007 Europe Data www.opa-europe.org 7
  • 8. At Work Internet use in Europe has remained stable since 2004 Things At Work users do LESS often as a result of using the internet 24% Read newspapers 27% 27% Talk on the phone 23% 20% Read magazines 23% 19% Leave office to run errands 20% 13% Read books 19% 12% Watch television 19% 12% Spend time with colleagues 17% 9% Listen to radio 12% 2004 7% 2007 Work 10% 7% Listen to music 10% 6% Attend meetings in person 6% Q25. Which of the following do you do less often at work as a result of using the Internet? Base: At work users (weighted):2006 (96318) 2007 Europe Data www.opa-europe.org 8
  • 9. In 2007, more European users feel the Internet improves their productivity At Work Chart 1 of 2 Agreement with statements related to use of Internet at work I have a set of web sites I regularly visit while at 88% work 89% Internet news is the main way I keep in touch with 82% world events while I’m at work 81% 76% The Internet has improved my productivity at work 80% The Internet is the main way I keep in touch with 68% technology news while I’m at work 72% The Internet allows me to take care of personal 60% tasks while at work 69% 2004 The Internet is the main way I keep in touch with 64% 2007 business/financial news while I’m at work 69% I tend to use the Web for short bursts of focused 62% activity at work 67% Q23. Please indicate your agreement with the following statements related to your use of the Internet at Base: At work users (weighted): 2006 (96318) work (agree net % shown) 2007 Europe Data www.opa-europe.org 9
  • 10. European users spend more time on News and Information sites in 2007 Chart 2 of 2 Agreement with statements related to use of internet at work 59% I often use the Internet to work while I’m at home 62% Internet news is the main way I keep in touch with local 53% news while I’m at work 62% I am more likely to navigate deeper into a web site while at 37% work 39% Internet sports news is the main way I keep in touch with 31% sports news and events while I’m at work 33% 41% I am more involved in the web sites I visit while at work 32% 2004 I tend to spend more time on a web site when I’m at work 38% 2007 than at home 27% I spend more time at the office because of my access to 20% the Internet 19% Q23. Please indicate your agreement with the following statements related to your use of the Internet at Base: At work users (weighted): 2006 (96318) work (agree net % shown) 2007 Europe Data www.opa-europe.org 10
  • 11. Visiting news and information sites is the number one reason European At Work users access the Internet Chart 1 of 3 Reasons for accessing the Internet At Work Users (%) From home/school/ From work elsewhere News/current events 78 69 Education/Learning 61 49 Local or regional information 60 62 Research companies or vendors 56 33 Check weather 51 54 Research products or services for purchases 50 56 Travel planning/reservations 47 71 Other 44 49 Customer service/technical support 44 43 Get information on special interest/hobbies 42 35 Q17. For which of the following reasons do you access the Internet? Base: At work (weighted): 2007 (96318) 2007 Europe Data www.opa-europe.org 11
  • 12. Visiting news and information sites is the number one reason European At Work users access the Internet Chart 2 of 3 Reasons for accessing the Internet At Work Users (%) From home/school/ From work elsewhere Investment/transactions/online banking 39 56 Buy products or services 38 65 Entertainment planning (dining, movies, etc.) 33 68 Buy tickets 28 53 Get information on sports/check sports scores 25 35 Find/research employment opportunities 24 38 Read blogs or make blog entries 23 38 Health and health-related information 20 44 Listen to music 19 46 Find used goods for purchase (online auctions, classifieds, etc.) 19 40 Q17. For which of the following reasons do you access the Internet? Base: At work (weighted): 2007 (96318) 2007 Europe Data www.opa-europe.org 12
  • 13. Visiting news and information sites is the number one reason European At Work users access the Internet Chart 3 of 3 Reasons for accessing the Internet At Work Users (%) From home/school/ From work elsewhere Download music/ multimedia files/software utilities 16 55 Watch online video 16 41 Get information on food and cooking 15 40 Check RSS-feed via RSS-reader 14 16 Make phone calls (e.g. Skype) 12 34 Get information on automobiles 10 24 Home improvement/decorating 10 29 Online games 8 28 Download Podcasting-files 7 18 Participate in personals/dating services 5 14 Get information on parenting/babies 5 13 Q17. For which of the following reasons do you access the Internet? Base: At work (weighted): 2007 (96318) 2007 Europe Data www.opa-europe.org 13
  • 14. European users still spend the majority of their time on News and Information sites Chart 1 of 3 Sites visited in a typical week 7-day week At Work Users (%) Non Work Users (%) 2007 2004 2007 2004 News 82 80 News 81 76 Search engines 77 - Search engines 71 - Weather 57 46 Weather 50 41 Entertainment planning 52 37 Entertainment planning 48 42 Hobbies 48 36 Hobbies 54 44 Computer / SW 47 44 Computer / SW 46 43 Travel 46 40 Travel 41 36 Educational 41 31 Educational 43 37 Blogs 34 - Blogs 39 - Music 31 21 Music 45 32 Ticketing services 35 24 Ticketing services 34 20 Radio 31 19 Radio 38 23 Base: At work (weighted): 2006 (96318) Q18. Which types of web sites do you typically visit in an average 7-day week? Base: Non work (weighted): 2006 (39837) 2007 Europe Data www.opa-europe.org 14
  • 15. European users still spend the majority of their time on News and Information sites Chart 2 of 3 Sites visited in a typical week 7-day week At Work Users (%) Non Work Users (%) 2007 2004 2007 2004 Business News Websites 37 - Business News Websites 20 - Sports 29 24 Sports 33 26 Retail shopping 30 21 Retail shopping 25 25 Financial services 32 39 Financial services 19 36 Popular Culture 26 30 Popular Culture 27 34 Job listings 26 21 Job listings 28 28 Food/cooking 25 13 Food/cooking 29 21 Online auctions 25 22 Online auctions 26 26 Games 21 13 Games 29 26 Message boards 24 25 Message boards 21 30 Electronics 24 15 Electronics 21 19 Health/Fitness 21 16 Health/Fitness 25 16 Real Estate 16 10 Real Estate 13 10 Base: At work (weighted): 2006 (96318) Q18. Which types of web sites do you typically visit in an average 7-day week? Base: Non work (weighted): 2006 (39837) 2007 Europe Data www.opa-europe.org 15
  • 16. European users still spend the majority of their time on News and Information sites Chart 3 of 3 Sites visited in a typical week 7-day week At Work Users (%) Non Work Users (%) 2007 2004 2007 2004 Classifieds 13 9 Classifieds 13 12 Home Improvement 13 - Home Improvement 10 - Automobile 10 10 Automobile 14 15 Dating Services 9 9 Dating Services 7 18 Parenting/Babies 7 - Parenting/Babies 5 - Base: At work (weighted): 2006 (96318) Q18. Which types of web sites do you typically visit in an average 7-day week? Base: Non work (weighted): 2006 (39837) 2007 Europe Data www.opa-europe.org 16
  • 17. Media Consumption differences 2007 Europe Data www.opa-europe.org 17
  • 18. Internet use has remained stable – and very high - amongst European At Work users Media usage At Work Users Non Work Users 97% 94% Internet Internet 95% 94% 69% 67% TV TV 64% 71% 66% 59% Radio Radio 63% 59% 60% 57% Magazines Magazines 58% 61% 53% 54% Newspapers Newspapers 49% 46% 2007 Q4/6/8/10/12 Did you read any magazines yesterday? Read newspapers? Watch TV? Base: At work (weighted): 2006 (96318) Listen to radio? Use internet? Base: Non work (weighted): 2006 (39837) 2007 Europe Data www.opa-europe.org 18
  • 19. TV consumption has dropped in Europe since 2004, except during primetime Chart 3 of 5 Total Media Audience by Day Part - At Work Users - TV 100% 90% TV 2004 80% 75% 70% 69% TV 2007 60% 50% 40% 38% 30% 29% 25% 25% 20% 20% 16% 15% 12% 11% 13% 10% 8% 6% 4% 3% 0% Morning Daytime Daytime II Early Early Primetime Late Fringe Late Night 6.00 - 9.00 9.00-12.00 12.00-16.30 Fringe Fringe II 19.00-23.00 23.00-1.00 1.00-6.00 16.30-18.00 18.00 19.00 Q5. Between which hours did you watch TV yesterday...? Base: At work (weighted): 2006 (61167) 2007 Europe Data www.opa-europe.org 19
  • 20. Magazine reading has mainly dropped throughout the day in Europe Chart 2 of 5 Total Media Audience by Day Part - At Work Users - MAGAZINES 100% 90% 80% Magazines 2004 70% 60% Magazines 2007 50% 40% 41% 37% 30% 29% 30% 24% 24% 25% 23% 20% 19% 16% 16% 16% 14% 10% 9% 7% 2% 0% Morning Daytime Daytime II Early Early Primetime Late Fringe Late Night 6.00 - 9.00 9.00-12.00 12.00- Fringe Fringe II 19.00- 23.00-1.00 1.00-6.00 16.30 16.30- 18.00 23.00 18.00 19.00 Q7. Between which hours did you read magazines yesterday...? Base: At work (weighted): 2006 (56275) 2007 Europe Data www.opa-europe.org 20
  • 21. Newspaper reading has mainly dropped throughout the day in Europe Chart 4 of 5 Total Media Audience by Day Part - At Work Users - NEWSPAPERS 100% 90% Newspapers 2004 80% 70% Newspapers 2007 60% 50% 48% 40% 35% 33% 30% 31% 23% 20% 22% 20% 17% 22% 10% 11% 18% 6% 10% 8% 0% 3% 1% Morning Daytime Daytime II Early Early Primetime Late Late Night 6.00 - 9.00 9.00-12.00 12.00- Fringe Fringe II 19.00- Fringe 1.00-6.00 16.30 16.30- 18.00 23.00 23.00-1.00 18.00 19.00 Q9. Between which hours did you read newspaper yesterday...? Base: At work (weighted): 2006 (46780) 2007 Europe Data www.opa-europe.org 21
  • 22. Radio listening has dropped significantly throughout the day in Europe Chart 5 of 5 Total Media Audience by Day Part - At Work Users - RADIO 100% 90% Radio 2004 80% 70% 66% Radio 2007 60% 54% 50% 44% 40% 38% 32% 32% 30% 30% 29% 23% 21% 20% 20% 20% 15% 10% 8% 10% 3% 0% Morning Daytime Daytime II Early Early Primetime Late Fringe Late Night 6.00 - 9.00 9.00-12.00 12.00-16.30 Fringe Fringe II 19.00-23.00 23.00-1.00 1.00-6.00 16.30-18.00 18.00 19.00 Q11. Between which hours did you listen to the radio yesterday...? Base: At work (weighted): 2006 (60741) 2007 Europe Data www.opa-europe.org 22
  • 23. European Internet use still highest in the morning, with a new peak during primetime Chart 1 of 5 Total Media Audience by Day Part - At Work Users - INTERNET 100% 90% 84% 83% Internet 2004 80% 84% 70% 68% Internet 2007 67% 60% 67% 61% 46% 50% 44% 40% 46% 31% 31% 30% 37% 20% 14% 22% 10% 10% 0% Morning Daytime Daytime II Early Early Primetime Late Fringe Late Night 6.00 - 9.00 9.00-12.00 12.00-16.30 Fringe Fringe II 19.00-23.00 23.00-1.00 1.00-6.00 16.30-18.00 18.00 19.00 Q13. How long did you spend on the Internet (for non-email purposes) yesterday, between...? Base: At work (weighted): 2006 (91824) 2007 Europe Data www.opa-europe.org 23
  • 24. Attitudes toward Online Advertising 2007 Europe Data www.opa-europe.org 24
  • 25. In 2007, European Internet users still notice online advertising At Work Location for internet based activities 2004 2007 Notice advertising Notice advertising for business 28% 44% 25% for business 28% 44% 27% products/services products/services Notice advertising Notice advertising for consumer 43% 45% 12% for consumer 39% 49% 8% products/services products/services Notice online 37% 52% 11% Notice online advertising advertising 35% 51% 11% Make online 65% 24% 10% purchases Make online purchases 63% 25% 9% Click on advertising 44% 44% 12% links Click on advertising links 39% 48% 10% Conduct searches 32% 36% 32% Q28. Thinking about your typical use of the Internet at work and home, where are you most Base: All respondents (weighted): 2006 (136154) likely to do the following? 2007 Europe Data www.opa-europe.org 25
  • 26. European At Work users largely prefer the Internet for new product information… Chart 1 of 4 Preferences for advertising aspects by media type Where I prefer to receive Where I prefer to find information about out about new companies products 52% 48% Internet Internet 48% 57% 13% 19% Newspapers Newspapers 14% 8% 10% 18% Magazines Magazines 11% 18% 3% 8% TV TV 4% 8% 1% 2% Radio Radio 2% 2% 2007 Q26. Please give your impressions of advertising you see on each of the following media. Base: At work users (weighted): 2006 (96318) For each statement select all the media types you think apply 2007 Europe Data www.opa-europe.org 26
  • 27. … and increasingly use online advertising to make purchase decisions Chart 2 of 4 Preferences for advertising aspects by media type Have advertising that is Have advertising that helps rich in information me to decide what to buy 30% 25% Internet Internet 31% 27% 18% 11% Newspapers Newspapers 15% 12% 20% 19% Magazines Magazines 20% 17% 7% 11% TV TV 5% 10% 4% 3% Radio Radio 3% 2% 2007 Q26. Please give your impressions of advertising you see on each of the following media. Base: At work users (weighted): 2006 (96318) 2007 Europe Data www.opa-europe.org 27
  • 28. European At Work users more tolerant of online advertising than in 2004… Chart 3 of 4 Preferences for advertising aspects by media type Have too much Have advertising I remember advertising for a long time 53% 8% Internet Internet 38% 8% 23% 7% Newspapers Newspapers 21% 6% 34% 13% Magazines Magazines 36% 10% 61% 44% TV TV 68% 40% 35% 10% Radio Radio 28% 9% 2007 Q26. Please give your impressions of advertising you see on each of the following media. Base: At work users (weighted): 2006 (96318) 2007 Europe Data www.opa-europe.org 28
  • 29. European At Work users find online advertising more interesting than any other Chart 4 of 4 Preferences for advertising aspects by media type Have interesting advertising 19% Internet 22% 11% Newspapers 10% 21% Magazines 21% 27% 2007 TV 20% 8% Radio 6% Q26. Please give your impressions of advertising you see on each of the following media. Base: At work users (weighted): 2006 (96318) 2007 Europe Data www.opa-europe.org 29
  • 30. Conclusions – online advertising reaches a high potential client base At Work • Media consumption habits have definitively changed – Internet now dominates daytime AND primetime media consumption in Europe • Visiting news and information sites is the number one reason European “At Work” users access the Internet • Internet advertising considered the most innovative, informative and relevant 2007 Europe Data www.opa-europe.org 30
  • 31. Notes on Methodology • Study conducted online on several OPA Europe member websites between June 2006 and January 2007 • More than 7000 responses were analysed across Europe • Data from respondents residing outside the 6 countries polled – France, Germany, Italy, Spain, Switzerland and the UK– were not used _______________________________________ When reproducing results, please cite your source as “OPA Europe Internet Use At Work Media Consumption Study 2007” (NB: Switzerland was not included in the 2004 study) 2007 Europe Data www.opa-europe.org 31
  • 32. For more information on the Internet At Work Media Consumption study, please visit www.opa-europe.org 2007 Europe Data www.opa-europe.org 32