ESS grade 11 summative september 2012
•
3 likes•7,352 views

The document is a 45 mark summative assessment on the global water cycle for a Grade 11 IB ESS class. It contains multiple choice and short answer questions testing understanding of key concepts about the water cycle including storage percentages, flow rates, inputs and outputs, and feedback mechanisms. It also addresses questions about energy in the water cycle, impacts of climate change, and water usage over time.

Recommended
More Related Content
What's hot
What's hot (20)
Similar to ESS grade 11 summative september 2012
Similar to ESS grade 11 summative september 2012 (20)
More from GURU CHARAN KUMAR
More from GURU CHARAN KUMAR (20)
Recently uploaded
Recently uploaded (20)
ESS grade 11 summative september 2012
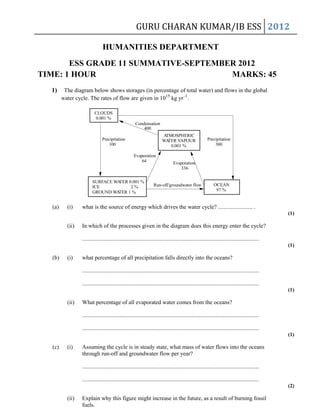
- 1. GURU CHARAN KUMAR/IB ESS 2012 HUMANITIES DEPARTMENT ESS GRADE 11 SUMMATIVE-SEPTEMBER 2012 TIME: 1 HOUR MARKS: 45 1) The diagram below shows storages (in percentage of total water) and flows in the global water cycle. The rates of flow are given in 1015 kg yr–1. CLOUDS 0.001 % Condensation 400 A TMOSPHERIC WA TER VAPOUR 0.001 % Precipitation 100 Evaporation 64 SURFACE WA TER 0.001 % ICE 2% GROUND WA TER 1 % (a) (i) Precipitation 300 Evaporation 336 Run-off/groundwater flow OCEAN 97 % what is the source of energy which drives the water cycle? ........................ . (1) (ii) In which of the processes given in the diagram does this energy enter the cycle? ........................................................................................................................... (1) (b) (i) what percentage of all precipitation falls directly into the oceans? ........................................................................................................................... ........................................................................................................................... (1) (ii) What percentage of all evaporated water comes from the oceans? ........................................................................................................................... ........................................................................................................................... (1) (c) (i) Assuming the cycle is in steady state, what mass of water flows into the oceans through run-off and groundwater flow per year? ........................................................................................................................... ........................................................................................................................... (2) (ii) Explain why this figure might increase in the future, as a result of burning fossil fuels.
- 2. GURU CHARAN KUMAR/IB ESS 2012 ........................................................................................................................... ...........................................................................................................................(PTO) ........................................................................................................................... ........................................................................................................................... ........................................................................................................................... (3) (d) Name a storage of water in the biosphere that is not shown in the diagram, and explain how water is transferred in and out of this storage. ...................................................................................................................................... ...................................................................................................................................... ...................................................................................................................................... ...................................................................................................................................... ...................................................................................................................................... (3) (e) (i) State briefly one way in which one of the other flows in the diagram might change if evaporation rates were to increase. ........................................................................................................................... ........................................................................................................................... (1) (ii) Describe how two changes in the flows shown on the diagram could lead to a fall in global temperatures and reduce global warming. ........................................................................................................................... ........................................................................................................................... ........................................................................................................................... ........................................................................................................................... ........................................................................................................................... (4) (iii) Name the type of feedback involved in this reduction in global warming. ........................................................................................................................... (1) (f) Identify each of the different processes referred to on the diagram as either transfer or transformation processes. ......................................................................................................................................
- 3. GURU CHARAN KUMAR/IB ESS 2012 ...................................................................................................................................... ...................................................................................................................................... (2) (Total 20 marks) 2) a) Define the following terms. (i) Negative feedback ........................................................................................................................... ........................................................................................................................... (1) (ii) Positive feedback ........................................................................................................................... ........................................................................................................................... (1) (b) Suggest why most ecosystems are negative feedback systems. ...................................................................................................................................... ...................................................................................................................................... (1) The diagram below represents a coal fired power station. smoke ................. coal warm water [Source: Adapted from D D Kemp, Global Environment Issues, A Climatological Approach, (Taylor & Francis,1994) p. 7. Reproduced by permission of Cengage Learning] (c) Complete the diagram above by naming the missing input and the two missing outputs. (2) (Total 5 marks)
- 4. GURU CHARAN KUMAR/IB ESS 2012 3) a) (i) State the first law of thermodynamics. ........................................................................................................................... ........................................................................................................................... (1) (ii) Calculate the amount of energy output in the model below. Input 1000 kJ energy 10 % loss to atmosphere 15 % stored after loss to atmosphere OUTPUT = ? ........................................................................................................................... ........................................................................................................................... ........................................................................................................................... ........................................................................................................................... (2 (b) The diagram below represents a simplified hydrological cycle.
- 5. GURU CHARAN KUMAR/IB ESS 2012 ATMOSPHERE 2. 3. 1. 4. GROUND (i) Identify the processes corresponding to the arrows labeled 1 to 4 in the diagram. 1. ................................................................ 2. ................................................................ 3. ................................................................ 4. ................................................................ (2) (ii) Suggest one weakness in the model above. ........................................................................................................................... ........................................................................................................................... (1)
- 6. GURU CHARAN KUMAR/IB ESS 2012 The graph below shows the estimated world water withdrawals from 1960 to 2000. 4 3 Water withdrawals / 103 km3 yr–1 2 1 0 1960 1965 1970 1975 1980 1985 1990 1995 2000 Year [J Loh, The Living Planet Report, © [2002] WWF (panda.org). Some rights reserved.] (iii) Calculate the percentage increase in world water withdrawals from 1960 to 2000. ........................................................................................................................... ........................................................................................................................... ........................................................................................................................... ........................................................................................................................... (2) (iv) Suggest three reasons for the increase in water withdrawals during the period 1960 to 2000. ........................................................................................................................... ........................................................................................................................... ........................................................................................................................... ........................................................................................................................... ........................................................................................................................... ........................................................................................................................... ........................................................................................................................... (3) (Total 11 marks) 4) Figure 1 Relationship between number of rodent species and altitude Figure 2 Altitude habitat model 100
- 7. GURU CHARAN KUMAR/IB ESS 2012 100 s snowline Numbers of rodent species 0 (a) Altitude in metres 3000 mountain With reference to Figure 1 describe the relationship which appears to exist between altitude and the number of rodent species. ...................................................................................................................................... ...................................................................................................................................... (1) (b) Predict three ways in which the altitude habitat model in Figure 2 might change as a result of global warming. ...................................................................................................................................... ...................................................................................................................................... ...................................................................................................................................... ...................................................................................................................................... ...................................................................................................................................... ...................................................................................................................................... (3) (c) (ii) Explain the difference between an open system and a closed system.
- 8. GURU CHARAN KUMAR/IB ESS 2012 ........................................................................................................................... ........................................................................................................................... (2) (b) The first and second laws of thermodynamics suggest that energy is neither made or lost, merely transformed. Using a named ecosystem, outline how this occurs. ..................................................................................................................................... ..................................................................................................................................... ..................................................................................................................................... ..................................................................................................................................... ..................................................................................................................................... ..................................................................................................................................... (3) (Total 9 marks)