Global Information Technology Report 2008 2009

Loading...

Flash Player 9 (or above) is needed to view presentations.
We have detected that you do not have it on your computer. To install it, go here.

0 comments

Post a comment

    Post a comment
    Embed Video
    Edit your comment Cancel

    19 Favorites

    Global Information Technology Report 2008 2009 - Presentation Transcript

    1. The Global Information Technology Report 2008–2009 Mobility in a Networked World Soumitra Dutta, INSEAD Irene Mia, World Economic Forum Editors 7KH *OREDO ,QIRUPDWLRQ 7HFKQRORJ\\ 5HSRUW  ‹  :RUOG (FRQRPLF )RUXP
    2. The Global Information Technology Report 2008–2009 World Economic Forum is a special project within the framework of the Geneva Global Competitiveness Network. It is the result of a collaboration between the World Economic Forum Copyright © 2009 and INSEAD. by the World Economic Forum and INSEAD All rights reserved. No part of this publication can be reproduced, stored in a retrieval sys- Professor Klaus Schwab, tem, or transmitted, in any form or by any Executive Chairman, World Economic Forum means, electronic, mechanical, photocopying, or otherwise without the prior permission of the World Economic Forum. EDITORS Soumitra Dutta, Roland Berger Professor ISBN-13: 978-92-95044-19-7 of Business and Technology and Dean of ISBN-10: 92-95044-19-3 External Relations, INSEAD This book is printed on paper suitable for Irene Mia, Director and Senior Economist, recycling and made from fully managed and World Economic Forum sustained forest sources. Printed and bound in Switzerland by GLOBAL COMPETITIVENESS NETWORK SRO-Kundig, Geneva. Fiona Paua, Senior Director, Head of Strategic Insight Teams Jennifer Blanke, Director, Senior Economist, Head of the Global Competitiveness Network Ciara Browne, Senior Community Manager Agustina Ciocia, Community Manager Margareta Drzeniek Hanouz, Director and Senior Economist Thierry Geiger, Economist, Global Leadership Fellow Pearl Samandari, Team Coordinator Eva Trujillo Herrera, Research Assistant INFORMATION TECHNOLOGY AND TELECOMMUNICATIONS INDUSTRIES TEAM Alan Marcus, Head of IT and Telecommunications Industries Michelle Barrett, Team Coordinator Sandra Bétemps, Senior Team Coordinator Joanna Gordon, Global Leadership Fellow Silvia von Gunten, Senior Advisor William Hoffman, Associate Director Nicholas Kim, Global Leadership Fellow Anne Neville, Global Leadership Fellow Rico Oyola, Global Leadership Fellow A special thank you to Hope Steele for her superb editing work and Ha Nguyen for her excellent graphic design and layout. The terms country and nation as used in this report do not in all cases refer to a territorial entity that is a state as understood by inter- national law and practice. The terms cover well-defined, geographically self-contained economic areas that may not be states but for which statistical data are maintained on a separate and independent basis. 7KH *OREDO ,QIRUPDWLRQ 7HFKQRORJ\\ 5HSRUW  ‹  :RUOG (FRQRPLF )RUXP
    3. Contents Preface................................................................................v 1.8 R&D and Innovation in the ICT Sector: Toward Globalization and Collaboration...................................95 Klaus Schwab (World Economic Forum) Graham Vickery and Sacha Wunsch-Vincent (OECD) Foreword ..........................................................................vii John Chambers (Cisco Systems, Inc.) Executive Summary ............................................................ix Part 2: ICT as a Bridge to Increased Growth and Soumitra Dutta (INSEAD) and Irene Mia Competitiveness: Selected Case Studies ...............111 (World Economic Forum) 2.1 How Outsourcing Can Help Mobilize Talents The Networked Readiness Index Rankings .........................xv Globally: Egypt’s Success Story..................................113 Nagwa El Shenawy (Ministry of Communications and Information Technology, Egypt) and Bruno Lanvin (INSEAD, eLab) Part 1: The Networked Readiness Landscape 2.2 IT Korea: Past, Present, and Future.............................123 in 2008–09 and Mobility...........................................1 Jae Kyu Lee (Korea Advanced Institute of Science and Technology), Choonmo Ahn (Electronics and 1.1 Gauging the Networked Readiness of Nations: iii Telecommunications Research Institute, Korea) and Findings from the Networked Readiness Index Kihoon Sung (Electronics and Telecommunications 2008–2009.....................................................................3 Research Institute, Korea) Irene Mia (World Economic Forum), Soumitra Dutta (INSEAD), and Thierry Geiger (World Economic Forum) 2.3 Will the 2014 Soccer World Cup Help Bridge the Social Gap through the Promotion 1.2 Mobile Telephony: A Critical Enabler of Networked of ICT and E-government in Brazil?.............................133 Readiness?.................................................................27 Darcilene Magalhães (Minas Gerais State Agency for IT Development, Brazil), Peter Knight (Telemática Thierry Geiger and Irene Mia (World Economic Forum) e Desenvolvimento Ltda., Brazil), and Eduardo Moreira da Costa (The Brazilian Innovation Agency) 1.3 From Mobility to Ubiquity: Ensuring the Power and Promise of Internet Connectivity . . . for Anyone, Anywhere, Anytime.....................................................37 Robert Pepper, Enrique J. Rueda-Sabater, Brian C. Boeggeman, and John Garrity (Cisco Systems, Inc.) Part 3: Country/Economy Profiles ..........................145 How to Read the Country/Economy Profiles .............................147 1.4 How to Maximize the Economic Impact of Mobile List of Countries/Economies ......................................................149 Communications: The Four Waves ...............................53 Country/Economy Profiles..........................................................150 Leonard Waverman (Haskayne School of Business, London Business School, and LECG) and Kalyan Dasgupta (LECG) 1.5 Unshackled: How Regulation Can Amplify Mobile Part 4: Data Tables...............................................285 Service Benefits in Emerging Markets.........................63 Scott Beardsley, Luis Enriquez, Mehmet Güvendi, How to Read the Data Tables ....................................................287 Miguel Lucas, Oleg Timchenko, Sergio Sandoval, and Index of Data Tables...................................................................289 Ashish Sharma (McKinsey & Company, Inc.) Data Tables.................................................................................291 1.6 Reality Mining of Mobile Communications: Toward a New Deal on Data........................................75 Technical Notes and Sources ............................................371 Alex Pentland (Massachusetts Institute of Technology) About the Authors .............................................................375 1.7 Global Mobility of Talents: What Will Make People List of Partner Institutes ....................................................381 Move, Stay, or Leave in 2015 and Beyond? ...................81 Vijayakumar Ivaturi (Wipro), Bruno Lanvin (INSEAD, Acknowledgment..............................................................387 eLab), and Hrishi Mohan (Wipro) 7KH *OREDO ,QIRUPDWLRQ 7HFKQRORJ\\ 5HSRUW  ‹  :RUOG (FRQRPLF )RUXP
    4. 7KH *OREDO ,QIRUPDWLRQ 7HFKQRORJ\\ 5HSRUW  ‹  :RUOG (FRQRPLF )RUXP
    5. Preface Preface KLAUS SCHWAB Executive Chairman, World Economic Forum Information and communication technologies (ICT) national policies and strategies that aim toward is increasingly moving to the core of national competi- enhanced networked readiness and competitiveness. tiveness strategies around the world, thanks to its The Global Information Technology Report 2008–2009, revolutionary power as a critical enabler of growth, the eighth edition in the series, presents the latest find- development, and modernization. Recent economic ings of the NRI, providing an updated picture of the history has shown that, as developed countries approach state of networked readiness in the world. Under the the technological frontier, ICT is crucial for them to general theme of mobility, the Report notably highlights continue innovating in their processes and products the remarkable role of mobile telephony—possibly the and to maintain their competitive advantage. Equally most revolutionary ICT—in economic growth, and importantly, ICT has proven instrumental for enabling once again showcases success stories of countries able to developing and middle-income economies to leapfrog leverage ICT for increased competitiveness. to higher stages of development and fostering economic Continuing our effort to expand the coverage of and social transformation. the Report, a record number of 134 economies, account- All over the world, ICT has empowered individuals ing for over 98 percent of the world’s GDP, has been with unprecedented access to information and knowl- included this year. Also featured in the Report is a com- edge, with important consequences in terms of providing prehensive data section containing detailed profiles for education and access to markets, of doing business, and each economy covered and data tables with global rank- v of social interactions, among others. Moreover, by ings for nearly 70 indicators. A number of essays and increasing productivity and therefore economic growth case studies on mobility and best practices in networked in developing countries, ICT can play a formidable role readiness complement the Report. in reducing poverty and improving living conditions We would like to express our gratitude to the and opportunities for the poor. respected academics and industry experts who con- In these challenging times of global economic tributed outstanding chapters to this Report, casting light crisis, the extraordinary capacity of ICT to drive growth on important aspects of mobility and ICT and high- and innovation should not be overlooked, since it can lighting best policies and practices in ICT diffusion and play a critical role not only in facilitating countries’ leverage.We especially wish to thank the editors of the recovery but also in sustaining national competitiveness Report, Soumitra Dutta at INSEAD and Irene Mia at the in the medium to long term. At the World Economic World Economic Forum, for their leadership and long- Forum, we are strong believers in the link between lasting dedication to the project. Appreciation also goes economic growth and ICT readiness, a link that should to Fiona Paua, who heads the Strategic Insight Teams, be further emphasized in the face of the current severe and the other members of the Global Competitiveness economic downturn and calls for budget cuts. Network: Jennifer Blanke, Ciara Browne, Agustina Ciocia, The Global Information Technology Report (GITR) Margareta Drzeniek Hanouz,Thierry Geiger, Pearl series, produced by the Forum in partnership with Samandari, and Eva Trujillo Herrera. Last but not least, INSEAD and published annually since 2001, has we would like to convey our sincere gratitude to our contributed to raising awareness of the importance of network of 150 Partner Institutes around the world and ICT diffusion for overall competitiveness.The broad to all the business executives who participated in our methodological framework of the Networked Readiness Executive Opinion Survey, without whose valuable Index (NRI), featured in the Report series, identifies the input and support the production of this Report would enabling factors that permit countries to fully benefit not have been possible. from ICT advances, stressing the key responsibility of all social actors—individuals, businesses, and governments. The NRI has proven a unique tool for policymakers and all relevant stakeholders, allowing them to follow the progress of their country over time and vis-à-vis relevant comparators, and providing a neutral and authoritative platform for public-private dialogue and for designing 7KH *OREDO ,QIRUPDWLRQ 7HFKQRORJ\\ 5HSRUW  ‹  :RUOG (FRQRPLF )RUXP
    6. 7KH *OREDO ,QIRUPDWLRQ 7HFKQRORJ\\ 5HSRUW  ‹  :RUOG (FRQRPLF )RUXP
    7. Foreword Foreword JOHN CHAMBERS Chairman and CEO, Cisco Systems, Inc. The current global recession has affected business in markets, expand the reach of businesses, and so much nearly every industry and geographical region; it is also more. Imagine how different the world—and the world having a deep and wide impact on societies around the economy—would be if we could extend connectivity to world.Taking decisive action to reprioritize during any all corners of the globe. Broadband literally transforms slowdown is a key focus for companies and countries, the way we live, work, play, and learn. and we are all in the process of taking the necessary And when we talk about broadband, we are really measures that will enable us to adjust to today’s reality. It talking about mobile broadband, enabled by a global is fundamental, however, that we do not allow short-term wireless infrastructure built on an Internet Protocol net- challenges to distract us from planning for longer-term work platform. Mobility represents the only way for the opportunities to achieve sustainable growth. world to achieve ubiquitous broadband access, allowing I believe that we are faced with a unique opportu- the power of the network to scale beyond the limits of nity to nurture global economic prosperity, and ubiqui- traditional hard-wired environments. tous broadband access is a key part of the solution. Prior to the emergence of the global economic By investing in the development and acceleration of a crisis, the world was gaining momentum toward the global broadband infrastructure, we can provide Internet next phase of the Internet, built on a network platform access for all of the world’s citizens.This means we and fueled by productivity-enhancing collaboration can create jobs, provide better access to health care tools and networked applications. Despite the current vii and education, connect small business owners to new financial setbacks, we are still collectively poised to reap customers, and in some countries create a middle class the benefits of this next phase, enabled by a worldwide that will raise the standard of living and national GDP. mobile broadband network infrastructure. There is plenty of work to do in providing access. With this in mind, I believe that the most important For example, while 77 out of every 100 Canadian resi- step government and business leaders in both developed dents uses the Internet, there are only 16 out of 100 and developing nations can take to encourage economic users in Panama, according to 2007 ITU data and analy- growth and global prosperity is to concentrate—collec- sis.The number of broadband subscribers of the same tively, collaboratively—on longer-term opportunities two countries is in equal contrast; while 28 of every 100 such as universal broadband access. Canadian residents have broadband subscriptions, there Let’s rise to the challenge, and in doing so, raise the is only 1 broadband subscriber per 100 in Panama. quality of life—and our economic prosperity for gener- Equally important is the opportunity for countries ations to come. Now is the time to invest in ubiquitous that are considered advanced when compared to other broadband and empower all of the world’s citizens to countries from around the world. For example, Korea, participate in the human network. Rep., considered the leader in broadband penetration, Cisco is pleased to sponsor The Global Information only has 29 broadband subscribers per 100 residents, Technology Report 2008–2009, including the Networked according to ITU data. Readiness Index.We hope that these will provide Achieving ubiquitous broadband access is in the important insight into how we can use mobility to best interest of citizens, businesses, and governments help address the immense challenges and opportunities alike. However, we will succeed in this effort only ahead. through a collaborative partnership—businesses working alongside health-care providers, educators, governments, and nongovernmental organizations. Only by providing the means for people everywhere to access broadband— from the most remote villages to the densest urban centers—will we have the potential to experience a truly connected global economy. Broadband provides unprecedented opportunities for people to communicate with others, access informa- tion, improve education and health care, enter new 7KH *OREDO ,QIRUPDWLRQ 7HFKQRORJ\\ 5HSRUW  ‹  :RUOG (FRQRPLF )RUXP
    8. 7KH *OREDO ,QIRUPDWLRQ 7HFKQRORJ\\ 5HSRUW  ‹  :RUOG (FRQRPLF )RUXP
    9. Executive Summary Executive Summary SOUMITRA DUTTA, INSEAD IRENE MIA, World Economic Forum Information and communication technologies (ICT) has strong correlation between ICT readiness and economic proven to be a key enabler of socioeconomic progress growth and showcasing success stories of countries that and development, enhancing productivity and therefore have used ICT to leapfrog stages of development or, economic growth, reducing poverty and improving liv- more generally, to enhance their competitiveness. ing standards in many ways. ICT is increasingly revolu- The Report is the eighth of a series and is the result tionizing production processes, access to markets, and of a well-established partnership between the World information sources together with social interactions. Economic Forum (the Forum) and INSEAD, aimed at ICT also has an impact on government efficiency, advancing knowledge of networked readiness and of its fostering transparency and better communication and principal drivers. services with and to citizens. The Report is composed of four thematic parts. Part Among these new technologies, mobile telephony 1 features the findings of the Networked Readiness takes a special place in view of its exceptional diffusion Index for 2008–09, as well as a number of remarkable in the last decade or so and its strong social and economic essays examining different topics related to mobility and impact. In particular, mobile telephony has proven ICT. Among these topics are mobile telephony and its instrumental in raising prosperity and reducing poverty impact on economic growth and networked readiness, in developing countries, where it has boomed in recent Internet ubiquity, mobile reality mining, and mobility years—thanks also to a number of facilitating factors, of talents and research and development (R&D) flows. ix including an infrastructure fairly easy to deploy, a market Part 2 provides insight into best practices and generally open to new entrants, and the decreasing costs policies in networked readiness and competitiveness, of mobile handsets and communication per minute, focusing on specific country case studies.The countries among others. selected this year are Egypt, Korea, Rep. (Korea), and The Global Information Technology Report series, Brazil, for, respectively, best practices as an outsourcing launched in 2001 and published annually since, has gone destination, general ICT strategy to promote national hand in hand with the ICT revolution and evolution for competitiveness, and the use of e-government services eight years now, contributing to raising public and private and ICT to alleviate economic and social problems. awareness of the many benefits associated with fully Part 3 includes detailed profiles for each of the leveraging ICT in everyday life, in business practices, 134 economies covered in this year’s Report, offering a and in a government’s activities and interactions with its comprehensive snapshot of each economy’s current citizens.The Report has stressed the importance of ICT networked readiness landscape and allowing for interna- in national competitiveness and development strategies tional and historical comparison on specific variables or and has provided a very useful tool for decision makers components of the NRI. Part 4 features detailed data and civil society alike to monitor national progress as tables for each of the 68 variables composing the NRI well as examples of best practices and policies to this year, with rankings for the 134 economies covered, increase networked readiness. and technical notes and sources. The Global Information Technology Report 2008–2009 appears at a difficult time for the global economic system, Part 1: The Networked Readiness Landscape in which seems to be plunging deeper and deeper into the 2008–09 and Mobility serious recession that began with the subprime housing This part presents the latest findings of the NRI, crisis in the United States and then spread to most sketching a comprehensive picture of the networked countries in the world. Against such a daunting eco- readiness landscape of the world in 2008–09. A number nomic outlook, it is important to reaffirm the crucial of deep-dive analyses focusing on different aspects related role of ICT for general competitiveness and progress to mobility, ICT, and innovation are also included, as and the importance of continuing to invest in ICT follows: (1) mobile telephony and its impact on networked infrastructure and related services, as well as, more readiness; (2) the shift from mobility to ubiquity, thanks broadly, in innovation.We hope that the Report and the to universal Internet connectivity; (3) how to maximize Networked Readiness Index (NRI) 2008–2009 will the economic impact of mobile communications; further strengthen the case for ICT by highlighting the 7KH *OREDO ,QIRUPDWLRQ 7HFKQRORJ\\ 5HSRUW  ‹  :RUOG (FRQRPLF )RUXP
    10. Executive Summary (4) best practices in regulation that can amplify mobile (which is down four positions at 54th) and the rest of service benefits in emerging markets; (5) reality mining the BRIC countries for the first time. of mobile communications; (6) global mobility of talent; The assessment of Latin America and the Caribbean and (7) mobility of international flows in ICT R&D. is more mixed in nature, with only six economies in the top half of the rankings, namely Barbados (36th), Chile The Networked Readiness Index (39th), Puerto Rico (42nd), Jamaica (53rd), Costa Rica Chapter 1.1, “Gauging the Networked Readiness of (56th), and Brazil (59th). Chile loses five positions and Nations: Findings from the Networked Readiness Index the leadership in the region for the first time since the 2008–2009,” presents the latest NRI findings.The NRI inception of this Index. Mexico and Argentina are both was developed by INSEAD in 2002 as a part of an losing ground, positioning themselves at 67th and 87th, ongoing joint research project with the Forum, and is respectively. the main methodological tool featured in the Report to Despite some positive trends, sub-Saharan Africa assess countries’ preparedness to leverage ICT advances continues to lag behind the rest of the world by a signif- for increased competitiveness and development. It builds icant margin, with only two economies (Mauritius and on a mixture of hard data collected by well-respected South Africa, at 51st and 52nd place, respectively) in the international organizations, such as the International top half of the NRI, while 18 rank below 100th place. Telecommunication Union (ITU), the United Nations, In Northern Africa,Tunisia (38th) leads the way and the World Bank, and survey data from the Executive again, with a large and widening gap. Egypt, Morocco, Opinion Survey, conducted annually by the Forum in and Algeria are down at 76th, 86th, and 109th, each of the economies covered by the Report. The NRI respectively. 2008–2009 covers a record number of 134 economies By contrast, the Middle East further improves its (up from 127 in last year’s edition) from both the networked readiness, with all countries but one appear- developed and developing world, accounting for over ing in the top half of the NRI rankings, namely Israel 98 percent of world GDP.The Networked Readiness (25th), the United Arab Emirates (27th), Qatar (29th), Framework, underpinning the NRI and stable since Bahrain (37th), Saudi Arabia (40th), Jordan (44th), 2002, measures: Oman (50th), and Kuwait (57th). x Similar to last year, a trend analysis of the eight-year time-series of the NRI is included in the chapter, with • the presence of an ICT-conducive environment, by the aim of identifying the countries and regions that taking into consideration a number of features of have proven particularly dynamic in leveraging ICT the broad business environment, some regulatory and have advanced the most in the NRI rankings over aspects, and the soft and hard infrastructure for the years. ICT; Mobile telephony and networked readiness • the degree of preparation needed to use ICT for Mobile telephony has emerged as one of the most the three main national stakeholders—individuals, important and widespread forms of ICT in recent the business sector, and the government; and decades, with a significant impact on economic growth and poverty reduction. • the actual use of ICT by the above three In particular, mobile communications penetration stakeholders. has boomed in the developing world, compensating for an often underdeveloped and flawed fixed telephony The NRI rankings for 2008–09 feature Denmark as infrastructure and offering a promising tool to lift more the most networked economy in the world for the third and more people out of poverty and improve market consecutive year, the culmination of an upward trend efficiency.This is good news in view of reducing the observed since 2003.The other Nordic countries also digital and economic divide existing between high- continue to teach the world best practices on how to and low-income countries. leverage ICT for increased competitiveness, with In their paper “Mobile Telephony: A Critical Sweden, Finland, Iceland, and Norway at 2nd, 6th, 7th, Enabler of Networked Readiness?”Thierry Geiger and and 8th position, respectively. Among the top 20, the Irene Mia (both at the World Economic Forum) explore United States continues to deliver a convincing per- the connections among mobile telephony, economic formance in networked readiness, climbing one position growth and development, and countries’ networked to an outstanding 3rd place, followed by Singapore (4th) readiness, as captured by the NRI.The authors’ original and Switzerland (5th). Five other economies from the assumption is that mobile readiness should have a strong Asia and Pacific region place in the top 20 this year: impact on overall networked readiness and therefore on Korea (11th), Hong Kong (12th),Taiwan (13th), sustained economic growth and development.The Australia (14th), and Japan (17th). analysis performed in the chapter shows that this suppo- With regard to the largest Asian emerging markets, sition is certainly true, but only to a certain extent. China leapfrogs 11 positions to 46th, overtaking India 7KH *OREDO ,QIRUPDWLRQ 7HFKQRORJ\\ 5HSRUW  ‹  :RUOG (FRQRPLF )RUXP
    11. Executive Summary While the latest data as well as historical data demon- Web 2.0 productivity and inclusiveness.This requires strate that only a handful of countries with low mobile ensuring, in particular, the wide availability of a core telephony penetration rates achieve above average net- network, spectrum availability and other means to allow worked readiness levels, Geiger and Mia noticed that a diverse system of “capillaries” extending to “the last high mobile telephony penetration is not inevitably mile” to emerge, and the proliferation of Internet- synonymous with high networked readiness.They also enabled devices that meet the needs of users. observe that the relation between mobile telephony Maximizing the economic impact of mobile communications usage and GDP per capita is clearly positive, but is about three times stronger in low- and lower-middle-income Although there is no magic bullet solution for economic countries.This finding bodes well for poor countries’ development, mobile telecommunications has indeed capacity to reduce poverty levels and improve competi- had a positive disruptive impact on life in many devel- tiveness and prosperity, considering the booming mobile oping economies, especially in rural areas. In their chap- phone penetration rates they have registered in recent ter “How to Maximize the Economic Impact of Mobile years. Communications:The Four Waves,” Leonard Waverman (Haskayne School of Business, London Business School, From mobility to ubiquitous connectivity and LECG) and Kalyan Dasgupta (LECG) identify four High-speed networks have become part of the basic stages of development of an information society, which infrastructure of any country and one of the foundations they define as the “four waves” of communications tech- of the knowledge economy. For many countries they nology, namely (1) simple access, (2) universal service, also offer a unique, cost-effective opportunity to (3) usage, and (4) provision of complementary skills and enhance their competitiveness and rise above physical or assets. According to them, only when a country has geographical constraints. Beyond mobility of telecom- evolved through all four waves is it able to make the munications, ubiquitous Internet access offers connec- fullest use of technology.The authors observe that the tivity that follows users seamlessly as they move from literature and the policy debate have so far essentially place to place and device to device. concentrated on the first two waves; also there is a lack In their chapter “From Mobility to Ubiquity: of data availability for the other two.They believe the xi Ensuring the Power and Promise of Internet development of additional research on the last two Connectivity… for Anyone, Anywhere, Anytime,” waves is of paramount importance for understanding the authors Robert Pepper, Enrique J. Rueda-Sabater, role of usage and complementary capital in governing Brian C. Boeggeman, and John Garrity (all at Cisco gains from ICT in a developing country context.This Systems, Inc.) propose: (1) a typology of Internet stages could provide policymakers with a robust assessment of and an ICT Map to place countries’ ICT development the policies that will maximize the returns from ICT in perspective and provide a basis for charting a course investment. Indeed, the developing world has seen only forward, (2) a framework for assessing and improving a glimpse of the potential economic and social value of connectivity and the use of networks, and (3) a review investment in mobile telecommunications networks so of the key drivers toward the goal of Internet ubiquity. far. In particular,Waverman and Dasgupta believe that The stages and ICT Map highlight the importance of setting the right taxation and the licensing process play balancing infrastructure investments with improvements crucial roles in ensuring adequate investment and in the ecosystem (notably ICT policies and market reg- enhancing consumer benefits in the mobile sector, ulation).This is confirmed, the authors say, by evidence as does defining the appropriate role of government that connectivity is not determined solely by income intervention and regulation in the current challenging levels—making it possible for lower-income countries economic environment.They also remark that 3G or to leapfrog in ICT development. wireless mobile telephony could have a particularly A framework built around six keystones is suggested important impact in the developing world since these by the authors to benefit from the opportunity that net- technologies may represent the most cost-effective way work connectivity offers.These comprise: a competitive to bring broadband or even Internet access to the mass- market structure that balances investment incentives and es. Developing countries are likely to enjoy, argue the efficient service, policies and regulations that support authors, the benefit of adopting 3G+ technology at a technology adoption (including convergence around time when devices and applications enhancing the IP), entrepreneurship around applications and content, mobile broadband experience are entering a mature the use of government ICT budgets to “prime the developmental phase; therefore one can expect relatively pump” and rapid diffusion of 3G technology in the developing pioneer ICT adoption, skill development, and extensive world. investment (public and private) in infrastructure.This framework, they argue, can be used to build the founda- tions from which to progress toward the goal of Internet ubiquity—with all its implications for collaboration and 7KH *OREDO ,QIRUPDWLRQ 7HFKQRORJ\\ 5HSRUW  ‹  :RUOG (FRQRPLF )RUXP
    12. Executive Summary Regulation and its impact on mobile service benefits in “Reality Mining of Mobile Communications:Toward a emerging markets New Deal on Data,” MIT professor Alex Pentland focuses on the consequences in terms of data gathering Mobile communications play a key role in developing of the fact we live nowadays in digital networks and economies, crucially facilitating economic growth and leave digital breadcrumbs of our daily activities all the development. At the same time, emerging markets are time. He explains that computational models based on home to 75 percent of the world’s subscribers today and these digital “people data,” using a process called reality hold an important position in the mobile industry’s mining, allow us to create a startlingly comprehensive agenda because of their strong potential going forward. picture of our lives and to predict human social behavior However, succeeding in these markets often requires with a power that was barely conceivable just a few different and innovative approaches tailored to the years ago. Pentland believes that this new “God’s eye” specificities of those markets. After discussing the view of humanity will present unprecedented opportu- benefits of mobile services in emerging markets, nities for profitable commerce and effective government “Unshackled: How Regulation Can Amplify Mobile but also may endanger our personal freedom.To harness Service Benefits in Emerging Markets,” by Scott the good and avoid the evil, he calls for a “New Deal” Beardsley, Luis Enriquez, Mehmet Güvendi, Miguel about how personal data can be gathered and used. Lucas, Oleg Timchenko, Sergio Sandoval, and Ashish This deal should be based on ownership as a minimal Sharma (all at McKinsey & Company, Inc.), highlights a requirement, complemented by a commitment to broader set of policy considerations that policymakers adopt policies encouraging the combination of massive and industry players should consider and address togeth- amounts of anonymous data to promote the Common er in view of enhancing ubiquity and the benefits of Good. mobile service when regulating the latter in developing economies. Among these considerations are: Global mobility of talent In today’s world, some 200 million people live and work 1. ensuring sufficient but not excessive competition outside their country of origin. OECD countries alone —in a capital-intensive industry, where large host some 75 million migrants. Broader access to trans- upfront investments are necessary, competition xii portation and ICT-enabled new forms of production among a few players may have better results combined with disparities in income and labor markets than hyper-competition among many; are some of the factors behind the growing global mar- ket for migrant workers, both short term and less so. In 2. avoiding direct price controls—low prices “Global Mobility of Talents:What Will Make People typically retard industry returns and overall Move, Stay, or Leave in 2015 and Beyond?”Vijayakumar growth in the medium to long term, hampering Ivaturi (Wipro), Bruno Lanvin (INSEAD, eLab), and investment levels and translating into poor Hrishi Mohan (Wipro) attempt to make some sense of customer service; the emerging mobile talent geography, casting light on how the different mobility drivers are likely to combine, 3. attaching strict rollout and coverage require- compound, or offset each other in the future; what the ments to mobile licenses, in order to prevent main directions of labor flows will be; and how the “war new players from investing in rich niche areas for talents” is going to be waged, among other issues. and neglecting more low-income and remote Taking into account longer-term trends and recent areas; and changes in the way companies and individuals operate, the authors explore some avenues that may help define 4. effectively managing spectrum allocation and new dimensions of talent mobility, as well as some of pricing, given that spectrum management has the most urgent issues to be addressed by decision mak- risen significantly in importance in emerging ers with respect to the skills required to sustain national markets, and spectrum policies will play a competitiveness. In particular, a simple model (the major role in delivering telecommunication Global Talent Pyramid Model, or GTPM) is presented, services to users. according to which the ability of a country to attract talents internationally is determined by three main fac- The authors believe these policy issues, if well tors: the attractiveness of the national ecosystem vis-à-vis tackled, can create a fertile environment in which the local and foreign talent, the existence of a critical mass mobile industry can thrive, generating a high public in the “national talent pool” (stock and flow), and the value for the developing world and its people. overall efficiency/quality of the economy and society. The authors believe that mobility, whether virtual Reality mining of mobile communications or physical, will be a central factor in our collective Humanity has the beginnings of a new nervous system efforts to establish an equitable, multicultural, open, —a digital one derived from mobile telephone networks innovative, and sustainable globalization.They point to and already nearly 4 billion people strong. In his chapter 7KH *OREDO ,QIRUPDWLRQ 7HFKQRORJ\\ 5HSRUW  ‹  :RUOG (FRQRPLF )RUXP
    13. Executive Summary the need to become fully aware of the potential benefits Smart Village and Maadi Investment Park, while of collective action to encourage and allow such mobility investor-tailored incentive packages were introduced. on a global scale, and to the opportunity offered by the The authors argue that Egypt has the potential to current crisis to take such action. be one of the top five business process outsourcing des- tinations within the next 10 years, thanks to competitive International flows in R&D in ICT advantages such as its low costs, competitive labor pool, “R&D and Innovation in the ICT Sector:Toward stable macroeconomic environment, strategic geographi- Globalization and Collaboration,” by Graham Vickery cal location, strong government focus, good telecommu- and Sacha Wunsch-Vincent (both at the OECD), deals nications infrastructure, and improving business environ- with recent developments in increasingly globalized ment.They highlight, as a main takeaway from Egypt’s ICT R&D and innovation.The authors relate how experience, the importance of investing global structures of R&D, science performance, and in relevant human resources, ensuring an overall infra- innovation are undergoing an important change whose structure supply with world-class connectivity levels main dimensions are the absolute growth of R&D and and creating a well-funded investment agency with innovation-related activities; the rise of the BRIC an adequate regulatory authority working on a public- economies in scientific and technological fields; the private partnership basis. significant globalization of R&D; the greater performance However, Egypt also faces a number of challenges of R&D in the services sector; and a growing focus on going forward, among which are its intellectual property non-technological innovation, enhanced international- rights and security risks, the challenge of marketing the ization, and mobility of highly skilled people; and country as a late entrant, and labor pool bottlenecks at increased internationalized patenting. According to the middle management and middle level, not to men- Vickery and Wunsch-Vincent, a number of factors tion global inflationary trends. underpin these trends, namely the increasingly knowl- The past, present, and future of IT Korea edge-driven nature of innovation; the quickly changing organization of research that is driven by information Korea has become one of the leading IT nations of the technologies, collaboration, and the sharing of knowl- 21st century; it has achieved rapid economic growth xiii edge; and changes in markets, the competition environ- owing to the successful development of the IT industry ment, and technology. and its applications.The reasons for Korea’s amazing economic growth have been analyzed in terms of its proactive acceptance of technology, value-adding devel- Part 2: ICT as a Bridge to Increased Growth and opment with enhanced performance, and quick transi- Competitiveness: Selected Case Studies tion through industrial structuring. “IT Korea: Past, This part showcases some best practices and policies in Present, and Future,” by Jae Kyu Lee (Korea Advanced networked readiness and competitiveness, relating the Institute of Science and Technology) and Choonmo experiences of three countries—Egypt, Korea, and Ahn and Kihoon Sung (both at the Electronics and Brazil—in becoming a successful outsourcing destination; Telecommunications Research Institute, Korea), identifies in adopting a general ICT strategy fostering national and reviews four phases in Korean IT industry evolution, competitiveness; and in using world-class e-government explaining how the IT industry is related to the elec- practices and ICT (and soccer) to bridge social and tronics industry and how important it is for technology economic inequalities. leadership to attain global IT business leadership.The authors regard as especially crucial the government’s Egypt’s success story in outsourcing proactive role in propagating new standard platforms In the current globalization wave, some developing of telecommunications. Korea has overcome various countries, have emerged as major outsourcing destina- challenges over time, including financial crises and oil tions, greatly benefiting from the related opportunities. shocks.The Korean IT industry has critically contributed In their chapter “How Outsourcing Can Help Mobilize in tackling the above by discovering new answers to Talents Globally: Egypt’s Success Story,” Nagwa El demanding pressures.The authors point to the fact that Shenawy (Ministry of Communications and Korea is currently faced with the effect of the financial Information Technology, Egypt) and Bruno Lanvin crisis sweeping the world as well as with a slowdown in (INSEAD, eLab) focus on Egypt’s successful experience the growth of the IT industry.They argue that the role as an emerging outsourcing gateway in the Middle East of proactive IT development becomes necessary again as and relate the carefully built business environment strat- the new growth engine, and describe the New IT egy and the sustainable and ongoing technological Strategy as aiming to overcome today’s challenges. development and skills upgrading programs that enabled Egypt’s transformation in this area. Indeed, an aggressive national plan was set, including specialized ICT-training programs and the creation of business hubs such as the 7KH *OREDO ,QIRUPDWLRQ 7HFKQRORJ\\ 5HSRUW  ‹  :RUOG (FRQRPLF )RUXP
    14. Executive Summary Brazil: E-government, ICT, and the World Cup to bridge additional details and information on the definitions and the social divide sources of the specific hard data variables included in the Report. ICT-wise, Brazil is a country of many contrasts where one of the most elaborate electronic voting systems in the world and a remarkable online tax return operation coexist with poor broadband penetration and computer illiteracy in many parts of the country, especially among the poor.This reflects entrenched inequalities in the distribution of income, wealth, and access to education and health services, among many other issues.These inequalities not only threaten social cohesion and undermine public safety, they also cut economic competitiveness. In their chapter “Will the 2014 Soccer World Cup Help Bridge the Social Gap through the Promotion of ICT and E-government in Brazil?” authors Darcilene Magalhães (Minas Gerais State Agency for IT Development, Brazil), Peter Knight (Telemática e Desenvolvimento Ltda., Brazil), and Eduardo Moreira da Costa (The Brazilian Innovation Agency) provide a thoughtful account of the progress made in e-government and ICT diffusion in the last couple of decades in Brazil, as well as the pending challenges that must still be tackled. In particular, two major projects hold the potential to help the government bridge the digital and socioeconomic gap in the country, fostering growth and xiv prosperity for all Brazilians: the e-Brasil Project and the 2014-Bis Program.The former, begun in 2004, pro- motes a broad agenda of public policies aimed at build- ing a more equitable and competitive country through intensive use of ICT and seeks to raise general awareness about the advantages of a coherent e-development strategy. By 2008, the e-Brasil Project had created a Web portal promoting the e-Brasil vision and published three books, notably featuring a list of policy recommendations and the “10 commandments” program—a concise sum- mary of these recommendations—for e-Brasil candidates. An initial assessment of the Project’s results is mostly positive, with visible progress at the political level, especially in important states such as São Paulo, Rio de Janeiro, Ceará, and Minas Gerais. The 2014-Bis Program, which is expected to gain speed this year, intends to create a stronger country brand, showcasing unique Brazilian developments in terms of technology, scope, approach, and social impact, in parallel to the preparation of the World Cup 2014, which will be hosted by Brazil. Parts 3 and 4: Country/Economy Profiles and Data Presentation Parts 3 and 4 present detailed profiles for each of the 134 economies covered this year in the Report and data tables for each of the 68 variables composing the NRI, with global rankings. Each part is preceded by a descrip- tion of how to interpret the data provided.Technical notes and sources, included at the end of Part 4, provide 7KH *OREDO ,QIRUPDWLRQ 7HFKQRORJ\\ 5HSRUW  ‹  :RUOG (FRQRPLF )RUXP
    15. The Networked Readiness Index Rankings 7KH *OREDO ,QIRUPDWLRQ 7HFKQRORJ\\ 5HSRUW  ‹  :RUOG (FRQRPLF )RUXP
    16. 7KH *OREDO ,QIRUPDWLRQ 7HFKQRORJ\\ 5HSRUW  ‹  :RUOG (FRQRPLF )RUXP
    17. The Networked Readiness Index Rankings The Networked Readiness Index 2008–2009 rankings 2008–2009 rank Country/Economy Score 2008–2009 rank Country/Economy Score 1 Denmark 5.85 68 Bulgaria 3.80 2 Sweden 5.84 69 Poland 3.80 3 United States 5.68 70 Vietnam 3.79 4 Singapore 5.67 71 Montenegro 3.79 5 Switzerland 5.58 72 Sri Lanka 3.79 6 Finland 5.53 73 Kazakhstan 3.79 7 Iceland 5.50 74 Russian Federation 3.77 8 Norway 5.49 75 Dominican Republic 3.76 9 Netherlands 5.48 76 Egypt 3.76 10 Canada 5.41 77 Botswana 3.72 11 Korea, Rep. 5.37 78 El Salvador 3.69 12 Hong Kong SAR 5.30 79 Macedonia, FYR 3.67 13 Taiwan, China 5.30 80 Senegal 3.67 14 Australia 5.29 81 Trinidad and Tobago 3.67 15 United Kingdom 5.27 82 Guatemala 3.64 16 Austria 5.22 83 Indonesia 3.62 17 Japan 5.19 84 Serbia 3.62 18 Estonia 5.19 85 Philippines 3.60 19 France 5.17 86 Morocco 3.59 20 Germany 5.17 87 Argentina 3.58 21 Luxembourg 5.10 88 Georgia 3.48 22 New Zealand 5.04 89 Peru 3.47 23 Ireland 5.03 90 Nigeria 3.45 24 Belgium 5.02 91 Gambia, The 3.44 25 Israel 4.98 92 Namibia 3.44 26 Malta 4.79 93 Mongolia 3.43 27 United Arab Emirates 4.76 94 Syria 3.41 28 Malaysia 4.76 95 Honduras 3.41 29 Qatar 4.68 96 Venezuela 3.39 xvii 30 Portugal 4.63 97 Kenya 3.35 31 Slovenia 4.57 98 Pakistan 3.31 32 Czech Republic 4.53 99 Moldova 3.30 33 Cyprus 4.52 100 Guyana 3.29 34 Spain 4.50 101 Libya 3.28 35 Lithuania 4.40 102 Zambia 3.26 36 Barbados 4.38 103 Ghana 3.25 37 Bahrain 4.38 104 Tajikistan 3.25 38 Tunisia 4.34 105 Albania 3.23 39 Chile 4.32 106 Bosnia and Herzegovina 3.23 40 Saudi Arabia 4.28 107 Mali 3.18 41 Hungary 4.28 108 Algeria 3.14 42 Puerto Rico 4.23 109 Mauritania 3.12 43 Slovak Republic 4.19 110 Malawi 3.12 44 Jordan 4.19 111 Côte d’Ivoire 3.12 45 Italy 4.16 112 Madagascar 3.09 46 China 4.15 113 Burkina Faso 3.07 47 Thailand 4.14 114 Armenia 3.06 48 Latvia 4.10 115 Kyrgyz Republic 3.04 49 Croatia 4.09 116 Ecuador 3.03 50 Oman 4.08 117 Suriname 3.03 51 Mauritius 4.07 118 Lesotho 3.02 52 South Africa 4.07 119 Tanzania 3.01 53 Jamaica 4.03 120 Uganda 2.98 54 India 4.03 121 Benin 2.96 55 Greece 4.00 122 Paraguay 2.93 56 Costa Rica 3.99 123 Cameroon 2.93 57 Kuwait 3.98 124 Mozambique 2.91 58 Romania 3.97 125 Nicaragua 2.90 59 Brazil 3.94 126 Cambodia 2.89 60 Azerbaijan 3.93 127 Nepal 2.85 61 Turkey 3.91 128 Bolivia 2.82 62 Ukraine 3.88 129 Ethiopia 2.80 63 Brunei Darussalam 3.87 130 Bangladesh 2.70 64 Colombia 3.87 131 Burundi 2.63 65 Uruguay 3.85 132 Zimbabwe 2.49 66 Panama 3.84 133 Timor-Leste 2.47 67 Mexico 3.84 134 Chad 2.44 (Cont’d.) 7KH *OREDO ,QIRUPDWLRQ 7HFKQRORJ\\ 5HSRUW  ‹  :RUOG (FRQRPLF )RUXP
    18. 7KH *OREDO ,QIRUPDWLRQ 7HFKQRORJ\\ 5HSRUW  ‹  :RUOG (FRQRPLF )RUXP
    19. Part 1 The Networked Readiness Landscape in 2008–09 and Mobility 7KH *OREDO ,QIRUPDWLRQ 7HFKQRORJ\\ 5HSRUW  ‹  :RUOG (FRQRPLF )RUXP
    20. 7KH *OREDO ,QIRUPDWLRQ 7HFKQRORJ\\ 5HSRUW  ‹  :RUOG (FRQRPLF )RUXP
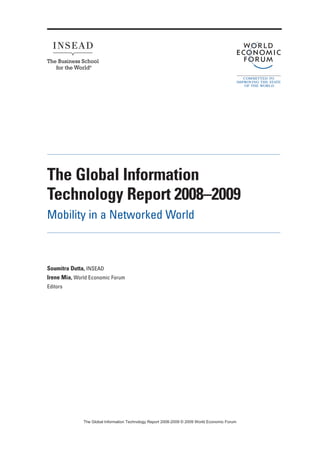
    21. 1.1: Gauging the Networked Readiness of Nations CHAPTER 1.1 As this eighth edition of The Global Information Technology Report (GITR) goes to press in early 2009, economies around the world are reeling from the Gauging the Networked impact of the global economic crisis.What started out as a subprime housing crisis in the United States has Readiness of Nations: Findings snowballed into a global contagion that is driving a large number of developed economies into recession from the Networked Readiness and significantly retarding the rapid growth rates seen Index 2008–2009 over the last years in emerging markets. Government leaders around the world are rethinking their approaches to the regulation of financial markets and are busy craft- IRENE MIA, World Economic Forum ing packages to prevent other sectors of their economies SOUMITRA DUTTA, INSEAD from being impacted adversely by the recessionary con- THIERRY GEIGER, World Economic Forum tagion.The focus worldwide is on stabilizing the global economy and on jumpstarting growth. The information and communication technologies (ICT) industry is not immune to the crisis. IDC, an IT consultancy, has predicted that global technology spend- ing will grow by 2.9 percent year-on-year in 2009, lower than the previously forecasted 4.9 percent.1 Leading technology firms are also feeling the crisis. At the time of writing, Intel had slashed its fourth quarter revenue forecast by more than US$1 billion. However, the news is not all bleak for the technology space.While the US economy is expected to shrink in 2009, tech- nology spending in the United States is forecasted to 3 grow by 0.9 percent (as compared with the previously forecasted 4.2 percent). Despite slowdowns in sales in many technology products, the sales of global mobile phones are expected to grow by 6 percent in 2009, according to forecasts by Gartner Inc. (as compared with previous forecasts of 16 percent growth),2 and the popu- larity of social networking sites is growing steadily. When the financial crisis hit hard in September 2008, LinkedIn’s membership shot up by 25 percent in a single month, to 28 million. As the economic crisis deepened, the site’s sign-ups were clocking at the amazing rate of one new member every second. There are two underlying reasons why the technol- ogy sector, while suffering because of the overall eco- nomic challenges, is showing such signs of resilience. One is that technology is evolving continuously and, despite economic uncertainty over the coming years, progress in most areas of ICT capabilities continues at a blistering pace. For example, the price of personal com- puters is falling rapidly and the emergence of a whole new class of laptops, priced as low as US$100 to US$300 is enabling large segments of the population of emerging countries to now get access to affordable computing. Software capabilities are improving steadily, and they account to a large degree for the growth in popularity of social networking platforms and other Web 2.0 services. The second reason is related to the fact that both public- and private-sector leaders now fully accept the important role of ICT in stimulating growth and enabling the development of economies by significantly 7KH *OREDO ,QIRUPDWLRQ 7HFKQRORJ\\ 5HSRUW  ‹  :RUOG (FRQRPLF )RUXP
    22. 1.1: Gauging the Networked Readiness of Nations Figure 1: Networked readiness and GDP per capita, 2007 12 y = 1.27x + 3.99 R 2 = 0.71 10 Log of GDP (PPP) per capita 8 6 4 1 2 3 4 5 6 7 NRI 2008–2009 score Source: World Economic Forum; IMF, 2008. 4 increasing productivity across sectors and industries. identified and against which countries can benchmark Many economies have been able to leverage the their performances over time and with respect to one another.3 Over the years, the Report has become a highly extraordinary power of ICT as a driver of change, mod- ernization, and competitiveness (see Figure 1). Previous respected platform for private-public dialogue on the editions of the GITR have featured detailed case studies best policies and actions to further ICT readiness, con- on how countries such as Korea, Singapore, Israel, tributing to raising general awareness on the key role of Finland, and Estonia have made important advances in innovation and ICT prowess for national competitiveness their global competitiveness by positioning ICT at the and sustained growth. heart of their national innovation and development Coming in the midst of global contagion and a strategies. Even in emerging markets in Africa, Latin world mired in a major slowdown, the Report stands as America, and Asia, access to ICT has boosted informa- a reminder for leaders in both the public and private tion availability, transformed social interactions, and con- sectors not to lose focus on an important enabler of tributed to poverty reduction and improving the life of growth and competitiveness—ICT.The next months, everyday citizens. or perhaps the next couple of years, are going to be Innovation and technological readiness have fea- challenging for both developed and developing tured prominently in the World Economic Forum (the economies. Many traditional policies and approaches Forum)’s three-decade-long research work as important will be questioned and challenged. However, ICT will competitiveness enablers for countries at all levels of continue to provide opportunities for innovation and development. In particular, the Forum has embarked, in productivity improvements. Economies that will continue partnership with INSEAD since 2002, in a research to invest wisely in these new opportunities will be the project aimed at assessing the impact of innovation— ones not only able to weather the current storm best, notably ICT—on national growth and development, but to come out the strongest when the downturn using, as its main methodology tool, the Networked subsides. Readiness Index (NRI).The findings of the NRI have The remainder of this chapter presents the findings been included in the GITR series, published annually of the NRI for 2008–09 by region, with a particular since 2001 and covering this year a record number of focus on the top ranked economies, together with the 134 economies worldwide, representing over 98 percent underlying Networked Readiness Framework and of global GDP.The NRI establishes an international methodology used in this year’s edition. framework where the factors enabling economies to leverage ICT for increased competitiveness are clearly 7KH *OREDO ,QIRUPDWLRQ 7HFKQRORJ\\ 5HSRUW  ‹  :RUOG (FRQRPLF )RUXP
    23. 1.1: Gauging the Networked Readiness of Nations Figure 2: ICT readiness and usage 7 y = 0.37x 2 – 2.19x + 5.71 6 NRI 2008–2009: Usage subindex score R 2 = 0.92 5 4 3 2 1 1 2 3 4 5 6 7 NRI 2008–2009: Readiness subindex score Source: World Economic Forum. 5 The Networked Readiness Index 2008–2009: private sector can be very powerful. In all these The framework and the methodology countries, an effective multi-stakeholder effort The NRI 2008–2009 rests on the theoretical framework led to leapfrogging stages of development, to a introduced in the 2002–03 edition and developed by structural transformation of the economy, and to INSEAD.4 The Networked Readiness Framework increased growth prospects. assesses the extent to which different economies benefit from the latest ICT advances, based on three main 3. ICT readiness facilitates ICT usage. A society principles, as follows: whose stakeholders are better prepared and show a greater interest toward ICT advances 1. Environment as crucial enabler of networked will be likely to use it more effectively and readiness. An ICT-conducive environment is a extensively.That is, government, business, and key prerequisite for national stakeholders in a individual readiness is reflected in higher ICT given country to leverage ICT for enhanced use, as confirmed by the strong correlation growth. In this sense, an effort should be made between the readiness and usage subindexes of by the government and any other relevant actors the NRI (see Figure 2). to put in place the appropriate market, regulato- ry, and ICT environment. Figure 3 depicts the Networked Readiness Framework, broken down along its three dimensions: 2. A multi-stakeholder effort is required. Although environment, readiness, and usage.The environment the government has a natural leadership role to component is in turn broken down along market, regu- play when it comes to establishing an ICT- and latory, and infrastructure lines, while the latter two are innovation-friendly environment and to putting broken down along the readiness and usage, respectively, ICT penetration at the center of the national of the three key stakeholder groups—that is, individuals, agenda, a multi-stakeholder effort—involving businesses, and government. the government, the business sector and civil The framework just described converts into the society—is required to achieve ICT prowess. NRI, composed of three subindexes, gauging respectively The recent development history of countries as diverse as Korea, Israel, Estonia, and Singapore shows that a farsighted government with a clear vision coupled with active engagement of the 7KH *OREDO ,QIRUPDWLRQ 7HFKQRORJ\\ 5HSRUW  ‹  :RUOG (FRQRPLF )RUXP
    24. 1.1: Gauging the Networked Readiness of Nations Figure 3: The Networked Readiness Index 2008–2009: The framework Component subindexes Pillars Market environment Environment Political and regulatory environment Infrastructure environment Individual readiness Networked Readiness Readiness Index Business readiness Government readiness Individual usage Usage Business usage Government usage Source: World Economic Forum. 6 ICT environment, readiness, and usage, for a total of 9 This reflects the assumption that all Index components pillars and 68 variables, as follows: provide a similar contribution to the overall networked readiness of a country. See the Appendix at the end of the chapter for a more detailed description on the com- 1. Environment subindex position and computation of the NRI 2008–2009. — market environment A brief description of the different composing — political and regulatory environment elements (at the subindex and pillar level) of the NRI — infrastructure environment follows. 2. Readiness subindex Environment subindex — individual readiness As pointed out above, ICT prowess cannot develop in a — business readiness vacuum; for social actors to be able to fully exploit ICT — government readiness potential and nurture their country’s overall competi- tiveness, appropriate market, regulatory, and infrastructure 3. Usage subindex environments must be established.The environment — individual usage subindex gauges the friendliness of a country’s environ- — business usage ment for ICT development by taking into consideration — government usage a total of 30 variables, grouped into three different pil- lars relating to the market, regulatory, and hard and soft Although the 68 variables are the same as last year, infrastructure dimensions. the number and nature of variables included in the The market environment pillar (14 variables) captures Index have varied to some extent over the years, to take the ICT conduciveness of the business environment in a into account the newest developments in the ICT sector country. Aspects such as the availability of appropriate and ensure that the NRI was capturing at any time the financing sources (notably venture capital), the extent relevant determinants of networked readiness. However, of business sophistication (as captured by the cluster the Networked Readiness Framework, kept constant development and high-tech exports), and innovation since 2002, guarantees the overall comparability of the potential (measured by the number of utility patents), NRI results over time. together with the ease of doing business (including the In the calculation of the global NRI score, all three presence of red tape and fiscal charges), the freedom of subindexes are given the same weight, while each exchanging information over the Internet (proxied by subindex is a simple average of the composing pillars. 7KH *OREDO ,QIRUPDWLRQ 7HFKQRORJ\\ 5HSRUW  ‹  :RUOG (FRQRPLF )RUXP
    25. 1.1: Gauging the Networked Readiness of Nations the freedom of the press), and the accessibility of digital of high-tech products is used as a tool to promote effi- content are taken into account. ciency and innovation. The political and regulatory environment pillar (9 vari- Usage subindex ables) examines the quality of the national legal frame- work with particular regard to ICT development. In this The last component of the NRI gauges the actual usage sense, general elements having to do with the protection of ICT by a country’s main stakeholders, with a particu- afforded to property rights, independence of the judiciary, lar focus on the impact of ICT in terms of efficiency and efficiency of the law-making process are taken into and productivity gains. account, as well as ICT-specific aspects such as the devel- The individual usage pillar (5 variables) measures opment of ICT laws and the extent to which intellectual ICT penetration and diffusion at the individual level, property—key to generating innovation—is protected. through the number of mobile telephone and broad- The infrastructure environment pillar (7 variables) band Internet subscribers, Internet users and personal measures the extent to which national infrastructure computers (PCs) and Internet bandwidth. encourages ICT development and diffusion. Infrastructure, The business usage pillar (5 variables) assesses the in our definition, includes both hard elements—such as degree to which businesses generate and absorb tech- the number of telephone lines and secure Internet nology, looking at variables such as the prevalence of servers, and electricity production—as well as softer foreign technology licensing and the capacity for inno- ones related to the quality of the human resources in a vation, together with the availability and usage of fixed given country.With regard to the latter, quantitative telephone lines for business and Internet use by busi- measures, such as tertiary enrollment rates and education nesses in their daily transactions and operations. expenditures, are combined with a qualitative assessment Finally, the government usage pillar (5 variables) ana- of the scientific research institutions and the availability lyzes the implementation of the vision captured by the of scientists and engineers. government readiness pillar described above. In this sense, government’s success in promoting ICT penetra- Readiness subindex tion and the development and quality of e-government The second underpinning of the Networked Readiness services are assessed, as well as the government’s own 7 Framework relates to the extent to which a country’s ICT usage and the extent to which this has led to main stakeholders are interested and prepared to use productivity and efficiency gains. technology—notably ICT—in their daily activities. As one can see from the description above, the Accordingly, the readiness subindex, with a total of 23 NRI and its composing subindexes, pillars and variables variables, measures elements of individual and business offer an extremely useful and detailed instrument for readiness, including the existence of appropriate human policy makers, allowing them to identify areas of weak- skills for using ICT and the affordability of ICT, as well ness which need to be addressed in view of improving as government readiness, reflected notably in the latter’s national networked readiness. prioritization of ICT in the national agenda. Computation methodology and data In this sense, the individual readiness pillar (9 variables) measures citizens’ preparedness to use ICT through a In line with the methodology used in the previous edi- range of variables, including the quality of the educational tions of the Report and in the Forum’s competitiveness system (with a focus on math and science education), work, the NRI 2008–2009 is composed of a mixture of the availability of Internet access in schools, residential hard and survey data capturing both quantitative and telephone connection charges, broadband and telephone qualitative determinants of a country’s networked readi- subscription charges, and the cost of mobile telephone ness. In this regard, as shown in Figure 4, 27 out of the calls. 68 composing variables are hard, quantitative data, The business readiness pillar (10 variables) examines collected from international organizations such as the the extent to which companies are disposed and ready International Telecommunication Union (ITU), the to incorporate ICT in their operations and processes, United Nations, and the World Bank. Internationally taking into account particularly the quality of on-the- collected and validated data ensure data comparability job training, spending on R&D, the collaboration across countries. between academia and industry (central to generating The remaining 41 variables gauge dimensions that applied innovation and to nurturing cluster creation and are more qualitative in nature or for which there are development), the quantity and quality of suppliers in no hard data available for a large number of countries the economy, and the affordability of ICT for business. but that are nonetheless crucial in capturing national The government readiness pillar (4 variables), in turn, networked readiness.These data come from the attempts to capture government’s vision and prioritiza- Executive Opinion Survey (the Survey), which the tion of ICT in the national agenda and competitiveness Forum administered to over 12,000 business leaders strategy, including the extent to which public procurement across 134 economies in 2008 (see Box 1 for details about the Survey methodology). Examples include 7KH *OREDO ,QIRUPDWLRQ 7HFKQRORJ\\ 5HSRUW  ‹  :RUOG (FRQRPLF )RUXP
    26. 1.1: Gauging the Networked Readiness of Nations dimensions relating to the transparency of the legal framework, the quality of education, together with the Box 1: The Executive Opinion Survey government’s vision for ICT and the extent to which this is prioritized in the national agenda. For all these Two types of data enter the Networked Readiness Index dimensions, since no hard data are available, the Survey (NRI). Out of the 68 variables composing the NRI, 27 vari- ables, or 40 percent, are hard data. Hard data are obtained represents an invaluable source of information and from international organizations (e.g., the International insight. Telecommunication Union, the World Bank). Such data pro- The inclusion of new countries in the NRI every vide an objective measure of a quantity (e.g., number of PCs, year is driven by the Survey coverage and the hard data number of procedures required to start a business), comple- availability. Figure 5 shows the evolution of the NRI mented, if necessary, by national sources. The remaining and the Survey’s coverage from the GITR series’ incep- indicators come from the Executive Opinion Survey (the tion.The Report features a record number of seven new Survey) carried out annually by the World Economic Forum. economies this year, namely Brunei Darussalam, Côte The aim of the Survey is to capture the qualitative d’Ivoire, Ghana, Malawi, Montenegro, Serbia, and dimension of specific aspects of competitiveness and net- Timor-Leste.The latter three could not have been worked readiness, as well as to provide comparable data on included in the Report until this year, despite having been issues for which there are no existing hard data indicators. covered by the Survey for a number of years, for lack of This highly specialized survey is conducted annually by the World Economic Forum in all 134 countries covered by the a sufficient number of hard data. Report this year. Business leaders are asked to assess spe- As mentioned earlier, variables included in the cific aspects of the business environment in the country in NRI may experience some variation from year to year, which they operate. For each question, respondents are given the dynamism of the ICT sector and the need to asked to give their opinion about the situation in their country update the NRI accordingly.5 For this reason, some of residence, compared with a global norm. To conduct the time-sensitive variables included in past editions that Survey in each country, the World Economic Forum relies on have not been recently updated by relevant international a network of 150 Partner Institutes. Typically, the Partner institutions may need to be dropped by the NRI Institutes are recognized economics departments of national structure and calculation on any given year.The NRI universities, independent research institutes, or business 8 2008–2009 represents an exception to the above trend, organizations. since it includes the same variables used in the 2007–08 To ensure that the sample is selected consistently computation, updated with the most recent data. around the world, a detailed set of guidelines has been developed by the Forum for the Partner Institutes to target top management business executives, with a particular focus on surveying the most sizeable employers. In addition to rely- The NRI 2008–2009 rankings ing on Partner Institutes to collect surveys in their respective This section will highlight the main findings of the countries, the Forum’s member and partner companies are NRI 2008–2009, with a particular emphasis on the top also invited to participate in the Survey. Sample sizes vary 10 performing countries as well as selected economies according to the size of the economy. In 2008, a record total in the following regions: Europe, Latin America and the of 12,297 responses were included, up from 11,406 in 2007. Caribbean, Asia and the Pacific, Middle East and North Once the data are received, they are subjected to a rig- Africa (MENA), and sub-Saharan Africa.6 orous quality control process. Following a careful verification Table 1 displays the NRI rankings and scores for of the Survey dataset, individual responses to each question 2008–09 with 2007–08 comparisons, while Tables 2, 3, are then aggregated at the country level and combined with and 4 show the rankings and scores for the three results of the previous year following a weighted moving subindexes and nine pillars composing the NRI.Tables average approach. The weighting scheme is composed of 5 and 6, in turn, provide a more detailed analysis on the two overlapping elements: on one hand, we ensure that we sufficiently take into account all individual responses by most networked economies in the world. placing more weight on the larger of the two samples of responses; at the same time, we apply a discount factor to the previous year’s results, thereby placing more weight on Top 10 the most recent responses. As Table 1 shows, Denmark and Sweden continue to be The final country scores thus obtained are used in the assessed as the world’s most networked economies for computation of the NRI and other benchmarking indexes the third consecutive year.The two countries’ ICT developed by the World Economic Forum. For more informa- pre-eminence rests on similar bases, notably an early and tion about the Survey’s process and methodology, refer to continuous focus on education and innovation as well Browne et al. 2008. as a prominent place given to ICT penetration and diffusion in the national agenda as an enabler of general competitiveness. The rankings of 2008–09 confirm Denmark’s superior capacity to leverage ICT for overall national 7KH *OREDO ,QIRUPDWLRQ 7HFKQRORJ\\ 5HSRUW  ‹  :RUOG (FRQRPLF )RUXP
    27. 1.1: Gauging the Networked Readiness of Nations Figure 4: Hard and Survey data composition of the NRI HARD DATA SURVEY DATA 27 Indicators 41 Indicators (40%) (60%) TOTAL: 68 indicators Source: World Economic Forum. 9 Figure 5: Evolution of the NRI’s coverage 150 134 120 127 Nunber of countries/economies 122 115 104 102 90 82 72 60 30 0 2001–02 20002–03 2003–04 2004–05 2005–06 2006–07 2007–08 2008–09 Source: World Economic Forum. 7KH *OREDO ,QIRUPDWLRQ 7HFKQRORJ\\ 5HSRUW  ‹  :RUOG (FRQRPLF )RUXP
    28. 1.1: Gauging the Networked Readiness of Nations Table 1: The Networked Readiness Index 2008–2009 and 2007–2008 NRI 2008– NRI 2008– 2009 rank 2009 rank NRI 2008–2009 NRI 2007–2008 NRI 2008–2009 NRI 2007–2008 among 2007 among 2007 Country/Economy Rank Score countries Rank Score Country/Economy Rank Score countries Rank Score Denmark 1 5.85 1 1 5.78 Bulgaria 68 3.80 67 68 3.71 Sweden 2 5.84 2 2 5.72 Poland 69 3.80 68 62 3.81 United States 3 5.68 3 4 5.49 Vietnam 70 3.79 69 73 3.67 Singapore 4 5.67 4 5 5.49 Montenegro 71 3.79 n/a n/a n/a Switzerland 5 5.58 5 3 5.53 Sri Lanka 72 3.79 70 79 3.58 Finland 6 5.53 6 6 5.47 Kazakhstan 73 3.79 71 71 3.68 Iceland 7 5.50 7 8 5.44 Russian Federation 74 3.77 72 72 3.68 Norway 8 5.49 8 10 5.38 Dominican Republic 75 3.76 73 75 3.66 Netherlands 9 5.48 9 7 5.44 Egypt 76 3.76 74 63 3.74 Canada 10 5.41 10 13 5.30 Botswana 77 3.72 75 78 3.59 Korea, Rep. 11 5.37 11 9 5.43 El Salvador 78 3.69 76 66 3.72 Hong Kong SAR 12 5.30 12 11 5.31 Macedonia, FYR 79 3.67 77 83 3.49 Taiwan, China 13 5.30 13 17 5.18 Senegal 80 3.67 78 85 3.46 Australia 14 5.29 14 14 5.28 Trinidad and Tobago 81 3.67 79 82 3.55 United Kingdom 15 5.27 15 12 5.30 Guatemala 82 3.64 80 80 3.58 Austria 16 5.22 16 15 5.22 Indonesia 83 3.62 81 76 3.60 Japan 17 5.19 17 19 5.14 Serbia 84 3.62 n/a n/a n/a Estonia 18 5.19 18 20 5.12 Philippines 85 3.60 82 81 3.56 France 19 5.17 19 21 5.11 Morocco 86 3.59 83 74 3.67 Germany 20 5.17 20 16 5.19 Argentina 87 3.58 84 77 3.59 Luxembourg 21 5.10 21 24 4.94 Georgia 88 3.48 85 91 3.34 New Zealand 22 5.04 22 22 5.02 Peru 89 3.47 86 84 3.46 Ireland 23 5.03 23 23 5.02 Nigeria 90 3.45 87 94 3.32 Belgium 24 5.02 24 25 4.92 Gambia, The 91 3.44 88 101 3.17 Israel 25 4.98 25 18 5.18 Namibia 92 3.44 89 93 3.33 Malta 26 4.79 26 27 4.61 Mongolia 93 3.43 90 87 3.43 United Arab Emirates 27 4.76 27 29 4.55 Syria 94 3.41 91 110 3.06 Malaysia 28 4.76 28 26 4.82 Honduras 95 3.41 92 90 3.35 10 Qatar 29 4.68 29 32 4.42 Venezuela 96 3.39 93 86 3.44 Portugal 30 4.63 30 28 4.60 Kenya 97 3.35 94 92 3.34 Slovenia 31 4.57 31 30 4.47 Pakistan 98 3.31 95 89 3.37 Czech Republic 32 4.53 32 36 4.33 Moldova 99 3.30 96 96 3.21 Cyprus 33 4.52 33 41 4.23 Guyana 100 3.29 97 102 3.16 Spain 34 4.50 34 31 4.47 Libya 101 3.28 98 105 3.10 Lithuania 35 4.40 35 33 4.41 Zambia 102 3.26 99 112 3.02 Barbados 36 4.38 36 38 4.26 Ghana 103 3.25 n/a n/a n/a Bahrain 37 4.38 37 45 4.13 Tajikistan 104 3.25 100 98 3.18 Tunisia 38 4.34 38 35 4.33 Albania 105 3.23 101 108 3.06 Chile 39 4.32 39 34 4.35 Bosnia and Herzegovina 106 3.23 102 95 3.22 Saudi Arabia 40 4.28 40 48 4.07 Mali 107 3.18 103 99 3.17 Hungary 41 4.28 41 37 4.28 Algeria 108 3.14 104 88 3.38 Puerto Rico 42 4.23 42 39 4.25 Mauritania 109 3.12 105 97 3.21 Slovak Republic 43 4.19 43 43 4.17 Malawi 110 3.12 n/a n/a n/a Jordan 44 4.19 44 47 4.08 Côte d’Ivoire 111 3.12 n/a n/a n/a Italy 45 4.16 45 42 4.21 Madagascar 112 3.09 106 104 3.12 China 46 4.15 46 57 3.90 Burkina Faso 113 3.07 107 103 3.12 Thailand 47 4.14 47 40 4.25 Armenia 114 3.06 108 106 3.10 Latvia 48 4.10 48 44 4.14 Kyrgyz Republic 115 3.04 109 114 2.99 Croatia 49 4.09 49 49 4.06 Ecuador 116 3.03 110 107 3.09 Oman 50 4.08 50 53 3.97 Suriname 117 3.03 111 117 2.91 Mauritius 51 4.07 51 54 3.96 Lesotho 118 3.02 112 122 2.79 South Africa 52 4.07 52 51 4.05 Tanzania 119 3.01 113 100 3.17 Jamaica 53 4.03 53 46 4.09 Uganda 120 2.98 114 109 3.06 India 54 4.03 54 50 4.06 Benin 121 2.96 115 113 3.01 Greece 55 4.00 55 56 3.94 Paraguay 122 2.93 116 120 2.87 Costa Rica 56 3.99 56 60 3.87 Cameroon 123 2.93 117 118 2.89 Kuwait 57 3.98 57 52 4.01 Mozambique 124 2.91 118 121 2.82 Romania 58 3.97 58 61 3.86 Nicaragua 125 2.90 119 116 2.95 Brazil 59 3.94 59 59 3.87 Cambodia 126 2.89 120 115 2.96 Azerbaijan 60 3.93 60 67 3.72 Nepal 127 2.85 121 119 2.88 Turkey 61 3.91 61 55 3.96 Bolivia 128 2.82 122 111 3.05 Ukraine 62 3.88 62 70 3.69 Ethiopia 129 2.80 123 123 2.77 Brunei Darussalam 63 3.87 n/a n/a n/a Bangladesh 130 2.70 124 124 2.65 Colombia 64 3.87 63 69 3.71 Burundi 131 2.63 125 126 2.46 Uruguay 65 3.85 64 65 3.72 Zimbabwe 132 2.49 126 125 2.50 Panama 66 3.84 65 64 3.74 Timor-Leste 133 2.47 n/a n/a n/a Mexico 67 3.84 66 58 3.90 Chad 134 2.44 127 127 2.40 (Cont’d.) 7KH *OREDO ,QIRUPDWLRQ 7HFKQRORJ\\ 5HSRUW  ‹  :RUOG (FRQRPLF )RUXP
    29. 1.1: Gauging the Networked Readiness of Nations Table 2: Environment component subindex Political and Political and Market regulatory Infrastructure Market regulatory Infrastructure environment environment environment environment environment environment ENVIRONMENT SUBINDEX ENVIRONMENT SUBINDEX Rank Country/Economy Score Rank Score Rank Score Rank Score Rank Country/Economy Score Rank Score Rank Score Rank Score 1 Iceland 5.64 11 5.10 10 5.80 1 6.02 68 Poland 3.60 87 3.71 100 3.59 41 3.51 2 Sweden 5.59 10 5.11 5 5.92 2 5.73 69 Ukraine 3.59 90 3.60 95 3.67 43 3.50 3 United States 5.59 2 5.59 19 5.45 3 5.72 70 Sri Lanka 3.55 61 4.00 71 4.00 83 2.66 4 Denmark 5.51 9 5.14 2 6.03 6 5.35 71 Bulgaria 3.55 81 3.77 93 3.69 52 3.18 5 Finland 5.51 6 5.35 3 5.97 7 5.20 72 Vietnam 3.54 86 3.72 53 4.23 82 2.66 6 Switzerland 5.44 4 5.43 7 5.85 9 5.05 73 Uruguay 3.53 102 3.52 59 4.18 67 2.88 7 Norway 5.39 19 4.90 6 5.87 5 5.40 74 Morocco 3.53 57 4.03 74 3.93 88 2.62 8 Canada 5.39 15 5.07 17 5.52 4 5.57 75 Mexico 3.48 74 3.88 84 3.77 71 2.78 9 Singapore 5.34 3 5.58 1 6.30 23 4.13 76 Macedonia, FYR 3.44 83 3.75 97 3.64 63 2.92 10 Australia 5.22 22 4.79 9 5.81 8 5.06 77 Georgia 3.42 53 4.07 91 3.71 96 2.49 11 Netherlands 5.20 8 5.15 12 5.78 14 4.68 78 Colombia 3.41 93 3.59 79 3.87 72 2.77 12 United Kingdom 5.12 13 5.09 20 5.45 12 4.82 79 Serbia 3.40 114 3.38 98 3.64 53 3.17 13 Germany 5.09 20 4.88 8 5.83 15 4.56 80 Trinidad and Tobago 3.39 69 3.91 118 3.36 66 2.89 14 Ireland 5.09 7 5.16 15 5.53 16 4.56 81 Indonesia 3.39 55 4.05 83 3.80 103 2.31 15 New Zealand 5.07 30 4.59 14 5.58 10 5.02 82 Gambia, The 3.38 92 3.59 37 4.65 129 1.90 16 Hong Kong SAR 5.03 1 5.61 11 5.79 37 3.68 83 Zambia 3.37 76 3.84 63 4.07 110 2.21 17 Korea, Rep. 5.02 14 5.08 23 5.20 13 4.79 84 Philippines 3.37 52 4.09 87 3.74 106 2.26 18 Austria 4.99 23 4.77 4 5.93 21 4.28 85 Dominican Republic 3.36 64 3.97 75 3.90 108 2.22 19 Taiwan, China 4.98 5 5.43 43 4.54 11 4.96 86 Ghana 3.35 82 3.75 65 4.06 107 2.25 20 Japan 4.97 12 5.10 18 5.52 20 4.29 87 Brazil 3.34 119 3.28 82 3.81 65 2.91 21 France 4.91 25 4.72 16 5.53 18 4.48 88 Nigeria 3.33 68 3.91 64 4.06 118 2.01 22 Luxembourg 4.82 16 5.02 13 5.59 29 3.84 89 Senegal 3.32 62 3.99 101 3.59 100 2.40 23 Belgium 4.79 28 4.69 22 5.24 19 4.44 90 Kenya 3.32 91 3.60 88 3.74 85 2.63 24 Israel 4.75 17 5.00 34 4.74 17 4.51 91 Brunei Darussalam 3.32 106 3.45 78 3.87 84 2.65 25 Estonia 4.71 21 4.85 21 5.26 26 4.01 92 El Salvador 3.31 56 4.04 86 3.75 112 2.15 26 Malaysia 4.46 18 4.92 24 5.17 48 3.29 93 Mongolia 3.31 89 3.63 102 3.56 73 2.74 27 Malta 4.46 32 4.47 28 4.99 28 3.91 94 Moldova 3.28 118 3.29 76 3.89 80 2.67 28 Cyprus 4.42 41 4.31 27 4.99 27 3.95 95 Malawi 3.24 94 3.59 73 3.93 111 2.21 11 29 Qatar 4.41 26 4.72 33 4.74 35 3.76 96 Tajikistan 3.23 125 3.10 69 4.02 91 2.57 30 Portugal 4.34 37 4.41 30 4.85 34 3.76 97 Honduras 3.23 78 3.80 94 3.67 109 2.22 31 Barbados 4.34 71 3.90 25 5.09 25 4.02 98 Burkina Faso 3.22 95 3.59 72 3.95 114 2.12 32 United Arab Emirates 4.29 24 4.74 39 4.62 40 3.52 99 Guatemala 3.21 54 4.05 104 3.52 117 2.05 33 Puerto Rico 4.25 31 4.49 31 4.75 42 3.51 100 Lesotho 3.20 100 3.55 110 3.44 89 2.60 34 Slovenia 4.23 43 4.19 51 4.32 22 4.18 101 Syria 3.18 101 3.53 103 3.53 97 2.48 35 Spain 4.20 46 4.16 40 4.60 31 3.83 102 Mali 3.18 103 3.51 77 3.88 113 2.14 36 Czech Republic 4.13 40 4.32 52 4.30 33 3.78 103 Guyana 3.16 108 3.44 112 3.42 87 2.62 37 Bahrain 4.12 27 4.71 49 4.37 49 3.28 104 Libya 3.16 129 3.02 113 3.42 58 3.03 38 Saudi Arabia 4.11 38 4.35 42 4.55 44 3.44 105 Kyrgyz Republic 3.16 115 3.37 106 3.50 90 2.60 39 South Africa 4.11 33 4.44 26 5.04 69 2.83 106 Peru 3.15 88 3.69 108 3.45 104 2.29 40 Lithuania 4.10 48 4.14 41 4.57 39 3.58 107 Argentina 3.12 128 3.04 120 3.21 56 3.12 41 Hungary 4.09 44 4.17 50 4.33 32 3.78 108 Uganda 3.11 111 3.41 96 3.66 105 2.27 42 Chile 4.08 35 4.43 35 4.74 57 3.07 109 Armenia 3.09 120 3.27 116 3.39 86 2.62 43 Tunisia 4.08 47 4.16 29 4.88 51 3.20 110 Benin 3.07 113 3.38 90 3.72 115 2.12 44 Kuwait 4.02 34 4.44 58 4.19 45 3.44 111 Tanzania 3.07 107 3.45 81 3.81 123 1.96 45 Greece 4.01 79 3.79 61 4.13 24 4.10 112 Pakistan 3.07 84 3.75 107 3.46 121 1.99 46 Mauritius 3.98 29 4.65 38 4.62 79 2.68 113 Côte d’Ivoire 3.03 104 3.46 124 3.11 95 2.52 47 Latvia 3.98 49 4.12 46 4.45 47 3.36 114 Nepal 3.03 80 3.77 115 3.41 127 1.91 48 Jordan 3.94 51 4.12 36 4.70 59 3.01 115 Madagascar 2.99 99 3.55 111 3.43 122 1.98 49 Thailand 3.94 36 4.42 48 4.43 60 2.97 116 Bosnia and Herzegovina 2.98 122 3.18 122 3.20 92 2.57 50 Slovak Republic 3.91 39 4.33 60 4.17 50 3.23 117 Albania 2.98 110 3.42 114 3.42 116 2.09 51 Oman 3.84 42 4.31 44 4.52 78 2.69 118 Mozambique 2.95 116 3.35 99 3.59 128 1.91 52 Montenegro 3.83 67 3.93 89 3.72 30 3.84 119 Ethiopia 2.94 117 3.33 105 3.51 120 1.99 53 Italy 3.75 75 3.85 92 3.71 36 3.70 120 Algeria 2.93 127 3.04 121 3.20 93 2.56 54 Croatia 3.75 77 3.82 67 4.04 46 3.39 121 Paraguay 2.93 97 3.57 131 2.77 98 2.43 55 China 3.74 59 4.01 45 4.50 74 2.71 122 Mauritania 2.91 98 3.57 109 3.44 133 1.71 56 Turkey 3.70 66 3.97 56 4.20 62 2.94 123 Nicaragua 2.89 109 3.42 119 3.24 119 2.01 57 Panama 3.70 45 4.17 66 4.05 68 2.87 124 Venezuela 2.84 133 2.67 127 2.94 64 2.92 58 Botswana 3.68 70 3.91 47 4.44 77 2.70 125 Cambodia 2.83 112 3.40 117 3.38 132 1.71 59 Namibia 3.67 73 3.89 32 4.74 101 2.39 126 Suriname 2.77 123 3.16 133 2.74 99 2.43 60 India 3.67 50 4.12 57 4.19 76 2.70 127 Bangladesh 2.76 105 3.46 130 2.86 124 1.96 61 Costa Rica 3.67 58 4.02 80 3.85 55 3.13 128 Bolivia 2.74 130 2.80 129 2.87 94 2.54 62 Russian Federation 3.65 96 3.58 85 3.76 38 3.63 129 Cameroon 2.71 126 3.09 123 3.19 130 1.85 63 Kazakhstan 3.63 85 3.73 70 4.02 54 3.15 130 Zimbabwe 2.69 132 2.69 125 3.02 102 2.36 64 Egypt 3.63 60 4.00 62 4.12 70 2.78 131 Ecuador 2.67 124 3.12 126 2.96 126 1.94 65 Jamaica 3.63 65 3.97 55 4.21 75 2.71 132 Burundi 2.55 131 2.77 128 2.94 125 1.95 66 Romania 3.63 72 3.90 68 4.04 61 2.95 133 Timor-Leste 2.48 121 3.24 134 2.47 131 1.74 67 Azerbaijan 3.62 63 3.97 54 4.22 81 2.66 134 Chad 2.31 134 2.54 132 2.75 134 1.63 (Cont’d.) 7KH *OREDO ,QIRUPDWLRQ 7HFKQRORJ\\ 5HSRUW  ‹  :RUOG (FRQRPLF )RUXP
    30. 1.1: Gauging the Networked Readiness of Nations Table 3: Readiness component subindex Individual Business Government Individual Business Government readiness readiness readiness readiness readiness readiness READINESS SUBINDEX READINESS SUBINDEX Rank Country/Economy Score Rank Score Rank Score Rank Score Rank Country/Economy Score Rank Score Rank Score Rank Score 1 Singapore 6.01 2 6.50 10 5.62 1 5.92 68 Trinidad and Tobago 4.48 47 5.55 74 4.24 94 3.65 2 Denmark 5.97 4 6.32 6 5.72 2 5.85 69 Turkey 4.47 64 5.35 63 4.31 87 3.75 3 Sweden 5.95 8 6.26 2 5.86 3 5.72 70 Panama 4.47 69 5.19 75 4.21 61 4.01 4 Finland 5.90 1 6.54 5 5.78 8 5.38 71 Sri Lanka 4.47 76 5.09 86 4.10 52 4.22 5 Switzerland 5.83 3 6.43 1 6.00 17 5.07 72 Jamaica 4.46 71 5.14 65 4.29 69 3.97 6 United States 5.81 14 6.14 3 5.83 6 5.46 73 Serbia 4.46 59 5.44 77 4.18 85 3.77 7 Korea, Rep. 5.77 11 6.22 16 5.40 4 5.70 74 Bulgaria 4.46 66 5.34 85 4.11 72 3.93 8 Norway 5.64 17 6.09 18 5.33 5 5.49 75 Kazakhstan 4.46 94 4.73 54 4.51 55 4.14 9 Iceland 5.62 6 6.30 20 5.27 11 5.28 76 Mexico 4.46 74 5.12 72 4.26 62 3.99 10 Taiwan, China 5.61 12 6.22 14 5.49 14 5.14 77 Macedonia, FYR 4.42 70 5.14 81 4.16 68 3.97 11 Austria 5.58 10 6.24 12 5.55 24 4.94 78 Botswana 4.41 67 5.31 96 3.94 70 3.97 12 Netherlands 5.58 15 6.11 8 5.63 23 4.98 79 Dominican Republic 4.39 87 4.87 89 4.00 47 4.31 13 France 5.55 16 6.11 13 5.51 19 5.03 80 El Salvador 4.34 82 4.99 82 4.14 75 3.90 14 Canada 5.53 9 6.26 19 5.31 20 5.03 81 Argentina 4.33 68 5.25 57 4.48 117 3.25 15 Australia 5.52 13 6.18 22 5.24 15 5.14 82 Syria 4.29 75 5.11 87 4.06 91 3.70 16 Belgium 5.51 5 6.32 7 5.67 35 4.55 83 Guatemala 4.29 89 4.81 71 4.26 82 3.79 17 Germany 5.48 25 5.97 4 5.78 30 4.70 84 Senegal 4.27 99 4.59 66 4.28 71 3.95 18 Estonia 5.48 19 6.06 32 4.94 7 5.44 85 Egypt 4.26 97 4.66 100 3.86 51 4.27 19 Malaysia 5.47 26 5.97 21 5.25 12 5.20 86 Philippines 4.21 83 4.98 97 3.91 88 3.75 20 Japan 5.47 31 5.90 11 5.60 25 4.90 87 Montenegro 4.21 88 4.81 91 3.98 78 3.83 21 Hong Kong SAR 5.46 7 6.27 26 5.09 21 5.02 88 Venezuela 4.20 72 5.13 88 4.01 109 3.44 22 Israel 5.45 34 5.80 15 5.42 16 5.11 89 Morocco 4.13 85 4.89 92 3.96 102 3.54 23 Ireland 5.44 21 6.04 9 5.63 31 4.66 90 Peru 4.13 95 4.68 84 4.11 98 3.59 24 United Kingdom 5.43 24 6.02 17 5.38 26 4.88 91 Georgia 4.12 77 5.08 115 3.45 77 3.83 25 United Arab Emirates 5.39 32 5.89 33 4.94 9 5.33 92 Mongolia 4.07 96 4.68 112 3.46 59 4.07 26 Qatar 5.35 20 6.05 30 5.01 22 4.99 93 Guyana 4.06 93 4.77 99 3.86 100 3.56 27 Malta 5.30 28 5.95 47 4.64 10 5.32 94 Honduras 4.05 98 4.66 93 3.95 101 3.56 28 Luxembourg 5.26 27 5.95 39 4.78 18 5.05 95 Libya 4.01 92 4.77 103 3.78 108 3.46 12 29 Tunisia 5.21 29 5.94 35 4.91 27 4.78 96 Nigeria 3.99 104 4.21 53 4.53 120 3.22 30 New Zealand 5.20 22 6.04 31 4.98 32 4.59 97 Bosnia and Herzegovina 3.98 73 5.13 108 3.58 122 3.22 31 Czech Republic 5.20 23 6.02 23 5.15 43 4.42 98 Albania 3.96 91 4.79 118 3.34 86 3.77 32 Portugal 5.14 48 5.55 41 4.72 13 5.16 99 Suriname 3.95 84 4.92 70 4.26 133 2.67 33 Slovenia 5.14 30 5.94 29 5.02 41 4.45 100 Algeria 3.93 100 4.51 101 3.84 110 3.44 34 Spain 5.09 37 5.66 24 5.12 37 4.50 101 Pakistan 3.86 111 3.79 83 4.14 95 3.64 35 Cyprus 5.07 18 6.07 50 4.57 34 4.56 102 Tajikistan 3.85 103 4.21 107 3.60 90 3.73 36 China 4.96 38 5.66 44 4.65 33 4.58 103 Ecuador 3.83 90 4.81 105 3.72 127 2.97 37 Barbados 4.94 33 5.84 56 4.50 38 4.48 104 Namibia 3.82 101 4.35 98 3.88 121 3.22 38 Bahrain 4.93 35 5.70 62 4.32 28 4.75 105 Ghana 3.81 110 3.82 90 3.99 96 3.62 39 Costa Rica 4.93 44 5.57 34 4.91 48 4.30 106 Kenya 3.76 117 3.36 79 4.16 89 3.75 40 India 4.91 45 5.57 27 5.05 57 4.12 107 Gambia, The 3.70 122 3.05 94 3.95 58 4.11 41 Saudi Arabia 4.88 79 5.06 28 5.04 36 4.55 108 Zambia 3.68 107 3.97 102 3.79 115 3.29 42 Oman 4.87 49 5.54 48 4.60 39 4.47 109 Malawi 3.63 119 3.29 95 3.94 93 3.65 43 Chile 4.86 58 5.45 42 4.71 42 4.42 110 Moldova 3.60 106 3.98 121 3.22 97 3.59 44 Lithuania 4.84 36 5.67 51 4.56 49 4.29 111 Armenia 3.56 109 3.88 111 3.52 116 3.27 45 Jordan 4.81 53 5.52 76 4.19 29 4.72 112 Côte d’Ivoire 3.53 113 3.61 104 3.74 118 3.23 46 Thailand 4.80 54 5.52 43 4.67 53 4.22 113 Madagascar 3.53 118 3.31 114 3.45 79 3.82 47 Croatia 4.80 41 5.62 45 4.64 56 4.13 114 Mauritania 3.50 120 3.27 106 3.67 99 3.56 48 Slovak Republic 4.79 39 5.65 40 4.74 66 3.98 115 Kyrgyz Republic 3.47 105 4.17 128 3.16 124 3.07 49 Puerto Rico 4.77 60 5.42 25 5.12 84 3.77 116 Paraguay 3.45 102 4.23 117 3.34 131 2.78 50 Brunei Darussalam 4.77 40 5.64 67 4.27 45 4.38 117 Cameroon 3.42 115 3.48 110 3.54 119 3.23 51 Mauritius 4.76 50 5.53 59 4.40 46 4.34 118 Tanzania 3.36 121 3.14 113 3.46 107 3.47 52 Hungary 4.75 42 5.58 46 4.64 60 4.03 119 Lesotho 3.36 114 3.55 126 3.17 113 3.34 53 Colombia 4.71 63 5.37 55 4.50 50 4.28 120 Nicaragua 3.31 108 3.89 132 2.93 123 3.10 54 Italy 4.68 57 5.47 38 4.78 83 3.77 121 Bolivia 3.29 112 3.75 116 3.34 130 2.79 55 Romania 4.67 46 5.55 58 4.47 64 3.99 122 Mali 3.27 126 2.70 123 3.20 73 3.91 56 South Africa 4.63 80 5.02 36 4.88 63 3.99 123 Nepal 3.22 116 3.43 120 3.23 126 3.01 57 Azerbaijan 4.63 78 5.06 61 4.36 40 4.46 124 Cambodia 3.21 123 2.93 122 3.22 106 3.47 58 Brazil 4.61 81 5.02 37 4.83 65 3.98 125 Burkina Faso 3.13 133 2.34 109 3.55 105 3.49 59 Latvia 4.59 55 5.52 60 4.38 76 3.88 126 Benin 3.09 127 2.58 127 3.16 104 3.53 60 Greece 4.58 56 5.49 68 4.27 67 3.97 127 Mozambique 3.04 129 2.53 124 3.20 112 3.39 61 Uruguay 4.56 65 5.35 78 4.18 54 4.16 128 Bangladesh 3.01 124 2.88 129 3.09 125 3.06 62 Poland 4.56 43 5.57 52 4.56 103 3.54 129 Ethiopia 2.96 128 2.57 131 3.01 114 3.30 63 Ukraine 4.53 51 5.52 80 4.16 74 3.90 130 Uganda 2.93 134 1.95 125 3.19 92 3.65 64 Vietnam 4.51 86 4.88 73 4.25 44 4.42 131 Burundi 2.92 125 2.80 130 3.03 129 2.92 65 Indonesia 4.51 52 5.52 49 4.58 111 3.43 132 Zimbabwe 2.74 130 2.49 119 3.31 134 2.44 66 Kuwait 4.49 62 5.37 64 4.30 80 3.80 133 Chad 2.69 131 2.47 133 2.85 132 2.75 67 Russian Federation 4.48 61 5.39 69 4.26 81 3.79 134 Timor-Leste 2.65 132 2.36 134 2.64 128 2.96 (Cont’d.) 7KH *OREDO ,QIRUPDWLRQ 7HFKQRORJ\\ 5HSRUW  ‹  :RUOG (FRQRPLF )RUXP
    31. 1.1: Gauging the Networked Readiness of Nations Table 4: Usage component subindex Individual Business Government Individual Business Government usage usage usage usage usage usage USAGE SUBINDEX USAGE SUBINDEX Rank Country/Economy Score Rank Score Rank Score Rank Score Rank Country/Economy Score Rank Score Rank Score Rank Score 1 Denmark 6.07 3 5.96 2 6.15 1 6.09 68 Senegal 3.41 104 1.35 52 4.67 46 4.21 2 Sweden 5.98 2 6.06 1 6.15 6 5.72 69 Greece 3.40 48 2.51 77 4.28 85 3.41 3 Singapore 5.67 7 5.21 13 5.77 2 6.02 70 Bulgaria 3.40 47 2.74 94 3.97 80 3.50 4 Netherlands 5.65 1 6.39 14 5.74 22 4.82 71 Costa Rica 3.38 63 2.10 79 4.26 64 3.77 5 United States 5.63 10 5.05 5 6.06 5 5.79 72 Egypt 3.38 98 1.49 53 4.64 53 4.00 6 Switzerland 5.48 6 5.29 3 6.11 17 5.02 73 Panama 3.35 79 1.80 58 4.57 70 3.68 7 Norway 5.45 8 5.18 10 5.85 12 5.33 74 Montenegro 3.34 43 2.96 97 3.94 101 3.11 8 Hong Kong SAR 5.42 9 5.17 20 5.46 7 5.64 75 Sri Lanka 3.34 103 1.39 43 4.84 62 3.78 9 Estonia 5.37 14 4.83 24 5.29 3 6.00 76 Vietnam 3.33 90 1.62 80 4.23 48 4.12 10 Korea, Rep. 5.32 20 4.31 16 5.70 4 5.95 77 Argentina 3.30 52 2.38 85 4.18 91 3.35 11 Canada 5.31 12 4.93 12 5.77 13 5.23 78 Kazakhstan 3.26 68 2.01 92 4.05 66 3.73 12 Taiwan, China 5.30 15 4.60 15 5.74 8 5.55 79 Gambia, The 3.25 101 1.42 73 4.32 52 4.01 13 United Kingdom 5.28 5 5.45 17 5.65 26 4.73 80 Poland 3.24 46 2.79 69 4.36 127 2.57 14 Iceland 5.24 11 4.94 8 5.91 21 4.86 81 Philippines 3.22 91 1.61 61 4.53 79 3.51 15 Luxembourg 5.21 4 5.69 23 5.29 27 4.64 82 Russian Federation 3.17 56 2.33 81 4.23 111 2.95 16 Finland 5.18 16 4.59 7 6.04 19 4.92 83 Macedonia, FYR 3.15 50 2.42 109 3.69 93 3.34 17 Australia 5.14 18 4.47 21 5.40 9 5.55 84 Venezuela 3.13 64 2.08 98 3.92 87 3.39 18 Japan 5.12 13 4.85 4 6.09 34 4.43 85 Peru 3.13 72 1.95 91 4.09 92 3.35 19 Austria 5.11 21 4.26 9 5.87 14 5.18 86 Trinidad and Tobago 3.13 57 2.24 89 4.10 107 3.04 20 France 5.06 23 4.13 18 5.65 10 5.40 87 Morocco 3.12 77 1.85 83 4.21 95 3.30 21 Germany 4.93 17 4.51 6 6.04 43 4.25 88 Mali 3.09 123 1.15 88 4.12 54 3.99 22 New Zealand 4.86 22 4.25 26 5.23 15 5.09 89 Botswana 3.08 89 1.65 93 3.98 72 3.60 23 Belgium 4.75 19 4.37 19 5.55 40 4.34 90 Nigeria 3.04 112 1.28 68 4.39 83 3.45 24 Israel 4.74 28 3.67 11 5.78 24 4.75 91 Moldova 3.01 80 1.80 87 4.14 103 3.10 25 United Arab Emirates 4.60 31 3.57 27 5.18 16 5.06 92 Pakistan 3.01 93 1.59 86 4.16 96 3.27 26 Malta 4.59 33 3.47 37 4.95 11 5.37 93 Serbia 2.99 58 2.23 113 3.57 98 3.19 27 Ireland 4.56 24 3.95 29 5.14 28 4.59 94 Indonesia 2.98 107 1.34 65 4.44 99 3.15 28 Portugal 4.41 41 3.07 28 5.17 18 4.98 95 Kenya 2.97 109 1.33 82 4.23 88 3.37 13 29 Slovenia 4.34 27 3.68 35 4.98 38 4.37 96 Mauritania 2.96 105 1.35 96 3.96 73 3.58 30 Malaysia 4.34 45 2.86 25 5.26 20 4.89 97 Honduras 2.93 111 1.28 90 4.10 86 3.41 31 Qatar 4.28 38 3.26 41 4.86 25 4.73 98 Mongolia 2.91 97 1.52 106 3.71 81 3.50 32 Lithuania 4.27 32 3.51 47 4.74 30 4.55 99 Uganda 2.90 119 1.19 95 3.97 76 3.54 33 Czech Republic 4.25 25 3.91 22 5.32 77 3.53 100 Georgia 2.89 100 1.46 101 3.85 90 3.36 34 Spain 4.22 30 3.57 42 4.85 44 4.23 101 Burkina Faso 2.86 127 1.08 104 3.79 67 3.70 35 Bahrain 4.08 44 2.90 45 4.77 29 4.58 102 Namibia 2.82 95 1.57 84 4.19 124 2.70 36 Cyprus 4.07 37 3.28 40 4.86 49 4.07 103 Côte d’Ivoire 2.79 110 1.29 75 4.31 121 2.76 37 Italy 4.05 26 3.84 56 4.61 68 3.69 104 Mozambique 2.75 125 1.12 110 3.67 82 3.47 38 Chile 4.03 49 2.49 31 5.06 31 4.53 105 Albania 2.75 82 1.74 120 3.46 106 3.06 39 Jamaica 4.01 29 3.67 63 4.49 57 3.86 106 Syria 2.75 96 1.54 99 3.89 116 2.83 40 Hungary 3.99 34 3.44 51 4.69 58 3.86 107 Madagascar 2.74 126 1.08 103 3.79 89 3.36 41 Brazil 3.88 62 2.12 32 5.06 32 4.47 108 Bosnia and Herzegovina 2.74 71 1.95 108 3.70 129 2.56 42 Barbados 3.85 35 3.38 60 4.54 71 3.65 109 Zambia 2.73 116 1.21 100 3.87 104 3.10 43 Slovak Republic 3.85 36 3.33 38 4.91 94 3.31 110 Benin 2.72 121 1.16 118 3.49 78 3.51 44 Saudi Arabia 3.85 53 2.38 39 4.87 42 4.30 111 Libya 2.68 92 1.59 115 3.51 110 2.95 45 Jordan 3.81 73 1.93 33 5.02 33 4.46 112 Tajikistan 2.66 132 1.04 102 3.84 102 3.11 46 Latvia 3.75 39 3.18 62 4.49 74 3.57 113 Cameroon 2.66 117 1.20 107 3.70 105 3.07 47 Tunisia 3.73 75 1.87 36 4.97 39 4.36 114 Guyana 2.64 88 1.65 121 3.46 119 2.81 48 China 3.73 83 1.73 50 4.69 23 4.77 115 Cambodia 2.63 124 1.12 112 3.61 100 3.15 49 Croatia 3.71 42 3.01 57 4.57 75 3.55 116 Tanzania 2.60 122 1.15 105 3.72 112 2.93 50 Puerto Rico 3.68 65 2.05 34 5.02 55 3.97 117 Ghana 2.60 115 1.26 114 3.56 108 2.97 51 Thailand 3.67 69 1.98 49 4.70 41 4.32 118 Ecuador 2.59 74 1.92 128 3.29 128 2.56 52 Romania 3.62 40 3.16 78 4.28 84 3.42 119 Algeria 2.57 81 1.74 129 3.22 122 2.75 53 Mexico 3.58 66 2.04 76 4.31 36 4.39 120 Armenia 2.54 108 1.33 111 3.63 125 2.66 54 Turkey 3.56 61 2.13 48 4.74 60 3.79 121 Lesotho 2.52 118 1.19 117 3.49 115 2.86 55 Oman 3.54 70 1.97 66 4.44 45 4.21 122 Kyrgyz Republic 2.51 99 1.49 123 3.43 126 2.61 56 Dominican Republic 3.54 85 1.70 59 4.54 37 4.38 123 Nicaragua 2.50 106 1.35 122 3.44 123 2.71 57 Azerbaijan 3.53 94 1.57 55 4.61 35 4.42 124 Ethiopia 2.49 134 1.01 116 3.50 109 2.96 58 Brunei Darussalam 3.52 54 2.38 67 4.41 65 3.76 125 Malawi 2.48 129 1.06 119 3.46 114 2.91 59 India 3.51 114 1.26 30 5.09 47 4.19 126 Bolivia 2.44 102 1.41 132 3.09 117 2.83 60 Ukraine 3.51 59 2.22 71 4.35 56 3.96 127 Burundi 2.43 133 1.03 125 3.33 113 2.92 61 Colombia 3.48 67 2.03 70 4.36 50 4.06 128 Paraguay 2.42 87 1.67 130 3.12 132 2.49 62 Mauritius 3.47 60 2.15 64 4.46 59 3.79 129 Suriname 2.36 84 1.71 127 3.31 133 2.06 63 South Africa 3.46 78 1.83 46 4.76 61 3.79 130 Bangladesh 2.34 120 1.17 126 3.32 130 2.53 64 Uruguay 3.45 55 2.36 74 4.32 69 3.68 131 Chad 2.32 128 1.06 131 3.11 120 2.79 65 Kuwait 3.42 51 2.41 54 4.63 97 3.23 132 Nepal 2.30 131 1.04 124 3.37 131 2.49 66 Guatemala 3.42 86 1.69 44 4.80 63 3.78 133 Timor-Leste 2.27 130 1.05 133 2.94 118 2.81 67 El Salvador 3.41 76 1.87 72 4.34 51 4.03 134 Zimbabwe 2.04 113 1.27 134 2.87 134 2.00 (Cont’d.) 7KH *OREDO ,QIRUPDWLRQ 7HFKQRORJ\\ 5HSRUW  ‹  :RUOG (FRQRPLF )RUXP
    32. 1.1: Gauging the Networked Readiness of Nations Table 5: Top performer on each pillar of the Networked Readiness Index 2008–2009 Number of Overall times ranked Market Regulatory Infrastructure Individual Business Government Individual Business Government Country/Economy GCI in top 3 environment environment environment readiness readiness readiness usage usage usage 2 2 3 2 1 Denmark 1 5 — — — — 2 2 3 2 1 Sweden 2 5 — — — — 2 3 3 United States 3 3 — — — — — — 3 1 2 1 2 Singapore 4 5 — — — — 3 1 3 Switzerland 5 3 — — — — — — 1 Iceland 7 1 — — — — — — — — 3 1 Finland 6 2 — — — — — — — 1 Netherlands 9 1 — — — — — — — — 1 Hong Kong SAR 12 1 — — — — — — — — 3 Estonia 18 1 — — — — — — — — Table 6: Evolution of the Networked Readiness Index since 2001–02 Country 2008–09 2007–08 2006–07 2005–06 2004–05 2003–04 2002–03 2001–02 (Number of economies) 134 127 122 115 104 102 82 72 Denmark 1 1 1 3 4 5 8 7 Sweden 2 2 2 8 6 4 4 4 United States 3 4 7 1 5 1 2 1 Singapore 4 5 3 2 1 2 3 8 Switzerland 5 3 5 9 9 7 13 16 Finland 6 6 4 5 3 3 1 3 Iceland 7 8 8 4 2 10 5 2 Norway 8 10 10 13 13 8 17 5 14 Netherlands 9 7 6 12 16 13 11 6 Canada 10 13 11 6 10 6 6 12 competitiveness: the country has ranked consistently in demand in its early stage—and the excellent educational first place since 2006 (continuously improving its score), system (6th) coupled with a close collaboration between culminating an upward trend observed since 2003, as academia and industry (7th), and the Danish people’s shown in Table 6.The country posts an outstanding taste and talent for developing, pioneering, and using showing across the board, ranking 4th, 2nd, and 1st in new technologies and applications. the environment, readiness, and usage components, The other Nordic countries continue to feature respectively.This highlights the importance of a support- prominently in the NRI 2008–2009 rankings, with ive environment and of a multi-stakeholder effort to Sweden, Finland, Iceland, and Norway at 2nd, 6th, 7th, achieve networked readiness prowess. In particular, the and 8th position, respectively.The strong education fun- government’s clear and consistent vision on the impor- damentals and high levels of technological readiness and tance of ICT diffusion (2nd and 1st, respectively, in gov- innovation shared by these countries represent bases for ernment readiness and usage)7 reflects in an extremely their overall competitiveness;8 they will no doubt be of ICT friendly regulatory environment (2nd), with the assistance to Iceland in particular in overcoming the world’s most-developed ICT legislation; it has also helped present severe economic crisis. in achieving among the highest penetration rates world- Amidst the current major recession, the United wide. Denmark continues to display the highest Internet States continues to deliver a convincing performance bandwidth (346 mB/s per 10,000 population) and in networked readiness, climbing one position to an broadband Internet penetration rates (36.3 subscribers outstanding 3rd place. Among the country’s most notable per 100 population) in the sample, together with exten- competitive strengths are its highly ICT-conducive envi- sive ICT usage by companies in their business transac- ronment (3rd), displaying an outstandingly efficient mar- tions (5th). Other notable competitive advantages helping ket environment (2nd in the world) as well as the country to fully leverage technology have to do top-class ICT-related infrastructure (3rd). In particular, with more general aspects, such as the well-functioning the large pool of scientists and engineers (6th) and the and developed internal market—which provided the best-ranked research institutions in the sample equip the national high-tech industry with a large domestic country with the necessary infrastructure for technology 7KH *OREDO ,QIRUPDWLRQ 7HFKQRORJ\\ 5HSRUW  ‹  :RUOG (FRQRPLF )RUXP
    33. 1.1: Gauging the Networked Readiness of Nations absorption and development.This, coupled with well- government for its readiness (23rd) and usage (22nd) developed clusters (2nd), results in an extremely ICT- point to the weak prioritization of ICT in the national ready (3rd and 5th, respectively, for business readiness agenda and to the need for a more active government and usage) and innovative business sector, heavily role in leveraging ICT for overall growth. exporting high-tech products (12th, with 21 percent of Improving three positions from last year, Canada total exports) to the international market.The country re-enters the top 10, at 10th place, for the first time since remains one of the world’s main innovation powerhous- 2005–06.The country’s networked readiness is particularly es, as highlighted by its 2nd position for the number of boosted by an excellent ICT infrastructure (4th), a con- utility patents (263.7 per million population). ducive market environment (15th), and widespread ICT On a less positive note, the relatively mediocre usage (11th) by all social actors (12th, 12th, and 13th for rankings registered for the burden of government regu- individual, business, and government usage, respectively). lation (50th) and tax rate (68th, 42.3 percent of total Tables 5 and 6 provide some additional insight into profits), among others, point to the presence of red tape the most successful economies in leveraging ICT this and inefficiencies in the country’s business environment. year, by looking at the top three performers in each of The quality of the general regulatory framework, at the nine pillars composing the NRI, and at the evolu- 19th, is another area of concern, notably with regard to tion of the top 10 economies since 2001–02. the effectiveness of law making (33rd), the efficiency of Table 5 highlights a number of features: the legal framework to settle disputes (28th), the protec- tion of property rights (26th), and the independence of 1. Denmark, Sweden, and Singapore are the countries the judiciary (23rd). appearing in the top three positions most frequently Singapore leads Asia once again in networked (i.e., in five pillars out of nine), followed by readiness at 4th place, one position up from last year, Switzerland and the United States, which each thanks to important strengths such as the world’s most appear three times within the top three. ICT-conducive market and regulatory environment and exceptional levels of government readiness (1st in the 2. Singapore is once again the only country to rank sample) and usage (2nd). Singapore’s astonishing growth 1st in more than one pillar, topping the political 15 into a vibrant high-tech economy in the space of a few and regulatory environment pillar and the govern- decades has much to do with the government’s savvy ment readiness pillar.Top-ranked Denmark leads promotion of ICT readiness as a key element of its only in one pillar (government usage). competitiveness strategy, coupled with a continued focus on education and innovation and important private- 3. Finland, Iceland, the Netherlands, Sweden, public partnerships.9 Switzerland, and the United States each rank 1st in Switzerland is still among the top-ranked economies one pillar. Finland and the Netherlands are home of in the world, but drops two places to 5th.The country’s the highest individual readiness and usage, respec- success rests on its extremely ICT-supportive market tively. In particular, the Netherlands displays among environment (4th) as well as top-notch educational sys- the highest penetration rates in the world for PCs tem, especially for math and science (5th), and research (2nd), broadband Internet subscribers (4th), and institutions (2nd), resulting in a high degree of innova- Internet users (1st). Iceland has the most ICT- tion (6th for the number of utility patents, at 137.1 per friendly infrastructure in the world as assessed by million population) and a very networked civil society. the NRI, with outstanding marks in most of the In this respect, Switzerland is quite an unusual case hard infrastructure components, notably the number within the most successful countries in the sample: the of telephone lines (4th), secure Internet servers country’s ICT excellence seems to be the result of the (1st), and electricity production (2nd). Switzerland interest and usage of the business sector and ordinary and Sweden, in turn, top the league for the readi- citizens rather than of a precise government vision and ness and usage, respectively, of their business sectors. strategy.The country displays the highest and third-best Switzerland ranks among the best in the world levels of business and individual readiness, respectively, for on-the-job training, industry-academia collabo- out of the 134 countries covered, coupled with wide- ration, and company spending in R&D, among oth- spread usage (6th and 3rd for individual and business ers, while Swedish businesses appear among the usage, respectively), while the government lags behind, most innovative in the world (4th for capacity of at a rather disappointing 17th place for both its ICT innovation and firm level technology absorption) readiness and usage. and are using the Internet extensively in their trans- The Netherlands is down two positions at 9th, actions (2nd). Last, the United States can count on although improving its NRI score slightly.The country one of the most ICT-conducive market environ- continues to post a very robust performance, driven by ments in the world, as noted above. impressive levels of ICT usage (4th), particularly by individuals (1st).The fairly low marks obtained by the 7KH *OREDO ,QIRUPDWLRQ 7HFKQRORJ\\ 5HSRUW  ‹  :RUOG (FRQRPLF )RUXP
    34. 1.1: Gauging the Networked Readiness of Nations 4. Hong Kong (12th overall) and Estonia (18th) are worldwide), ICT-driven efficiency (2nd), the pres- the only two economies outside the top 10 to ence of ICT in its offices (2nd), and its successes in appear within the top three of one pillar. Hong promoting ICT (5th). Kong tops the market environment pillar, thanks to its volume of high-tech exports, which account for Completing the analysis conducted above, Box 2 relates 50 percent of total exports (2nd), the low burden of the main findings of an across-time analysis aimed at taxation (3rd) and bureaucracy (2nd), the sophistica- identifying the regions and countries that have pro- tion of its financial market (2nd), and its extensive gressed the most in the eight years since the NRI’s domestic competition (7th). As for Estonia, it ranks inception. 3rd on government usage.The government gets top marks for the availability of online services (1st Box 2: Evolution of the NRI: Focus on the most and least dynamic countries and regions Table A provides the results of an analysis of country perform- progressing 4 and 3 decile ranks, respectively. Both countries ance based on decile rankings. Like a percentile ranking, a have been fairly successful in leveraging their well-educated decile ranking attributes ranks relative to the number of coun- workforces and in dramatically improving ICT penetration rates. tries in the sample.1 This allows us to compare countries’ per- In Developing Asia, China and India have realized impres- formances across time in the presence of varying sample sizes. sive upward movements across decile ranks (five and three In effect, one has to take into account the fact that the country places, respectively) from 2001. This does not come as a sur- coverage has increased ever since the first edition of the prise, given that they have established themselves as major Report and, as a result, for a country to be ranked 50th among players in the international ICT markets in recent times, with 75 countries is not the same as being ranked 50th out of 134. India emerging as a prime ICT service exporter and China as 16 The Middle East stands out as the region having benefited the biggest exporter of ICT goods in the world. the most from ICT advances over the last eight years, register- In the Western hemisphere region, which comprises the ing a 3.5 decile rank improvement, an extra 0.5 from 2007. The Latin American and Caribbean countries, Jamaica is the coun- regions of the Commonwealth of Independent States (CIS) and try that has improved the most over the period of inclusion. Mongolia and Developing Asia follow, with a 2 and 1.5 decile Ranked in the 8th decile in 2001–02, it climbed the NRI ranking rank improvement, respectively. The Middle East, in particular, steadily to reach the 4th decile in 2006–07 and has maintained has seen a stellar upsurge in penetration rates in recent years, this position ever since. with a 600 percent increase in the number of Internet users On a more negative note, Africa continues to stagnate in from 2002 to 2007, the largest in the world. Also ICT is increas- networked readiness, dropping 0.5 in decile rank over the ingly seen by many countries in the region, notably the Gulf 2001–08 period. Despite the spectacular advances in ICT pene- countries, as an essential tool (both as a target sector and tration—notably mobile telephony—realized in the last decade infrastructure) to promote a structural transformation in the pro- or so, and the great untapped potential of its domestic market, duction and export sector toward more value-added goods and the region is not closing the digital divide with respect to other to modernize their societies. more networked areas of the world, which are progressing For this reason, the United Arab Emirates has embarked much faster. Nevertheless, 11 countries in the region have pro- on a number of multibillion dollar technology-based projects, gressed in decile ranks since their first inclusion in the NRI, with notably the Dubai Media City, Dubai Internet City, and Mauritius and Nigeria at the forefront (both 3 decile ranks up). Knowledge Village, with the aim of creating innovation clusters. The decile ranking approach presents one caveat: coun- Qatar, in turn, made ICT the focal point of its economic, political, tries that were included after the first edition of the NRI in 2001 and social modernization process, creating in 2004 ictQatar as are, in majority, from the developing world, in particular Africa. both regulator and ICT champion in the country.2 Other, less Admittedly, their performance in general has been worse than wealthy economies in the region, such as Jordan and Egypt that of incumbent countries. This means that it is enough for an (respectively progressing 3 and 2 decile ranks during the period incumbent country to maintain its rank to automatically under consideration), have proven quite successful in leverag- progress in the decile ranking. However, examples abound in ing ICT to improve economic efficiency and service provision, our analysis of incumbent countries losing ground to incoming particularly in education. Egypt has also recently turned into an countries and, consequently, stagnating or even dropping in important ICT outsourcing center, thanks to a savvy government terms of decile ranking. Argentina and Tanzania have both lost strategy in promoting an FDI-friendly environment, as explained two decile ranks since 2001–02, Venezuela and Poland have lost in Chapter 2.1 of this Report. one decile rank, Zimbabwe has remained in the 10th decile In the CIS and Mongolia region, Ukraine and Russia since the beginning. Two such examples are Italy and Greece. have proven particularly dynamic over the period, These two EU members have not managed to progress a single 7KH *OREDO ,QIRUPDWLRQ 7HFKQRORJ\\ 5HSRUW  ‹  :RUOG (FRQRPLF )RUXP
    35. 1.1: Gauging the Networked Readiness of Nations Table A: Evolution in decile rankings since first inclusion First inclusion NRI 2008–2009 Decile First inclusion NRI 2008–2009 Decile Country Region* Edition Rank Decile Rank Decile diff. Country Region* Edition Rank Decile Rank Decile diff. Albania CEE 05–06 106 10 105 8 2 Malawi AF 04–05 93 9 110 9 — Algeria AF 03–04 87 9 108 9 — Malaysia DA 01–02 36 5 28 3 2 Argentina WH 01–02 32 5 87 7 –2 Mali AF 03–04 96 10 107 8 2 Armenia CIS 05–06 86 8 114 9 –1 Malta CEE 03–04 27 3 26 2 1 Australia AE 01–02 14 2 14 2 — Mauritania AF 06–07 87 8 109 9 –1 Austria AE 01–02 9 2 16 2 — Mauritius AF 01–02 51 7 51 4 3 Azerbaijan CIS 05–06 73 7 60 5 2 Mexico WH 01–02 44 6 67 5 1 Bahrain ME 04–05 33 4 37 3 1 Moldova CIS 05–06 94 9 99 8 1 Bangladesh DA 01–02 73 10 130 10 — Mongolia CIS 05–06 92 8 93 7 1 Barbados WH 06–07 40 4 36 3 1 Morocco AF 02–03 52 7 86 7 — Belgium AE 01–02 18 3 24 2 1 Mozambique AF 03–04 97 10 124 10 — Benin AF 05–06 108 10 121 10 — Namibia AF 02–03 53 7 92 7 — Bolivia WH 01–02 67 9 128 10 –1 Nepal DA 06–07 108 9 127 10 –1 Bosnia and Herzegovina CEE 04–05 89 9 106 8 1 Netherlands AE 01–02 6 1 9 1 — Botswana AF 02–03 44 6 77 6 — New Zealand AE 01–02 11 2 22 2 — Brazil WH 01–02 38 6 59 5 1 Nicaragua WH 01–02 69 10 125 10 — Bulgaria CEE 01–02 53 8 68 6 2 Nigeria AF 01–02 75 10 90 7 3 Burkina Faso AF 06–07 99 9 113 9 — Norway AE 01–02 5 1 8 1 — Burundi AF 06–07 121 10 131 10 — Pakistan DA 03–04 76 8 98 8 — Cambodia DA 05–06 104 10 126 10 — Panama WH 01–02 48 7 66 5 2 Cameroon AF 03–04 83 9 123 10 –1 Paraguay WH 01–02 63 9 122 10 –1 Canada AE 01–02 12 2 10 1 1 Peru WH 01–02 52 7 89 7 — Chad AF 03–04 102 10 134 10 — Philippines DA 01–02 58 8 85 7 1 Chile WH 01–02 34 5 39 3 2 Poland CEE 01–02 35 5 69 6 –1 China DA 01–02 64 9 46 4 5 Portugal AE 01–02 27 4 30 3 1 Colombia WH 01–02 57 8 64 5 3 Qatar ME 05–06 39 4 29 3 1 Costa Rica WH 01–02 45 6 56 5 1 Romania CEE 01–02 65 9 58 5 4 Croatia CEE 02–03 48 6 49 4 2 Russian Federation CIS 01–02 61 9 74 6 3 Cyprus AE 04–05 37 4 33 3 1 Senegal AF 03–04 81 8 80 6 2 17 Czech Republic CEE 01–02 28 4 32 3 1 Singapore AE 01–02 8 2 4 1 1 Denmark AE 01–02 7 1 1 1 — Slovak Republic CEE 01–02 33 5 43 4 1 Dominican Republic WH 01–02 47 7 75 6 1 Slovenia AE 01–02 29 4 31 3 1 Ecuador WH 01–02 71 10 116 9 1 South Africa AF 01–02 40 6 52 4 2 Egypt ME 01–02 60 8 76 6 2 Spain AE 01–02 26 4 34 3 1 El Salvador WH 01–02 55 8 78 6 2 Sri Lanka DA 01–02 62 9 72 6 3 Estonia CEE 01–02 23 4 18 2 2 Suriname WH 06–07 110 10 117 9 1 Ethiopia AF 03–04 101 10 129 10 — Sweden AE 01–02 4 1 2 1 — Finland AE 01–02 3 1 6 1 — Switzerland AE 01–02 16 3 5 1 2 France AE 01–02 24 4 19 2 2 Taiwan, China AE 01–02 15 2 13 1 1 Gambia, The AF 03–04 82 9 91 7 2 Tajikistan CIS 05–06 93 9 104 8 1 Georgia CIS 04–05 91 9 88 7 2 Tanzania AF 03–04 71 7 119 9 –2 Germany AE 01–02 17 3 20 2 1 Thailand DA 01–02 43 6 47 4 2 Ghana AF 03–04 74 8 103 8 — Trinidad and Tobago WH 01–02 46 7 81 7 — Greece AE 01–02 31 5 55 5 — Tunisia AF 02–03 34 5 38 3 2 Guatemala WH 01–02 68 10 82 7 3 Turkey CEE 01–02 41 6 61 5 1 Guyana WH 05–06 111 10 100 8 2 Uganda AF 03–04 80 8 120 9 –1 Honduras WH 01–02 72 10 95 8 2 Ukraine CIS 01–02 66 9 62 5 4 Hong Kong SAR AE 01–02 13 2 12 1 1 United Arab Emirates ME 04–05 23 3 27 3 — Hungary CEE 01–02 30 4 41 4 — United Kingdom AE 01–02 10 2 15 2 — Iceland AE 01–02 2 1 7 1 — United States AE 01–02 1 1 3 1 — India DA 01–02 54 8 54 5 3 Uruguay WH 01–02 37 5 65 5 — Indonesia DA 01–02 59 8 83 7 1 Venezuela WH 01–02 50 7 96 8 –1 Ireland AE 01–02 19 3 23 2 1 Vietnam DA 01–02 74 10 70 6 4 Israel AE 01–02 22 3 25 2 1 Zambia AF 03–04 85 9 102 8 1 Italy AE 01–02 25 4 45 4 — Zimbabwe AF 01–02 70 10 132 10 — Jamaica WH 01–02 56 8 53 4 4 REGIONS (MEDIANS) Japan AE 01–02 21 3 17 2 1 Advanced Economies AE 01–02 14.5 2 15.5 2 – Jordan ME 01–02 49 7 44 4 3 Africa AF 01–02 60.5 8.5 109 9 –0.5 Kazakhstan CIS 05–06 60 6 73 6 — Central and Eastern Europe CEE 01–02 37 5.5 58 5 0.5 Kenya AF 03–04 84 9 97 8 1 CIS and Mongolia CIS 01–02 63.5 9 90.5 7 2 Korea, Rep. AE 01–02 20 3 11 1 2 Developing Asia DA 01–02 59 8 77.5 6.5 1.5 Kuwait ME 05–06 46 4 57 5 –1 Middle East ME 01–02 54.5 7.5 47 4 3.5 Kyrgyz Republic CIS 05–06 103 9 115 9 — Western Hemisphere WH 01–02 51 7 79.5 6.5 0.5 Latvia CEE 01–02 39 6 48 4 2 Lesotho AF 06–07 116 10 118 9 1 Note: See text for details. Countries added in, or after, the 2007–2008 edition Lithuania CEE 01–02 42 6 35 3 3 are not reported but are included in the calculation of the regional medians. Luxembourg AE 02–03 27 4 21 2 2 * Regional abbreviations: Advanced Economies (AE); Africa (AF); Central Macedonia, FYR CEE 03–04 75 8 79 6 2 and Eastern Europe (CEE); CIS and Mongolia (CIS); Middle East (ME); Western Hemisphere (WH). Madagascar AF 03–04 92 10 112 9 1 7KH *OREDO ,QIRUPDWLRQ 7HFKQRORJ\\ 5HSRUW  ‹  :RUOG (FRQRPLF )RUXP
    36. 1.1: Gauging the Networked Readiness of Nations agendas over time, involving the private sector in a shared vision of ICT excellence. Box 2: Evolution of the NRI: Focus on the most and Turning our attention to the EU15 economies,10 least dynamic countries and regions (cont’d.) the appraisal is more varied. Similarly to the NRI find- decile rank since the first edition of the NRI despite the near- ings in previous editions of the Report, there exists a ly twofold increase in country coverage. Italy appears in the divide among countries such as Denmark, Sweden, 4th decile in both editions (it was ranked 25th in 2001–02 and Finland, Norway, the Netherlands, the United Kingdom, 45th in 2008–09), while Greece appears in the 5th decile (31st Austria, France, Germany, Ireland (23rd), and Belgium in 2001–02 and 55th in 2008–09). This means that these two (24th), which seem to be leveraging ICT in their eco- nations have been overtaken by many incumbent and newly nomic, political, and social systems, and others such as included economies. Greece (55th) and, to a lesser extent, Italy (45th), which lag behind in networked readiness.While Greece remains stable with respect to 2007 and shows a slight Notes improvement in score (from 3.94 to 4.00), Italy contin- 1 For each edition of the NRI, the overall ranking was divided into 10 segments—or deciles—each with an equal count of ranks. ues the downward trend that began last year, dropping The 1st and 10th deciles comprise the economies that rank the another three places. Important flaws preventing the highest and the lowest, respectively. The 1st decile includes country to fully leverage ICT are the weak market ranks 1 to 6 in the 2001–02 edition, and ranks 1 to 13 in 2008–09. Similarly, the 10th decile includes ranks 68 to 75 in (75th) and regulatory (92nd) environments and the low 2001–02 and ranks 121 to 134 in 2008–09. Based on this priority given to ICT diffusion in the government approach, the 50th rank corresponds to the 7th decile in 2001–02 and to the 4th decile in 2008–09. A similar analysis agenda, as highlighted by the disappointing 83rd place was conducted last year (see Mia and Dutta 2008). for government readiness. 2 See Al-Jaber and Dutta 2008. Among EU newcomers (the EU accession 12),11 Estonia (18th) and, to a lesser extent, Slovenia (31st), the Czech Republic (32nd), Lithuania (35th) have successfully used ICT as a lever for the structural trans- formation and modernization of their economies and 18 societies after the fall of the Berlin Wall. In Estonia, in particular, ICT diffusion eased and facilitated the transi- tion from a planned economy to an extremely competi- tive market economy in less than 20 years, thanks to a Europe visionary leadership and the government’s continuous Europe, as region, continues to occupy a relevant posi- prioritization of innovation and universal ICT access as tion in the global networked map drawn by the NRI a tool for improved growth and competitiveness.12 rankings.Twelve out of the top 20 performers are from Estonia continues this year its march to the top of the the region, with Denmark and Sweden showing the way rankings, gaining two positions from 2007, showing that to the rest of the world in networked readiness, followed small can be beautiful when coupled with the right by Switzerland (5th), Finland (6th), Iceland (7th), ICT- and competitiveness-friendly policies and with a Norway (8h), the Netherlands (9th), the United vision of a fully networked society. Kingdom (15th), Austria (16th), Estonia (18th), France On the other side of the spectrum, Bulgaria (68th) (19th), and Germany (20th). and Poland (69th) continue to trail behind.While The Nordic countries are surely the networked Bulgaria’s rank is essentially unchanged from last year, readiness champions in the region as well as globally, with a small score improvement (from 3.71 to 3.80), having consistently ranked in the top 10 for the past Poland is losing further ground with respect to the most eight years, as indicated in Table 6.These countries seem networked among the EU accession 12 countries. to be fully benefiting from ICT advances, as shown by Poland has not tackled perennial weaknesses in its net- their extraordinary penetration and diffusion rates and worked readiness landscape, such as the poor market and their sophisticated business sectors, successfully export- regulatory environment (ranked 87th and 100th, respec- ing high-tech products to international markets.The tively) and the marginal importance given by the gov- Nordic recipe for networked success owes much to a ernment to ICT in its national agenda transparent and business-friendly legal framework, well- (103rd and 127th for government readiness and usage, functioning markets, top-notch educational and research respectively). systems, and a widespread culture of innovation both in Turkey drops six places from 2007, positioning the public and private sectors, among others. Also, itself at 61st, with a fairly homogeneous showing across Nordic policymakers have early understood the impor- the different pillars composing the NRI.While the tance of ICT as a competitiveness enabler and have con- environment appears to be quite ICT friendly (56th), stantly promoted its use and diffusion in their national especially in its regulatory dimensions (56th), significant room for improvement remains in the readiness 7KH *OREDO ,QIRUPDWLRQ 7HFKQRORJ\\ 5HSRUW  ‹  :RUOG (FRQRPLF )RUXP
    37. 1.1: Gauging the Networked Readiness of Nations subindex (69th), in particular with respect to ICT acces- (7th). On a less positive note, the infrastructure environ- sibility, the quality of education, and the government’s ment (37th) constitutes the main area for improvement, vision and e-leadership in ICT diffusion, among others. notably the availability of scientists and engineers (67th) In particular,Turkey’s government readiness, at 87th, and tertiary education enrollment (63rd). receives the lowest mark across the nine pillars. Just after Hong Kong, Taiwan moves up four Russia is fairly stable at 74th, with a minor score positions to 13th rank.Taiwan’s impressive networked improvement (from 3.68 to 3.77) from 2007.The coun- readiness is reflected in the economy ranking 15th or try can count on important competitive advantages for higher in eight of the nine pillars composing the NRI, leveraging ICT, such as the quality of educational and confirming the success of the development strategy research systems together with fairly innovative firms followed by the government in the last three decades (45th for innovation capacity) that invest significantly in (14th and 8th for government readiness and usage, R&D (46th). On the other hand, significant flaws respectively). In particular,Taiwan benefits from a very remain to be addressed in the unsatisfactory quality of ICT-conducive market environment (5th), displaying the the market (96th) and regulatory (85th) environments, as highest number of utility patents per million population well as the scarce ICT focus in the government’s agenda (266.9), the fifth-largest high-tech exports (44.6 percent) and competitiveness strategy, reflected by below par worldwide, and extensive ICT penetration rates across marks for government readiness and usage (81st and the three main stakeholders. 111th, respectively). Very much like Korea,Taiwan is a compelling text- book example of a resource-poor, mainly rural economy transformed into a high-tech powerhouse in the space Asia and the Pacific of a few decades, thanks to a savvy government’s strate- Behind 4th-ranked Singapore, five other Asia and Pacific gy and vision based on the importance of education, region’s economies place in the top 20 this year, as fol- innovation, and ICT diffusion.13 On a more negative lows: Korea (11th), Hong Kong (12th),Taiwan (13th), note,Taiwan gets fairly low marks in the political and Australia (14th), and Japan (17th). By contrast, the region regulatory environment category (43rd), mainly due to is also home to some of the least ICT-ready economies the perceived inefficiency of the lawmaking bodies in the world with four countries—Cambodia (126th), 19 (96th), mediocre judicial independence (49th), and Nepal (127th), Bangladesh (130th), and Timor-Leste widespread red tape as reflected in Taiwan’s 119th rank (133rd)—featuring in the bottom 10 of the rankings. for the number of procedures to start a business. Following a 10-place jump last year, Korea is fairly At 14th, Australia delivers a performance in line stable at a remarkable 11th position.The Korean gov- with the previous three editions, which saw the country ernment continues to show the way as a major catalyst rank 15th, 15th, and 14th, respectively. Remarkably, the of ICT diffusion and innovation (4th for both government country ranks no lower than 22nd in any of the nine readiness and usage).The latter have been a cornerstone dimensions of the NRI.The infrastructure environment of the government’s development strategy followed in (8th), the political and legal framework (9th), and the the last couple of decades and have resulted, among government’s zeal at using ICT (9th) constitute others, in high-quality educational and research systems, Australia’s main strengths. producing a large number of scientists and engineers Japan is up two notches at 17th, thanks to a small (19th) and leading research institutions (14th).This, score improvement from 5.14 to 5.19. Japan boasts coupled with a sophisticated business sector, has trans- undeniable prowess at leveraging ICT and innovating, as formed the country into one of the world’s innovation reflected by the level of business readiness (11th) and powerhouses, registering 129.7 utility patents per million usage (4th), individual usage (13th), and the number of population in 2007 (7th worldwide) and massively per capita utility patents (3rd). However, ICT readiness exporting high-tech products to the international mar- remains impaired by several regulatory, administrative, kets (28 percent of its total exports, 8th). Chapter 2.2 of and infrastructural shortcomings. Furthermore, the rat- this Report provides an account of Korea’s rise to one of ing of government readiness (25th) and usage (34th) has the most important high-tech global players in the space plummeted, the result of a sharp fall in the measures of of two decades or so. prioritization, promotion, and procurement of ICT. Hong Kong (12th) is down two places, with an New Zealand retains its 22nd rank.The country essentially unchanged performance with respect to last possesses excellent infrastructure (10th) as well as a very year. Major strengths continue to be found in its very ICT-friendly political and regulatory environment business friendly market environment (first worldwide) (14th). New Zealand’s comparatively low rank of 32nd characterized by low taxes, strong competition, and a in government readiness is mainly due to low prioritiza- well-developed financial sector. Individual readiness tion and procurement of ICT by the government. (7th) is excellent, thanks to the affordability of ICT and Malaysia drops two ranks to what remains a satis- the high quality of the educational system, while the factory 28th place. Its performance deteriorates across government leads the way when it comes to ICT usage the entire NRI: Malaysia ranks the same or lower than 7KH *OREDO ,QIRUPDWLRQ 7HFKQRORJ\\ 5HSRUW  ‹  :RUOG (FRQRPLF )RUXP
    38. 1.1: Gauging the Networked Readiness of Nations last year in all the nine categories and in 56 of the 68 several indicators in the environment component and to indicators of the Index, although the government is well the government’s efforts to prioritize, promote, and use assessed for its ICT readiness (12th) and for its ICT ICT.Within the CIS, the country precedes Kazakhstan usage (20th). Malaysia does better than many advanced (73rd, down two) and Russia (74th; see the Europe economies in several indicators pertaining to business section for further details). readiness, in particular spending on R&D (18th). Up three ranks, Vietnam (70th) confirms last year’s Infrastructure (48th) and individual usage (45th), where improvement; by contrast, Indonesia and Pakistan, two low IT penetration rates drive performance down, con- of the largest Asian economies, display a worrying trend. stitute the two categories with the largest room for In just two years, Indonesia has lost 21 places and now improvement. ranks 83rd. Over the same period, Pakistan has Leapfrogging 11 positions, China ranks 46th this dropped 14 ranks and now places 98th, getting danger- year, overtaking India and the rest of the BRIC ously close to the 100 mark. economies for the first time. Although the improvement is generalized, it is especially remarkable in the readiness Latin America and the Caribbean component of the NRI, in which China jumps from The NRI 2008–2009 sketches a rather mixed picture 54th to 36th position: individual readiness is soaring of the Latin American and the Caribbean networked (38th, up 21 places), while business (44th, up 14 places) readiness landscape. Although a number of countries are and government (33rd, up nine places) readiness display improving their scores and ranks, the region does not significant progress.There is a sense in the business com- seem to be benefiting from ICT to its full potential.Ten munity that ICT now constitutes much more of a pri- countries from the region feature in the top half of the ority for the government (38th, a 36-place surge) and a rankings, namely Barbados (36th), Chile (39th), Puerto key aspect of its competitiveness strategy. ICT usage by Rico (42nd), Jamaica (53rd), Costa Rica (56th), Brazil the government is increasing too, translating into more (59th), followed by Colombia, Uruguay, Panama, and services and efficiency.Yet, major challenges remain to Mexico (ranked 64th to 67th, respectively). be addressed. Mobile telephony (94th), PCs (79th), and Two places up from last year, tiny Barbados posi- Internet (78th) are spreading but not as rapidly as in tions itself at 36th, with a significant score improvement 20 many other countries and remain very low (83rd, down (from 4.26 to 4.38), overcoming Chile as the most three places, for individual usage), while the market networked country in Latin America and the Caribbean environment (59th) and infrastructure (74th) represent for the first time since the NRI’s inception. Barbados’ major impediments to further ICT diffusion. networked readiness rests on a rather ICT-conducive Pursuing its downward slide in the ranking, environment (31st), especially in its regulatory and Thailand plunges a further seven positions to 47th. infrastructure dimensions (25th in both), and on an out- Behind this negative trend is the continuous worsening standing disposition and ICT usage by the individuals of the country’s performance in all the government- (33rd and 35th, respectively, for individual readiness and related indicators. usage). Among the three stakeholders, individuals play a India is down four positions this year, at 54th, as a leading role in leveraging ICT advances.The relative result of a very mixed performance. On one hand, degree of government readiness (38th) has failed so far India’s business readiness (27th) remains impressive, to translate into high levels of usage, although govern- thanks to high-quality management schools (12th), sig- ment usage is one of the items showing the largest nificant corporate spending on R&D (29th), and a improvement from 2007 (rising from 87th to its current broad base of suppliers.This results in high ICT usage rank of 71st). by businesses (30th), with a fairly strong capacity not Chile, at 39th, loses five positions as well as its only to adopt new technologies (26th) but also to inno- networked readiness prominence in the region.The fact vate (35th). On the other hand, like China, India ranks a that the country’s score is stable (4.32 vs. 4.35 in 2007) low 114th in the individual usage category because of a underlines the importance of constant progress in ICT very spotty ICT penetration. Notably, and despite a diffusion and usage for a country to maintain its com- twofold increase, there are fewer than three PCs and petitive edge in the rankings. Chile displays a rather only seven Internet users for every 100 inhabitants, cor- evenly robust performance across all the Index’s compo- responding to 94th and 99th place, respectively.The nents, with an especially ICT-conducive market (35th) quality of the infrastructure environment is poorly rated and regulatory (35th) environments coupled with a (76th), despite India’s ranking 3rd worldwide for the strong prioritization of ICT penetration by the govern- availability of scientists and engineers and 27th for the ment (42nd and 31st for government readiness and quality of its research institutions. usage), as reflected also by the very early adoption— Covered for the first time, Brunei Darussalam with respect to regional standards—and successful enters the NRI ranking at 63rd. implementation of a comprehensive digital agenda.14 At 60th, up seven ranks, Azerbaijan reinforces its Among the main outcomes, one can mention the dominance within the CIS, thanks to progress made in 7KH *OREDO ,QIRUPDWLRQ 7HFKQRORJ\\ 5HSRUW  ‹  :RUOG (FRQRPLF )RUXP
    39. 1.1: Gauging the Networked Readiness of Nations world-class e-government services (12th), mirrored by respectively) and the business sector (72nd and 76th, extensive business Internet usage (27th).The country’s respectively). main relative weakness has to do, as in previous years, Despite a score virtually unchanged (3.58), with the quality of the educational system, especially for Argentina (87th) is down 10 positions.The country math and science (107th) and, to a lesser extent, of continues to display serious flaws in the market (128th) research institutions (62nd) and the collaboration and regulatory (120th) environments and a perceived between academia and industry (51st).The upgrading of lack of ICT prioritization in the government’s national educational and research systems should be a priority in agenda (117th and 91st for government readiness and the national competitiveness strategy in the years ahead. usage, respectively).These challenges will need to be Two other Caribbean economies, Puerto Rico addressed in the coming years for Argentina to fully (42nd) and Jamaica (53rd), continue to post a remark- exploit ICT advances for increased competitiveness. able showing, even if both seem to be losing some Peru (89th), Honduras (95th), and Venezuela ground with respect to last year (three and seven places, (96th) follow, while Ecuador (116th), Paraguay respectively). (122nd), Nicaragua (125th), and Bolivia (128th) On a more positive note, Costa Rica (56th) and continue to stagnate at the bottom of the rankings, Colombia (64th) are progressing four and five places, lagging behind the rest of the region and most of the respectively, in the ranking, mainly because of a signifi- world in networked readiness. Overregulated markets, cant improvement in the readiness component from last poor educational and research standards, and high ICT- year: from 48th to 39th and from 64th to 53rd, respec- access costs are some of the obstacles preventing these tively. In particular, both countries get significantly better countries from leveraging more ICT in their national marks for individual readiness (Costa Rica moved from competitiveness strategies. 52nd to 44th, and Colombia from 74th to 63rd) and government readiness (from 66th to 48th for Costa Sub-Saharan Africa and Middle East and Northern Rica, and from 57th to 50th for Colombia). Africa (MENA) Brazil is unchanged at 59th, with a small score Despite some positive trends, sub-Saharan Africa con- improvement (from 3.87 to 3.94).The country’s net- tinues to lag behind the rest of the world by a significant 21 worked readiness is mainly driven by high levels of usage margin, as highlighted by the trend analysis discussed especially by businesses (32nd) and the government above. Among the 26 countries of the region, only two (32nd). Indeed, Brazil is one of the regional and world make it into the top half of the NRI, while 18 rank leaders in e-government services (26th), and the below the 100th mark. Internet is widely used by businesses in their daily trans- At 51st, three positions up from 2007, Mauritius actions (28th). Chapter 2.3 of this Report provides a overtakes South Africa as the most ICT-ready economy thoughtful account of successful Brazilian e-government in the region. Mauritius’ networked readiness is boosted practices and ICT strategy as a tool to reduce the by an excellent market environment (29th), characterized important social and economic divide affecting the by little red tape and low and non-distortive taxes (8th country. On a less positive note, Brazil’s market (119th) and 12th for the extent and effect of taxation and total and regulatory (82nd) environments continue to show tax rate, respectively), among others. important flaws in terms of business and ICT friendliness; South Africa is stable at 52nd.The country’s the soft infrastructure needs to be upgraded, and general satisfactory performance continues to rest on the ICT education and training standards lag behind.This has and business friendly regulatory (26th) and market negative implications on citizens’ readiness to use ICT environments (33rd).While the business sector appears (81st) and contributes to fairly low levels of individual quite disposed to use ICT (36th) and to be leveraging usage (62nd). its latest advances (46th), major weaknesses remain in The other regional giant, Mexico, is down nine individual readiness (80th), due to a mediocre assessment positions from 2007 at 67th and now trails Uruguay of the quality of educational system and high ICT (65th) and Panama (66th). Mexico shows a deterioration access costs.This partly explains South Africa’s low ICT across all nine pillars.The country presents important penetration rates and, therefore, its poor showing in the strengths for leveraging ICT, notably a fairly strong overall individual usage pillar (78th). focus on ICT penetration in the government agenda Progressing one rank, Botswana comes in 77th (62nd in government readiness), which translates into overall and 3rd in sub-Saharan Africa.The country posts high levels of government usage (36th). However, the a major improvement in its environment component country suffers from most of the same weaknesses high- (moving seven places up to 58th), mainly because of lighted for Brazil: that is, an overregulated market envi- progress made in the infrastructure pillar (from 93rd ronment, a poor-quality educational system, and low to 77th). However, the very low levels of usage by R&D investment, coupled with rather low ICT readi- individuals (89th) and businesses (93rd), linked to poor ness and usage by both individuals (74th and 66th, 7KH *OREDO ,QIRUPDWLRQ 7HFKQRORJ\\ 5HSRUW  ‹  :RUOG (FRQRPLF )RUXP
    40. 1.1: Gauging the Networked Readiness of Nations individual and business readiness (67th and 96th, respec- readiness and usage categories, respectively.The country tively) remain areas of particular concern. realizes its largest improvement from 2007 in the envi- For its second appearance, Senegal ranks 80th this ronment component, going up seven places to 32nd in year, up five ranks. Sub-Saharan Africa’s largest country, this dimension.The business environment is assessed as Nigeria (90th), regains some of the ground lost last being quite ICT conducive (24th), with an impressive year. Despite posting the same score as last year, Kenya 1st and 2nd place for the extent and effect of taxation loses five places to come in at 97th. Still below rank and for total tax rate, respectively, and little red tape (5th 100, Zambia progresses 10 places at 102nd. Entering for the burden of government regulation).The challenge just below is Ghana, at 103rd, clustering together with for the country in increasing its innovation potential in the other two African newcomers: Malawi (110th) and the years to come has to do with the quality of its high- Côte d’Ivoire (111th). Among the other countries of er educational and research system, which is assessed as the region, only Lesotho does not lose further ground, being fairly poor and does not seem to provide local lagging, however, at the bottom of the global rankings businesses with a sufficiently large qualified labor pool (118th, up four). (75th for the availability of scientists and engineers). Despite a small drop, Tunisia (38th) continues to At 29th, Qatar continues its rise to the top of the lead the way on the continent. And the gap with respect rankings, with a cumulated seven-place improvement to the rest of Northern Africa is large and widening. since 2006, the year of its first inclusion.The country The country’s successful performance reflects the gov- makes significant progress in all three NRI components ernment’s strong emphasis on ICT diffusion (27th and with gains of 14, two, and three positions in environment 39th for government readiness and usage, respectively) (29th), readiness (26th), and usage (31st), respectively. and rests on a business-friendly regulatory environment Also on a steep upward trend, Bahrain soars eight (29th) and a fairly good preparation of the three main ranks to 37th for a total gain of 13 ranks since its first national stakeholders to use ICT (29th for the readiness NRI appearance in 2006. As for the United Arab component). Emirates and Qatar, the most significant improvements The picture for the rest of the region is rather neg- are observed in the environment component (from 50th ative this year, with all countries losing some ground in to 37th this year). 22 networked readiness with the exception of Libya (up Thanks to progress made across the board, Saudi four positions to 101st). Egypt drops 13 ranks to 76th,15 Arabia (40th) improves by eight positions with respect and Morocco loses 12 to 86th.The case of Algeria is to its inaugural rank last year.While it places 45th or even more worrying, with the country plummeting higher in seven other categories of the NRI, Saudi from 88th to 108th. Arabia’s situation presents serious shortcomings in terms By contrast, the Middle East region continues to of individual readiness (79th), notably the quality of the improve its networked readiness, with all countries but educational system, especially for math and science one appearing in the top half of the NRI ranking. At (85th). As a result, individual usage still remains limited 25th, Israel remains the leader in the region, although (53rd).While Jordan (44th, up three) and Oman (50th, by a tiny margin. A member of the top 20 from 2001 to also up three) are on the rise, Kuwait (57th) drops five 2007 consecutively, the country drops seven places this places. Much lower in the rankings, Syria realizes an year, as a result of a poorer assessment in the area of outstanding 16-place jump to 94th rank as the result of individual readiness (34th) and individual usage (28th). a remarkable strengthening of individual and business Both the market environment (17th) and the political readiness. and regulatory framework (34th) deteriorate significant- ly.This does not put into question the fundamentals of Conclusions Israel’s prowess in networked readiness and innovation, Networked readiness has proven to be an important ele- confirmed by its impressive 5th position in the world ment in the development and competitiveness strategy for the number of utility patents (154.3 in 2007), cou- of many countries.The successful development stories pled with its 24th position for high-tech exports (12.7 highlighted in this chapter show that a consistent focus percent of total exports). Indeed, Israel’s recent develop- in the national agenda on educational excellence, ment history is another inspiring example of a small, innovation, and extensive ICT access is instrumental for resource-poor country turned into a global high-tech both developed countries, to maintain their competitive player in less than 30 years, thanks to a government’s edge, and developing economies, to leapfrog to higher coherent vision and strategy in this area.16 stages of development and facilitate the structural trans- The United Arab Emirates (UAE) is up two formation of their economies and societies. positions at 27th, almost closing the gap with Israel. As In the current severe economic downturn, policy- already mentioned in the historical trend analysis above, makers and civil society should not forget the power of the government’s push for ICT diffusion and usage has innovation, and ICT in particular, as enabler of econom- been impressive in recent years, as reflected by the ic growth and modernization. Public and private invest- country’s 9th and 16th position in the government 7KH *OREDO ,QIRUPDWLRQ 7HFKQRORJ\\ 5HSRUW  ‹  :RUOG (FRQRPLF )RUXP
    41. 1.1: Gauging the Networked Readiness of Nations ment in R&D and in ICT infrastructure should not be 12 For a more in-depth review of Estonia’s ICT development story, see Dutta 2007. sacrificed for the sake of budget cuts, since these are not 13 See Dahl and Lopez-Claros 2006. only key for reinforcing national capacity to recover in the short term, but also to sustaining the innovation and 14 For a full account of Chile’s ICT strategy, see Alvarez Voullième et al. 2005. growth potential of an economy in the longer term. 15 In Egypt’s case, the dramatic fall in ranking does not correspond We hope the Networked Readiness Framework, to a fall in the absolute performance of the country, but rather to the NRI benchmarking exercise, and the insightful the fact that other countries have progressed more rapidly. Indeed, Egypt even improves its score slightly from 2007 (3.76 papers included in this Report will help to raise aware- compared with 3.74 last year). ness on the issue, by showcasing best policies and success 16 See Lopez-Claros and Mia 2006 for more details on Israel’s suc- stories and to underscore the link between economic cess story. growth and networked readiness also in times of global economic crisis. References Al-Jaber H. and S. Dutta. 2008. Qatar: Leveraging Technology to Create Notes a Knowledge-Based Economy in the Middle East. The Global Information Technology Report 2007–2008: Fostering Innovation 1 See ceBIT Australia 2008a. through Networked Readiness. Hampshire: Palgrave McMillan. 2 CeBIT Australia 2008b. 133–44. 3 With a caveat: the NRI used in the first 2001–2002 edition of the Alvarez Voullième, C., C. Capdevila de la Cerda, F. Flores Labra, A. Report is not strictly comparable with the one developed by Foxley Rioseco and A. Navarro Haeussler. 2005. “Information and INSEAD in 2002 and used since then as the main methodological Communication Technologies in Chile: Past Efforts, Future framework in the GITR series. For more information on the Challenges.” The Global Information Technology Report 2001–02 theoretical framework, see Kirkman et al. 2002. 2005–2006: Leveraging ICT for Development. Hampshire: Palgrave Macmillan. 71–88. 4 For further details on the Networked Readiness framework and its theoretical conception, see Dutta 2003. Browne, C., R. Bryden, M. Delgado and T. Geiger. 2008.”The Executive Opinion Survey: Capturing the Voice of the Business 5 Until 2005–06, NRI variables were selected using factor analytical Community.” The Global Competitiveness Report 2008–2009. techniques from a larger set of possible variables. Although this Geneva: World Economic Forum. 67–77. was a technically rigorous approach, it reduced the ability to easily explain the underlying logic for including specific variables and to CeBIT Australia. 2008a.”IDC Slashes 2009 Forecasts.” November 14. make strict comparisons over time. As a consequence, starting Available at http://www.gocebit.com.au/?q=news/idc-slashes- 23 from the 2006–07 edition, expert opinion has played a predomi- 2009-forecasts. nant role in selecting the variables, obviously with the benefit of CeBIT Australia. 2008b. “Mobile Sales Crash as GFC Bites.” November previous experience in identifying appropriate variables for com- 28. Available at http://www.gocebit.com.au/?q=news/mobile- puting the NRI, thus aligning the NRI’s to the Forum’s general sales-crash-gfc-bites. competitiveness methodology. Also the treatment of missing vari- ables has changed: whereas until 2005–06, those were estimated Dahl, A. and A. Lopez-Claros. 2006. “The Impact of Information and using analytical techniques such as regression and clustering, Communication Technologies on the Economic Competitiveness beginning in 2006–07 they are indicated with “n/a” and not taken and Social Development of Taiwan.” The Global Information into consideration in the calculation of the specific pillar to which Technology Report 2005–2006: Leveraging ICT for Development. they belong. Moreover, the scale used to compute the NRI and its Hampshire: Palgrave Macmillan. 107–18. composing variables has been aligned to the Forum’s (increasing) 1–7 scale, changing with respect to the scale used previously for Dutta, S. and A. Jain. 2006. “Networked Readiness and the a couple of years (i.e., positive and negative scores around a stan- Benchmarking of ICT Competitiveness.” The Global Information dardized mean of 0). For more detailed information on the old Technology Report 2005–2006: Leveraging ICT for Development. computation methodology and the changes introduced in Hampshire: Palgrave Macmillan. 3–24. 2006–07, see Dutta and Jain 2006 and Mia and Dutta 2007. Dutta, S. and I. Mia, eds. 2008. The Global Information Technology 6 No specific reference is made to North America as a region in this Report 2007–2008: Fostering Innovation through Networked chapter, since the performances of the United States and Canada Readiness. Hampshire: Palgrave McMillan. are detailed in the top 10 section, while Mexico is included, for Dutta, S. 2007. “Estonia: A Sustainable Success in Networked analysis purposes, in the Latin America and the Caribbean sec- Readiness?” The Global Information Technology Report tion. 2006–2007: Connecting to the Networked Economy. Hampshire: 7 An important element of the government’s ICT prioritization was Palgrave McMillan. 81–90. the liberalization of the telecommunications sector in 1996, well Dutta, S., A. de Meyer, A. Jain, and G. Richter. 2006. The Information ahead of most fellow members of the European Union. This also Society in an Enlarged Europe. Berlin: Springer-Verlag. contributed to the development of a world-class local high-tech industry, whose exports accounted in 2006 for 20 percent of total Dutta, S., B. Lanvin, and F. Paua, eds. 2003. The Global Information exports, earning Denmark 24th place in this dimension of the Technology Report 2002–2003: Readiness for the Networked Index. World. New York: Oxford University Press 8 See Sala-i-Martin et al. 2008. Dutta, S. and A. Jain. 2003. “The Networked Readiness of Nations.” The Global Information Technology Report 2002–2003: Readiness 9 For a more detailed analysis of Singapore’s ICT success story, see for the Networked World. New York: Oxford University Press. Ng et al. 2008. 2–25. 10 Included in the EU15 are the countries that joined the European Haacker M. 2007. “Access to Communications Services in Sub-Saharan Union before the last two accession rounds in 2004 and 2007, Africa.” The Global Information Technology Report 2006–2007: namely Austria, Belgium, Denmark, Finland, France, Germany, Connecting to the Networked Economy. Hampshire: Palgrave Greece, Ireland, Italy, Luxembourg, the Netherlands, Portugal, McMillan. 91–106. Spain, Sweden, and the United Kingdom. International Monetary Fund (IMF). 2008. World Economic Outlook 11 The 12 EU accession countries are Bulgaria, the Czech Republic, Database. October. Washington, DC: International Monetary Fund. Cyprus, Estonia, Hungary, Latvia, Lithuania, Malta, Poland, Romania, Slovak Republic, and Slovenia. 7KH *OREDO ,QIRUPDWLRQ 7HFKQRORJ\\ 5HSRUW  ‹  :RUOG (FRQRPLF )RUXP
    42. 1.1: Gauging the Networked Readiness of Nations Kirkman, G., P. Cornelius, J. Sachs, and K. Schwab, eds. 2002. The Global Information Technology Report 2001–2002: Readiness for the Networked World. New York: Oxford University Press. Kusakabe M. and P. Moffatt. 2004. Information and Communication Technology, Policy Reform and Rural Communication Infrastructure. London: European Bank of Reconstruction and Development. Lopez-Claros, A. and I. Mia. 2006. “Israel: Factor in the Emergence of an ICT Powerhouse.” The Global Information Technology Report 2005–2006: Leveraging ICT for Development. Hampshire: Palgrave Macmillan. 89–105. Lopez-Claros, A., L. Altinger, J. Blanke, M. Drzeniek, and I. Mia. 2006 “Assessing Latin American Competitiveness: Challenges and Opportunities.” The Latin America Competitiveness Review 2006. Geneva: World Economic Forum. 1–36. Mia, I. and S. Dutta. 2007. “Connecting the World to the Networked Economy: A Progress Report Based on the Findings of the Networked Readiness Index 2006–2007.” The Global Information Technology Report 2006–2007: Connecting to the Networked Economy. Hampshire: Palgrave McMillan. 3–21. Mia, I. and S. Dutta. 2008. “Assessing the State of the World’s Networked Readiness: Insight of the Networked Readiness Index 2007-2008.“ The Global Information Technology Report 2007–2008: Fostering Innovation through Networked Readiness. Hampshire: Palgrave McMillan. 3–22. Ng, C. K., L. L. Ong , T. Tang, and S. Dutta. 2008. “Singapore: Building an Intelligent Nation with ICT”. The Global Information Technology Report 2007–2008: Fostering Innovation through Networked Readiness. Hampshire: Palgrave McMillan. 121-132. OECD (Organisation of Economic Co-operation and Development). 2005. Good Practice Paper on ICTs for Economic Growth and Poverty Reduction. Paris: OECD Sala-i-Martin X., J. Blanke, M. Drneziek Hanouz, T. Geiger, I. Mia, and F. 24 Paua. 2008. “The Global Competitiveness Index: Prioritizing the Economic Policy Agenda.” The Global Competitiveness Report 2008–2009. Geneva: World Economic Forum. 3–41. Trajtenberg, M. 2006. “Innovation Policy for Development: An Overview.” Foerder Institute for Economic Research, WP 6-06, July. 7KH *OREDO ,QIRUPDWLRQ 7HFKQRORJ\\ 5HSRUW  ‹  :RUOG (FRQRPLF )RUXP
    43. 1.1: Gauging the Networked Readiness of Nations Technical Appendix: Composition and computation of the Networked Readiness Index 2008–2009 This appendix presents the structure of the Networked 3rd pillar: Infrastructure environment 3.01 Telephone lines (hard data) Readiness Index (NRI).The NRI separates environ- 3.02 Secure Internet servers (hard data) mental factors from ICT readiness and usage, and is 3.03 Electricity production (hard data) composed of three subindexes. Each subindex is divided 3.04 Availability of scientists and engineers into three pillars.The 68 variables (or indicators) used in 3.05 Quality of scientific research institutions the computation of the NRI are then distributed 3.06 Tertiary enrollment (hard data) among the nine pillars.a 3.07 Education expenditure (hard data) The numbering of the variables matches the numbering of the Data Tables found at the end of the Report.The Readiness subindex number preceding the period indicates to which pillar Readiness = 1/3 Individual readiness the variable belongs (e.g., variable 1.01 belongs to the + 1/3 Business readiness first pillar; variable 9.02 belongs to the ninth pillar). + 1/3 Government readiness The hard data indicators used in the NRI are normal- ized on a 1-to-7 scale in order to align them with the 4th pillar: Individual readiness Executive Opinion Survey’s results.b The Technical 4.01 Quality of math and science education 4.02 Quality of the educational system Notes and Sources at the end of this Report provide 4.03 Internet access in schools detailed information on all the hard data indicators. 4.04 Buyer sophistication 4.05 Residential telephone connection charge (hard data) 4.06 Residential monthly telephone subscription (hard data) 4.07 High-speed monthly broadband subscription (hard data) NETWORKED READINESS INDEX 4.08 Lowest cost of broadband (hard data) 4.09 Cost of mobile telephone call (hard data) Networked Readiness Index = 1/3 Environment component subindex 5th pillar: Business readiness + 1/3 Readiness component subindex 5.01 Extent of staff training 25 + 1/3 Usage component subindex 5.02 Local availability of specialized research and training services 5.03 Quality of management schools Environment subindex 5.04 Company spending on R&D 5.05 University-industry research collaboration Environment subindex = 1/3 Market environment + 1/3 Political and regulatory environment 5.06 Business telephone connection charge (hard data) + 1/3 Infrastructure environment 5.07 Business monthly telephone subscription (hard data) 5.08 Local supplier quality 1st pillar: Market environment 5.09 Local supplier quantity 1.01 Venture capital availability 5.10 Computer, communications, and other services 1.02 Financial market sophistication imports (hard data) 1.03 Availability of latest technologies 1.04 State of cluster development 6th pillar: Government readiness 1.05 Utility patents (hard data) 6.01 Government prioritization of ICT 1.06 High-tech exports (hard data) 6.02 Government procurement of advanced technology 1.07 Burden of government regulation products 1.08 Extent and effect of taxation 6.03 Importance of ICT to government vision of the future 1.09 Total tax rate (hard data) 6.04 E-Government Readiness Index (hard data) 1.10 Time required to start a business (hard data) 1.11 Number of procedures required to start a business (hard data) Usage subindex 1.12 Intensity of local competition Usage = 1/3 Individual usage 1.13 Freedom of the press + 1/3 Business usage 1.14 Accessibility of digital content + 1/3 Government usage 2nd pillar: Political and regulatory environment 7th pillar: Individual usage 2.01 Effectiveness of law-making bodies 7.01 Mobile telephone subscribers (hard data) 2.02 Laws relating to ICT 7.02 Personal computers (hard data) 2.03 Judicial independence 7.03 Broadband Internet subscribers (hard data) 2.04 Intellectual property protection 7.04 Internet users (hard data) 2.05 Efficiency of legal framework for disputes 7.05 Internet bandwidth (hard data) 2.06 Property rights 2.07 Quality of competition in the ISP sector 2.08 Number of procedures to enforce a contract (hard data) (Cont’d.) 2.09 Time to enforce a contract (hard data) 7KH *OREDO ,QIRUPDWLRQ 7HFKQRORJ\\ 5HSRUW  ‹  :RUOG (FRQRPLF )RUXP
    44. 1.1: Gauging the Networked Readiness of Nations Technical Appendix: Composition and computation of the Networked Readiness Index 2008–2009 (cont’d.) 8th pillar: Business usage 8.01 Prevalence of foreign technology licensing 8.02 Firm-level technology absorption 8.03 Capacity for innovation 8.04 Availability of new telephone lines 8.05 Extent of business Internet use 9th pillar: Government usage 9.01 Government success in ICT promotion 9.02 Availability of government online services 9.03 ICT use and government efficiency 9.04 Presence of ICT in government offices 9.05 E-Participation Index (hard data) Notes a The computation of the NRI is based on successive aggregations of scores, from the variables level (i.e., the lowest level) to the overall NRI score (i.e., the highest level). For example, the score a country achieves in the 3rd pillar, Infrastructure environment, accounts for one third of the Environment subindex. Similarly, the Usage subindex accounts for one third of the overall NRI score. b The standard formula for converting hard data is the following: country score – sample minimum ( ) 6x +1 sample maximum – sample minimum The sample minimum and sample maximum are, respectively, the lowest and highest country scores in the sample of countries covered by the NRI. In some instances, adjustments were made 26 to account for extreme outliers. For those hard data variables for which a higher value indicates a worse outcome (e.g., total tax rate, time to enforce a contract), we rely on a normalization formula that, in addition to converting the series to a 1-to-7 scale, reverses it, so that 1 and 7 still correspond to the worst and best possible outcomes, respectively: country score – sample minimum ( ) –6 x +1 sample maximum – sample minimum 7KH *OREDO ,QIRUPDWLRQ 7HFKQRORJ\\ 5HSRUW  ‹  :RUOG (FRQRPLF )RUXP
    45. 1.2: Mobile Telephony CHAPTER 1.2 Mobile telephony occupies a special place among the various information and communication technologies (ICT) that have emerged in recent decades, in terms of Mobile Telephony: A Critical both its stellar diffusion and its impact on economic growth and poverty reduction. Enabler of Networked In particular, mobile communications penetration has boomed in developing countries, helping them to Readiness? compensate for an often underdeveloped and flawed fixed telephony infrastructure and offering a promising THIERRY GEIGER, World Economic Forum tool to increasingly lift their citizens out of poverty and IRENE MIA, World Economic Forum improve the efficiency of their markets and economies. The total number of mobile telephone subscribers in the developing world is more than twice that of advanced economies.1 This, as pointed out by Kalil,2 can be explained by a number of factors, including the rela- tive ease of deploying mobile infrastructure versus land- line phones; a more liberal regulation of mobile service provision in most countries, favoring competition; the decreasing cost of mobile handsets; and the possibility of sharing phones and buying pre-paid cards. The above trend bodes well for reducing the digital and economic divide between developing and devel- oped economies, given the extensive body of literature and the evidence pointing to the economic and social benefits of mobile telephony. In line with the theme of mobility, this chapter 27 aims to further explore the connection between mobile telephony and economic growth and development, as well as identify the impact, if any, of mobile technolo- gies on countries’ networked readiness, as captured by the Networked Readiness Index (NRI) featured in this Report. Does mobile penetration, used here as a proxy for “mobile readiness,” affect general networked readiness and, if so, does it do so equally for all countries, regardless of their development level? After a brief overview of the evolution of mobile penetration in recent years, the chapter will focus on mobile telephony and its impact on GDP and net- worked readiness. Mobile penetration across the world: A remarkable success story of our day There is no doubt that mobile telephony has been not only among the most revolutionary technologies of the last couple of decades, but also among the most adopted and rapidly spreading in the developed and developing world. A comparison with Internet diffusion is quite telling. Although often the Internet is mentioned among the fastest-growing technologies worldwide, a glance at Figure 1 shows that Internet penetration has indeed expanded over the last 20 years, but not as fast as mobile telephony. Using ITU data, we estimate that the number of mobile telephone users increased from 11.1 million in 1990 to 3.2 billion in 2007.The number of Internet users went from 2.6 million to 1.2 billion over the same period. 7KH *OREDO ,QIRUPDWLRQ 7HFKQRORJ\\ 5HSRUW  ‹  :RUOG (FRQRPLF )RUXP
    46. 1.2: Mobile Telephony Figure 1: Mobile telephony penetration and Internet usage, 1990–2007 ■ Total mobile telephone subscribers 3,500 50 ■ Total Internet users 3,000 Population-weighted mobile telephony penetration 40 Population-weighted Internet penetration Users per 100 population 2,500 Users (millions) 30 2,000 1,500 20 1,000 10 500 0 0 1990 1991 1992 1993 1994 1995 1996 1997 1998 1999 2000 2001 2002 2003 2004 2005 2006 2007* Source: Authors' calculations, based on ITU, 2008. *Preliminary data 28 Figures 2 to 4 complement Figure 1, providing This is partly explained by the fact that mobile more detailed information on the growth of mobile technology has allowed many developing countries to telephony penetration across the world and by income leapfrog the lack of fixed infrastructure and thus provide group.3 These figures also illustrate how the growth has access to telephony services to a much larger portion of been particularly impressive in low-income countries. their citizens. Figure 2 describes the evolution in absolute mobile Mobile technology’s relative simplicity for being telephony penetration by income group. It shows deployed and used, together with its versatility and the notably that the group of low-income countries has diminishing costs of both handsets and calls, have been increased the most: between 1995 and 2006, the number some of the key enablers in its impressive diffusion. of subscribers grew by an average 90 percent annually, In terms of versatility, even without considering the compared with an annual average of 26 percent and 36 most advanced—and expensive—mobile applications percent for OECD and non-OECD high-income being constantly developed and adopted in the rich part countries, respectively.This is a very positive trend, of the world, there are plenty of examples that illustrate although these data should be taken with some precau- how mobile phones can facilitate business and enable tion: low-income countries started from a much lower access to markets and to services, not to mention social penetration basis than high-income ones and, as shown life. According to the United Nations Conference on in Figure 3, the story told by population-weighted aver- Trade and Development (UNCTAD), for example, age penetration rates is rather less rosy, with a penetra- mobile phones have become the most widely used form tion still limited to 18 percent of the population in low- of ICT by African businesses to deal with their clients and providers.5 More generally, m-commerce is becom- income countries in 2007 versus 107 percent and 114 percent for OECD and non-OECD high-income ing an important modality of selling and buying goods countries, respectively.4 in the developing world, which is also facilitated by Another way to gauge the growing importance of banking and payment via mobile phones. mobile telephony globally is to analyze the share of Regarding costs, Figure 5 shows the evolution in mobile subscribers in total telephone subscribers since mobile call costs in basis points (hundredths of percent- 1990. As Figure 4 illustrates, not only has this share risen age points) of GDP per capita since 1995. Despite large globally from 2.1 percent in 1990 to 77.3 percent in fluctuations, partly attributable to data availability issues, 2007, but, quite predictably, the most marked rise has telephony costs have been declining not only for devel- come from low-income countries, where it has gone oped countries but also for low-income ones.This trend from 0 percent in 1990 to 86.3 percent in 2007. is reinforced and complemented by a dramatic reduction 7KH *OREDO ,QIRUPDWLRQ 7HFKQRORJ\\ 5HSRUW  ‹  :RUOG (FRQRPLF )RUXP
    47. 1.2: Mobile Telephony Figure 2: Growth of mobile telephony penetration rate, 1995–2006 Low income High income: Non-OECD Mobile 150 200 Lower middle income High income: OECD subscribers in low-income Upper middle income countries 120 150 90 Millions Percent 100 60 50 30 0 0 1995 1996 1997 1998 1999 2000 2001 2002 2003 2004 2005 2006 Source: Authors' calculations, based on ITU, 2008. 29 Figure 3: Population-weighted average mobile penetration rate, 1990–2007 120 High income: OECD High income: Non-OECD Mobile subscribers per 100 population 100 Upper middle income Lower middle income Low income 80 60 40 20 0 1990 1991 1992 1993 1994 1995 1996 1997 1998 1999 2000 2001 2002 2003 2004 2005 2006 2007 Source: Authors' calculations, based on ITU, 2008. 7KH *OREDO ,QIRUPDWLRQ 7HFKQRORJ\\ 5HSRUW  ‹  :RUOG (FRQRPLF )RUXP
    48. 1.2: Mobile Telephony Figure 4: Share of mobile subscribers in total telephone subscribers, 1990–2007 100 High income: OECD High income: Non-OECD Upper middle income 80 Lower middle income Low income 60 Percent 40 20 0 1990 1991 1992 1993 1994 1995 1996 1997 1998 1999 2000 2001 2002 2003 2004 2005 2006 2007 Source: Authors’ calculations, based on ITU, 2008. 30 in the cost of handsets, which have come down to as more the case for industries and sectors intensive in little as US$15 in some developing countries. information. The costs for the poorest segment of the population On a similar note, mobile phones can be used in developing countries could be further reduced with to send personalized job listings to job seekers, thus some relatively simple changes in billing practices. For improving the functioning of labor markets. instance, Barrantes et al. found that access to mobile services would be greatly expanded in Latin America if • Larger access to financial services. Mobile banking and the mobile phone operators would allow billing practices mobile payments represent a cheap alternative for per second or “mini-recharges” of the pre-paid cards.6 the poor in developing countries to gain access to the formal financial market and consequently to credit, insurance, and money transfers. In particular, Mobile technology: Impact on GDP growth and mobile telephony facilitates remittances to develop- countries’ networked readiness ing countries, making them easier and cheaper.This There is extensive literature and much evidence about has a special relevance for growth, since remittances the economic and social benefits associated with mobile nowadays represent more than double the amount telephony. In particular, a number of studies have of foreign aid to the developing world and are demonstrated the positive impact of mobile penetration therefore among the most important sources of on economic growth and development,7 which also has finance in many countries.8 an important bearing on poverty reduction and on bridging the digital divide. • Job creation. Investment in mobile network infra- This impact on economic growth takes a variety structure and related services directly and indirectly of forms, which can be grouped into a number of sub- generates employment opportunities. categories.These include: • More efficient provision of health-care services. Mobile • Improvement of market and business efficiency. The phones have proven to be a very helpful introduction and usage of mobile telephony can complement in the collection of health data, and provide economic operators with better access to they are key for better health-care provision and the the goods markets and information they need to treatment of patients (for instance, in reminding manage their business more effectively.This is even patients via short message service (SMS) of the medication they need to take). 7KH *OREDO ,QIRUPDWLRQ 7HFKQRORJ\\ 5HSRUW  ‹  :RUOG (FRQRPLF )RUXP
    49. 1.2: Mobile Telephony Figure 5: Mobile call cost as a share (basis points) of GDP per capita, 1995–2006 0.20 High income: OECD High income: Non-OECD Upper middle income 0.15 Lower middle income Low income Basis points 0.10 0.05 0.00 1995 1996 1997 1998 1999 2000 2001 2002 2003 2004 2005 2006 Source: Authors’ calculations, based on ITU, 2008. Note: A call is a three-minute call during peak period. Country groups’ average costs are weighted by country population. 31 These illustrations seem to suggest that mobile Mobile telephony and networked readiness telephony and its applications have a greater impact in After having explored how mobile telephony contributes the developing world, where their deployment can yield to economic growth, the relationship between mobile enormous productivity gains. For advanced economies, telephony and networked readiness is examined—that which are approaching the technological frontier, such is, countries’ capacity to leverage ICT for development. gains will necessarily be smaller. Enhanced productivity, To what extent do the spillovers generated by the usage in turn, is a major source of economic growth and, of mobile telephony translate into enhanced networked hence, increased prosperity.The relationship between readiness as captured by the NRI? mobile telephony usage and economic prosperity should One straightforward way to analyze the relation therefore be stronger for the least-developed countries. between mobile telephony diffusion and the NRI is to Figure 6 plots mobile telephony penetration, which simply compute the correlation between the 2007 we use as a proxy of mobile readiness, against the log of mobile telephony penetration rates for the 134 coun- GDP per capita (valued at purchasing power parity) to tries covered in this Report and their respective scores on explore whether the above hypothesis is correct. the NRI 2008–2009.11 This generates an R2 of 0.75, As can be seen from the figure, the relation since countries with high mobile penetration rates tend between mobile penetration and GDP per capita is a to score well in the NRI, although the high correlation positive one. A simple regression of GDP per capita on does not necessarily entail a causality link at this stage. penetration rates yields a high R2 of 0.76.9 Yet as wealth Furthermore, the basic scatter plot presented in increases, the relation gets looser. It totally breaks down Figure 7 reveals the existence of a “glass ceiling” in for advanced economies.When considering only the 88 terms of networked readiness (Y-axis) around the middle developing countries that belong to the low-income or score of 4.0. Only countries with penetration rates middle-income groups, the R2 is 0.70. For the 44 high- higher than the median rate of 73.2 mobile subscribers income countries, the R2 is almost zero (0.03).10 per 100 population seem to break through this ceiling. These findings appear to corroborate the fact that There are very few exceptions. Out of 134 countries, mobile penetration is particularly relevant for develop- only five (4 percent) combine an NRI score above the ing countries as an enabler of increased growth, while it middle score and a penetration rate below the average becomes less crucial as a country evolves to higher rate. Among these, Canada is in a league of its own.The stages of development. country ranks 10th in the NRI, with just 61.7 mobile subscribers per 100 population, largely below the medi- an rate.The other four countries are located either at 7KH *OREDO ,QIRUPDWLRQ 7HFKQRORJ\\ 5HSRUW  ‹  :RUOG (FRQRPLF )RUXP
    50. 1.2: Mobile Telephony Figure 6: GDP per capita and mobile penetration rate, 2007 100,000 Log of GDP (PPP) per capita 10,000 High income: OECD High income: Non-OECD Upper middle income 1,000 Lower middle income Low income 100 0 20 40 60 80 100 120 140 160 180 200 Mobile subscribers per 100 population Source: ITU, 2008; IMF, 2008. Note: Montenegro and Puerto Rico not included due to limited data availability. 32 Figure 7: Mobile penetration and networked readiness, 2007 7 MEDIAN I II 6 Canada 5 NRI 2008–2009 score Tunisia China Mauritius India 4 3 III IV 2 1 0 20 40 60 80 100 120 140 160 180 Mobile subscribers per 100 population, 2007 Source: World Economic Forum; ITU, 2008. 7KH *OREDO ,QIRUPDWLRQ 7HFKQRORJ\\ 5HSRUW  ‹  :RUOG (FRQRPLF )RUXP
    51. 1.2: Mobile Telephony Figure 8: Mobile telephony and networked readiness over time 2001–2002 2003–2004 2007–2008 7 2002–2003 2006–2007 2008–2009 I II 6 NRI 2008–2009 score 5 4 3 2 III IV 1 0 50 100 Mobile telephony penetration rate (percentile) Source: World Economic Forum; ITU, 2008. 33 the very bottom of panel I, such as India (with an NRI The results are represented in Figure 8, which looks score of 4.02 and 20 subscribers per 100 population) very similar to Figure 7. North of the 4.0 value on the and China (4.15 and 41), or at the very right of the Y-axis and east to the median rate on the X-axis, the panel, such as Mauritius (4.07 and 74) and Tunisia (4.34 northwest quadrant (Panel I) appears very scarcely pop- and 76). ulated. As a matter of fact, out of the 638 considered We also carried out a similar analysis with historical data points, only 20, or 3 percent, belong to that panel. data.We compared NRI scores from six of the eight This is a remarkable result considering that, over this editions of the NRI, including the earliest and the latest, eight-year period, mobile telephony diffusion increased, and the mobile penetration rates for the corresponding depending on the region, anywhere from 2 to 40 times. years.12 This represents 638 pairs of scores and penetra- All countries, including the least advanced, have seen tion rates. In order to deal with the increase in penetra- mobile telephony usage grow dramatically.Yet the ceil- tion rates, for each year we convert penetration rates ing has not disappeared. Only a handful of countries into percentile rankings. For each year a percentile rank have managed to move from Panel III to Panel I over of 0, 100, and 50 corresponds to the lowest, highest, and the past eight years—that is, to overperform in the NRI median penetration rate, respectively, within the sample with a mobile penetration below the median rate.These of countries for that year.This way we can overlay on are China, India, Jamaica, Mauritius, and Thailand. Four one single chart the results of several editions. other countries—Canada, Italy, Netherlands, and The same transformation is not necessary for the Barbados—continue to overperform in the NRI with NRI scores.The NRI overall score is an average of rela- respect to their mobile penetration despite falling tive scores.13 Hard data indicators are normalized so that behind in terms of mobile telephone usage. Finally, the best- and worst-performing countries in the sample Puerto Rico and Tunisia have remained in Panel I since receive a relative score of 7 and 1, respectively.14 The their first inclusion. absolute scores of the other countries are rescaled linear- Out of the 20 combinations inside Panel I, the ly so that the distances between them remain propor- biggest outlier is Canada—both in 2007–2008 (43rd tional.The normalization is redone every year and con- percentile for mobile penetration rate and NRI score of siders only the value of the current year.This is why 5.29) and in 2008–2009, as discussed above. All the NRI scores do not increase from year to year even if the other cases are relatively close to the frontier with the underlying indicators’ values do.They always range other quadrants. between 1 and 7. Although a low mobile penetration rate (i.e., below the median rate) seems to virtually disqualify a country 7KH *OREDO ,QIRUPDWLRQ 7HFKQRORJ\\ 5HSRUW  ‹  :RUOG (FRQRPLF )RUXP
    52. 1.2: Mobile Telephony from reaching the top positions in the NRI rankings, Notes the converse is not true. High mobile telephony diffu- 1 According to ITU data, in 2007 there were some 2.4 billion sub- scribers in the developing world (low-income, lower-middle- sion does not necessarily lead to a high level of net- income, and upper-middle-income countries) as opposed to 920 worked readiness. Returning to the NRI 2008–2009 million in high-income countries. results and 2007 penetration rates (displayed in Figure 2 See Kalil 2008. 7), we see that 18 of the 67 countries with penetration 3 In this chapter, we use the World Bank’s “World by Income” rates above the median rate score 4.0 or lower in the country classification (as of December 2008). The classification is based on 2006 gross national income (in US dollars) per capita. NRI.15 The same pattern holds true when one takes The four income groups are defined as follows: Low income: into consideration the results from all editions of the $905 and less; lower middle income: $906–$3,595; upper middle income: $3,596–$11,115; high income: $11,116 and more. Report (reference is made to Figure 8). Out of the 307 combinations with a penetration rate above the median 4 Population-weighted average penetration rates are calculated using estimates based on 164 countries for which 2007 data (Panels II and IV), 78, or 25 percent, have an NRI score were available. lower than 4.0. 5 UNCTAD 2007. Another interesting observation is that, although 6 Barrantes et al. 2007. clearly positive, the relationship between mobile teleph- 7 For a review of the literature in question, see De Silva and ony usage and networked readiness gets looser as usage Zainudeen 2007 and Chapter 1.4 of this Report. increases.This can be clearly seen in Figures 7 and 8, 8 See Kalil 2008, p. 10. and the correlation coefficients provide further evi- 9 Only the countries covered in this Report were considered. dence. Considering only the points inside Panel III in Though covered, Puerto Rico and Montenegro were not included Figure 7, the correlation between the two series is 0.58. because of the unavailability of PPP estimates for these countries. For points inside Panel II, the correlation is only 0.13. GDP data are from 2007 for all countries. Mobile telephony data are from 2007 for 119 countries, from 2006 for 10 countries, and Again, this observation continues to apply when consid- from 2005 for 3 countries. ering the historical data. Correlation for the sample of 10 Admittedly, the number of observations affects the coefficient of points inside Panel III (311 points) of Figure 8 is 0.60 determination, yet it cannot alone account for this huge difference. while it drops to 0.20 for the 229 points inside Panel II. 11 Mobile telephony penetration, measured by the number of mobile telephone subscribers per 100 population, is one of the 68 indica- tors entering the NRI, but that by itself is not enough to draw any 34 conclusion as to the nature of the relationship. Given the very Conclusion small implicit weight of each indicator—mobile telephony penetra- Building on the overall theme of this Report and tion accounts for 1.2 percent of the overall score—this is unlikely to cause an endogeneity problem that would make the analysis previous studies on the impact of mobile telephony spurious. on economic growth, this chapter is an attempt to pro- 12 We included in the analysis the 2001–2002, 2002–2003, vide some clarity on the relationship and interrelations 2003–2004, 2006–2007, 2007–2008, and 2008–2009 editions of the NRI. The 2004–2005 and 2005–2006 editions use a different existing between mobile telephony diffusion and the methodology for score computation and the results are not on the capacity of countries to use ICT to improve their traditional 1-to-7 scale. For the 2001–2002 edition, we used pene- competitiveness, as measured by the NRI. One would tration rates from 2000; for 2002–2003, we used 2001, and so on. logically expect that mobile readiness has a strong 13 Unlike percentile ranking, which is an ordinal measure (only the order of the values of the underlying data matters), the normaliza- impact on overall networked readiness of countries and tion of the hard data yields a cardinal measure (both the order and therefore on sustained economic growth and develop- the value of the underlying data matter). ment. Our analysis shows that this supposition is true, 14 The general normalization formula is: but only to a certain extent.While the latest data as well country score – sample minimum ( ) 6x +1 as historical data demonstrate that only a handful of sample maximum – sample minimum countries with low mobile telephony penetration rates 15 Yet only the upper right corner of quadrant IV in Figure 7 is popu- achieve above-average networked readiness levels, we lated, meaning that no country with above-median penetration found that high mobile telephony penetration is not rates appears in the bottom tier—a score less than 3—of the NRI ranking. inevitably synonymous with high networked readiness. Mobile telephony usage, therefore, appears to be a necessary but not sufficient condition of enhanced References networked readiness.We also observed that the relation Barrantes R., A. Agüero, H. Galperin, and A. Molinari. 2007. between mobile telephony usage and GDP per capita is Asequibilidad de los Servicios de Telefonía Móvil en América clearly positive, but is about three times as strong among Latina. Report. Diálogo Regional sobre Sociedad de la Información low- and lower-middle-income countries.This suggests (DIRSI). that the booming mobile phone penetration rates Dasgupta S., S. Lall, and D. Wheeler. 2001. “Policy Reform, Economic Growth and the Digital Divide: An Econometric Analysis.” Policy observed in poor countries in recent years can indeed Research Working Paper No. 2567. Washington, DC: The World help them reduce poverty and foster economic Bank. performance. Deloitte. 2007. Global Mobile Tax Review 2006–2007. London and Dublin: GSMA. Available at http://www.gsmworld.com/ documents/tax_review_06_07.pdf. 7KH *OREDO ,QIRUPDWLRQ 7HFKQRORJ\\ 5HSRUW  ‹  :RUOG (FRQRPLF )RUXP
    53. 1.2: Mobile Telephony De Silva, H. and A. Zainudeen. 2007. “Poverty Reduction through Telecom Access at the ‘Bottom of the Pyramid.’“ Paper presented at the Centre for Poverty Analysis Annual Symposium on Poverty Research in Sri Lanka , December 6–7, Colombo. Galperin, H. and J. Mariscal. 2007. Mobile Opportunities: Poverty and Telephony Access in Latin America and the Caribbean. Report, November. Diálogo Regional sobre Sociedad de la Información (DIRSI). IMF (International Monetary Fund). 2008. World Economic Outlook Database, October. Washington, DC: International Monetary Fund. ITU (International Telecommunication Union). 2008. World Telecommunication/ICT Indicators 2008 (CD-Rom). September. Geneva: ITU. Kalil T. 2008. Harnessing the Mobile Revolution. Berkeley: University of California, The New Policy Institute. Kauffman, R. J. and A. A. Techatassanasoontorn. 2005. “Is There a Global Digital Divide for Digital Wireless Phone Technologies?” Journal of the Association for Information Systems 6 (12): 338–80. UNCTAD (United Nations Conference on Trade and Development). 2007. Information Economy Report 2007–2008: Science and Technology for Development: The New Paradigm of ICT. New York and Geneva: United Nations. Waverman, L. 2009. The Connectivity Scorecard. Study commissioned by Nokia Siemens Networks. Available at http://www.connectivity scorecard.org/. 35 7KH *OREDO ,QIRUPDWLRQ 7HFKQRORJ\\ 5HSRUW  ‹  :RUOG (FRQRPLF )RUXP
    54. 7KH *OREDO ,QIRUPDWLRQ 7HFKQRORJ\\ 5HSRUW  ‹  :RUOG (FRQRPLF )RUXP
    55. 1.3: From Mobility to Ubiquity CHAPTER 1.3 A decade ago, few could have predicted that the start of 2009 would see one-and-a-half billion Internet users around the world. And only the sharpest prognosticator From Mobility to Ubiquity: might have foreseen that more than half of the world’s population would own a mobile phone and 80 percent Ensuring the Power and would live within range of a cellular network. If telephones are now nearly ubiquitous, how Promise of Internet quickly can we expect the Internet to span the globe? Connectivity… for Anyone, What can be learned from the remarkable mobile phone success story to help countries pave the way for broad, Anywhere, Anytime affordable, portable, and transparent ubiquitous Internet service for businesses and citizens? And, most important- ly, what policies and models can governments use to ROBERT PEPPER, Cisco Systems, Inc. help their countries get there? ENRIQUE J. RUEDA-SABATER, Cisco Systems, Inc. The goal may be simple but it is ambitious: Internet BRIAN C. BOEGGEMAN, Cisco Systems, Inc. ubiquity offers connectivity to people wherever they are, JOHN GARRITY, Cisco Systems, Inc. whenever they want to access the network, with the device of their choosing. Ubiquity features safe, reliable, and continuous high-speed connectivity. Above and beyond Internet availability, ubiquity means that the Internet follows users seamlessly rather than users searching for it as they move about during the day from place to place, device to device. It may sound too good to be true, but this advanced state of technological development is not an unreachable utopia. It can be built, but it will require a solid technical, regulatory, and 37 market foundation.The closer countries get to this goal, the more they will reap the benefits, both in terms of economic productivity and personal welfare. Advanced and emerging countries have reached the Internet through different paths. Personal computers (PCs) were widespread in advanced countries well before broadband became available. In emerging nations, many people have had their first Internet experience in cybercafés, Internet kiosks, or community centers. Increasingly, all countries are seeing a range of devices and an array of fixed and wireless lines for their Internet connectivity—and these are quickly going broadband. In many countries, however, it is not realistic to expect that everyone will have a connection to the Internet. Indeed, shared-access Internet facilities will remain the only viable approach for quite some time for a large portion of the world’s population. But the “stretch” goal of ubiquitous access is worthy if countries wish to tap the potential that the Internet offers in terms of productivity and standards of living. But how can we build on current progress to move toward ubiquity? When it comes to Internet access, we know that broadband offers much more than teleph- ony ever did—in terms of breadth of information; interactivity across media; economic opportunities; and access to education, health care, and government services. Harnessing the potential that networks and the Internet have to offer is as much about creating the right policy and institutional environment as it is about adopting the right technology and investing in related infrastructure. 7KH *OREDO ,QIRUPDWLRQ 7HFKQRORJ\\ 5HSRUW  ‹  :RUOG (FRQRPLF )RUXP
    56. 1.3: From Mobility to Ubiquity Figure 1: The five stages to Internet ubiquity Ubiquity Intensive use Extensive use Familiarization Early days Proto-Internet 38 As we end the first decade of the 21st century, it is Finally, we consider the more specific factors— clear that high-speed networks must be considered an beyond the solid foundation that the Net Strategy integral part of the basic infrastructure of any country. framework proposes—to take countries from broad and Indeed, broadband networks are the infrastructure accessible connectivity to that end-state goal of Internet foundation of the knowledge economy. And for many ubiquity. countries these networks offer a unique, cost-effective opportunity to enhance their competitiveness and rise A definition of the stages and underlying factors of above physical or geographical constraints.We have Internet progress already seen in advanced economies—and even remark- We begin with a model that tracks a country’s progress ably more so in emerging economies—how connectivity along five stages of Internet connectivity, each one get- empowers citizens, improves productivity, generates jobs, ting progressively closer to the stage that can serve as enables education, and improves health care.We also launching pad for Internet ubiquity. Each stage reflects a believe that we are about to witness broadband networks different breadth and depth of connectivity.The model powering an economic recovery. revolves around key thresholds, marking the progression In this chapter we propose to do three things. First, that countries have followed and pointing to what they we put into perspective the different stages of Internet can look forward to, depending on their stage (see connectivity for countries and their progress in fostering Figure 1). the broad ICT foundations (or lack thereof) behind The stages focus specifically on Internet penetration that connectivity.We do this by proposing a typology but do not limit themselves to one dimension. Instead of stages and classifying countries accordingly, and by we show the progression from occasional or rare revisiting and updating the ICT Development Map Internet access to familiarization with the use of the (ICT Map) presented in The Global Information Internet to widespread connectivity and, finally to more Technology Report 2007–2008.1 regular, intensive use of Internet-based services.The Second, we look at the key ingredients of successful thresholds are based on 2007 data from ITU consistent efforts to advance ICT development and Internet with those used in the Networked Readiness Index connectivity—what we will call the keystones of a Net (NRI) featured in this Report—they escalate as we move Strategy. These represent a framework around which it up the stages: from Internet usage to Internet connec- is possible to assess strengths and weaknesses and to tions and finally to broadband connectivity. identify priorities for action for governments and private actors alike. 7KH *OREDO ,QIRUPDWLRQ 7HFKQRORJ\\ 5HSRUW  ‹  :RUOG (FRQRPLF )RUXP
    57. 1.3: From Mobility to Ubiquity As we will elaborate below in connection with the Thailand,Tunisia, and Turkey. At this stage, virtually all ICT Map, it should be noted that progress along the businesses (beyond micro-enterprises) have Internet stages does reflect income levels but is not solely deter- connections, as do many urban households. mined by them.There are examples of countries that, Familiarization with the Internet breeds high expecta- through strategic improvements in their ICT ecosystem tions, and the pent-up demand for online services and and infrastructure, have managed to move further in greater connectivity is a considerable factor behind connectivity than richer countries. Internet momentum (see Box 1 for a summary of a We classify into these stages a total of 157 countries study of Internet use in emerging market cities). (see Appendix A for a list of these countries and how it Extensive use. The next stage—indicative of compares with the list of countries included in the NRI extensive Internet connectivity—is largely a transitional 2008–2009)—essentially the whole world, except for stage. Here we find 18 countries—with total population countries with very small populations or for which data of about 400 million—where at least one-quarter of all are not available. households are connected to the Internet (and nearly Proto-Internet. A country is considered to be in half of the population, on average, are Internet users), this stage when less than 5 percent of its population has but broadband is not yet prevalent.While earlier stages had experience with the Internet.We find 45 countries comprise only emerging economies, the countries at in this stage, with a total population of about 800 this stage are a mix of emerging (Czech Republic, million.These countries are typically low-income, rural Malaysia, and Russia, for instance) and advanced ones economies (only 35 percent of the population on aver- (Italy, Portugal, and Spain). age lives in urban areas), with Internet connectivity Intensive use. Finally, in the intensive use stage we largely available only to larger businesses, universities, find 23 countries—with about 850 million population the government, and small elite groups in the cities. In in total—where half or more of the households (plus all these countries, less than 1 in 20 people had experi- businesses and institutions) have broadband connections. enced the Internet by 2007. Examples include populous These are advanced economies in which, on average, countries such as Bangladesh and Ethiopia and smaller two-thirds of the population uses the Internet. ones such as Cameroon, Nicaragua, and Tajikistan. E-commerce, e-government services, business collabora- 39 Early days. In the next stage, countries have sig- tion, and social networking, among others, are pervasive nificantly higher Internet usage rates (between 5 percent and have become an integral part of the social fabric —or slightly less but growing fast—and 15 percent), but and economy. Countries with a strong ICT foundation the large majority of the population has yet to experience have reached this stage and derive many benefits from it. the Internet directly.We find 32 countries at this stage— The best-practice examples for our Net Strategy come including major ones in Asia (India, Indonesia, and from this group and include countries such as Finland, Pakistan) and Africa (Egypt, Nigeria, and South Africa), Korea, Rep. (Korea), and the United States.This stage is together with smaller countries (such as Albania, Bolivia, the launching pad for ubiquity. Senegal, and Sri Lanka)—with a combined total popula- Ubiquity. We are still exploring the metrics that tion of about 2.2 billion people.These are generally we will need in the future to determine if and when countries with significant urban populations (about half countries have moved to the stage of ubiquitous of their population lives in cities, on average), and Internet.We do not believe any country has yet come Internet use averages conceal major differences between close, but developments in technology, regulation, and urban and rural areas. Many people in these countries business models are paving the way for some countries use the Internet through shared-access connections to make fast progress in this direction. Ubiquity is not (cybercafés or community centers), so that the number about 100 percent connectivity; rather it is about the of Internet users is a multiple of about five times the ability to connect everywhere at anytime by a majority number of Internet connections in the country. of citizens.This stage of ubiquity un-tethers the user Familiarization. In this stage we include countries from device or connection and instead envisages a world with at least 15 percent Internet use, but switch the in which the Internet connection follows the user rather upper boundary to focus on household connections, than the user seeking the connection. with an upper boundary that is equivalent to about The stages identified above help us get a clearer one-quarter of all households having their own connec- picture of the critical mass thresholds needed to accelerate tions.We find 39 countries in this stage, with an average network connectivity, but they are not meant to provide of 28 percent of the population having used the a diagnostic of a country’s ICT development. For that Internet.These numbers are fueled by high urbanization we defer to the ICT Development Map we introduced rates (two-thirds of the people live in urban areas). in The Global Information Technology Report 2007–2008 to There are 2.2 billion people who live in countries at explore the interaction among ICT infrastructure, this stage, which are wide-ranging in income levels and ecosystem coordinates, and technology adoption. characteristics—from Brazil and China to Chile, Poland, 7KH *OREDO ,QIRUPDWLRQ 7HFKQRORJ\\ 5HSRUW  ‹  :RUOG (FRQRPLF )RUXP
    58. 1.3: From Mobility to Ubiquity Box 1: Cities as spearheads for online service use1 Citizens and businesses located in the cities of major emerging In six of these cities (in Brazil, Mexico, and Russia), economies are not only quite familiar with the Internet but, Cisco was able to conduct a follow-up survey in late 2008. as they become more exposed to it, they develop high expecta- Comparison of the two surveys (Figure A) found very tions for future access to online services—commercial and lively dynamics at play: the proportion of regular Internet users governmental alike. While some key factors of ICT adoption (people moving from familiarization to extensive—and even are under the primary influence of central governments, other intensive—use of the Internet) in the sample grew from 44 factors come under the purview of municipal or metropolitan percent to 51 percent within the span of just one year. governments, and these entities can make a significant The survey also found the following: difference. Both central and local government broadband strategies are necessary to take advantage of the opportunity 1. Citizens’ “thirst” for online services regardless of their that Internet Protocol (IP) networks offer and to extend the experience using the Internet: advantages of the early stages of Web 2.0. —Those that already use online services expect to Because of population density, connectivity spreads faster continue using and potentially expanding their use, in cities and, hence, early indications of demand (present and and many consider these online services to be worth future) for online services can be observed. Cities therefore are paying for. excellent proving grounds for online service deployment and can provide central governments with clear indications of what —Those not currently using the Internet and those who the rest of the country’s population might want—and potentially do so infrequently expect to use online services in expect—in this area. the future nearly to the same degree as regular users. Using cities to spearhead ICT development is not just about providing urban dwellers with the benefits of connectivity. —Citizens show particular interest in (and willingness It is also an effective approach for creating strong hubs of to pay for) new value-added services such as connectivity and commercial viability and thus extending the education or health care. reach of networks across the country, laying the groundwork for national ubiquity. 2. Virtually all businesses already use the Internet, but 40 Awareness of the Internet and of its benefits is virtually they see major potential for expanding their use of the universal in cities across the world, according to the “Cities Internet for all kinds of e-commerce. Net Opportunities” study by Cisco—based on a survey by Illuminas Global in four cities each in Argentina, Brazil, Mexico, 3. There is a clear desire from citizens and businesses for Poland, Russia, and South Africa. The survey found that more active involvement by the government to promote businesses have seen the Internet improve sales, customer Internet access and use. The overwhelming majority of satisfaction, and productivity; while citizens generally believe businesses and citizens think government should have a that Internet access improves people’s lives. role in making access to the Internet easier (Figure B). (Cont’d.) Figure B: Expectations of government’s role Figure A: Citizens: Internet use in urban areas (percent) Businesses’ expectations (percent) 100 ■ Use Internet regularly Should make it easier 44 80 ■ Use Internet, not 80 for people to access 51 the Internet regularly 60 ■ Heard of Internet, Should increase 15 never used investment in Internet 76 11 40 infrastructure for city ■ Never heard of the Internet 41 37 20 0 25 50 75 100 1 1 0 Citizens’ expectations (percent) 2007 2008 Should make it easier Source: Rueda-Sabater and Lamus, 2008. 77 to access the Internet 0 25 50 75 100 Source: Rueda-Sabater and Lamus, 2008. 7KH *OREDO ,QIRUPDWLRQ 7HFKQRORJ\\ 5HSRUW  ‹  :RUOG (FRQRPLF )RUXP
    59. 1.3: From Mobility to Ubiquity • ICT ecosystem refers to institutional factors that underpin entrepreneurial creativity and competitive 1 Box 1: Cities as spearheads for online service use dynamics for service provision.These factors are (cont’d.) hard to measure but include the legal and regulato- ry framework around ICT deployment and the 4. Concerning e-government, most businesses—and a ease of doing business in general. large majority of citizens—feel that the government should do more to provide information and services online. • ICT infrastructure and capacity refers to assets, such as networks and other infrastructure, as well as the 5. As for barriers to greater use of the Internet, citizens existence of skills to use and manage the hardware and businesses rank skills as the top obstacle. Other effectively. major factors are accessibility and cost. In last year’s Report, we used these two dimensions 6. People in households with their own connection to develop a cartographic model and map countries on access the Internet more frequently than those who the basis of their ICT development—providing a per- use shared-access facilities such as a cybercafé. spective on their current situation and illustrating how This shows that having a PC at home seems to be a to chart a course forward that balances both dimensions. key factor in increasing the frequency and use of the This ICT Development Map relied solely on indicators Internet, also considering citizens do not feel that access via mobile phones could satisfy their that were part of the NRI; it did not explicitly consider connectivity needs. income levels. Income levels play a role in ICT adoption (see Figure 2), but so do a number of the factors reflect- ed in the ICT Map coordinates. Simple correlation Note analysis confirms that our ecosystem rating, in particular, 1 This box draws on Rueda-Sabater and Lamus 2008. is much less influenced by income than is the infrastruc- ture rating (see Appendix A). 41 Figure 2: Broadband penetration and per capita income levels, 2007 40 Broadband subscribers per 100 inhabitants 35 30 25 20 15 10 5 0 0 10,000 20,000 30,000 40,000 50,000 60,000 Nominal GDP per capita Source: ITU, 2008; IMF, 2008. 7KH *OREDO ,QIRUPDWLRQ 7HFKQRORJ\\ 5HSRUW  ‹  :RUOG (FRQRPLF )RUXP
    60. 1.3: From Mobility to Ubiquity Figure 3: Broadband penetration levels in countries with similar income, 2007 15 Lithuania Broadband subscribers per 100 inhabitants 12 Romania 9 Poland Croatia Chile 6 Turkey Latvia Uruguay Mexico 3 Venezuela Russian Federation Libya Equatorial Guinea Gabon Botswana 0 7,000 8,000 9,000 10,000 11,000 12,000 Nominal GDP per capita Source: ITU, 2008; IMF, 2008. 42 This is a phenomenon that can be observed both in To analyze the implications of positions in the ICT emerging and advanced markets: Map, we break each axis into four simple categories. The thresholds for the four categories reflect logical breaks in the distribution of countries along each axis • Russia’s income level, for instance, is similar to that rather than evenly spread groupings.These thresholds of Chile, but its broadband penetration is less than are unavoidably arbitrary; they are designed simply as a half. Similarly with Venezuela and Romania (the sorting device that is then validated by the differences former has slightly higher income but the latter has in Internet penetration across countries in the different more than twice the broadband penetration). Figure categories. 3—showing a “slice” of the scatter plot—provides Revisiting the ICT Development Map with infor- further illustration of how non-income factors mation from the NRI 2008–2009, we can look at how (differences in ecosystem and infrastructure) can be the 127 economies for which data are available are significant enough to account for major disparities spread through the relevant areas of the ICT Map.3 We in ICT adoption even after income levels have been find 50 countries still in the “poor” category (including factored in (see Appendix A for statistical validation most of the countries included this year for the first time of this significance). in the NRl), a slight increase (to 33) in the number of countries in good/best practice territory, and 44 • Among advanced economies, similarly, Austria has a countries in between (see Table 1). slightly higher income level than Belgium, but the The period between 2005 and 2007 was a time latter had broadband penetration of 26 percent (in of significant expansion of Internet use around the 2007) compared to 19 percent for Austria. Ireland world (possibly a key inflection point in that regard). and Switzerland also had similar income levels, but We offer three views of the dynamics of ICT adoption: broadband penetration (at 32 percent) was almost First, we depict ICT Map positions using the data twice as high in Switzerland than in Ireland. included in the NRI 2007–2008 (black dots) compared with those (blue dots) based on data in the NRI The indicators behind each ecosystem and infra- 2008–2009 (Figure 5). structure are combined to produce the two coordinates The mapping of one year’s changes suggest very that allow us to classify each country along the two little progress on the ecosystem front.This points to a axes. Figure 4 indicates how the indicators are combined missed opportunity (given that ecosystem improvements to generate measures for the ecosystem and infrastruc- are not resource-intensive) and underscores the untapped ture dimensions. 7KH *OREDO ,QIRUPDWLRQ 7HFKQRORJ\\ 5HSRUW  ‹  :RUOG (FRQRPLF )RUXP
    61. 1.3: From Mobility to Ubiquity Figure 4: ICT Development Map Framework Number of procedures to start a business, 20081 33% Number of procedures to enforce a contract, 20081 33% Business climate Efficiency of legal framework for disputes, 2007, 20082 33% 33% Quality of competition in the ISP sector, 2007, 20082 45% ICT market competition 33% Ecosystem Intensity of local competition, 2007, 20082 35% Capacity for innovation, 2007, 20082 20% 33% Laws relating to ICT, 2007, 20082 50% Mapping ICT policies/regulations key ICT Burden of government regulation, 2007, 20082 50% development dimensions 100% Internet bandwidth, 2007 or more recent year available3 International access Personal computers, 2006 or most recent year available3 35% 35% Mobile telephone subscribers, 2007 or most recent year available3 20% Domestic networks Infrastructure 35% Telephone lines, 2007 or most recent year available3 20% Electricity production, 2005 or most recent year available1 25% 30% Availability of scientists and engineers, 2007, 20082 33% Local availability of specialized research and training Skills for ICT 33% services, 2007, 20082 Quality of math and science education, 2007, 20082 33% 43 1 World Bank 2009; 2 2-year average, World Economic Forum, Executive Opinion Survey, 2007, 2008; 3 ITU 2008. Table 1: Distribution of countries in the ICT Map Poor Moderate Good Best practice 3 13 Best practice Ecosystem 1 11 13 4 Good 20 21 12 Moderate 17 10 2 Poor Infrastructure 7KH *OREDO ,QIRUPDWLRQ 7HFKQRORJ\\ 5HSRUW  ‹  :RUOG (FRQRPLF )RUXP
    62. 1.3: From Mobility to Ubiquity Figure 5: Change in ICT Map positions, 2007–2008 Best practice Quality of the ICT ecosystem NRI 2007–2008 NRI 2008–2009 Poor Poor Best practice Extent of ICT infrastructure Source: Authors’ calculations, based on ICT Map 2008, 2009. 44 potential for the less wealthy countries to accelerate Table 2: Broadband penetration growth over two years, 2005–07 progress through policy and regulatory reforms. Second, we analyze the impact that a balanced Best Poor Moderate Good practice (diagonal) ICT Map position has on the progress achieved between 2005 and 2007 (see Table 2). 4.7 8.8 Best practice Ecosystem The results confirm the value of the balance 1.2 6.6 6.7 Good between infrastructure and ecosystem—countries along 0.3 1.5 5.5 Moderate the diagonal (indicative of balance between progress on 0.4 1.2 Poor the ecosystem and infrastructure fronts) saw the greatest Infrastructure increase in broadband line penetration. Countries with poor or even moderate ICT environments face the Source: Authors' calculations, based on ITU, 2008. prospect of lagging further and further behind in their ability to harness the power of networks for competi- tiveness and social inclusion. Third, we use the three summary categories (poor, • For Internet usage (Figure 7), the absolute gaps kept moderate, and good/best practice ICT environments) growing over the 2005–07 period (the proportion to review differences in penetration and determine of the population that had used the Internet went whether the gaps are closing or widening. from an average of 51 percent in 2005 to 60 per- The new data from the NRI 2008–2009 validates cent in 2007 in good/best practice countries, com- last year’s conclusions.The differences across country pared with 6 percent in 2005 and 10 percent in categories remain very large; this is particularly the case 2007 for countries in poor environments). for broadband (see Figure 6). Looking back from these penetration rates at the • For broadband connections (Figure 8), the even larger increase in Internet use and broadband penetration over initial gaps kept growing (the proportion of the two years shows how major gaps have continued to population that had used broadband Internet went grow, because countries with weaker ICT environments from an average of 15 percent in 2005 to 22 percent did not manage to expand their connectivity fast in 2007 in good/best practice countries, compared enough to reduce them. with 1 percent in 2005 and 4 percent in 2007 7KH *OREDO ,QIRUPDWLRQ 7HFKQRORJ\\ 5HSRUW  ‹  :RUOG (FRQRPLF )RUXP
    63. 1.3: From Mobility to Ubiquity Figure 6: Internet penetration by summary categories, 2007 Number of Internet Internet Broadband countries users subscribers subscribers Category Average (per 100 inhabitants) 33 60 28 22 Good/best practice 44 24 8 4 Moderate 50 10 2 1 Poor Source: Authors' calculations, based on ITU, 2008. 45 Figure 7: Increase in Internet penetration, 2005–07 Figure 8: Increase in broadband penetration, 2005–07 10 10 8 8 Percentage point increase Percentage point increase 6 6 4 4 2 2 0 0 Poor Moderate Good/ Poor Moderate Good/ best practice best practice Internet users Broadband users Source: Authors' calculations, based on ITU, 2008. Source: Authors' calculations, based on ITU, 2008. 7KH *OREDO ,QIRUPDWLRQ 7HFKQRORJ\\ 5HSRUW  ‹  :RUOG (FRQRPLF )RUXP
    64. 1.3: From Mobility to Ubiquity for countries in moderate environments—while the intensive Internet use stage, as a launching pad to countries in poor environments remained below 1 Internet ubiquity. percent penetration throughout the 2005–07 period). A framework for action The diagnostic models (ICT Map and Internet stages) The momentum that countries build as they move that we have designed provide a good basis for provid- through the Internet stages appears to be a powerful ing perspective to a country’s starting position and force. It has proven particularly difficult for countries charting a course for progress. with poor infrastructure and/or ecosystems to accelerate Building on these models, and drawing from the the rate of Internet penetration compared with that rate fast-developing best practices of leading countries in other countries.While the relative growth, of course, (including those of government policy and actions), is much higher for countries in the “poor” category, we have identified six key action areas for an effective actual progress toward the critical mass of users and sub- Net Strategy to improve ICT adoption (broadband in scriptions is what represents key thresholds. In that particular).These are consistent with the analytical logic respect, the gap has grown rather than shrunk in the of the ICT Map—with the addition of a more explicit two-year period. role for government expenditure—and provide the basic structure of our framework for identifying priorities and Using ICT to reach economic and social objectives establishing avenues for action. As governments, businesses, and community leaders These keystones for a Net Strategy represent a consider possible paths to improved connectivity with foundation in which each of the components needs to the ultimate goal of universal, ubiquitous connectivity, be solid and all six reinforce each other’s effect.To reach they will find it useful to think in terms of two major the intensive use stage, countries need to ensure robust- objectives: economic growth and social inclusion.The ness in all six keystones. Areas where remedial action is paths to these two goals overlap to some extent, but needed will depend on the stage at which a country there are also separate avenues to pursue depending on finds itself and on the strengths and weaknesses of its the relative importance of each goal in a country. ICT environment. 46 The six keystones can be characterized through a • Economic growth. Potential benefits include series of questions and by examining lessons from best productivity gains (e.g., through reduced transaction practice, as follows. costs; scalability; and fast, reliable information flows) 1. Market/Competition. Are the number of players, and enhanced innovation (through online collabo- their technology platforms, and their market shares such ration tools and new ways to market goods and that they foster competition (i.e., service innovation and services).These are the same ICT productivity gains responsiveness to potential demand)? that have benefited developed economies over the Simply put, monopolies innovate less and invest less last two decades and are accelerating their impact as than service providers in a competitive market. Best they extend from large enterprises to smaller busi- practice countries have found various ways to promote nesses, government, and nonprofit organizations. diversity in platform technologies and service provision, expanding the reach of networks, promoting usage, and • Social inclusion. This refers to the potential that ensuring affordability. But there is no blueprint that can improved access to networks offer people and com- be applied to all countries. munities across the world to education resources, Countries ranking high in the NRI tend to have health service providers, government assistance, and the healthiest competitive environments, where market information.This improved access works the needs and investment already made by incumbent together with the networks’ potential for empower- players were taken into consideration while still provid- ing individuals to exercise their rights as citizens ing incentives for newcomers. Competition does not and become active participants in political processes work if regulation becomes confiscatory for incumbents and social dynamics. or prohibitive for competitors. Competition in the service provider market— The early stages of the Web 2.0 era of technology- broadly defined—also plays a vital role in ensuring a empowered collaboration and knowledge development broad reach of networks, consumer choice, and efficient create unprecedented opportunities for both developed response to emerging demand. Needless to say, there is and developing economies. If leveraged correctly, an also a delicate balance here, as regulatory frameworks ambitious network connectivity strategy may very well must also be mindful of the impact on incentives for represent the best hope of economic transformation, service providers to invest. And diversity among tech- particularly at this time of global economic downturn. nology platforms is a good indication of the potential A strong foundation for ICT development with bal- for market dynamics that surround connectivity. In any anced ecosystem and infrastructure is crucial to reach 7KH *OREDO ,QIRUPDWLRQ 7HFKQRORJ\\ 5HSRUW  ‹  :RUOG (FRQRPLF )RUXP
    65. 1.3: From Mobility to Ubiquity case, the goal is for markets, not regulators or incum- depriving businesses and citizens of the benefits of a bents, to select service and business models. very cost effective technology. 2. Policies and regulations. Has the institutional 3. Applications and content. Are the business envi- framework evolved from the traditional fixed telephony- ronment and innovation culture such that demand and based model to one that enables convergence around ICT entrepreneurship drive application development? Internet Protocol (IP) and permits entry and efficient IP networks, by their nature, are best utilized when use of tangible and intangible assets? the ICT sector in a country consists of fluid structures Regulations, both ICT specific and more generic, —and clusters of innovation on content and applications. can have the unintended effect of discouraging innovation Users will obviously value broadband access more if around the development and deployment of applications. they can go online to access government, education, and Outdated regulation can generate barriers and constrain health-care services, or access potential jobs and sources access to existing assets while inhibiting opportunities of income. for reducing entry costs and technology promotion. Often the most effective intervention is an indirect Much of the thinking in the regulatory arena is still one: promoting an environment in which ICT-related hampered by the legacy of the telephone industry and entrepreneurship can thrive and meet the demands for the regulatory environment that has historically sur- content and applications by local businesses and individ- rounded it. In virtually every country around the globe, uals. In addition, governments can promote demand by the traditional telephone industry was organized around sponsoring the development of applications that meet five central concepts: the primary service is voice; the the very real needs of the people with regard, for minute is the best metric for billing, regulation, and instance, to public services. measurement; the location of the user is important; A business environment that facilitates business pricing is sensitive to the duration of the call; and pricing startups, operations, and conflict resolution is crucial is sensitive to the distance between callers.These condi- for entrepreneurship and can have a disproportionately tions, along with the heavy capital expenditures needed positive effect on the ICT sector. An active ICT sector to deploy a telephone network, led to a heavily regulated is of paramount importance to accelerate technology marketplace and, hence, to generally monopolistic adoption. 47 environments. 4. Government budgets. Are e-government practices None of these conditions apply to broadband use. contributing to both operational efficiency and citizen Distance, duration, and location are moot, making the interaction online and is government procurement used billing increment of a minute of little value.Voice is but to promote national ICT development? one application in a plethora of applications available to Governments are very large buyers of ICT services the end user. Incumbent telephone companies are joined and, hence, current government expenditure on ICT by providers from the ICT world, where competition can also play a role by aggregating demand, acting as can be fierce, innovation occurs at a rapid pace, and an “anchor tenant,” promoting competition and/or precipitous drops in price are an everyday occurrence. “priming the pump” for a wide array of ICT services. The only similarity between the telephone and Ambitious public online services and advanced use of broadband markets is the capital expenditures needed to ICT in government operations generates value and create the foundational network. Fixed broadband net- citizen satisfaction. works still require digging ditches and hanging wires, Strategic use of the government procurement can and these civil-engineering costs can be penciled in at a accelerate the commercial viability of services, promote fairly constant rate. But even this similarity is fading as a competition and entrepreneurship in the sector, and result of the advent of high-speed wireless technologies, create an opportunity for promising ICT business which promise to drastically reduce capital costs for models to take off. access networks and expand the range of options avail- 5. Skills for IT. Are the skill levels of ICT users able to any location or community. (including those of school teachers) supporting the use Countries that have made great strides in broadband of the Internet by businesses and individuals, and are connectivity have evolved from a regulatory framework specialist ICT skills developing in line with technology designed for a telecommunications monopoly to recog- and potential? nizing IP convergence and treating networks as critical Best practice countries have a solid base of ICT infrastructure.The old telecommunications regulation technical skills and a good level in broader science and was focused on voice and reflected a very different cost math education.The range of interventions to improve structure in the industry.Well-intentioned but myopic ICT-relevant skills goes from sharply focused training regulations based on that model can have perverse and certification to pipelines of university graduates in effects—favoring monopolies, inhibiting innovation, and engineering and information technology fields. keeping prices unnecessarily high. In many countries, Specialized education and research programs can play a Voice over IP (VoIP), for example, is still illegal—hence major role over the longer term in contributing to the 7KH *OREDO ,QIRUPDWLRQ 7HFKQRORJ\\ 5HSRUW  ‹  :RUOG (FRQRPLF )RUXP
    66. 1.3: From Mobility to Ubiquity Countries need to consider wide-ranging formulas ICT sector growth—both in adding value and in pro- for ensuring commercially viable and socially minded moting efficiency. access to the Internet.Tariffs and taxes on PCs and con- Building basic ICT-user skills is, however, another straints on the emergence of other Internet-ready hurdle many countries have to overcome. devices can represent hurdles to the spread of connec- An effective strategy must ensure that a lack of first- tivity. As appropriate, promotional programs can help level ICT user skills are not preventing individuals and facilitate access to devices for disadvantaged segments of businesses from making the most of the opportunities the population. technology has to offer. Programs designed to increase Finally, a powerful though indirect effect, constraints computer skills—and confidence—of older teachers on foreign investment or rigidities in the financial system can, for instance, offer a very high, immediate pay-off. can have a disproportionately negative effect on the ICT 6. Infrastructure investment. Are there ICT infra- sector, placing a country at a competitive disadvantage. structure bottlenecks that affect critically the breadth, depth, and speed of ICT adoption? Best practice examples Strategic investment (similar to that in trunk roads or interstate highways) may be required to establish a Experience from various parts of the world suggests national foundation on which private investments and measures and strategies that governments can take, local initiatives can build. Often, this investment is best including through public-private partnerships, to address addressed through public-private partnerships. A number bottlenecks and promote progress in connectivity. Key of different strands of private investment are worth lessons from these experiences include: highlighting and the incentives and disincentives affecting them well worth examining. • Focus on market failures. To accelerate adoption (rather than artificially create it) government actions • Private investment by businesses in networks and should be designed to address market failures and service development is critical and has underpinned bridge temporary gaps in demand or supply, as well the development of networks and the growth of as to create a dynamic of sustainable investment. connectivity in many countries. 48 • Coordinate infrastructure design and implementation. It is • Core networks should be seen as basic infrastructure. much cheaper to lay cables alongside roads as they Depending on the starting situation, this may entail are being built than to return later, dig a ditch, and greenfield development, expansion, or upgrades. lay cables. Even if roads are being built with no net- Public and private sectors have complementary work on the horizon, they can be designed with roles to play, with government involvement mainly empty ducts beneath or easily assessable trenches so focused on filling gaps. cable and fiber can be added later at a fraction of the cost. Infrastructure process coordination is an excellent alternative for municipal and regional • In some circumstances, because of low density or governments, since there is no need for a federal difficult geography, government may have to take decree to make coordination happen. a more active role in ensuring investment in a broadband core network. For example, governments can make the rights of way they control available to • Sequencing. Governments can greatly improve cost core network operators. Additionally, since generally effectiveness by considering the importance of about two-thirds of the construction cost of effect sequence. For instance, many lower-stage core backbone networks is in civil engineering, countries would do well to focus on improving governments can dramatically reduce the costs by their PC-to-citizen ratio as they develop and exe- providing empty ducts when they construct roads cute investment programs for broadband expansion. or maintaining highways and other infrastructure. To envisage the range of possible interventions in • At the other end of connectivity stand ICT the formulation of a Net Strategy, we need now to go devices—which represent an investment of sorts into another level of detail beyond our six keystones and by individual users.There is a strong correlation consider 14 action areas or levers to which governments between PC penetration and broadband use.The —depending on their specific circumstances—can resort sequence in emerging markets is markedly different (Figure 9). than that in advanced economies, where universal Going into the details in each of the 14 areas connectivity could be reached quickly because of shown on the right side of Figure 9 is beyond the scope the large PC pool already in use. In many emerging of this chapter, but under each of these headings countries, device availability can be a critical bottle- a number of promising practices are taking shape. neck for connectivity. Matching the assessment of bottlenecks in the 14 inter- vention areas with a catalog of best practices can quickly 7KH *OREDO ,QIRUPDWLRQ 7HFKQRORJ\\ 5HSRUW  ‹  :RUOG (FRQRPLF )RUXP
    67. 1.3: From Mobility to Ubiquity Figure 9: A Net Strategy Framework SP market structure/competition Market/competition Platform diversity/differentiation Ease of entry (infrastructure) Policy/regulations Ecosystem Ease of entry (applications) Business/innovation environment Applications & content ICT entrepreneurship/clusters Mapping ICT development E-government & government ICT pioneering Government budgets Demand aggregation/e-procurement Individuals, teachers, SMEs IT “literacy” Skills for ICT Infrastructure Technical & advanced capabilities Core network Access network Infrastructure investment IP device availability Ease of investment 49 provide the components of a sound Net Strategy and • Ireland launched a licensing scheme for local area lead a country to derive the immense benefits that the broadband fixed wireless access services. Under this intensive use stage of the Internet offers. scheme, licenses are offered in two frequency bands, Examples of promising interventions include the 10 GHz and 26 GHz.The licenses are awarded on a following: first-come, first-served basis and issued for up to 2x28 MHz of spectrum for use in a location of the applicant’s choice.The licensing initiative is also • The national regulator set Greece’s broadband mar- expected to extend to the 3.5 GHz frequency band ket on the path to fair network access and more at a later stage for service to rural and suburban areas. competition.The two key events in 2006 were the adoption of the European Union (EU) framework for Electronic Communications into Greek law and • Korean broadband Internet service was classified new regulations on Local Loop Unbundling (LLU). as a value-added service, not as an infrastructure As a result, broadband connections accelerated and communications service. Hence it was largely free Greece no longer occupies the last place in the EU from strict government regulations and interven- broadband penetration ranking. tions. As a result, the entry barrier into the market was low and pricing competition was free—quite the opposite of the heavily regulated phone market. • France implemented a bold regulatory framework that has led to a very competitive market. Free Ilyad and Neuf-Cegetel are among the most successful • South Africa’s regulatory authority announced in challengers in the world. Both have crafted business November 2008 that it had decided to convert all plans that focus on fiber deployment and innovative value-added network service licenses to network convergent services. In response to this competition, infrastructure licenses under the Electronic Commu- France Telecom has become one of the most inno- nications Act.The move is expected to open South vative incumbents in the world. Africa’s telecommunications industry to new infra- structure investors able to inject competition and expand services into the market. 7KH *OREDO ,QIRUPDWLRQ 7HFKQRORJ\\ 5HSRUW  ‹  :RUOG (FRQRPLF )RUXP
    68. 1.3: From Mobility to Ubiquity Bands,4 and on technologies such as WiMAX offers Beyond the intensive use stage: Ubiquity great potential for widespread broadband and ubiquitous Ubiquity, everywhere and personal, is predicated on Internet. three things: the wide availability of a core network that In order for wireless broadband to become a reality takes fixed broadband as far as feasible; a diverse system and have the impact that mobile telephony has enjoyed, of “capillaries,” including wireless broadband that multiple large swaths of spectrum (of 20 MHz or prefer- extends the core to “the last mile”; and a variety and ably 30 MHz each) need to be dedicated to wireless abundance of Internet-enabled devices that meet the broadband. Migrating analog TV spectrum to digital income, literacy, business, and personal needs of users. broadband service offers an important “digital dividend.” For countries that are at or close to the intensive The United States has already acted, with the recent use stage, there are a number of factors to consider in auction of 700 MHz spectrum; other countries are developing a plan of action toward ubiquity. moving in the same direction, with the European Union Core network. Access to ubiquitous wireless (EU) planning a 2010–12 rollout. Some countries, such networks assumes that broadband core fiber optic as Chile and India, have never used these 700 MHz networks can reach every part of the country.The core band for television and therefore can move even faster network or backbone can also be thought of as the to deploy these frequencies for wireless broadband. arteries and veins that handle the heavy flow of traffic, Finally, to properly service the “last mile,” countries while wireless and other capillary systems provide access will have to open up spectrum to build ultra-broadband, beyond the core and create the network’s outer reaches. high-speed, symmetric, robust, intelligent networks.This An important role of the government is to ensure that strategy will promote whole new classes of applications, high-speed robust core backbone networks are available including high-resolution virtual meetings, such as across their country to enable the availability of broad- telepresence systems; more effective and robust remote band everywhere. In many cases, a clear and predictable medical treatment; new forms of entertainment and regulatory environment will attract private capital to multiplayer games; and visual and video-based educa- build core broadband networks, if these are not already tional opportunities—a particularly important advance done; in others, public investment in the basic layer for rural and agricultural uses. In countries with many may be required to generate the externalities that core 50 languages and cultural groups, video, visual, and audio networks offer. communications enabled by wireless broadband can be Spectrum. Wireless spectrum is, in many coun- used to overcome literacy gaps and language tries, an untapped asset.There are many policy enablers barriers to provide education, health care, and govern- available to spread wireless broadband, but none is more ment services as well as to expand social interaction. effective than making radio spectrum available over large Devices. Ubiquity and personalization also require geographic areas.The good news is that the migration a range of highly functional devices, including low-cost, from analog to digital television’s broadcast is opening robust, and easy-to-use ones. Laptops, of course, are the up a broad swath of the radio spectrum that is ideal penultimate take-along Internet device, but for a great for wireless broadband networks.Virtually all govern- percentage of the world’s population, laptops are still ments control radio spectrum within their borders and unaffordable. Mobile phones, in theory, are Internet therefore can license to broadband providers reclaimed devices, but aside from texting, they provide very limited spectrum, at wavelengths that are particularly well suited connectivity. A wide range of new “smart” phones quali- to deliver the signal over the topography of many fy as true Internet devices, but these are costly and have emerging countries. limitations. Other devices, such as the many variations Good spectrum policy can do the same thing for emerging under the generic term of netbooks, offer broadband that it did for mobile telephony—leapfrog promise, but accelerating their proliferation will be key. fixed networks and extend service to large swath of Although the market is already providing more underserved and un-served areas and people. functional, smart, low-cost devices, public-private Finally, spectrum policy to enable the expansion of partnerships, nongovernmental organizations, and gov- wireless broadband will lead to new capabilities, such as ernments can help promote the widespread adoption of mobility, that are simply unavailable on fixed networks these devices to low-income and other disadvantaged and open the door for competition to fixed network populations. Countries ranging from Egypt to Saudi broadband—driving investment, service innovation, Arabia and Korea are easing or facilitating the adoption lower prices, and, as a result, greater adoption. of PCs among low-income groups. Many schools in the Not all spectrum are created equal: spectrum at intensive use stage countries have developed school cur- lower frequencies travel further with the same amount ricula that rely on PCs and other Internet-enabled of energy and do not require line of sight.That is why devices, and ensuring that these opportunities are open emphasis on the 700 to 800 megahertz bands—which to all is a critical goal. travel at long distances at lower power—as part of what the ITU calls the International Mobile Telecommunications 7KH *OREDO ,QIRUPDWLRQ 7HFKQRORJ\\ 5HSRUW  ‹  :RUOG (FRQRPLF )RUXP
    69. 1.3: From Mobility to Ubiquity Conclusion Wellenius, B. and I. Neto. 2008. “Managing the Radio Spectrum: Framework for Reform in Developing Countries.” Policy Research A new era has dawned as Internet use crosses critical- Working Paper No. WPS 4549. Washington, DC: World Bank. mass thresholds across the world and technology expands the range of connectivity options. Broadband networks offer productivity increases for businesses, greater inclusion and opportunity to individuals, and the potential for a competitiveness leap-forward for countries that seize the moment. Mobile telephony is a great example on how emerging countries have leapfrogged more developed countries, and wireless broadband offers similar poten- tial. No one ever believed that telephone service could reach the level of ubiquity that it has since its inception. Ubiquitous, high-speed Internet connectivity opens the door to the enormous potential of Internet-enabled pervasive communication and multifaceted collaboration. The world is getting smaller.Telephones and Internet-connected computers started that process, and now ubiquitous broadband will explode the potential for connectivity, bringing us all closer together and changing the nature of our interactions in ways we are just beginning to imagine. Notes 1 See Morrison et al. 2008. 51 2 It is noteworthy that the thresholds between the moderate and good categories are more significant than those between poor and moderate and, particularly, between good and best practice. 3 ITU 2007a. References Bhavnani, A., R. Won-Wai Chiu, S. Janakiram, and P. Silarszky. 2008. “The Role of Mobile Phones in Sustainable Rural Poverty Reduction.” Working Paper of the Global ICT (GITC) department, June. Washington DC: World Bank. Available at http://www.web4 dev.org/images/2/2d/The_Role_of_Mobile_Phones_in_Sustainable_ Rural_Poverty_Reduction_June_2008.pdf. Morrison, E., R. Pepper, and E. Rueda-Sabater. 2008. “The Emerging Nexus: Now Is the Time to Plot a Balanced Course that Delivers on the Promise of ICT.” The Global Information Technology Report 2007–2008: Fostering Innovation through Networked Readiness. Hampshire: Palgrave Macmillan. 23–37. IMF (International Monetary Fund). 2008. World Economic Outlook Database. October. Washington, DC: International Monetary Fund. Internet World Stats. 2009. Internet Usage Statistics. Available at http://www.internetworldstats.com/stats.htm (January 1, 2009, update). ITU (International Telecommunication Union). 2007a. Guidance on the Regulatory Framework for National Spectrum Management. Report. Available at http://www.itu.int/publ/R-REP-SM.2093- 2007/en. ———. 2007b. “ITU World Radiocommunication Conference Concludes after Four Weeks: International Treaty Sets Future Course for Wireless.” Press release, September 16. Available at http://www.itu.int/newsroom/press_releases/2007/36.html. ———. 2008. World Telecommunication/ICT Indicators, September. ITU. Available at http://www.itu.int/ITU-D/ICTEYE/Indicators/ WTI_Technotes.pdf. Rueda-Sabater, E. and F. Lamus. 2008. Cities Net Opportunities 2008: Emerging Markets. Cisco. Available at http://newsroom.cisco.com/ dlls/2008/ekits/Cities_Net_Opportunities.pdf. 7KH *OREDO ,QIRUPDWLRQ 7HFKQRORJ\\ 5HSRUW  ‹  :RUOG (FRQRPLF )RUXP
    70. 1.3: From Mobility to Ubiquity Appendix A: Definitions and Technical Notes Broadband definition. The source for broadband data penetration in this chapter, we are relying on a conver- is the International Telecommunication Union (ITU), sion of Internet and broadband subscriber ratios. Our which defines broadband as 256 kb/s or higher estimates are based on the model: (http://www.itu.int/ITU-D/ICTEYE/Indicators/ WTI_Technotes.pdf).This definition is under scrutiny Household Penetration = Total Lines – Total Businesses and likely to be revised in the future—to at least 1 mb/s. Total Households Countries included in the five stages to ubiquity. We get the estimates with two simple steps: (1) using The 157 countries generally overlap with the 134 average household sizes to estimate number of house- economies included in the NRI this year, with the holds per country that serves as denominator; and (2) following exceptions (driven by data availability or deducting from the numerator an estimate of business size—we used a floor of 300,000 people for the stages): subscriptions (based on extrapolation of business regis- 6 economies are included in the NRI but not in the tration data and on the evidence from the city research, stages (Barbados, Burundi,The Gambia, Mongolia, mentioned in the chapter, that all urban businesses Montenegro, and Puerto Rico) and 29 countries are above the micro size tend to have connections). included in the stages but not in the NRI (Afghanistan, Angola, Belarus, Belize, Bhutan, Cape Verde, Central Explaining variation in broadband penetration— African Republic, Comoros, Democratic Republic of beyond income. Regression analysis of the GDP per Congo, Djibouti, Equatorial Guinea, Eritrea, Fiji, capita 2007 (nominal, from the IMF) for 127 countries Gabon, Guinea, Haiti, Lao People’s Democratic (those for which we were able to estimate ecosystem Republic, Lebanon, Liberia, Maldives, Myanmar, Niger, and infrastructure ratings from the NRI components) Republic of Congo, Rwanda, Solomon Islands, underscores the role that income plays (including Swaziland, Bahamas,Togo, and Uzbekistan). through its effect on infrastructure). As we expand the model specification, the analysis also clearly shows that 52 Household penetration ratios. The subscriber ecosystem factors are very significant determinants of data, again as reported by the ITU, are in terms of sub- broadband penetration, adding 12 percentage points scriptions per 100 inhabitants and, thus, combine quite in explanatory value; the gap between ecosystem and different magnitudes: the numerator shows total number infrastructure ratings (indicative of distance from the of lines, accounts, or subscriptions and the denominator balanced “diagonal”) is similarly significant, adding a shows the total population.This ignores the fact that a further 6 percentage points of explanatory value; and, significant number of the lines/accounts/subscriptions finally, urbanization rates are also a significant explanato- are used by businesses and that household sizes vary ry factor (see Table A). across countries. For the purposes of the stages, we have found it more meaningful to consider businesses and households separately.When referring to household Table A: Factors in broadband penetration Explanatory (independent) variables (all significant at 97.5% level) Income Ecosystem Balance gap Urbanization (per capita GDP, (authors’ rating based (difference in ecosystem, (share of urban population R 2 (%) Dependent variable nominal) on NRI components) infrastructure percentiles) in country’s total) Broadband penetration (% of population) X 65 X X 77 X X X 83 X X X 79 7KH *OREDO ,QIRUPDWLRQ 7HFKQRORJ\\ 5HSRUW  ‹  :RUOG (FRQRPLF )RUXP
    71. 1.4: How to Maximize the Economic Impact of Mobile Communications CHAPTER 1.4 Ever since man hunted the mastodon, the ability to communicate over ever-expanding distances has been a key element of human success and advancement. But How to Maximize the the modes of communication available and the power of the telecommunication technologies that people utilize Economic Impact of Mobile have increased dramatically in the last 150 years with the advent of telegraph, telephone service, and now wireless Communications: (mobile) networked telecommunication services offering The Four Waves applications such as email and Internet access, and the ability to ignore geographical limitations in the organi- zation of economic and social interaction. Further, LEONARD WAVERMAN, Haskayne School of Business, London progress in telecommunications has been neither linear Business School, and LECG nor even.The pace of development and innovation has KALYAN DASGUPTA, LECG increased in the last 25 years, resulting in an increasingly boundary-less world. Many of these developments have become an integral part of our daily lives—wireless telephony, Internet usage, and email—and yet just 15 years ago, these were “early stage” technologies, at least from a consumer perspective. The first submarine telephone cable was laid in 1956, just 52 years ago.TAT–1, the joint venture of the UK government and AT&T—a project that was worth £120 million—was one of the three engineering marvels of the 1950s (the other two were Sputnik and the TransCanada Gas Pipeline).TAT–1 had a capacity of 83 simultaneous voice signals. Prior to TAT-1, international 53 calls from New York to London were wireless! (The calls were made via radio waves bounced off the stratosphere.) In 1970, according to the International Telecommunication Union (ITU), there were just 8 telephone lines per 100 inhabitants in France, a number that rose to 30 by 1980, and, with the advent of mobile telephones, 141 lines (fixed and mobile) per 100 inhabi- tants by 2006 (see Table 1).Today we take relatively affordable and reliable long-distance services and near- universal mobile and fixed telephony for granted in the developed world. Yet these examples demonstrate just how recent the modern telecommunications environ- ment is, even in an affluent country such as France. In the developing world, the modern telecommuni- cations environment has largely been created by mobile telephony. Malaysia went from having 1 fixed telephone line per 100 inhabitants to 9 fixed lines per 100 inhabi- tants in 1990, to 92 lines per 100 in 2006, with a mobile penetration rate of 75 per 100. Even more tellingly, Nigeria achieved a teledensity of 25 lines per 100 inhabitants in 2006; 24 of these are mobile telephones. As a result of mobile telephony, teledensity in Nigeria today is at levels similar to that of France in the late 1970s, a remarkable achievement. As Mo Ibrahim, the founder of Celtel, has written, “Fixed lines can never connect Africa: less than 1% [of the population] in Sub Sahara Africa [were connected] 100 years after development of the phone.”1 Three questions immediately come to mind: first, what has been the impact of the significant increase in teledensity on economic output and welfare; second, if 7KH *OREDO ,QIRUPDWLRQ 7HFKQRORJ\\ 5HSRUW  ‹  :RUOG (FRQRPLF )RUXP
    72. 1.4: How to Maximize the Economic Impact of Mobile Communications Table 1: Evolution of total telecommunications distribution of bargaining power among farmers, mid- penetration, selected countries dlemen, and sellers is also transformed. Hence, modern communications in the developing Total world today—principally wireless communications— Fixed Mobile telecommunications Country Year penetration penetration penetration lowers transaction costs and redistributes rents by China 1970 n/a 0 n/a reducing the market power that arises from asymmetric 1980 0 0 0 information.This is best seen in Jensen’s research, which 1998 7 2 9 describes the impact of mobile telephony in changing 2006 28 35 63 a situation in which the primary reason that rural pro- France 1970 8 0 8 ducers (fishermen, in this case) earned lower profits and 1980 30 0 30 1998 58 19 78 consumers paid higher prices was the distribution of 2006 56 85 141 information on demand and supply conditions.Without India 1970 0 0 0 mobile telephones, fishermen and traders typically knew 1980 0 0 0 only the price of fish in a handful of nearby villages or 1998 2 0 2 the nearest town. Fuel costs limited the markets at which 2006 4 15 18 a fisherman could dock; little storage capacity was avail- Malaysia 1970 1 0 1 able, and ground transportation costs were high. “The 1980 3 0 3 1998 20 10 30 inefficiency is clear,” Jensen writes. “While at Badagara 2006 17 75 92 there are eleven fishermen dumping their catch unsold, Nigeria 1970 n/a 0 n/a there are twenty-seven buyers within fifteen kilometers 1980 n/a 0 n/a who are about to leave without purchasing any fish.”2 1998 0 0 0 Following the introduction of mobile telephony 2006 1 24 25 between 1997 and 2001, prices for consumers fell by an Sweden 1970 45 0 45 average of 4 percent, and fishermen’s profits rose by 8 1980 58 0 58 1998 72 46 119 percent. Middlemen who previously earned rents through 2006 61 106 167 their control of information and resources related to the United Kingdom 1970 17 0 17 54 dissemination of information lost out. Jensen found that 1980 32 0 32 profits rose even for fishermen who did not use mobile 1998 55 25 81 telephones.The study by Jensen is a powerful example 2006 56 117 173 of the fact that mobile telephones are very much an United States 1970 34 0 34 information technology, and that these information 1980 41 0 41 1998 65 25 90 technologies affect economic life in very basic and 2006 56 80 136 intuitively understandable ways. At a macroeconomic level,Waverman et al. found— Source: ITU, 2008. based on the then-available evidence—that an increase in mobile telephone penetration had a positive and statistically significant impact on the rate of long-term economic growth.3 Mobile telephones were a vital telecommunications are so important to the economy, aspect of social overhead capital to the extent that an why is Nigeria still vastly poorer than France was in the increase of 10 lines per 100 inhabitants was associated 1970s; and third, how do we maximize the social gains with an increase of 0.6 percentage points in the long- from telecommunications? term rate (20 years) of economic growth. One of the main ways in which modern telecom- The Jensen paper and the earlier paper by munication networks affect economic output and wel- Waverman et al. both estimate the value of access to fare is through their effect on how rents are captured mobile telephones, since they examine the impact of the and distributed. Picture a remote village in Indonesia increase in the availability of the number of telephones today.That village and its inhabitants cannot easily take themselves (see Appendix A for a more detailed review part in a market economy. Agriculture tends to be sub- of the literature on the subject). However, the effects sistence—not because farmers want to tend small lots, described in detail by Jensen and implicitly captured in but because little information and few market opportu- Waverman et al.’s aggregate-level analysis are the effects nities are present. For example, farmers cannot easily of not merely having access, but of usage of modern gather information about prices that prevail for their telecommunication networks. But these approaches and produce at nearby markets. Nor can they easily gather others do not, in their statistical analysis, examine the information about the prices of inputs such as fertilizer contribution to economics and society from modes of and feed that they need for their farms.The simple use.Thus a next step would be to examine how access fact of owning a mobile telephone can transform their and usage contribute to society.4 intelligence-gathering capabilities, and with it the 7KH *OREDO ,QIRUPDWLRQ 7HFKQRORJ\\ 5HSRUW  ‹  :RUOG (FRQRPLF )RUXP
    73. 1.4: How to Maximize the Economic Impact of Mobile Communications The existing research does, nevertheless, at some that time was fixed lines, a connection to every house- level answer the questions surrounding the value to hold provided universal service. Policy was devoted to society from modern telecommunication networks. ensuring that each household had access to the telephone However, one needs also to consider (1) whether factors system. Mobile telephones change the notion of univer- such as taxation, regulation, social customs, and the like sal access from one telephone per household to one enhance or moderate the value that individual societies telephone per person. derive from investment in modern telecommunication Usage, as discussed above, is the means through networks, chiefly mobile networks in developing nations; which the productivity and economic benefits of com- (2) to what extent investment in mobile telecommuni- munication networks are manifested. Usage of mobile cation networks requires complementary investment in telephones is affected by the cost of calls (here taxes are education, other basic infrastructures, and the like; and important as an obstacle to usage) as well as by institu- (3), to drive productivity growth beyond the huge tional arrangements such as the sharing of costs between effects of simple access, how do these complementary the calling and receiving party. If (as the econometric research on fixed-line telephony suggests),6 demand for investments in assets and skills boost the “bang for the buck” that mobile investment might provide? calls or usage is significantly more elastic than demand Answering these questions will explain both why for access, then high levels of taxation on mobile tele- Nigeria today is poorer than France in the 1970s despite phones might lead to significant “deadweight loss” (loss having similar teledensity levels, and also what Nigeria of welfare) as well as reduce the potential growth and might need to do to boost the impressive strides that productivity benefits derived from the infrastructure in the mobile telecommunications sector has made in that place. country. Literacy rates in France in the 1970s were far Insufficient attention has been paid to the impact of higher than they are in Nigeria today, roads were better, institutional arrangements. Penetration appears to be and health care was better. Clearly the simple addition somewhat lower in some “receiving-party-pays” coun- of more mobile telephones cannot in itself cure the tries (countries where the receiving party is charged for deep-rooted problems that countries such as Nigeria receiving a call on a mobile telephone) than in “calling- face.There is no magic bullet solution for economic party-pays” countries (where the receiving party makes 55 development, but mobile telecommunications has no contribution to the costs of the call). Penetration of indeed a “positive disruptive” impact on life in many mobile telephones also appears to be lower in countries developing economies, especially in rural areas, where that utilize multiple standards (Global System for the mere availability of information poses a significant Mobile communications, or GSM; Code Division challenge to established ways of doing things. Further, Multiple Access, or CDMA; etc.) relative to countries the mobile telecommunications sector provides a signifi- that utilize just the GSM standard. Crucially, however, cant example of an industry that has survived, thrived, the same is certainly not true for data on minutes of and proliferated even in the seemingly most unpromis- use—usage is higher in countries with multiple stan- ing environments. dards as well as in countries where the receiving party pays part of the costs of a call. Increased competition emanating from the institutions may be the answer; The four waves of communications more research is needed. Indeed, one might argue that there are roughly four Finally, complementary skills and assets refers to the stages of development of an information society, which concept that productivity growth today emanates not one might call the four waves of communication technologies: just from simple access, universal service, and usage, but also from what one might term the “quality of usage” • simple access, or “smart usage.” Using firm-level data allows one to • universal service, address some quite targeted hypotheses regarding, for • usage, and example, the impact of particular technologies, manage- • provision of complementary skills and assets. rial practices, and public policies on firms productivity, output, and efficiency, while being able to control for Simple access: a telephone in a village, for example, the other characteristics of firms that also effect produc- provides huge social and economic benefits. As shown tivity, output, and efficiency. by the example of Jensen above,5 the ability to make or Although we are aware of no specific research on take a call diminishes the asymmetry of information the productivity impact of mobile telephones conducted control.The literature generally illustrates the enormous at the firm level, there is a significant body of literature benefits of access. One line per village might well then that looks at the impact of information and communi- have huge social payoffs. cation technologies (ICT) on firms.The findings from Universal service was and is the policy driver for this literature are deeply informative: papers by several much of North America and Western European noted authors, including Brynjolfsson and Hitt,7 suggest telecommunications policy. Because the technology at that the payoff to firms from investing in ICT is highest 7KH *OREDO ,QIRUPDWLRQ 7HFKQRORJ\\ 5HSRUW  ‹  :RUOG (FRQRPLF )RUXP
    74. 1.4: How to Maximize the Economic Impact of Mobile Communications when firms have the freedom and willingness to reor- broadband wireless access may represent the most cost- ganize themselves around the ICT that is in place. effective way to bring broadband or even Internet access Other research finds that the impact from investment to the masses. Further enabling the introduction of in ICT may not materialize unless and until there is a mobile broadband is likely to stimulate inter-platform significant amount of investment in “complementary competition in the broadband market in these countries, capital”—such as worker training, for example. with the main different platforms likely to be public The findings from this literature are relevant to any switched telephone network (PSTN) for digital sub- future research agenda for studying the economic impact scriber line (DSL) access, fixed wireless (technologies of mobile telephones—which are the most widely such as WiMax), and wireless (3G and 4G technologies). diffused form of ICT hardware in most developing Developing countries are likely to enjoy the benefit of nations. One would expect that the impacts of mobile adopting 3G+ technology at a time when devices and telephony, or ICT more generally, are highest in nations applications relevant to enhancing the mobile broadband that have a cultural and regulatory climate that wel- experience are entering a mature developmental phase; comes change, and where firms and individuals are most thus one can expect relatively rapid diffusion of 3G free to reorganize their work habits to make optimal use technology in these emerging markets. of technology.While it may seem obvious and intuitive that this is the case, the reality is that the literature on Some policy considerations mobile communications and telecommunications gener- Despite the fact that many governments and mobile ally has not, to date, looked in sufficient detail at factors network operators are in total agreement regarding the beyond penetration. growth benefits of mobile telephony, several aspects of We suggest that only when a country has evolved government policy in developing countries actually through all four waves described above is it able to affect the mobile sector in adverse ways.Two areas of make the fullest use of technology.The literature and policymaking where governments in developing nations policy debate that we have experienced has to date con- (particularly) would be well served by taking a broad centrated essentially on the first two waves. In part, this view of the mobile telecommunications sector as a emphasis is an artifact of data availability.To truly study potential catalyst for growth, rather than as a ready 56 the impact of usage and complementary capital in a revenue source, are taxation and licensing. Below, we manner similar to the research that has been conducted discuss these policy aspects briefly. for the impact of ICT in developed economies, one would have to collect detailed firm-level and consumer- Consequences of asymmetric taxation on mobile usage level data, which requires a patient and costly research The GSM Association has prepared several papers docu- program. However, some initial studies of consumer- menting the incidence of taxation on the mobile sector. level demand patterns are being conducted for countries In some countries, such as Turkey, taxes represent as such as South Africa.8 Clearly, the development of such much as 44 percent of the cost of owning and operating research should be of paramount importance, as only a mobile telephone.The impact of taxation on usage when we understand the role of usage and complemen- (e.g., the taxes that some countries levy as a proportion tary capital in governing gains from ICT in a developing- of a subscribers’ bill that includes usage and line rental country context can we provide policymakers with a charges) might be particularly significant. truly robust assessment of the policies that will enable Although there is little detailed econometric them to maximize the returns from ICT investment. research on the issue, it is likely that the price elasticity We have used these concepts to produce a new of demand for “calls” or “minutes” is at least somewhat method to measure the “connectedness” of countries. higher than the price elasticity of demand for “access” This Connectivity Scorecard adds to the literature, in a way (or owning a telephone).Thus, taxes are likely to be a similar to that of the Networked Readiness Index in bigger barrier to utilization of mobile telephones than this Report, by providing novel ways to incorporate they are to ownership of a mobile telephone. infrastructure, access, and usage into measures of com- Hausman provides a relatively simple method for munication systems importance.9 evaluating consumer welfare gains from introducing The remainder of this chapter provides some recent mobile telecommunications and for assessing the dead- estimates of the welfare loss from high mobile taxation weight loss caused by taxation of mobile telecommuni- in developing nations.We then conclude by drawing cations.10 Hausman’s papers suggest that the deadweight some lessons from the literature that might be used to loss is likely to be significant when (1) demand is evaluate arguments regarding the appropriate role of relatively elastic and (2) when an industry has relatively government intervention and regulation in the current high fixed costs and relatively low marginal costs challenging economic environment. (i.e., gross margins are high). Finally, it is worth mentioning that 3G or wireless Using sensible values for elasticity and gross margins, mobile telephony could have a particularly important we recently calculated that the annual deadweight loss impact in the developing world. 3G and other modes of 7KH *OREDO ,QIRUPDWLRQ 7HFKQRORJ\\ 5HSRUW  ‹  :RUOG (FRQRPLF )RUXP
    75. 1.4: How to Maximize the Economic Impact of Mobile Communications caused by mobile telecommunication taxation on the may make it harder to attract international capital usage of mobile telephones in Turkey was over US$2 to the table; at the margins, international capital billion, or more than 60 cents for every dollar raised in may be migrated to other, more attractive and more tax revenues.11 By contrast, the typical deadweight loss certain environments. In the current challenging from general taxation is around 20 to 30 cents per dollar economic environment, capital is no longer plenti- of tax raised.That is,Turkey would raise economic wel- ful and marginal differences will assume especial fare and economic growth by shifting taxes from mobile importance.Thus the rules of the game have to be use to other goods and services. made clear and transparent, and they need to be fair The mobile sector provides an attractive target for rules. exchequers in developing nations—mobile operator rev- enues are relatively easy to record, and most operators • Although economists would prefer auctions over are large companies that happen to be good corporate taxation as a means to raise government revenues citizens. Absolutely no economic theory of commodity (as taxation is more distorting), the valid goal of taxation supports the notion that mobile telephones raising revenues should not become the only goal should bear an especially high tax burden. Mobile tele- of the auction, or indeed the raison d’être for licens- phone usage is not a “sin” that merits a sin tax, it does ing policy. Recently there have been growing calls not have negative externalities meriting a Pigouvian tax for regulators in the United Kingdom and else- designed to reduce usage of mobile telephones (perhaps where in Europe to consider “speed for spectrum” the opposite can be argued to be desirable), and mobile swaps—that is, to give away spectrum in return for telephones are not what economists would describe as commitments by successful licensees to commit to invest in faster broadband access networks.12 While complements to leisure. Mobile telephones are not a luxury good, and high mobile telephone taxation may we continue to think that the market-oriented reg- particularly discourage usage by less affluent sections of ulatory approach that has emerged in Europe and society whose ability-to-pay is relatively low.Thus high North America over the last 20 years remains the mobile telephone taxation is iniquitous and regressive in best way to promote efficient investment and that its nature. within such an approach auctions will remain 57 There is another impact of taxation besides the important, the auction process should take into efficiency or static welfare losses described above. account not just revenues and competition policy Taxation may dampen investment and entry in the concerns (preventing collusion and market manipu- mobile telecommunications sector. Given the likely high lation), but also long-term economic development social rates of return on telecommunications investment, goals.There may not necessarily be tradeoffs lower investment is likely to translate into lower eco- involved between these different goals (indeed, the nomic growth. Further, given that the “broadband for primary designer of the UK auctions, Professor the masses” may largely be a mobile-driven story in at Klemperer, would insist that there are no tradeoffs least some developing markets, and that entry by mobile involved), but to the extent that there are tradeoffs, licensing policy should take them into account.13 or wireless broadband operators into the broadband space has a key role to play in providing sufficient investment and competitive incentives for other players • Today, if cash-strapped operators are forced to in the broadband sector (fixed PSTN, and fixed wire- delay their investment in actual network assets, or, less), one may have reason to believe that the economic alternatively, if successful licensees have the luxury impact of mobile taxation may affect large swathes of of limited competition that allows them to wait the economy in an adverse fashion. until the private benefits from network rollout are maximized, then there could be a significant loss in consumer welfare.14 Delaying licensing or spectrum Licensing and auctions policy Besides taxation, it may also be tempting for governments availability to take into account the possibility that to use licensing policy solely as a means to raise revenues handset prices and thus ownership costs for con- or (worse) to orchestrate industry outcomes and favor sumers may fall may also not constitute sensible particular players, technologies, or market outcomes over policy. For example, even at today’s prices a signifi- others. Although we believe that auctions are certainly cant segment of consumers in India and similar the theoretically preferred way to allocate valuable spec- developing nations is willing to pay for advanced trum in most circumstances, there are a variety of other wireless services (i.e., there is a significant consumer considerations that licensing policy ought to take into surplus from introducing services today). If services account: to such consumers are held up by government or regulators for two years, say, then the entire con- • Frequent revisions and lack of clarity in the licens- sumer surplus that could have been realized over ing process sow uncertainty and confusion in the these two years is lost. minds of industry players. In particular, uncertainties 7KH *OREDO ,QIRUPDWLRQ 7HFKQRORJ\\ 5HSRUW  ‹  :RUOG (FRQRPLF )RUXP
    76. 1.4: How to Maximize the Economic Impact of Mobile Communications • Unlike Europe, the developing countries have the investment, we are still lacking a true understanding of benefit of introducing 3G technologies at a time how the benefits from mobile network investment can when the demand for such technologies, and the be maximized.We are also lacking an understanding of applications and devices that enhance the value which policy and monitoring targets should be cho- of 3G networks, are significantly well developed. sen—for example, in many countries the penetration This is one more reason to believe that it is in rates of mobile telephones are incorrectly measured and national regulators’ interest to make it attractive for overstated because of the incidence of multiple sub- operators to invest in actual physical network assets scriber identity module (SIM) cards among pre-paid sooner rather than later.The long-lived and durable customers. On top of this, penetration may not translate nature of these telecommunications assets is likely into higher usage if market or regulatory factors cause to generate significant consumer and business bene- prices to be higher than they might otherwise be. In fits well into the future, and the higher economic such circumstances, it may not be adequate to monitor growth that results should be factored against the merely penetration rates as a measure of telecommuni- short-term boost to government finances from auc- cations development. tions designed only to maximize revenues.15 We are Additionally, the early development of 3G mobile not condemning auctions—they are the mechanism networks may have significant potential in the develop- of choice; however, their design should not have ing world. As was the case with the first wave of 2G governmental revenues as their sole objective. mobile network deployment, those who argue that the demand for mobile broadband and what they deem as “high-end” services is limited may be underestimating the thirst for technology in the developing world as Conclusion well as the demonstrated ingenuity of consumers and We do not pretend that mobile telecommunications businesses in the developing world to put technology or ICT is a magic remedy for economic development, to good use. Again, the relative infirmity of fixed-line or that the financing of government activities in such networks could make 3G mobile broadband (and its challenging times as the present credit crisis is at all a successors) the best path forward for making mass-market simple task. However, we stress the crucial importance 58 consumer broadband a reality in many developing of investment in socially valuable infrastructure such as nations. It would thus be unfortunate if government mobile telecommunication networks, and thus the value policies on taxation and licensing interfered with the of policies that enable such investment to be timely development of 3G networks. made efficiently and on a timely basis. The discussion above addressed some simple points: Notes 1 Ibraham 2005. • the massive and entirely unforeseen success of 2 Jensen 2007, pp. 882–83. telecommunications and, in the last decade, of 3 See Waverman et al. 2005. mobile telecommunications in the developing world; 4 For instance, we are not aware of studies that capture the differ- ential impact of mobile telecommunications or even fixed lines in countries where usage levels are high relative to where usage • the positive impact on economic growth and levels are low. For instance, the United States has a much lower reported mobile penetration rate than Italy, but much higher min- welfare of the initial wave of network rollout utes of use (even when one considers just outgoing minutes). In in the developing world; which country does mobile telephony have a larger economic impact? These sorts of questions in fact assume that it has an even greater importance in developing nations. Similarly, there are • the still inchoate nature of the research on mobile few data and little systematic analysis on the impact of usage of mobile data services, although this is a function of the relative telecommunications and their impact on economic newness of such services. growth, particularly with respect to the distinctions 5 Jenson 2007. that we draw between access on the one hand and 6 See Perl 1983 and Taylor 1994. usage and complementary capital on the other; and 7 See Brynjolfsson and Hitt 2000. • the role of taxation and the licensing process in 8 See Gasmi et al. 2008, for example. ensuring adequate investment and consumer 9 The Connectivity Scorecard is an index that looks at ICT usage benefits in the mobile sector. and infrastructure, and links it to the prosperity of 25 countries. See Waverman 2009. 10 See Hausman 1997, 2000. We think that the world, particularly the developing world, has seen only a glimpse of the potential economic 11 Waverman 2008. and social value from investment in mobile telecommu- nication networks. However, until there is further research on the key areas of usage and complementary 7KH *OREDO ,QIRUPDWLRQ 7HFKQRORJ\\ 5HSRUW  ‹  :RUOG (FRQRPLF )RUXP
    77. 1.4: How to Maximize the Economic Impact of Mobile Communications 12 See, for example, Bailey 2009. One catalyst for the recent propos- Pindyck. R. S. 2004. “Mandatory Unbundling and Irreversible Investment in Telecom Networks,” NBER Working Paper No. als for a “public sector” type approach to licensing appears to be the UK government’s newfound willingness to reconsider the idea 10287. Cambridge, MA: National Bureau of Economic Research. of significant public intervention in developing next-generation Röller, L.-H. and L. Waverman. 2001. “Telecommunications broadband. Infrastructure and Economic Development: A Simultaneous Approach.” American Economic Review 91 (4): 909–23. 13 As an example, too low a reserve price might encourage collu- sion. However, in the current instance of the Indian spectrum auc- Taylor, L. D. 1994. Telecommunications Demand in Theory and Practice. tion, too high a reserve price might drive away potential interna- Boston: Kluwer Academic Publishers. tional bidders. Further, there have been complaints that the licens- ing process already favors established domestic players. In such Waverman, L., M. Meschi, and M. Fuss. 2005. “The Impact of cases, one must take into account the actual likelihood of collu- Telecoms on Economic Growth in Developing Countries, Africa: sion as well as the nature of the players that may or not be affect- The Impact of Mobile Phones.” Vodaphone Policy Paper Series 2, ed by how the reserve price is set. The fact that capital is very March. scarce at the moment may also be worth considering in setting Waverman, L. 2008. “The Economics of Taxing Mobile Phone Usage in auction terms (i.e., look at the ability to pay of different parties). Turkey.” LECG, Mimeo. Finally, the fact that parties may not actually have a realistic idea of the real value of their spectrum (as appears to have been the Waverman, L. 2009. The Connectivity Scorecard. Study commissioned case with some past 3G spectrum auctions) means that they may by Nokia Siemens Networks. Available at http://www.connectivity end up paying “too much” for spectrum. While one might say scorecard.org. that this payment is sunk, and will thus not affect their future investment decisions, in practice the cost of capital could be affected by the perception that firms have paid too much for spectrum. Pindyck (2004) provides a good discussion of how one should properly think of “sunk” costs. 14 Here one must take into account the fact that operators are typi- cally unable to capture all the benefit from their investment in socially valuable infrastructure such as telecommunication net- works, and that there may be a difference in the privately optimal level and timing of investment and the socially optimal investment schedule. 15 One might argue, again, that the short-term boost to government finances looms large in any net present value type of calculation. Further, the government could re-invest the revenues raised in other sectors and activities. However, against this argument one must consider the finding of DeLong and Summers 1991 that suggests that investment in equipment, machinery, and infrastruc- 59 ture yields especially high returns for society, but also that the returns are highest where the investment is market-conforming (i.e., privately made) rather than market-replacing (government-led). References Bailey, D. 2009. “Carter Urged to Consider ‘Frequency for Fibre’ Swap.” PC Magazine, January 19. Available at http://www.pcmag. co.uk/computing/news/2234219/nesta-proposes-frequency-fibre. Barro, R. 1991. “Economic Growth in a Cross-Section of Countries.” Quarterly Journal of Economics 106 (2): 407–34. Brynjolfsson, E. and L. M. Hitt. 2000. “Beyond Computation: Information Technology, Organisational Transformation, and Business Practices.” Journal of Economic Perspectives 14 (4): 23–48. DeLong, J. B. and L. Summers. 1991. “Equipment Investment and Economic Growth.” Quarterly Journal of Economics 106 (2): 445–502. Gasmi, F., M. Ivaldi, and L. Recuero Virto. 2008. “An Empirical Analysis of Cellular Demand in South Africa.” Mimeo. Hausman, J. A. 1997. “Valuation and the Effect of Regulation on New Services in Telecommunications.” Brookings Papers on Economic Activity: Microeconomics. Available at http://econ- www.mit.edu/files/1024. Hausman, J. A. 2000 “Efficiency Effects on the US Economy from Wireless Taxation.” National Tax Journal 53 (September): 733–42. Ibraham, M. 2005. “Celtel: An African Success Story.” PowerPoint Presentation at London Business School, April. ITU (International Telecommunication Union). 2008. World Telecommunication/ICT Indicators, September. ITU. Available at http://www.itu.int/ITU-D/ICTEYE/Indicators/WTI_Technotes.pdf. Jensen, R. 2007. “The Digital Provide: Information (Technology), Market Performance, and Welfare in the South Indian Fisheries Sector.” Quarterly Journal of Economics 122 (3): 879–924. Perl, L. J. 1983. Residential Demand for Telephone Service 1983. White Plains, NY: National Economic Research Associates. 7KH *OREDO ,QIRUPDWLRQ 7HFKQRORJ\\ 5HSRUW  ‹  :RUOG (FRQRPLF )RUXP
    78. 1.4: How to Maximize the Economic Impact of Mobile Communications Appendix A: Details of previous studies Waverman L., M. Meschi, and M. Fuss. 2005. fruitful exercise for governments, operators, and “The Impact of Telecoms on Economic Growth in professionals alike in the development field to Developing Countries, Africa: The Impact of Mobile examine whether a longer time-series of data, Phones.” Vodafone Policy Paper Series 2, March. combined with an attempt to incorporate more explicit measures of usage (i.e., to look at not just diffusion but also utilization of the telecommunica- • Waverman et al. employed two different approaches tion capital stock) would yield results that are simi- to estimate the impact of the rollout of mobile tele- lar or provide other relevant insights regarding the phones on economic growth—the annual growth effect of mobile telecommunications. production function (APF) approach following the work of Röller and Waverman and the endogenous technical change (ETC) approach similar to the work of Barro.1 Jensen, R. 2007. “The Digital Provide: Information (Technology), Market Performance, and Welfare in the South Indian Fisheries Sector.” Quarterly Journal • Barro provided the more robust and sensible of Economics 122 (3): 879–924. estimates of the impact of mobile telephony on economic growth. Data on 92 countries—high • Jensen provided the first microeconomic study that income and low income, from 1980 to 2003— looked at the impact of mobile telecommunications were used and Waverman et al. tested whether on the distribution of information in a rural, the introduction and rollout of mobile telephone developing-economy setting; further, unlike the networks added to growth. numerous case studies that preceded his effort, Jensen uses rigorous economic techniques to • The finding was that mobile telephony had a posi- quantify the impact of mobile telecommunications tive and significant impact on economic growth, on the relative well-being of different actors and this impact was twice as large in developing 60 (fishermen, consumers, and middlemen or agents) countries as in developed countries.This result con- in the rural economy. curs with intuition, since developed economies by and large had fully articulated fixed-line networks • Jensen finds that the introduction of mobile in 1996, while developing countries had little telecommunication infrastructure of any kind.2 telecommunications had a significant impact on the fishing economy in rural Kerala, India.The main effect that he describes is the redistribution • The growth dividend of increasing mobile tele- of information, which enables significant gains in phone penetration in developing countries was what economists would term allocative efficiency. estimated to be substantial. All else equal, the Simply put, mobile telephones enabled fishermen Philippines (with a penetration rate of 27 percent to determine where there was demand that matched in 2003) might enjoy annual average per capita their supply, and at what price they could sell their income growth of as much as 1 percent higher than produce. Mobile telephones greatly reduced the Indonesia (with a penetration rate of 8.7 percent role of human “market-makers” such as middlemen, in 2003) owing solely to the greater diffusion of and reduced the rents available to these middlemen. mobile telephones, were this gap in mobile penetra- Interestingly, the introduction of mobile telecom- tion to be sustained for some time. Overall, the munications resulted in a reduction in the disper- Waverman et al. paper found that the long-term sion of prices for the fishermen’s produce. average growth rate of a developing country could be boosted by 0.59 percentage points per annum • As discussed previously, Jensen found that fishermen for every 10 mobile telephones per 100 inhabitants increased their profits by 8 percent, whereas con- added. sumers on average paid 4 percent less for their fish (a staple of the diet in Kerala). • However, the Waverman et al. paper explored the impact of mobile telephones at a time when the • Jensen’s findings do not mention the term GDP development of mobile telephone networks was anywhere. But they provide truly robust evidence still very much in progress in the developing world. to support the findings of Waverman et al. In the Further, the paper (in common with the approach developing world, mobile telephones have a “market- utilized by Röller and Waverman) used the mobile making” effect—that is, they have the effect of penetration rate as an embodiment of the diffusion transforming an inefficient, restricted market char- of the telecommunication capital stock through the acterized by huge asymmetries in the distribution wider economy. It would be a potentially 7KH *OREDO ,QIRUPDWLRQ 7HFKQRORJ\\ 5HSRUW  ‹  :RUOG (FRQRPLF )RUXP
    79. 1.4: How to Maximize the Economic Impact of Mobile Communications Appendix A: Details of previous studies (cont’d.) of information into something resembling the efficient well-functioning markets in which one can expect the classical results of welfare and general equilibrium economics to hold.Thus there is a fundamental and transformative impact of mobile telephones on the very nature of the economy under consideration; in the developing world, mobile telephones are truly a disruptive technology, but this disruption is beneficial since it shakes out the inefficiencies and limited opportunities associated with economies in which communication is difficult and information is asymmetric. In the developed world, while mobile telephones may help markets to function better, the effect is funda- mentally an incremental or augmentative one, rather than a transformative one. Notes 1 See Röller and Waverman 2001 and Barro 1991. 2 The addition of mobile networks had significant value-added in the developed world, reflecting not just the mobility value of the new technology but also the inclusion of disenfranchised consumers through pay-as-you-go plans that were not available for the fixed- line network. 61 7KH *OREDO ,QIRUPDWLRQ 7HFKQRORJ\\ 5HSRUW  ‹  :RUOG (FRQRPLF )RUXP
    80. 7KH *OREDO ,QIRUPDWLRQ 7HFKQRORJ\\ 5HSRUW  ‹  :RUOG (FRQRPLF )RUXP
    81. 1.5: Unshackled CHAPTER 1.5 Over the past 20 years, mobile communications have become an indispensable part of life for billions of users worldwide. About 2.9 billion people currently enjoy Unshackled: How Regulation mobile service, with an additional 700 thousand signing up each day. As usage has swelled, the mobile phone Can Amplify Mobile Service itself has evolved beyond voice communication alone, allowing consumers to read news, listen to music, search Benefits in Emerging Markets for nearby restaurants, take photos, and make payments. Not surprisingly, the mobile segment of the industry SCOTT BEARDSLEY, McKinsey & Company, Inc., Belgium has quickly overshadowed fixed-line communications, LUIS ENRIQUEZ, McKinsey & Company, Inc., Belgium accounting for 55 percent of the global industry’s MEHMET GÜVENDI, McKinsey & Company, Inc., Turkey US$2 trillion annual revenues in 2008 (Figure 1). Mobile communications play a central role in MIGUEL LUCAS, McKinsey & Company, Inc., Portugal emerging markets, acting as a crucial enabler of economic OLEG TIMCHENKO, McKinsey & Company, Inc., Russia growth and development. Given the inadequate fixed- SERGIO SANDOVAL, McKinsey & Company, Inc., Belgium line phone infrastructure most of these countries endure, ASHISH SHARMA, McKinsey & Company, Inc., Singapore mobile service offers millions a unique opportunity to stay in touch easily with their families, friends, and business partners. For example, in Indonesia, only 10 people in 100 have fixed-line phone service, while 52 percent of the population owns a mobile phone. Beyond staying connected, mobile service allows people to access other services they could not use before—such as micro-payments. For instance,Vodafone runs a very successful mobile money transfer operation in Kenya that has attracted over 5 million customers since its launch in March 2007.1 The company has also partnered 63 with an international payment provider to offer cross- border money transfers in addition to domestic payments. Emerging markets hold an important position on the mobile industry’s agenda as well, because of their strong potential.They contain 75 percent of the world’s subscribers today, and—given the difference in growth rates between emerging and mature markets (i.e., 11.8 percent versus 3.3 percent per year, respectively, in 2008)—this number will grow to 79 percent by 2015. These subscriber-heavy markets also hold some of the industry’s best players: Ukrainian operator Kyivstar, a part of the Telenor group, generated a 62 percent EBITDA (earnings before interest, taxes, depreciation and amortization) margin in the third quarter of 2008,2 and Russian mobile operators have traditionally enjoyed margins that approach 50 percent (the global average for the industry is about 45 percent).3 But succeeding in these markets requires different and innovative approaches from those needed for devel- oped economies. Emerging markets thrive on unique services such as the micro-payment plans mentioned earlier; “torch phones” that feature multiple LED lights for users who live in areas with little or no regular electricity service; multiple phone books for users who The authors wish to thank Evgeny Timko of McKinsey and Company for researching the facts supporting the findings of this chapter. The views expressed in this chapter correspond to those of the authors and not those of McKinsey & Company. 7KH *OREDO ,QIRUPDWLRQ 7HFKQRORJ\\ 5HSRUW  ‹  :RUOG (FRQRPLF )RUXP
    82. 1.5: Unshackled Figure 1: Mobile telecommunications revenue growth (US dollars, trillions) +7% 1.98 1.87 10 1.73 10 Other* 10 35 37 Fixed communications 39 55 53 Mobile communications 51 2006 2007 2008** 2,308 2,666 2,923 Unique mobile phone users (millions) Source: Dataquest Insight, June 2008. *Other includes infrastructure, enterprise networking, and communications. **Estimates. 64 share their handsets with family members; or solar The many benefits of going mobile device chargers for use in sunny Africa (see Box 1). The mobile industry often accounts for 2 percent to 3 The enormous societal and economic benefits percent of an emerging market’s GDP, with a range that mobile service can bring to emerging markets extend extends from 1.4 percent in Russia to 5.3 percent in well beyond the industry’s direct contribution to a Jordan (Figure 2). However, the indirect contribution of country’s GDP, although that in itself is not small.To the mobile industry to the economy can range several capture the full potential that wireless service offers, times higher than this observable GDP effect, because it governments and industry players must focus on making includes GDP contributions from other companies in the widest possible slice of society “mobile.” Many mar- the wireless sector, such as handset manufacturers and kets fail to meet this challenge.Those that do, such as retailers, content providers, and equipment manufacturers, China or the Philippines, typically enjoy mobile pene- as well as what we call the “end-user surplus.”This sur- tration rates far greater than those seen in peer countries plus includes not only direct productivity gains related by focusing on high coverage rates (which coincide to the use of mobile communications, but also indirect with penetration) and low user prices, and they make consumer benefits such as a peace of mind, security, and sure both outcomes are sustainable. access to family. To capture the economic benefits wireless can bring For example, take the case of a taxi driver who while also ensuring that the poorest members of society shares his cab with another driver in alternating 12-hour can use this service, regulators and operators must work shifts. Buying a mobile phone improves his productivity together to lower the cost of ownership, making mobile because he now receives six or seven calls per month phones affordable to all.They also need to extend cover- from regular passengers, which saves him from spending age beyond cities to rural areas, where many millions of about four hours a week seeking passengers. He uses his potential users await. In this chapter, we will attempt to mobile phone to contact other taxi drivers if, for exam- quantify the benefits of mobile services in emerging ple, he needs to ask directions to unfamiliar destinations. markets, discuss reasons why some nations fail to achieve This person also uses his phone to stay in touch with his these benefits, and suggest several regulatory areas where family and friends, and his employer benefits as well: the policymakers and industry players can work together to company now provides an instant lost-and-found service unlock the value of the mobile industry in emerging to passengers. markets. For this taxi driver, the benefits of going wireless take two forms, which together we call the end-user surplus. The first involves greater productivity.4 McKinsey 7KH *OREDO ,QIRUPDWLRQ 7HFKQRORJ\\ 5HSRUW  ‹  :RUOG (FRQRPLF )RUXP
    83. 1.5: Unshackled Figure 2: Contribution of mobile telecommunications services to GDP, 2008 (percent) Jordan 5.26 Morocco 3.48 South Africa 3.38 Nigeria 3.29 Egypt 2.50 Pakistan 2.33 China 2.23 Ukraine 2.18 Philippines 2.18 Argentina 2.04 Brazil 2.00 3.7x India 1.92 Czech Republic 1.88 Poland 1.84 Saudi Arabia 1.51 Peru 1.44 Russian Federation 1.41 Average: 2.40 Source: Pyramid Research, 2008d. 65 Box 1: Successful innovations in mobile telecommunications from emerging markets The mobile telecommunications industry has provided many • The Village Phone program launched by Grameen telecom innovations that are used with great success in emerging mar- enables poor rural subscribers to own a phone and turn it kets. Some of these are listed here: into a profit-making venture; the subscriber can buy, on credit, a simple mobile phone with very cheap billing rates • M-Pesa is a mobile money service offered by Safaricom in to provide paid services to the people in the adjoining area. Kenya; it offers savings, domestic money transfers, airtime — Users: There are over 270,000 Village Phone Operators in purchases, and limited bill pay of such services as satellite 50,000 villages. television or insurance plans. — Area: Bangladesh, Uganda, Rwanda. — Users: About 40 percent of all Safaricom customers signed for M-Pesa service (over 4 million of about 10.2 • Torch phones are designed for people living with limited million total subscribers). access to electricity. — Agents: There are more than 5,000 M-Pesa agents. • Multiple phone books that open on a single handset were Service is also being expanded to enable card-free with- initially intended for rural India, where a single handset is drawals through ATMs. typically shared by two or more families. — Area: The service currently works in Kenya, with pilot programs testing money transfer service between Kenya • “Call Me” service provided by Vodacom in South Africa and the United Kingdom (in cooperation with Western allows subscribers to send up to five messages per day, Union). free of charge, requesting a call back from the receiver. • CellBazaar is a service from Grameenphone in Bangladesh that allows subscribers to buy or sell over Source: M-PESA: http://www.safaricom.co.ke; CellBazaar: http://www.cell their mobile phone (i.e., short message service–based e- bazaar.com; Solar panels: Receiver magazine #20 | Emerging markets, June 2008, http://www.receiver.vodafone.com/20-africas-grassroots; auction system, though CellBazaar also offers an online The Village Phone: http://www.grameenfoundation.org; Torch phones: platform) Receiver magazine #20 | Emerging markets, June 2008, http://www.receiver.vodafone.com/20-africas-grassroots; Multiple phone — Users: CellBazaar has more than 1 million users. books: http://www.domain-b.com/companies/companies_n/Nokia/ 20080402_multiple_phone_books.html; Call Me: www.vodacom.com. • Solar panels are falling in price, allowing low-income sub- scribers in rural areas with erratic power supply use them to charge their mobile phones. 7KH *OREDO ,QIRUPDWLRQ 7HFKQRORJ\\ 5HSRUW  ‹  :RUOG (FRQRPLF )RUXP
    84. 1.5: Unshackled Figure 3: Economic value of mobile telecommunications industry for enterprise and end users in China, 2005 3a: Economic value and productivity growth 100 million Number of high-mobility $620 billion workers Output of x high-mobility workers $560 billion $6,160 Output of GDP x high-mobility contribution 90 percent workers with per $33 billion mobile Mobile phone high-mobility Economic penetration worker value for x among high-mobility high-mobility $34 billion 6 percent users workers Economic value from Average productivity improve- + productivity ment in areas with improvement $34 billion $1 billion fixed-line connectivity (percent) Economic Economic + value for value for enterprise low-mobility ~0 end users users Economic value from accessibility in areas without fixed-line connectivity 66 Source: ILO, 2008; China Statistics Bureau, 2005; McKinsey analysis. 3b: Composition of high-mobility workers (percent) Total high-mobility workers: 101 million 5.2: Business/finance Total workers: 410 million 2.8: Social services professionals 13.2: Direct customer service High mobility: 25 29.2: Transportation- related 13.6: Sales-related Low mobility: 75 14.2: Other professionals 21.8: Management (legal, education, librarian, occupations design, media, entertainment, health care, etc.) Source: ILO, 2008; China Statistics Bureau, 2005; McKinsey analysis. 7KH *OREDO ,QIRUPDWLRQ 7HFKQRORJ\\ 5HSRUW  ‹  :RUOG (FRQRPLF )RUXP
    85. 1.5: Unshackled Figure 4: Economic impact of mobile telecommunications industry in India, China, and the Philippines, 2007 (percent of GDP) 7.4 Source of wireless impact 5.8 • The total wireless economic 3.6 impact is far larger than 4.7 1.7 usually thought End-user surplus* 1.1 — Operator GDP contribution 1.9 1.6 Indirect impact from is only ~1/3 of the total 1.7 other wireless sectors value Direct impact from 2.2 2.2 — China’s high indirect 1.9 operators impact (~40 percent) is due to high net exports India China Philippines Total value as multiple — Wireless impact in end 3.2–4.5 ~4.5 ~3.8 of direct impact times user surplus is high • Penetration is the major Penetration of unique 49 28 60 driver for different wireless subscribers (percent) development Nominal GDP (US$ billions) 3,280 1,171 144 Source: ITU, 2008; EIU, 2008; IHS Global Insight, 2008; Yankee Group Global Forecast 2007; IDC, 2007; McKinsey analysis. * Rough low-bound estimation using historical ARPU, inflation adjusted. 67 calculated that the economic value to enterprise and the final 25 percent came in the form of the end-users in China is around US$34 billion, with a consumer’s surplus. Other countries we examined productivity increase of around 6 percent being one displayed similar levels of total economic impact—from of the key levers (Figure 3). 3.2 percent in India to 3.8 percent in the Philippines To estimate the second, less tangible benefit— (see Figure 4). exemplified when workers contact their family and The economic impact of the wireless industry as a friends with mobile units, we used historical average percentage of GDP varies from country to country, as revenue per user (ARPU) as an indicator of user will- Figure 4 also shows.This impact, for example, is higher ingness to pay.This consumer portion of end-user surplus in the Philippines, a country with high service penetra- equals ARPU at the time a customer subscribes to wire- tion and a high degree of service innovation, than in less services minus today’s ARPU, and assumes the user’s other countries such as India, where penetration and willingness to pay does not change over time.Thus, a quality of service are known to be low.The next section Mumbai mobile subscriber who purchased the service of this chapter describes how the economics of the in 2000 for, say, 300 rupees a month but now pays only industry plays a crucial role in explaining these differences. 250 rupees a month (because of competition and other factors) has gained a surplus of 50 rupees a month. Hurdles to high ownership levels and low prices Admittedly, any estimate of intangible benefits will Achieving the maximum potential societal benefits the be a rough calculation, but this one relies on actual mobile industry can offer requires emerging market oper- data—the amount customers have demonstrated they ators and government regulators to work together to will pay. In fact, we consider our estimate to be conser- significantly increase penetration rates in these countries. vative, since many users would pay higher rates if neces- However, increasing penetration rates is challenging. sary. Moreover, as technology, network coverage, and Figure 5 shows mobile penetration has a strong correla- network quality improve over time, this form of surplus tion with economic development. Despite this, even should increase. within countries that have achieved similar development These factors massively amplify the economic levels, penetration rates vary significantly, and this is impact of the mobile industry—in China alone, in 2005 especially true among the poorest countries. For example, it generated approximately US$100 billion, or nearly 5 mobile penetration rates in Bangladesh, Pakistan, Peru, percent of the GDP of that country. Of this, only a and Egypt range from 15 percent to 20 percent, while quarter reflected the direct contribution the mobile Jordan, the Philippines, and Colombia enjoy rates in industry made to GDP; half came from related industries; 7KH *OREDO ,QIRUPDWLRQ 7HFKQRORJ\\ 5HSRUW  ‹  :RUOG (FRQRPLF )RUXP
    86. 1.5: Unshackled Figure 5: Mobile penetration rates vs. income level, selected countries, 2008 Developing Emerging Developed countries economies countries Taiwan, Korea, Hong Kong SAR New Zealand 90 Rep. ChinaFinland Singapore Israel Penetration of unique subscribers (percent) Denmark Czech Republic Paraguay Japan Australia Argentina Italy 80 Germany Malaysia United Kingdom Brazil Greece United States South Africa France Algeria Colombia 70 Poland Russia Thailand Multiple of 3 Philippines Canada 60 Peru Ukraine Jordan 50 Pakistan China Vietnam Egypt • There is a strong correlation between GDP/capita (PPP) 40 and penetration, while large variance exists, especially Indonesia for developing countries 30 India • Strong uptake for developing countries as extra income 20 in this category has larger penetration implication 10 0 0 5,000 10,000 15,000 20,000 25,000 30,000 35,000 40,000 45,000 Real GDP per capita, PPP adjusted, base year 2000 Source: WICS; EIU, 2008. 68 excess of 60 percent, even though both groups of coun- Coverage tries have GDP per capita (PPP) levels of US$3,000 to Many observers assume that mobile coverage equates US$5,000. with the number of operators a market holds. In other Emerging countries that have achieved high mobile words, they assume that as the number of mobile opera- penetration rates tend to get a number of things right, tors increases, the percentage of the population covered such as high coverage levels and low minimum cost of will also grow, since competition will result in lower ownership (MCO). Doing this, as Figure 6 illustrates, prices and more affordable service. However, a number depends on managing several key factors. Achieving the of examples demonstrate that the reverse can be true. right network coverage levels requires managing ade- Despite the large number of operators (eight) in India, quately several regulatory levers such as rollout obliga- for example, population coverage in that country lags tions, the ability to share network costs, taxes, spectrum significantly behind Jordan, with four operators; China, prices, and licensing costs. Additionally it also requires with three operators; and the Philippines, with three. favorable but not excessive returns on capital for One possible reason for this counter-intuitive investors, which in turn result from factors such as the finding is that many smaller mobile operators focus on cost of operations, growth prospects, and competitive the more profitable urban areas and lack the resources intensity. and/or interest to roll service out to rural areas, where Similarly, minimizing the total cost of ownership of the majority of people reside and where the social ben- mobile requires lowering the upfront cost of becoming efits of mobile connectivity are as high, or potentially a mobile subscriber.This is represented by the amount it higher, than in well-served urban areas. Furthermore, costs a subscriber to purchase a handset and activate a as more operators enter the market and competition subscriber identity mobile (SIM) card (amortized over intensifies, the utilization levels and profitability of many the life of the handset) and bringing down the ongoing carriers drop, hindering their ability to invest in the cost of remaining an active subscriber, which in turn network to expand further. depends on the ongoing competitive intensity of the The examples of India and the Philippines provide industry. Regulation again plays an important role in this a compelling contrast. Both India and the Philippines last factor, because levers such as licensing, along with are geographically diverse and have largely the same retail and wholesale prices, are key determinants of the income levels (US$2,600 and US$3,400 GDP per capita MCO. PPP, respectively). However, the Philippines, with three operators having an average EBITDA margin of about 66 percent, enjoys universal network coverage (roughly 99 percent) and mobile penetration of 60 percent. India, 7KH *OREDO ,QIRUPDWLRQ 7HFKQRORJ\\ 5HSRUW  ‹  :RUOG (FRQRPLF )RUXP
    87. 1.5: Unshackled Figure 6: Key levers that affect penetration rates, 2007 Upfront MCO Key observations 1.95 1.28 0.42 • Penetration is highly correlated to MCO and China India Philippines coverage Total MCO • India has much potential in reducing MCO and 1.32 1.95 1.28 improving coverage Coverage by Key regulatory China India Philippines — Low MCO plan population levers introduced end Cost/benefit (percent) • Industry struc- of owning of 2005 rapidly 90 ture/licensing mobile phone increased 0 0 penetration • Interconnection China India Philippines • Retail price End user — Too many players Penetration regulation willingness hinder network (percent) to pay scale needed to 60 49 drive coverage and 28 lower MCO China India Philippines Accumulated • China can further Key regulatory invested capital increase penetration levers per capita (US$) • Universal — Calling party pays service obliga- (CPP) could help 53 42 tion/subsidy Coverage by pop- 11 boost penetration, ulation (percent) • Industry struc- although adequate China India Philippines ture/licensing interconnection 99 99 30 regime is required • Openness to FDI China India Philippines — Need moderate number of licenses Capital efficiency in upcoming 3G to enhance pop- ulation coverage 69 Source: GSMA, 2007b; prepaid plans of major operators; McKinsey analysis. Note: Minimum cost of ownership (MCO) is calculated in dollars per month. on the other hand, with 37 percent network coverage foreign direct investment (FDI) regulations to attract the and 28 percent mobile penetration, is a market where best global capital as well as robust industry operators. even the best operators rarely exceed EBITDA margins Minimum cost of ownership of 40 percent.While city dwellers in India enjoy perhaps the lowest mobile rates in the world (in the range of From the customer perspective, the main force behind US$2 cents/minute) because of the fierce competition rapid mobile service uptake involves the MCO, which among the eight major operators, coverage expansion itself is driven by upfront costs (e.g., handset purchase has only recently begun for the vast but underserved and activation charges) and ongoing expenses, or the rural market. minimum charges required to remain as an active Regulators in many countries attach rollout obliga- subscriber. For low-end subscribers in particular, the tions to the licensees in an effort to circumvent the ten- upfront cost—even though a one-time charge—may dency of the industry to focus on only a few high-income represent a significant entry barrier. catchments. For such obligations to work in practice, The cheapest available prepaid plan can provide a operators must be well capitalized, with the financial good proxy of minimum ongoing expenses, on the resources needed to undertake required investments. assumption that many low-income users cannot afford, They should also have sufficient reputation at risk to or are not eligible for, postpaid subscriptions. compel them to adhere to the commitments made at In a rational market, operators would base their the time of entry. In addition, the presence of viable lowest subscription plans on their operating expenses alternative competitive players, which would push ahead (OPEX).Typically, for emerging market operators, the with similar expansion plans, provide a strong incentive main OPEX items relate to interconnection costs, network for players to undertake such investments—even at the operating expenses (e.g., maintenance, rentals, utilities, cost of upfront losses.This in turn highlights the impor- and personnel), depreciation, sales and marketing, and cus- tance of an open but healthy industry structure, with tomer acquisitions, as well as license and spectrum charges. strong, well-capitalized players, as well as relatively liberal 7KH *OREDO ,QIRUPDWLRQ 7HFKQRORJ\\ 5HSRUW  ‹  :RUOG (FRQRPLF )RUXP
    88. 1.5: Unshackled For at least four of the five major items listed above further hinder efforts to extend coverage and serve (interconnection, network, customer acquisition, and low-income customers. Instead, markets need to license and spectrum charges), the industry structure allow for a sufficient number of players with mini- and various government regulations play crucial if not mum economic size. India offers a good example of decisive roles. Comparing a typical Indian operator with how too many competitors in a single market can one in the Philippines, we find that license and spectrum lead to suboptimal coverage and low-quality service. charges in India amount to a noticeable 11 percent, compared to 3 percent for a proxy operator in the • Avoid direct price controls. Low prices typically Philippines, marked as it is by the access deficit charge retard industry returns and overall growth in the (paid to the fixed-line incumbent operator) as well as medium to long term, hampering investment levels revenue share fees, which vary by the viability of the and translating into poor customer service. operating area. Regulators should avoid mandating across-the- On balance, a clear and negative correlation appears board lower prices as they attempt to lower the to exist between a market’s MCO and its mobile pene- minimum cost of ownership and encourage higher tration level. Pakistan, with a lower MCO of US$1.13 mobile penetration. Such moves can backfire per month, enjoys a significantly higher mobile penetra- because mandating lower average prices will reduce tion rate than India, (i.e., 49 percent versus 28 percent, operator profitability and constrain companies from respectively), where MCO is closer to US$1.95 per taking the appropriate steps to increase penetration. month. Instead, regulators can lower the MCO by design- Getting the MCO elements “right” can have a ing a system under which the calling party pays, significant impact on overall penetration, boosting the supported by an appropriate interconnection public value of putting phones in as many hands as regime that provides incentives to operators who possible. Our analysis of an Indian case study revealed a price their services efficiently. potential increase in subscribers of about 20 million by 2010, driven by a drop in MCO of 25 percent (i.e., • Attach strict rollout and coverage require- from US$8 to US$6 per month). ments to mobile licenses. Increasing numbers of 70 emerging market regulators mandate network roll- out and coverage obligations when they issue new Policy and industry implications for emerging markets mobile licenses, in order to prevent new players To unlock all of the benefits the mobile industry can from investing in rich niche areas and neglecting generate in emerging markets, governments and regula- more low-income and remote areas. In fact, almost tors need to establish a coherent set of regulatory policies all of the new licenses issued in emerging markets that actively increase coverage levels while reducing the over the past two years have stipulated some type of minimum cost of ownership. A broader industry compact rollout and coverage requirement. should accompany this set of policies, allowing providers One innovative way in which regulators can to participate and collaborate with regulators in order to facilitate network rollouts and increase coverage achieve the ultimate goals of developing the mobile focuses on allowing network sharing among opera- industry and the overall economy of the country. tors.This approach, extremely common in devel- Any industry stakeholder in an emerging market oped countries such as Australia, Germany, Sweden, should consider the following broader set of policy con- and the United Kingdom can and should play a siderations when deciding how to increase the econom- greater role in emerging markets. India is one of ic and social benefits the mobile industry generates in the few developing countries that has been an early their respective country: adopter of this approach, which reduces capital investment costs and increases network rollout and • Ensure sufficient but not excessive competi- geographic coverage. As Figure 7 shows, India tion. In a capital-intensive industry, where large issued several successful measures to implement net- upfront investments are necessary, competition work sharing.The first allows providers to spin off among a few players may have better results (i.e., in their passive network infrastructure in order to offer terms of coverage, penetration, and service quality) it to other providers in the market.This new passive than hyper-competition among many. Clearly, any network company receives good access to govern- market needs a minimum number of players to ment subsidies in order to continue expanding its guarantee adequate competition, but opening the network. Furthermore, in April 2008 regulators market indiscriminately to many competitors may allowed active network sharing. create the wrong incentives and reduce investments However, given that infrastructure sharing in new geographical areas, thereby reducing coverage allows operators to reduce their capital costs signifi- and focusing competition in high-income areas. cantly, this is a lever that ought to be exercised with Reduced margins and duplicated infrastructure will care and in selected areas, as the recovery of capital 7KH *OREDO ,QIRUPDWLRQ 7HFKQRORJ\\ 5HSRUW  ‹  :RUOG (FRQRPLF )RUXP
    89. 1.5: Unshackled Figure 7: Infrastructure sharing in India: Benefits in coverage and cost Joint network rollout at shared cost • Several of India’s major operators spun off their passive infrastructure into separate “tower companies” in 2007 Passive network sharing Geographic coverage: 40% • Indus Towers, for example, is a partnership subsidized in April 2007 Mobile penetration: 28% of three operators in charge of 70,000 towers • Site and mast sharing in 16 regions and has full responsibility of • Subsidizing rural area further rollout in those areas coverage from the Universal • Indus Towers and Bharti Infratel provide site Service Obligation Fund and mast services to all GSM operators on a (USOF) for shared towers nondiscriminatory basis • 30–40 percent of towers are shared in India Increased coverage in high-cost remote areas boosted by USOF subsidies Active network sharing • First phase in 2007: Department of Telecom allowed April 2008 identified 8,000 rural-area sites as eligible • Antennas for subsidies from USOF (coverage for 48 • Feeder cable million households) • Node B • Radio access network • Second phase in 2008: subsidies for 11,000 (RAN) sites (coverage for 50 million households) • Transmission system • Tower companies and mobile operators competed fiercely over USOF subsidies Attracting financial and foreign investors 71 • Bharti Infratel sold a stake worth US$1 billion to a group of international firms in December 2007. In May 2008, a private equity firm invested a further US$250 million in the company • Reliance communications sold a 5 percent stake in its tower unit in July 2007 for US$350 million • WTTIL is in talks with external investors on selling up to a 49 percent stake Source: ITU World Telecommunication Indicators, 2007; GSMA, 2007b. costs is one of the main levers of price competition described the country’s spectrum situation as one of in this industry of high fixed costs and minimal “extreme anguish” caused by the “pitiful” amounts variable costs. of spectrum granted to operators. As one journalist noted, “Airtel was supposed to receive an additional spectrum allocation after it passed 1.6 million sub- • Effectively manage spectrum allocation and scribers. It now has over 3.6 million and it is still pricing. Spectrum management has risen signifi- waiting.”5 This situation is taking a toll in terms of cantly in importance in emerging markets, and spec- the number of calls dropped per subscriber and the trum policies will play a major role in delivering patchy reception they get. telecommunication services to users.The number of The role of spectrum management policy spectrum licenses granted and the fees attached will becomes even more important when one thinks in have a great impact in the industry.Take India, terms of economic development implications. As where mobile operators struggle to obtain addition- noted above, the number of mobile subscribers al spectrum allocations in order to carry calls crisply exceeds the number of fixed-line users in many and reliably. Indian operators claim the nation faces emerging countries. Because of the relatively poor a “spectrum crunch”—in November 2007, for development of fixed infrastructure in these markets, example, Sunil Mittal, Chairman of Bharti Airtel, 7KH *OREDO ,QIRUPDWLRQ 7HFKQRORJ\\ 5HSRUW  ‹  :RUOG (FRQRPLF )RUXP
    90. 1.5: Unshackled questions arise regarding how broadband service will develop and hence how these countries can Box 2: Refarming for success in Sri Lanka benefit from the productivity gains broadband offers. Rural and poor areas accentuate this phe- Spectrum management policies in Sri Lanka were virtually nomenon, since providing broadband services there nonexistent in the 1990s, when regulators generally bundled spectrum with operating licenses. Up to 1996, regulators will undoubtedly rely much more on wireless allocated spectrum on a first-come/first-served basis in the provision rather than on fixed access. band sought by operators. Telecommunications providers As wireless broadband technology develops and paid no upfront fee for the allocated spectrum band, but wireless applications and services expand, the main instead faced an annual charge for use of the radio frequen- focus of spectrum management in developing cy. This policy resulted in a situation where too many differ- countries will turn to accommodating technology ent telecommunications companies applied for spectrum and service flexibility. By adopting such flexibility, at different points in time using a variety of technologies for policymakers will allow operators to choose the both wireless local loop (WLL) and mobile applications. most efficient and economically sound technologies Regulators had not taken into account factors such needed to provide services to end customers. as equity and efficiency in spectrum allocation, and the To promote flexibility, a number of countries technologies used by providers to provide mobile services are already moving toward establishing technology- varied considerably, ranging from Global System for Mobile services (GSM) to Code Division Multiple Access (CDMA). and service-neutral licensing and spectrum manage- The move toward a more technology- and service-neutral ment policies. Sri Lanka provides a good example spectrum policy was mainly triggered by a desire to treat all of how a developing country realized the importance providers equitably, the urging of mobile providers to shift to of spectrum policy and began an ambitious GSM technology, and the need to use CDMA as a low-cost “refarming” process in order to create a regulatory solution for fixed wireless access in rural areas. environment that encourages industry investment Although the Telecommunication Regulatory and economic growth (see Box 2).6 Commission of Sri Lanka (TRCSL) was constrained to some extent by existing allocations and defense considerations, it • Avoid high levels of taxation. Levying taxes on issued more spectrum space. The regulator also recognized 72 the mobile telecommunications sector has attracted the problem of scattering spectrum and attempted to stream- government attention in emerging markets for two line allocations while it cleared capacity in the 1800–1900 main reasons. First, the mobile sector has achieved megahertz range. It did so by embarking on a thorough industry consultation process that involved difficult negotia- strong growth in these nations in the past decade, tions with stakeholders in the industry, which included and second, the operators’ efficient billing systems different compensation schemes for spectrum refarming. facilitate the collection of government receipts. Decisive action by the TRCSL resulted in the fair However, mobile-specific taxes reduce demand for allocation of spectrum to incumbent and new operators services, lowering penetration levels. Experience in alike, and helped the rapid proliferation of wireless technolo- sub-Saharan Africa clearly illustrates this point: a gies, proving that a forward-looking approach to spectrum recent study shows that if governments withdrew management can help to increase the penetration of mobile most industry-specific taxes and instead imposed services and mobility in general in developing countries. only value-added taxes (VAT), tax revenues from the mobile industry would actually increase 3 per- Source: Jain, 2007; Ovum Consulting 2007. cent by 2012 and average mobile penetration would expand by roughly 8 percent, from 33 percent to 41 percent. 7 This represents a significant loss in terms of economic growth, since an increase in mobile penetration of 10 percent in a typical devel- oping country boosts GDP growth by about 0.6 percentage points.8 ubiquity of mobile service. Bear in mind that no silver Clearly, emerging markets should not impose bullet exists to increase coverage or reduce the mini- excessive tax burdens on their mobile industries or mum cost of ownership in the industry.These ideas can, they will hinder the penetration of these services however, create a fertile environment where the industry and the public value they can create. can flourish, delivering high levels of public value as it provides developing nations and their citizens the full This chapter illustrates just a few of the measures benefits of mobility in the 21st century. emerging in the market that policymakers and stake- holders in the mobile services industry should consider when deciding how to apply regulation to increase the 7KH *OREDO ,QIRUPDWLRQ 7HFKQRORJ\\ 5HSRUW  ‹  :RUOG (FRQRPLF )RUXP
    91. 1.5: Unshackled Telegeography. 2008. GlobalComms Online Database. December. Notes 1 itnewsafrica 2009. Telnor. 2008. Q3 2008 Interim Report January–September 2008. Available at http://www.telenor.com/en/resources/images/ 2 Telnor 2008, p. 4 3q08_v1_tcm28-34654.pdf. 3 Telegeography 2008. Vodaphone. 2005. “Africa: The Impact of Mobile Phones.” Vodaphone Policy Paper Series No. 3. March. Available at 4 McKinsey & Company 2006. http://www.vodafone.com/etc/medialib/attachments/cr_ 5 The Economist 2007b. downloads.Par.78351.File.tmp/GPP_SIM_paper_3.pdf. 6 Refarming involves the reassignment of spectrum to services that WICS (World Cellular Information Service). Available at provide greater economic or societal benefits. http://www.wcisdata.com/. 7 GSMA 2007a. World Trade Organization. “Highlights of the Basic Telecommunication Commitments and Exemptions.” Available at http://www.wto.org/ 8 Vodaphone 2005. english/tratop_e/serv_e/telecom_e/telecom_highlights_commit_ exempt_e.htm. Yankee Group. 2007. Yankee Group Global Forecast. April. References Castonguay, A. 2007. “Global Consumer Forecast.” Yankee Group, April. China Statistics Bureau. 2005. China Statistical Yearbook 2005. Dataquest Insight: Global Telecommunications Market Take, June 2008, Gartner, Inc. The Economist. 2007a. “To Do with the Price of Fish: Mobile Phones and Economic Growth.” May 10. ———. 2007b. “Full-Spectrum Dominance: Telecoms in India.” November 29. ———. 2007c. “Talk Is Cheap: India Leads the World in Mobile-Phone Subscriber Growth.” December 7. EIU (Economist Intelligence Unit). 2008. EIU ViewsWire database. Accessed December 2008. 73 GSMA. 2007a. “Taxation and the Growth of Mobile Services in Sub-Saharan Africa.” Frontier Economics Ltd.: London. Available at http://gsmworld.com/documents/gsma_tax_report.pdf. ———. 2007b. Mobile Infolink Market Data Summary. Database. IDC (International Data Corporation). 2007. Worldwide Telecommunications Black Book. IHS Global Insight. 2008. World Markets Telecoms. Available at http://www.globalinsight.com/ProductsServices/ProductDetail 830.htm. ILO (International Labour Organization). 2008. Job Database. itnewsafrica.com. 2009. “Safaricom’s M-PESA Service Wins Global Award.” February 19. Available at http://www.itnewsafrica.com/ ?p=2263. ITU (International Telecommunication Union). 2008. World Telecommunication/ICT Indicators Database. Jain , R. 2007. Spectrum Refarming in Sri Lanka: Lessons for Policy Makers and Regulators. Indian Institute of Management, October. Available at http://www.iimahd.ernet.in/publications/data/ 2007-10-01Jain.pdf. McKinsey & Company, Inc. 2006. “Wireless Unbound: The Surprising Economic Value and Untapped Potential of the Mobile Phone.” December. Available at http://mckinsey.com/clientservice/ telecommunications/WirelsUnbnd.pdf, National Bureau of Statistics of China. 2005. China Statistical Yearbook 2005. Ovum Consulting. 2007. UMTS900: Benefits and Issues: A Summary Report to GSMA, February. Available at http://www.gsmworld.com/ documents/umts900_exec_sum.pdf. Pyramid Research. 2007. Central and Eastern Europe Mobile Forecast Pack. December. ———. 2008a. Africa and Middle East Mobile Forecast Pack. December. ———. 2008b. Asia Mobile Forecast Pack. December. ———. 2008c. Latin America Mobile Forecast Pack. December. ———. 2008d. Pyramid Research Database 2008. 7KH *OREDO ,QIRUPDWLRQ 7HFKQRORJ\\ 5HSRUW  ‹  :RUOG (FRQRPLF )RUXP
    92. 7KH *OREDO ,QIRUPDWLRQ 7HFKQRORJ\\ 5HSRUW  ‹  :RUOG (FRQRPLF )RUXP
    93. 1.6: Reality Mining of Mobile Communications CHAPTER 1.6 Within just a few years “people data” will be 90% of the world’s collective data. Reality Mining of Mobile —Jeff Nick, CTO of EMC, personal communication Communications: Toward a New Deal on Data We have enough water, enough food, enough money; we have enough of everything except the ability to agree and move forward. ALEX PENTLAND, Massachusetts Institute of Technology (MIT) —Abdul Kalam, former President of India, personal communication Around the world, many of us live our lives in digital networks.We wake up in the morning, check our email, make a quick phone call, commute to work, and buy lunch. Many of these transactions leave digital bread- crumbs—tiny records of our daily experiences.1 Reality mining, which pulls together these crumbs using statistical analysis and machine learning methods, offers increasingly extensive information about our lives, both individually and collectively.This technology’s potential to transform our understanding of ourselves, our organizations, and our society is the reason that MIT’s Technology Review recently identified reality mining as one of “10 Emerging Technologies That Will Change the World.” 2 75 An emerging—and truly global—nervous system The ability to understand the patterns of human life by analyzing the digital traces that we leave behind will transform poor nations even more than rich nations. Ten years ago, half of humanity had never made a phone call and only 20 percent had regular access to commu- nications.Today almost 4 billion people have a mobile telephone, and because remanufactured mobile phones cost US$10 in the developing world and incoming messages are free, almost every stratum of society is now connected.3 For the first time, the majority of humanity is linked and has a voice. The most important changes may come, however, from the fact that these same mobile phones can be used for reality mining.Their reality mining functionality is mostly latent at this point, but already these devices are being used to measure population flows into cities and slums, to map the movement of populations during emergencies, to identify neighborhoods where social services are inadequate (see Figure 4), and to manage automobile traffic congestion (see Figure 1). The reality mining functionality of mobile phone networks is what governments in countries such as India are using to track terrorists, and they claim that the vast This article builds on papers co-authored with David Lazer at the J. F. Kennedy School of Government at Harvard University and with my cur- rent and former students, as well as on continual interactions and con- versations with my colleagues at Sense Networks and at the MIT Media Laboratory. 7KH *OREDO ,QIRUPDWLRQ 7HFKQRORJ\\ 5HSRUW  ‹  :RUOG (FRQRPLF )RUXP
    94. 1.6: Reality Mining of Mobile Communications Figure 1: Traffic congestion predicted using mobile phone GPS data 9.98 60 9.97 50 40 9.96 Latitude 30 9.95 20 9.94 10 9.93 0 –84.14 –84.12 –84.10 –84.08 Longitude Source: Dong, 2006. 76 majority of captured terrorists have been identified Perhaps the simplest example of reality mining is through mobile phone transactions.The ability of the analysis of automobile traffic congestion by using mobile phone networks to identify unusual patterns of the global positioning system (GPS) data collected from movement and communication are also how public the mobile telephones carried by the automobile drivers. health officials and disaster relief teams are scanning for These data provide minute-by-minute updates on traffic outbreaks of diseases such as severe acute respiratory flow, allowing for more accurate predictions of driving syndrome (SARS) and emergencies such as tidal waves. time. Congestion patterns can be predicted days in It seems that the human race suddenly has the advance, and traffic jams detected hours before they beginnings of a working nervous system. Like some become serious, as illustrated by the “congestion map” world-spanning living organism, automobile traffic sys- of city streets shown in Figure 1. tems, security sensors, and especially mobile telephone Similar to using reality mining to understand traffic networks are all becoming intelligent, reactive systems within a city, we can also use reality mining of mobile with sensors serving as their eyes and ears. Moreover, phone GPS data, call logs, and email records to better the evolution of this nervous system will continue at a understand the “traffic” within an organization. Analysis quickening speed because of the exponential progress in of these digital traces allows a detailed picture of face- computing and communication technologies as well as to-face, voice, and digital communication patterns. basic economics. Networks will become faster, devices These patterns, in turn, allow us a new level of insight will have more sensors, and techniques for modeling into the problems of industry and government, including human behavior will become more accurate and building customer relationships, resource management, detailed. transportation, and public health. Figures 2 and 3 show two recent but very different applications of reality mining of people data. From individuals to societies Figure 2 shows the pattern of face-to-face and To date, the vast majority of research on the human email communication within a German bank.The condition has relied on single-shot, self-report data on thickness of the top arcs (in black) shows the amount of relationships: a yearly census, public polls, focus groups, face-to-face communication, while the thickness of the and the like. Reality mining offers a remarkable, second- bottom arcs (in blue) shows the amount of email com- by-second picture of group interactions over extended munication. In our studies of many different types of periods of time, providing dynamic structural and content companies, we have found that the tradeoff between information. face-to-face and email communication is a critical 7KH *OREDO ,QIRUPDWLRQ 7HFKQRORJ\\ 5HSRUW  ‹  :RUOG (FRQRPLF )RUXP
    95. 1.6: Reality Mining of Mobile Communications Figure 2: Patterns of communication within departments of a bank Manager Development Sales Support Customer Service Source: Pentland, 2008. 77 predictor of both productivity and job satisfaction. In Beyond demographics fact, variations in these patterns can account for more Advertising, commercial development, and government than 30 percent of the differences in productivity services all currently rely on demographic data to guide between different parts of the same company! Patterns them. Such data can quickly become out of date and, of of change within these communication networks are also course, good demographic data simply do not exist in a critical predictor of creative productivity, accounting many parts of the world. More importantly, however, for up to 40 percent of differences in creative output.4 we have found that demographics are a relatively poor Figure 3 shows a plot of regional communication predictor of behavior, and behavior is what we really diversity and the corresponding index of deprivation, a need to understand in order to reach the right people. socioeconomic status measurement that is a combina- The fact that mobile phones have GPS means that tion of metrics such as average income levels, access to we can leap beyond demographics directly to measuring health care, and education.These data, drawn from town behavior.Where do people eat? Work? Hang out? How councils across the United Kingdom, show that it is does word of mouth spread? Analysis of travel patterns possible to use patterns of communication to identify using mobile phone GPS data, for instance, allows dis- “information ghettos” that have serious social problems. covery of the independent subgroups within a city. This capability can allow government services to be far Figure 4a shows movement patterns with popular “hang more responsive to citizen needs than is possible by outs” coded by the different subgroups that populate using census or survey data. these destinations, where the subgroups are defined by In short, reality mining is beginning to provide the both their demographics and, more importantly, by their capacity to collect and analyze data about people with a behaviors. Figure 4b shows that the mixing between breadth and depth that was previously inconceivable. these different behavior groups is surprisingly small. Current work using reality mining techniques is under- Knowledge of the “hang outs” of different subgroups way in a variety of applications. For example, reality and the mixing among groups can provide great mining studies of voice, communications, and mobility improvements in advertising, commercial development, patterns have already demonstrated the ability to screen public education, and policy interventions. for depression, infer quality-of-life metrics, and develop financial indexes for individual neighborhoods.5 7KH *OREDO ,QIRUPDWLRQ 7HFKQRORJ\\ 5HSRUW  ‹  :RUOG (FRQRPLF )RUXP
    96. 1.6: Reality Mining of Mobile Communications Figure 3: Communication patterns vs. deprivation 0.95 Regional communication diversity 0.90 0.85 0.80 0.75 0 10 20 30 40 50 60 Regional deprivation (low to high) Source: Eagle, 2009. 78 Figure 4: Reality mining of data from GPS mobile phones 4a: Patterns of human movement in San Francisco 4b: Limited mixing among people with different behavior patterns Source: Sense Networks, 2008. Source: Sense Networks, 2008. 7KH *OREDO ,QIRUPDWLRQ 7HFKQRORJ\\ 5HSRUW  ‹  :RUOG (FRQRPLF )RUXP
    97. 1.6: Reality Mining of Mobile Communications Usefulness for society interesting avenue of exploration, since they may allow people to give up their data for monetary or service Reality mining of behavior data is just beginning. rewards. Ideally, this would be put into place in order to For instance, the correlation of behavior data with gain approval from the majority of the population to use medication data from millions of people could make data collected from their digital interactions. drug therapies more effective and help medical profes- Other important considerations revolve around data sionals detect drug interactions more quickly. If behavior anonymity.The use of anonymous data should be data were correlated with medical conditions, the data enforced, and analysis at the group level should be pre- could illuminate the etiology and preconditions of ferred over that at the individual level. Robust models disease far more powerfully than is possible today and, of collaboration and data sharing need to be developed; further, serve as an early warning system for epidemic guarding both the privacy of consumers as well as cor- diseases such as SARS. Comparing the medical data porations’ legitimate competitive interests are vital here. with genomic and protonomic data from different What must be avoided is either the retreat into population samples could provide a powerful method secrecy, so that these data become the exclusive domain for understanding complex gene and environment of private companies and remain inaccessible to the interactions. Common Good, or the development of a “big brother” For society, the hope is that we can use this new model, with government using the data but denying the in-depth understanding of individual behavior to public the ability to investigate or critique its conclusions. increase the efficiency and responsiveness of industries Neither scenario will serve the long-term public interest and governments. For individuals, the attraction is the in having a transparent and efficient government. possibility of a world where everything is arranged for your convenience—your health checkup is magically scheduled just as you begin to get sick, the bus comes The new deal on data just as you get to the bus stop, and there is never a line The first step toward open information markets is to of waiting people at city hall. give people ownership of their data.The simplest approach to defining what it means to “own your own Data ownership and privacy data” is to go back to Old English Common Law for 79 the three basic tenets of ownership, which are the rights Perhaps the greatest challenge posed by this new ability of possession, use, and disposal: to sense the pulse of humanity is creating a “new deal” around questions of privacy and data ownership. Many 1. You have a right to possess your data. Companies of the network data that are available today are freely should adopt the role of a Swiss bank account for offered because the entities that control the data have your data.You open an account (anonymously, difficulty extracting value from them. As we develop if possible), and you can remove your data new analytical methods, however, this will change. whenever you’d like. Moreover, not all people who want access to the data do so for altruistic motives, and it is important to consider 2. You, the data owner, must have full control over how to keep the individuals who generate this informa- the use of your data. If you’re not happy with tion safe. Advances in analysis of network data must be the way a company uses your data, you can approached in tandem with understanding how to cre- remove it. All of it. Everything must be opt-in, ate value for the producers and owners of the data while and not only clearly explained in plain language, at the same time protecting the public good. Clearly, our but with regular reminders that you have the notions of privacy and ownership of data need to evolve option to opt out. in order to adapt to these new challenges. This raises another important question: how do we 3. You have a right to dispose or distribute your design institutions to manage the new types of privacy data. If you want to destroy it or remove it issues that will emerge with these new reality mining and redeploy it elsewhere, it is your call. capabilities? Digital traces of people are ubiquitously preserved within our private and public organizations— Ownership seems to be the minimal guideline for location patterns, financial transactions, public trans- the “new deal on data.”There needs to be one more portation, phone and Internet communications, and so principle, however—which is to adopt policies that on. Certainly new types of regulatory institutions are encourage the combination of massive amounts of required to deal with this information, but what form anonymous data to promote the Common Good. should they take? Aggregate and anonymous location data can dramatically Companies will have a key role in this new deal for improve society. Patterns of how people move around privacy and ownership. One suggestion is that there is can be used for early identification of infectious disease an incentive system, one that gives added value to the outbreaks, protection of the environment, and public users. Market mechanisms appear to be a particularly 7KH *OREDO ,QIRUPDWLRQ 7HFKQRORJ\\ 5HSRUW  ‹  :RUOG (FRQRPLF )RUXP
    98. 1.6: Reality Mining of Mobile Communications safety. It can also help us measure the effectiveness of various government programs, and improve the trans- parency and accountability of government and nonprofit organizations. Conclusions Revolutionary new measurement tools provided by mobile telephones and other digital infrastructures are providing us with a God’s eye view of ourselves. For the first time, we can precisely map the behavior of large numbers of people as they go about their daily lives. These distributed sensor networks have given us a new, powerful way to understand and manage human groups, corporations, and entire societies. As these new abilities become refined by the use of more sophisticat- ed statistical models and sensor capabilities, we could well see the creation of a quantitative, predictive science of human organizations and human society. At the same time, these new tools have the potential to make George Orwell’s vision of an all-controlling state into a reality. What we do with this new power may turn out to be either our salvation or our destruction. Notes 1 See http://www.bbc.co.uk/britainfromabove/stories/visualisations/ 80 index.shtml for amazing videos of the time evolution of automo- biles, airplanes, telephone calls, and shipping activity patterns. 2 Technology Review 2008. 3 Eagle 2009. 4 Pentland 2008. 5 Pentland 2008. References Dong, W. 2006. “Influence Modeling of Complex Stochastic Processes.” July. Master’s Thesis in Media Arts and Sciences. Available at http://hd.media.mit.edu. Eagle, N. 2009 (in preparation). “Mobile Phones as Social Sensors.” The Handbook of Emergent Technologies in Social Research. New York: Oxford University Press. Pentland, A. 2008. Honest Signals: How They Shape our World. Cambridge, MA: MIT Press. Sense Networks. 2008. “Technology tab” at http://www.sense networks.com. Technology Review. 2008. “10 Emerging Technologies That Will Change the World.” Available at http://www.technology review.com/article/13060/. 7KH *OREDO ,QIRUPDWLRQ 7HFKQRORJ\\ 5HSRUW  ‹  :RUOG (FRQRPLF )RUXP
    99. 1.7: Global Mobility of Talents CHAPTER 1.7 It is estimated that, around the world, some 200 million people currently live and work outside of their country of origin.The OECD countries alone host some 75 Global Mobility of Talents: million migrants (persons having adopted a residence outside of the country where they were born). Broader What Will Make People Move, access to transportation combined with disparities in income and labor markets have contributed to create a Stay, or Leave in 2015 and growing global market for migrant workers, who stay Beyond? outside their country of origin for a limited time.This time is generally linked to the nature and duration of their work contract. VIJAYAKUMAR IVATURI, Wipro As shown in Figure 1, however, the world of migra- BRUNO LANVIN, INSEAD, eLab tions and labor movements is far from even. A number HRISHI MOHAN, Wipro of countries (such as the United States) continue to attract a significant proportion of people seeking resi- dence outside of their countries of origin. Some smaller or less-populated countries, while hosting a compara- tively smaller number of foreign-born individuals, face unprecedented situations whereby the proportion of migrants is particularly high compared with their home- born populations (22.4 percent in Canada, 25 percent in Switzerland, and 27.7 percent in Australia). On the labor front, fast-growing countries have attracted a number of migrant workers in sectors such as construction or domestic services. In many cases, such movements have been compounded by significant in-flows of highly 81 skilled foreign workers (“expats”) providing services as consultants or managers in local or international busi- nesses, and sometimes in government. A country such as Qatar, for example, has a population of about 1 million, of whom only 20 percent were born in Qatar. For a growing number of skills and talents, a global labor market has emerged.The international mobility of workers has grown accordingly. However, over the last few decades, accelerated growth in large economies such as those of India and China has radically altered the landscape of resulting labor movements. Information technology (IT), on the other hand, has allowed new forms of production to take place through the use of telepresence, teleworking, virtual teams, and shared information and knowledge resources. Increasing concerns about the environment and the “carbon footprint” of any business decision have con- tributed to a growing preference for moving bits and bytes rather than atoms and humans across borders. How are those different drivers likely to combine, compound, or offset each other in the future? What will be the main directions of labor flows? How is the “war for talents” going to be waged, and who is likely to win it? These are some of the questions that this chapter tries to address. Through the consideration of longer-term trends and the analysis of recent changes in the way companies and individuals buy, produce, and sell, some avenues will be identified that may help define new dimensions of 7KH *OREDO ,QIRUPDWLRQ 7HFKQRORJ\\ 5HSRUW  ‹  :RUOG (FRQRPLF )RUXP
    100. 1.7: Global Mobility of Talents Figure 1: Migration and labor movements in 2007 COUNTRY Total number of OF ORIGIN International flows foreign-born of workers residents (millions) Total number (millions) of people born there HOST COUNTRY adopting residence (% of population) elsewhere 5 Canada (22.4%) POL 1 2 UK NL GER 3.5 RUS (11.2%) 4 3.3 1.7 8 UK 31 GER (9.4%) CHI (12.5%) USA 5 2 France 1 CH (11.7%) (14.5%) 2 (25.1%) ITA 2 Turkey (4.1%) Spain 2 (5.5%) ITA 2.4 Mexico IND 2 8 PHI 2 3 Australia (27.7%) 82 Source: Authors, based on OECD and Manpower. Note: Country names are as follows: POL = Poland; RUS = Russia; CHI = China; PHI = Philippines; IND = India; GER = Germany; CH = Switzerland; NL = Netherlands; ITA = Italy; UK = the United Kingdom; and USA = the United States. talent mobility. Other avenues will identify some of the international borders exported their physical strengths most urgent issues to be faced by business and govern- or manual abilities rather than their intellectual talents. ments regarding the skills that their competitiveness (or This can largely explain why available literature is quite survival) may require in the years to come. abundant on the mobility of tangible factors of produc- tion, while analyses of the global circulation of ideas and talents remain relatively scarce. Moving beyond the “brain drain vs. brain gain” In this latter domain, much of the debate has controversy focused on trying to determine whether the collective Traditionally, migration flows have been regarded as benefits of moving intangible factors of production composed of three major streams: labor migration, internationally could justify the undeniable damage refugee migrations (economic or political), and rural- caused to the countries (mostly developing countries) urban migration. More recently, the issue of “environ- that, intentionally or not, let their best-educated and mental refugee” has been added to this panoply, in view most creative citizens move abroad.The so-called “brain of the dramatic situation faced by countries such as the gain vs. brain drain” controversy remained a recurrent Maldives that are threatened by the rise of sea level. theme of development economics until recently. Mobility has affected production factors in an In the course of the last few decades, several signifi- uneven fashion. Among the production factors to be cant changes have altered both the nature and the focus mobilized and combined, some are tangible (land, raw of this debate. One of them has been the success of materials, capital) while others are intangible (technolo- emigrated elites in their countries of adoption (a case gy, ideas, creativity, innovation, entrepreneurship). For in point being that of the Indian diaspora in the US several centuries, labor has been considered to be part Silicon Valley), which has generated significant spillover of the first category: most of the workers who crossed effects in their respective countries of origin.1 Another 7KH *OREDO ,QIRUPDWLRQ 7HFKQRORJ\\ 5HSRUW  ‹  :RUOG (FRQRPLF )RUXP
    101. 1.7: Global Mobility of Talents change has been the advent of outsourcing (with its example, R&D professionals may wish to go abroad variations from near-shoring to global sourcing), which in search of better laboratories, a more stimulating has allowed some developing countries to compete research environment, more peer-to-peer interaction, globally while retaining talents at home. higher funding, or better relationships between Such phenomena, however, are still too recent to universities and business. have generated a full re-balancing of the literature about labor mobility. Data remain scarce and often lack inter- • Interdependence among capital, competence, national comparability.The size and direction of interna- and talent flows. Available evidence shows a tional movements of highly skilled individuals are still strong correlation between growth opportunities under-documented and under-measured. on one hand and the ability to attract both capital Yet, some trends can be identified on how, where, and talent on the other. and why talents cross borders.To try and identify such trends, we will adopt in the rest of this chapter the fol- • Increasingly important roles of governments. lowing working definitions: When it comes to attracting or retaining talents, governments have a key role to play in designing 1. In order to build an initial measurable proxy for and implementing proper fiscal and immigration international mobile talents, we will focus on policies; more and more, they tend to do this in scientific and research and development (R&D) accordance with the relative shortage (or relatively staff, IT professionals, and academics (scholars high costs) of the skills required by the enterprises and students). of their respective countries. For example, in the United States, a special class of visas (H1) is being 2. Our concept of mobility focuses on “movements granted to IT professionals: a large proportion of resulting from opportunities, ecosystem strengths, the beneficiaries of such visas come from India’s IT and/or incentives created to encourage such industry. movements.”This working definition will enable us to make a methodological distinction between Based on this first list of explanatory factors and build- 83 talent mobility (which is multi-directional) and ing on a selected set of variables mostly included in the migration (which is uni-directional—that is, Networked Readiness Index (NRI) presented in this with no intent or possibility of returning to Report, a simple model—the Global Talent Pyramid one’s country of origin). Model (GTPM)—has been constructed (Figure 2). In this model, the ability of a country to attract talents internationally is determined by three main factors, namely: What makes talent move across borders: A simple model 1. attractiveness of the national ecosystem vis-à-vis The 20th century has seen a progressive re-balancing local and foreign talent, between the “push factors” of migration (diseases, 2. the existence of a critical mass in the “national poverty, and conflicts) and the “pull factors” of labor talent pool” (stock and flow), and movements (better wages and better opportunities to acquire new skills or develop a business). Over the last 3. overall efficiency/quality of the economy and few decades, however, international labor mobility has society. been greatly facilitated and encouraged by factors such as the following: In order to get a first approximation of those three pillars, a certain number of existing variables has been • Significant differences in earning potentials selected for which sufficient international coverage was for similar skill sets. Classic examples are those already available. Figure 3 summarizes the attribution of of Indian software developers (Indian salaries being such variables to each of the three pillars of GTPM.2 a fraction of those paid in the United States or The resulting model suggests that, in building its Western Europe).This has also applied to profes- own talent pyramid, each particular country will sionals trained in Eastern Europe (whose wages are benefit from specific advantages and encounter unique far below those of their western counterparts). challenges. For example, in Europe as a whole or in Japan, the issue of e-skills (i.e., skills for the knowledge • Ecosystem attractiveness. One of the major society) has started to attract priority attention: a number non-monetary reasons for talents to move outside of companies, and also a growing number of govern- their country of origin is the presence of an ecosys- ments, are increasingly worried about Europe’s inability tem that provides an enabling environment for to produce the number of programmers, analysts, and professional growth and self-development. For 7KH *OREDO ,QIRUPDWLRQ 7HFKQRORJ\\ 5HSRUW  ‹  :RUOG (FRQRPLF )RUXP
    102. 1.7: Global Mobility of Talents Figure 2: The Global Talent Pyramid Model (GTPM) Talent usage Attractiveness of the national ecosystem vis-à-vis local and foreign talent Global Quantity Talent availability Talent Existence of a critical mass in the national talent pool Pyramid Quality Environment variables Overall efficiency/quality of the economy and society 84 Figure 3: The Global Talent Pyramid variables Indicator/variable Talent driver • Time required to start a business • Efficiency • Venture capital availability • Market • FDI inflows as percent of GDP • Capital Talent • Networked Readiness Index • Openness usage • Availability of scientists • Local availability of • Quality and engineers specialized research • Quantity and training services • Quality of scientific research institutions • University-industry Talent availability research collaboration • Quality of math and science education • Total expenditure on R&D as a percentage • Quality of the educational of GDP system • Economy • Gross tertiary enrollment • Society • Human Development Index Environment variables • Rule of law • Control of corruption Source: UNCTAD, various years; UNDP, 2007; UNESCO, 2007; UNESCO Institute for Statistics; The World Bank Group, 2008; The World Bank, Governance Indicators; World Economic Forum, Executive Opinion Survey 2007, 2008. 7KH *OREDO ,QIRUPDWLRQ 7HFKQRORJ\\ 5HSRUW  ‹  :RUOG (FRQRPLF )RUXP
    103. 1.7: Global Mobility of Talents Figure 4: Availability of scientists and engineers, selected countries Rank Countries Score 4 India 5.92 7 France 5.68 12 United States 5.60 16 Germany 5.44 45 Spain 4.71 49 Italy 4.59 67 Estonia 4.33 77 China 4.16 81 Luxembourg 4.06 91 Slovenia 3.85 102 Latvia 3.61 1 2 3 4 5 6 7 Score (variable 4.03 in the NRI) Source: World Economic Forum, Executive Opinion Survey 2007, 2008. 85 software architects that its industries will need in com- significant decrease in the attractiveness of such careers ing years.3 for younger people witnessed in recent times, especially However, this inability may be the tip of a much among female students. larger iceberg.The lack of engineers has recently Another factor likely to affect the ability of various become a major concern in countries such as Germany countries to produce the talents required by their own and the Czech Republic, as it has already been for some development strategies will stem directly from the degree time in Japan. Some of those countries may be looking of investment they have made in the past decades in to places such as India to obtain the talents they need; their respective educational systems.Tertiary enrollment however, the expected rates of growth of the Indian in this respect is not the only variable to consider.The economy (even once this growth has been discounted quality of education in mathematics and science will by the effects of the current crisis) are such that it is also likely have an increasingly important impact on the likely that Indian scientists and engineers will have less value that a particular society can provide for itself, as reason to leave their own countries in the future than the expansion and improvement of global information they have had in the past. One consequence of the networks create more opportunities to share such value. GTPM is, hence, that the talent pool available in a In this area, countries such as Singapore will con- country such as India is likely to increase, while its tinue to benefit from a comparative advantage built international mobility will decrease. relentlessly over the years, while India and China seem In countries less equipped with the ability to produce to be quickly moving up that same ladder. Relatively enough scientists and engineers (such as China, Spain, low scores should be of particular concern in countries Italy, or smaller European economies—see Figure 4), such as Italy, Spain, or Portugal, and to some extent the local companies are likely to continue paying a premium United States (see Figure 5). to attract necessary talent, and to pressure their respec- By and large, such partial indicators point to issues tive governments to improve dimensions at the bottom shared by many economies around the world. It is clear, of the Global Talent Pyramid (environment), as well as for example, that in coming years the availability of tal- at the top (e.g., by attracting more presence by foreign ented knowledge workers will not grow as quickly as the companies, or by enhancing outsourcing capabilities global demand for their skills. In such a situation, mobility through better IT infrastructure). In some countries, will be key for narrowing the existing gap between supply especially in Western Europe, stimulating the production and demand. Such mobility will be both physical (e.g., of larger numbers of scientists and engineers will require through temporary or permanent migrations) and virtual addressing social and cultural factors at the root of the 7KH *OREDO ,QIRUPDWLRQ 7HFKQRORJ\\ 5HSRUW  ‹  :RUOG (FRQRPLF )RUXP
    104. 1.7: Global Mobility of Talents Figure 5: Quality of math and science education, selected countries Rank Countries Score 1 Singapore 6.34 2 Belgium 6.29 6 France 5.71 11 India 5.38 14 Netherlands 5.27 43 United States 4.54 55 China 4.38 57 Italy 4.27 66 Spain 3.93 89 Portugal 3.43 1 2 3 4 5 6 7 Score (variable 4.01 in the NRI) Source: World Economic Forum, Executive Opinion Survey 2007, 2008. 86 (through a more intense usage of information networks, Table 1: Some key GTPM variables for India and Singapore telepresence facilities, and virtual teams across networks). In such a context, some fundamental dimensions of NRI India Singapore the world economy—such as geography or demography Variable variable value value —will take on a renewed importance. As an example, Time required to start a business (days)* 1.10 30 4 the next section will focus on the different situations of Time to enforce a contract (days)* 2.09 1,420 150 two countries with marked differences in those two Venture capital availability 1.01 3.97 4.45 respects: India and Singapore. Availability of scientists and engineers 3.04 5.67 5.03 Quality of scientific research institutions 3.05 4.84 5.63 Quality of math and science education 4.01 5.16 6.32 Age pyramid vs. talent pyramid: The examples of India Quality of the educational system 4.02 4.27 6.17 and Singapore Local availability of specialized research and Applied to India and Singapore, key GTPM variables training services 5.02 4.66 5.40 display sharp differences. For example, Singapore has a University-industry research collaboration 5.05 3.60 5.47 strong advantage over India in terms of its business envi- Education expenditure as a percentage ronment: it takes almost 10 times longer to enforce a of GNI* 3.07 3.95 2.48 contract in India than in Singapore; similarly, the time to Tertiary education enrollment* 3.06 11.85 55.90 start a business is less than a week in Singapore, versus a Source: NRI 2008–2009. month or so in India. India, however, is ahead of *Hard data. Singapore for its number of scientists and engineers available, and education expenditure (see Table 1). Such differences in variables take on a different meaning when considered against the longer-term background of demographics. Current data and projec- Combining talent data and demographic information, tions to 2025 point to almost symmetrical situations one can identify some striking challenges and questions between the two countries, with a marked aging of regarding talent availability in those two countries: Singapore’s population, while India’s population is only starting to “narrow at the base” and will still display an 1. By the year 2025, India’s population will be age pyramid with a majority of the population below 45 largely concentrated in the age group of 20–50; years of age (see Figures 6 and 7). combined with its current high level of education 7KH *OREDO ,QIRUPDWLRQ 7HFKQRORJ\\ 5HSRUW  ‹  :RUOG (FRQRPLF )RUXP
    105. 1.7: Global Mobility of Talents Figure 6: Singapore’s age pyramids 6a: 2008 ■ Male 80+ ■ Female 75–79 70–74 65–69 60–64 55–59 50–54 45–49 40–44 35–39 30–34 25–29 20–24 15–19 10–14 5–9 0–4 300 250 200 150 100 50 0 0 50 100 150 200 250 300 Population (thousands) Source: US Census Bureau, International Database, available at http://www.census.gov/ipc/www/idb/pyramids.html. 87 6b: 2025 ■ Male 80+ ■ Female 75–79 70–74 65–69 60–64 55–59 50–54 45–49 40–44 35–39 30–34 25–29 20–24 15–19 10–14 5–9 0–4 300 250 200 150 100 50 0 0 50 100 150 200 250 300 Population (thousands) Source: US Census Bureau, International Database, available at http://www.census.gov/ipc/www/idb/pyramids.html. 7KH *OREDO ,QIRUPDWLRQ 7HFKQRORJ\\ 5HSRUW  ‹  :RUOG (FRQRPLF )RUXP
    106. 1.7: Global Mobility of Talents Figure 7: India’s age pyramids 7a: 2008 80+ ■ Male 75–79 ■ Female 70–74 65–69 60–64 55–59 50–54 45–49 40–44 35–39 30–34 25–29 20–24 15–19 10–14 5–9 0–4 70 60 50 40 30 20 10 0 0 10 20 30 40 50 60 70 Population (millions) Source: US Census Bureau, International Database, available at http://www.census.gov/ipc/www/idb/pyramids.html. 88 7b: 2025 80+ ■ Male 75–79 ■ Female 70–74 65–69 60–64 55–59 50–54 45–49 40–44 35–39 30–34 25–29 20–24 15–19 10–14 5–9 0–4 70 60 50 40 30 20 10 0 0 10 20 30 40 50 60 70 Population (millions) Source: US Census Bureau, International Database, available at http://www.census.gov/ipc/www/idb/pyramids.html. 7KH *OREDO ,QIRUPDWLRQ 7HFKQRORJ\\ 5HSRUW  ‹  :RUOG (FRQRPLF )RUXP
    107. 1.7: Global Mobility of Talents expenditure, this will translate into a very large talent pool in India.Will India be in a position Box 1: Global distribution of talent and major shifts to leverage the growth and competitiveness ahead potential of such a large talent pool? Assuming that the country maintains its current rate of The trends discussed above (e.g., in demography) and poli- cies (e.g., in education) will clearly generate regional oppor- growth, improvements in the business environ- tunities. However, and more importantly, some of the talent- ment may become a crucial condition to related data available indicate that some of the most striking achieve this goal. differences among countries may trigger rapid adjustments, reinforced by the increasing global mobility of talents. 2. The same demographic data indicate that India For example, the Global Talent Index (GTI), developed may still enjoy a surplus of talented workers in by Heidrick & Struggles with the Economist Intelligence Unit, some areas, such as IT. However, it remains to be assesses the talent situation of individual countries by com- seen whether such a surplus will continue to bining seven main variables: demographics, quality of com- benefit Australia, Canada, the United States, and pulsory education systems, quality of universities and busi- Western Europe, as is the case today. If the needs ness schools, quality of the environment to nurture talent, of India’s economy continue to grow at today’s mobility and relative openness of the labor market, trends in pace, and if other Asian economies (such as foreign direct investment, and proclivity to attract talent. Based on this approach, the following conclusions emerge: Singapore) continue to exhibit a structural deficit in the area of talent, one can envisage • While the United States will maintain its position as the that Indian talented workers will move progres- world’s leading country for nurturing and developing tal- sively closer to home, and possibly stay home. ented workers over the next five years, it will face increasing competition from the United Kingdom, which 3. Current values of some key GTPM variables will rise to second place by 2012. (such as university-industry research collabora- tion, time needed to start a business, and the • Asia-Pacific countries will offer tough competition to the quality of scientific research institutions, for United States and Europe in attracting and nurturing tal- 89 example) seem to indicate that, in the near ented workers. future, India’s talent pool will be more effective- ly utilized in neighboring Asian countries (and • When it comes to talented workers, BRIC countries appear less homogenous than in other areas. While China possibly in the Middle East) than in India itself. and India rank among the top 10 talent hotspots world- This should lead to the emergence of a regional wide, Russia is expected to fall from 6th to 11th place by India-based nebula (e.g., in IT services) rather 2012, with Brazil slipping from 18th to 19th. than to a set of large Indian companies with headquarters in India. • Asia is well positioned to move ahead in the talent rank- ings: apart from India, other countries are expected to 4. In such regional nebula, advantage will be made continue to feature at the top of such rankings, or to of combining areas of national excellence. For improve by 2012, such as Malaysia (remaining in 12th example, it is likely that—in exchange for direct place), Korea, Rep. (improving from 15th to 13th), or Japan access to the large and fast-growing Indian (from 16th to 14th). market—Singapore could provide capital and infrastructure from its companies and universi- • The same study points out that China is set to exploit its natural demographic advantage by significantly improving ties for the development of high-end research its compulsory education system and developing a much activities. In return, talented Indian citizens better environment for producing and nurturing talent. This could provide complex IT services at a will enable the country to build on its manufacturing base competitive cost. and attract increasing numbers of foreign-owned busi- nesses. 5. Similar cross-border ventures could be developed within Asia and with other regions of the world. • Despite the strong performance of the United States over- In some sectors (aerospace and nuclear industries, all, its labor market is still likely to become less open and for example), India could provide talent to flexible over the next five years amidst fears of terrorism. international private ventures, based on volume Under such hypothesis, the United States would rank 9th and high-end R&D. worldwide on the GTI— only one rank ahead of China. Such observations point to significant shifts in the Source: Heidrick & Struggles/Economist Intelligence Unit, 2007. ways in which talented workers will flow within Asia in the coming years. Some other studies confirm that similar changes will also affect the global picture (see Box 1). 7KH *OREDO ,QIRUPDWLRQ 7HFKQRORJ\\ 5HSRUW  ‹  :RUOG (FRQRPLF )RUXP
    108. 1.7: Global Mobility of Talents A few conclusions and six priority actions to fight the new business models and new modus operandi are upcoming talent crunch emerging. Many examples are found in the realm of From the analysis and examples provided in this chapter, collaborative and open innovation. several conclusions emerge: • Many of these trends will be reinforced by the • Different countries have different talent endowments readjustments made necessary by the current global linked to their demography; educational system; and economic crisis. Others may be hindered or limited ability/will to attract, retain, or export talented by some of the measures that business and govern- workers.While many industrialized countries will ments will take as a result of the same crisis. face serious “talent crunches” in the coming years (particularly in areas such as e-skills and scientific These conclusions point to some serious tensions and engineering professions), several large emerging and difficulties regarding the ways and means by which countries (such as India and China) will themselves national economies will compete for globally mobile be increasingly faced with a talent shortage at talent pools in the near future.They also call for some home, brought about by their fast economic immediate actions.The following list identifies six possi- growth.These countries will need to develop ble areas for action, under three major headings. appropriate national talent pools. Further explo- ration (and quantification) of the proposed GTPM Reducing barriers to the mobility of people and information should help identify the specific advantages and Considering the slow pace at which demographic con- weaknesses of national economies and draw a straints (and, to some extent, educational system con- “world map of talents.” Such an exercise would straints) can be altered, physical and virtual mobility likely help anticipate main flows and forces in the must be encouraged as a key instrument to ease some of increasingly fluid world of mobile talents. the most serious inadequacies in terms of global supply and demand for talents. Physical mobility should not be • Physical mobility is a double-edged sword in this hampered by restrictive visa and immigration policies, respect. Associated with migration, it may mean and virtual mobility should not be limited by uneven- brain drain. Linked with temporary labor move- 90 ness in global connectivity. At the global level, one of ments, it may mean exports, acquisition of foreign the most detrimental effects of a persistent digital divide knowledge and culture, and establishment of busi- between rich and poor countries would be to limit the ness and personal links across borders, all of which world’s ability to benefit from the possible combinations are potentially beneficial for the country of origin. of talents across cultures and geographical borders. In the case of poorer countries, such a divide would con- • IT and the emergence of global networks are radi- tribute to the resilience of the negative effects of physi- cally changing the mobility equation by introduc- cal migrations (brain drain). ing new ways to combine talents across national Action 1: In deciding on visa and immigration borders. In the recent past, outsourcing (especially issues and policies, governments in industrialized coun- business process outsourcing) has been one of the tries should take full account of the cost of limiting the main beneficiaries of this phenomenon, as well as global mobility of talented workers; more open policies all sectors in which virtual teams can be organized are likely to benefit all economies. for the production, maintenance, marketing, sales, or Action 2: Developing broadband infrastructure distribution of complex products and services. worldwide (especially in developing countries and regions such as sub-Saharan Africa) should be consid- • Virtual mobility has become a key element in the ered a priority for the coming decade.This will allow development of exporters of IT services (e.g., more virtual mobility of talents and benefit developing India), and in that of importers of foreign expertise countries in at least two ways: (1) by better integrating (e.g., fast-growing economies in the Gulf area). In them in global production processes while offering a both cases, large multinational groups have been productive outlet to local talents, and (2) by counterbal- among the fastest growing users of the resulting ancing the negative effects (brain drain) of physical new opportunities arising around cross-cultural mobility. For advanced and fast-growing economies, and cross-national virtual teams. bridging the digital divide is key to benefitting from the innovative ideas, designs, and services that still lie under- • With the advent of new capacities to obtain and used across the global talent pool. share information (either physical, such as ubiqui- tous broadband, or of a more qualitative nature, such as in the context of Web 2.0/social networks), 7KH *OREDO ,QIRUPDWLRQ 7HFKQRORJ\\ 5HSRUW  ‹  :RUOG (FRQRPLF )RUXP
    109. 1.7: Global Mobility of Talents Upgrading the protection of workers and intellectual mission and interest in making fuller use of existing property instruments not only as a tool to continuously upgrade workers’ skills, but also as a tool to stimulate upward In a more fluid world of physical mobility, the current social and career mobility and to fight inequality and major economic crisis is likely to increase the willingness exclusion. of low-skilled workers to offer their labor worldwide. Whether it is physical or virtual, mobility will be a This may well lead to a global weakening of their key factor in our collective efforts to bring about an individual and collective bargaining power. Although equitable, multicultural, open, innovative, and sustainable pressures on wages may be temporary and properly kind of globalization.To do so, however, we need to (1) addressed by market forces, other forces may require become fully aware of the potential benefits of taking legal and regulatory safeguards. Specific efforts will need collective action to encourage and allow such mobility to be deployed—in particular, to avoid the emergence on a global scale, and (2) consider the current crisis as and the spreading of irreversible restrictions to workers’ an opportunity (and an incentive) to take such action, rights and protections. Similarly, if virtual mobility is rather than an excuse to procrastinate. developing quickly across virtual collaboration networks, intellectual property rights will require specific protection to ensure that innovators worldwide are duly recognized Notes and their efforts properly rewarded.The current 1 For example, it has now become common for analysts and approach to intellectual property regimes needs to be observers to describe a world in which Indian and Chinese nation- upgraded to fully reflect the new realities of our global als, after completing higher degree education in California and becoming successful Silicon Valley entrepreneurs, become a networked economy. bridge between American and Asian markets. Action 3: Governments need to agree to interna- 2 For details on the definitions and sources of the variables included tional standards regarding the rights, working conditions, in the GTPM, please refer to Appendix A and the Technical Notes and living environment of migrant workers. Conventions and Sources section at the end of this Report. already in existence (e.g., those in the purview of the 3 The area of e-skills has been one in which the European International Labour Organization) should be reinforced Commission has been particularly active in the recent past. See, in particular, the outcome of the recent European e-Skills 2008 and reaffirmed in order to avoid further Conference in Thessaloniki, October 9–10; information available at 91 deterioration in times of crisis. http://eskills.cedefop.europa.eu/conference2008/. On the same subject, also see Lanvin and Passman 2008. Action 4: Intellectual property regimes should be revisited, taking into account the rapid development of collaborative and open innovation networks. References Arabian Business. 2008. ”A Rupee Reprieve for Gulf Recruitment Education, education, education Crisis?” 9 (44): 19. As our societies and economies evolve toward more Cedefop (European Centre for the Development of Vocational Training). knowledge-centric activities and structures, education is 2008. European e-Skills 2008 Conference: Implementing a Long playing an ever more central role as a source of compar- Term E-Skills Strategy in Europe. Thessaloniki, October 9–10. ative advantage and an engine of social equity and Cheese, P., R. J. Thomas, and E. Craig, E. 2008. The Talent Powered Organization: Strategies for Globalization, Talent Management and inclusion.The current situation points to some growing High Performance. Philadelphia: Kogan Page. gaps between the needs of our “knowledge ambitions” Coe, D. T. 2007. “Globalisation and Labour Markets: Policy Issues and our ability to generate the skills and talents needed Arising from the Emergence of China and India.” OECD Social to support it. In industrialized countries, diminished Employment and Migration Working Paper No. 63. Paris: OECD. interest for mathematics and science (especially among ———. 2008. “Jobs on Another Shore.” Finance and Development 45 (1, March). Washington, DC: International Monetary Fund. girls) is a growing concern. On the other hand, the rapid pace of technological change accelerates the Fraser, M. and Dutta, S. 2008. Throwing Sheep in the Boardroom. Chichester: John Wiley and Sons. process of knowledge obsolescence in an increasing Giridharadas, A. 2007. “Outsourcing Works So Well, India Is Sending number of areas, creating unprecedented challenges for Jobs Overseas.” The New York Times, October 6: 5. teachers and educators in the formal educational system. Hartung, R. 2008. “It’s Talent Fusion At Work.” NewsToday, Singapore. Action 5: Governments, business, and educational August 9–10: 36. institutions (at primary, secondary, and tertiary levels) Heidrick & Struggles/Economist Intelligence Unit. 2007. Global Talent need to join forces to change the image of scientific and Index 2007–2012. Available at http://www.weknowglobaltalent. engineering careers among young people; curricula must com/gti/window/gti. be developed and harmonized to improve the quality Institute of International Education. 2008. “Open Doors: Report on International Educational Exchange.” Available at and quantity of e-skilled and science-skilled workers and http://opendoors.iienetwork.org. managers, both in the IT and non-IT sectors. Kirkegaard, J. F. 2007. The Accelerating Decline in America’s Action 6: Fuller advantage and use need to be High-Skilled Workforce: Implications for Immigration Policies. made of the opportunities created by IT and networks Washington, DC: Peterson Institute for International Economics. in the areas of distance learning and life-long education. Governments, business, and educators have a common 7KH *OREDO ,QIRUPDWLRQ 7HFKQRORJ\\ 5HSRUW  ‹  :RUOG (FRQRPLF )RUXP
    110. 1.7: Global Mobility of Talents Lanvin, B. 2008. ”E-Skills, Competitiveness and Employability: Knowledge Societies’ Next Frontier.” White Paper. Available at http://www.insead.edu/elab/eskills. Lanvin, B. and P. Passman. 2008. “Building E-skills for the Information Age.” Global Information Technology Report 2007–2008: Fostering Innovation through Networked Readiness. Hampshire: Palgrave Macmillan. 77–90. Le Monde. 2008. “L’atlas des migrations: Les routes de l’humanité.” Special Issue, November. Manning, P. 2005. Migration in World History. Themes in World History. New York: Routledge. Manpower. 2008.”The Borderless Workforce: 2008.” White Paper. Available at http://www.elanit.com/imm/pdf/NEW_080624_ BorderlessWkforce_WhitePaper_A4_FINAL.pdf. Mattioli, D. 2008. “More Americans Vault Overseas to Search for Jobs.” The Wall Street Journal, October 14: 32. McKeown, A. 2004. ”Global Migration, 1846–1940.” Journal of World History 15 (2) 155–89. OECD (Organisation for Economic Co-operation and Development). 2008. The Global Competition for Talent: Mobility of the Highly Skilled. Paris: OECD. Premji, A. 2008. “Le travail du prochain président américain ne va pas être facile, je n’aimerais pas être à sa place.” Interview given to Annie Khan, Le Monde, September 21–22. Ready, D. A., L. A. Hill, and J. A. Conger.2008. “Winning the Race for Talent in Emerging Markets.” Harvard Business Review 86 (11): 62–70. Solimano, A., ed. 2008. The International Mobility of Talent: Types, Causes and Development Impact. New York: UNU-WIDER Studies in Development Economics, Oxford University Press. Tapscott, D. 2008. Grown Up Digital: How the Net Generation Is 92 Changing your World. New York: McGraw Hill. UNCTAD (United Nations Conference on Trade and Development). Various years. World Investment Report. Available at http://www.unctad.org/Templates/Page.asp?intItemID=1485 &lang=1. UNDP (United Nations Development Programme). 2007. Human Development Report 2007/2008. Houndsmills, Basingstoke, Hampshire: Palgrave Macmillan. Available at http://hdr.undp.org/en/reports/global/hdr2007-2008/. UNESCO (United Nations Educational, Scientific and Cultural Organization). 2007. Education for All Global Monitoring Report 2008—Education for All by 2015: Will We Make It? Paris: UNESCO. UNESCO Institute for Statistics. Available at http://www.uis.unesco.org/ ev.php?URL_ID=2867&URL_DO=DO_TOPIC&URL_SECTION =201. Veloo, R. 2008. “Our Talent Blindspot.” NewsToday, Singapore, August 9–10: 10. Wagstyl, S., J. Cienski, K. Eddy, and T. Escritt. 2008. “Gone West: Why Eastern Europe Is Labouring under an Abundance of Jobs.” Financial Times, January 17: 9. World Bank Group. 2008. Doing Business 2009. Washington, DC: World Bank. Available at http://www.doingbusiness.org/. World Bank, Governance Indicators. Available at http://web.worldbank. org/WBSITE/EXTERNAL/WBI/EXTWBIGOVANTCOR/0,,menuPK:17 40542~pagePK:64168427~piPK:64168435~theSitePK:1740530,00 .html. 7KH *OREDO ,QIRUPDWLRQ 7HFKQRORJ\\ 5HSRUW  ‹  :RUOG (FRQRPLF )RUXP
    111. 1.7: Global Mobility of Talents Appendix A: GTPM variable descriptions and sources Time required to start a business, 2008 Quality of the educational system, 2007, 2008 Duration of all procedures required to register a firm. This is based on the average score on a 1–7 scale of a large sample group in a particular country responding to Source: The World Bank Group, Doing Business 2009. Available at http://www.doingbusiness.org/. the question of whether the education system in their country (1 = does not meet the needs of a competitive Time to enforce a contract, 2008 economy, 7 = meets the needs of a competitive economy). Number of days required to resolve a dispute Source: World Economic Forum, Executive Opinion Survey 2007, 2008. Source: The World Bank Group, Doing Business 2009. Available at http://www.doingbusiness.org/. Local availability of specialized research and training serv- ices, 2007, 2008 Venture capital availability, 2007, 2008 This is based on the average score on a 1–7 scale of a This is based on the average score on a 1–7 scale of a large sample group in a particular country responding to large sample group in a particular country responding to the question of whether specialized research and training the question of whether entrepreneurs with innovative services are (1 = not available, 7 = available from but risky projects can generally find venture capital in world-class institutions). their country (1 = not true, 7 = true). Source: World Economic Forum, Executive Opinion Survey 2007, 2008. Source: World Economic Forum, Executive Opinion Survey 2007, 2008. University-industry research collaboration, 2007, 2008 FDI Inflows as percent of GDP, 2001–05 (average) This is based on the average score on a 1–7 scale of a Inflows of FDI in the reporting economy comprise cap- large sample group in a particular country responding ital provided (either directly or through other related to the question of whether, in its R&D activity, business enterprises) by a foreign direct investor to an enterprise collaboration with local universities in their country resident in the economy. is (1 = minimal or nonexistent, 7 = intensive and Source: UNCTAD, World Investment Report. Available at outgoing). http://www.unctad.org/Templates/Page.asp?intItemID=1485&lang=1. 93 Source: World Economic Forum, Executive Opinion Survey 2007, 2008. Networked Readiness Index 2008-2009 Total expenditure for R&D as percent of GDP, 2006 Source: World Economic Forum, The Global Information and Technology Report 2008–2009. Included are fundamental and applied research and experimental development work leading to new Availability of scientists and engineers, 2007, 2008 devices, products, and processes. This is based on the average score on a 1–7 scale of a Source: UNESCO Institute for Statistics. Available at large sample group in a particular country responding to http://www.uis.unesco.org/ev.php?URL_ID=2867&URL_DO=DO_TOPIC&URL_ SECTION=201. the question of whether scientists and engineers are available in their country (1 = nonexistent or rare, Tertiary education enrollment, 2006 or most recent year 7 = widely available). available Source: World Economic Forum, Executive Opinion Survey 2007, 2008. The reported value corresponds to the total enrollment in tertiary education expressed as a percentage of the Quality of scientific research institutions, 2007, 2008 population of the five-year age group following on from This is based on the average score on a 1–7 scale of a the secondary school-leaving age. Note that the gross large sample group in a particular country responding to enrollment rate (GER) can exceed 100 percent due to the question of whether scientific research institutions in early or late entry and/or grade repetition. their country are (1 = nonexistent, 7 = the best in their According to UNESCO, tertiary education is fields internationally) composed of two stages.The first stage of tertiary edu- Source: World Economic Forum, Executive Opinion Survey 2007, 2008. cation, ISCED level 5, includes level 5A, composed of largely theoretically based programs intended to provide Quality of math and science education, 2007, 2008 sufficient qualifications for gaining entry to advanced This is based on the average score on a 1–7 scale of a research programs and professions with high skill require- large sample group in a particular country responding to ments; and level 5B, where programs are generally more the question of whether the math and science education practical, technical, and/or occupationally specific.The available in their country’s schools (1 = lag far behind second stage, ISCED level 6, comprises programs devot- most other countries’ schools, 7 = are among the best in ed to advanced study and original research, leading to the world). the award of an advanced research qualification. Source: World Economic Forum, Executive Opinion Survey 2007, 2008. Source: UNESCO, Institute for Statistics (retrieved January 12, 2008); UNESCO, Education for All Global Monitoring Report 2008—Education for All by 2015: Will We Make It? 7KH *OREDO ,QIRUPDWLRQ 7HFKQRORJ\\ 5HSRUW  ‹  :RUOG (FRQRPLF )RUXP
    112. 1.7: Global Mobility of Talents Appendix A: GTPM variable descriptions and sources (cont’d.) Education expenditure, 2006 or most recent year available This variable refers to public current operating expendi- tures in education, including wages and salaries and excluding capital investments in buildings and equipment. Source: The World Bank, World Development Indicators Online Database (retrieved November 4, 2008). Human Development Index (HDI), 2007 The HDI provides information on the human develop- ment aspect of economic growth.The HDI is based on three indicators: longevity, as measured by life expectan- cy at birth; educational attainment, as measured by a combination of adult literacy rate and the combined gross primary, secondary, and tertiary enrollment ratio; and standard of living, as measured by GDP per capita (purchasing power parity in US dollars). Source: UNDP Human Development Report 2007/2008, Table 1. Available at http://hdr.undp.org/en/reports/global/hdr2007-2008/. Rule of law, 2006 This indicator includes several indicators that measure the extent to which agents have confidence in and abide by the rules of society.These include perceptions of the incidence of both violent and nonviolent crime, the effectiveness and predictability of the judiciary, and the 94 enforceability of contracts. Source: The World Bank, Governance Indicators. Available at http://web.worldbank.org/WBSITE/EXTERNAL/WBI/EXTWBIGOVANTCOR/ 0,,menuPK:1740542~pagePK:64168427~piPK:64168435~theSitePK:1740530,00. html. Control of corruption, 2006 This indicator corresponds to “graft” measures of cor- ruption—notably, corruption measured by the frequency of “additional payments to get things done” and the effects of corruption on the business environment. Source: The World Bank, Governance Indicators. Available at http://web.worldbank.org/WBSITE/EXTERNAL/WBI/EXTWBIGOVANTCOR/ 0,,menuPK:1740542~pagePK:64168427~piPK:64168435~theSitePK:1740530,00. html. 7KH *OREDO ,QIRUPDWLRQ 7HFKQRORJ\\ 5HSRUW  ‹  :RUOG (FRQRPLF )RUXP
    113. 1.8: R&D and Innovation in the ICT Sector CHAPTER 1.8 This chapter analyzes recent developments in increasingly globalized information and communication technologies (ICT) research and development (R&D) and innovation.1 R&D and Innovation in the ICT Global structures of R&D, science performance, invention, and innovation are in transition.2 The main Sector: Toward Globalization dimensions of change are the absolute growth of R&D and innovation-related activities; the rise of the BRIC and Collaboration economies in scientific and technological fields;3 significant globalization of R&D; more performance GRAHAM VICKERY, OECD of R&D in the services sector; and a growing focus on SACHA WUNSCH-VINCENT, OECD non-technological innovation, enhanced international- ization and mobility of highly skilled people, and increased internationalized patenting. Among the main elements underpinning these developments have been the increasingly knowledge- driven nature of innovation; the quickly changing organization of research, driven by information tech- nologies, collaboration, and the sharing of knowledge; and changes in markets, the competition environment, and technology. Firms are also embracing “open” innovation approaches and actively cooperating with external actors. The next sections cover this trend toward more international and collaborative ICT R&D. Globalized R&D agenda in ICT 95 While ICT-related research challenges and priorities are evolving, an increasingly globalized ICT R&D agenda is emerging with eight broad priorities (Figure 1). Some of the research topics listed in Figure 1 have been in the ICT R&D agenda for some time, especially those clustered around the physical foundations of com- puting, computing systems, and software engineering. Optical and quantum computing, robotics, and artificial intelligence also remain important for addressing long- term challenges. In practice, R&D in a given area has led to the emergence of new topics: for example, the rapidity with which semiconductors are being miniatur- ized has made nanotechnology research part of core ICT R&D; mounting demand for high-speed broadband is driving research into all-optical networks and optical computing. Progress in biotechnology, nanotechnology, cognitive sciences, and interdisciplinary research fosters synergy and convergence and opens up new research areas. ICT R&D and innovation also increasingly intend to address pressing socioeconomic challenges, which are now international in scope and reach—for example, cli- mate change, health care, and aging societies (Figure 2). The authors wish to thank Cristina Serra-Vallejo, statistician at the OECD, and Arthur Mickoleit, consultant to the OECD, who contributed to this chapter. 7KH *OREDO ,QIRUPDWLRQ 7HFKQRORJ\\ 5HSRUW  ‹  :RUOG (FRQRPLF )RUXP
    114. 1.8: R&D and Innovation in the ICT Sector Figure 1: ICT R&D priorities (clusters of topics and subtopics) • Miniaturization of complementary metal–oxide–semiconductor (CMOS) technology, use of nanotechnology Physical foundations of computing • Beyond CMOS: Optical and quantum computing, spintronics • Flexible electronics for increased applicability of computing devices • High-end computing and storage (upscaling) Computing systems and architectures • Embedded systems, systems-on-a-chip, systems-in-package (downscaling) • Robotics, autonomous computing systems • Converging research agendas of ICT, nanotechnologies, biotechnologies, and Converging technologies and other scientific disciplines • ICT imitating natural information processing scientific disciplines • ICT enabling scientific research • Wired and wireless broadband technologies • Next-generation networks, mobile ad-hoc networks Network infrastructures • Radio frequency identification (RFID) in sensor-based networks, Internet of Things • Network reliability, quality of service 96 • Software development paradigms, artificial intelligence Software engineering and • Use of ICT to increase productivity of software engineering data management • Management of large and heterogeneous data sources • Natural language processing • Data mining in complex sources, multimedia content extraction, semantic web • Content digitization, digital preservation and access Digital content technologies • Participative web and networked collaboration • Customized and context-oriented information • Productivity gains through improved user interfaces • ICT accessibility and usability Human-technology interfaces • Interaction with all human senses • Augmented, immersive, and virtual realities • Security of computing systems, networks, applications, and services • Security of critical information systems ICT and Internet security and safety • Data integrity, confidentiality, and issues of privacy • Internet crime, cyberterror Source: OECD. 7KH *OREDO ,QIRUPDWLRQ 7HFKQRORJ\\ 5HSRUW  ‹  :RUOG (FRQRPLF )RUXP
    115. 1.8: R&D and Innovation in the ICT Sector Figure 2: Examples of ICT R&D as solutions to pressing global socioeconomic challenges Health care Environmental challenges Transport and mobility • Health-care management, patient files, health • Energy-efficient ICT for data centers and • Traffic monitoring and control systems databases, clinical information systems Internet infrastructures • Personalized traffic information • Telemedicine, remote health monitoring, • ICT for energy-intensive industries • Driver assistance systems using sensors, drug delivery using RFID and biosensors • Digitization and digital delivery of goods embedded systems, and augmented reality • Detection of adverse health events, early and services technologies warning systems • Pollution monitoring using adaptive sensor • Software optimization for freight route • Remote surgery using haptic interfaces, networks planning virtualization, and advanced network tech- • Improved product design for recyclability • Sensor and satellite-based navigation and nologies positioning systems • Tracking waste streams using sensors • Data mining in medical images • Adaptive safety systems using RFID • Environmental information systems for • Bioinformatics and biomedical computing decision makers, businesses, citizens • Teleworking solutions • Collaborative networking and grid comput- ing in medical research, simulated surgeries Independent living and Emergency and disaster Defense social inclusion management • Command-and-control systems • Accessibility of ICT solutions for the young, • Remote, sensor-based detection systems • Real-time language translation the elderly, impaired users connected to geo-spatial information • Surveillance robots, such as unmanned systems • Improved usability through advanced armored vehicles (UAVs) software and hardware interfaces—for • Mobile ad-hoc networks for immediate • Augmented reality systems to assist example, natural language control, disaster relief decision making in theaters brain-computer interfaces • Interoperability of observation and • Sensor-based threat detection—for • Mobile monitoring, detection of adverse monitoring systems 97 example, biochemical substances health events through sensor-based and • Holistic warning systems integrating • Electronic warfare—for example, radio wearable computing disaster-specific solutions frequency jamming • Smart home technologies to assist elderly • Combat simulations using immersive and chronically ill patients virtual reality technologies • Adapted online services to assist • Mobile ad-hoc networks in theaters administrative tasks Source: OECD. ICT sector R&D expenditures in the Organisation for in the United States (39 percent), Australia (32 percent Economic Co-operation and Development (OECD) in 2002–03), Canada (39 percent in 2005), Japan (36 In light of the above challenging research agenda, the percent in 2005), and Ireland (34 percent). ICT sector undertakes large investments in R&D and is The decline in R&D in the ICT goods sector since very innovative. In terms of R&D expenditures, patents, 2001 (constant terms) has been partly balanced by an and venture capital investment, it exceeds other industries increase in ICT services, which have grown very rapidly by a large margin. ICT is the most important of the five since the 1990s.These services surpassed the chemical sectors that dominate business-sector R&D (Figure 3). sector in 2001 and almost reached the level of expendi- In 2005, the OECD 21 ICT goods and services sector ture in the pharmaceutical sector.There has been a very spent about two and a half times as much on R&D significant growth in the share of services in computer (US$130 billion) as the automotive sector and more and related activities (largely software and IT services): than triple the pharmaceutical sector.4 21 percent in 2005, up from 9 percent in 1993. In 2005, the year of the latest available official data, The United States still accounts for 40 percent of ICT manufacturing R&D accounted for more than a all OECD R&D expenditures in ICT manufacturing quarter of total manufacturing business R&D expendi- and services.The European Union (EU) 15 accounts for ture in most OECD countries. It accounted for more a little under a quarter of the total, Japan for 22 percent, than half in Finland and Korea, Rep. (Korea)(63 percent and Korea for 9 percent, with the larger OECD members and 57 percent, respectively), and more than 30 percent making up the bulk of the remainder in 2005.5 7KH *OREDO ,QIRUPDWLRQ 7HFKQRORJ\\ 5HSRUW  ‹  :RUOG (FRQRPLF )RUXP
    116. 1.8: R&D and Innovation in the ICT Sector Figure 3: Growth of the largest R&D-spending sectors in the OECD 21 area, 1993–2005 ICT total 150 ICT manufacturing1 Motor vehicles Pharmaceuticals PPP $ (billions, constant 2000 prices) ICT services2 120 Chemicals Research and development sector3 90 60 30 0 1993 1994 1995 1996 1997 1998 1999 2000 2001 2002 2003 2004 2005 Source: OECD estimates based on ANBERD and RDS databases, June 2008. 1. Office, accounting and computing machinery (ISIC 30); Radio, TV and communication equipment (ISIC 32); Medical, precision and optical instruments (ISIC 33). 2. Telecommunications (ISIC 642) and in some cases ISIC 64; Computer and related services (ISIC 72). 3. Research and development (ISIC 73): Research and experimental development on natural sciences and engineering and on social sciences and humanities. 98 In ICT manufacturing, Finland, Korea, Japan, recession forecasted to last OECD-wide until 2010: that Sweden, and the United States have higher than average is, they may either significantly reduce their R&D shares of R&D expenditure in GDP. Finland and Korea spending or decide to maintain this spending to preserve have increased their shares since 1997, and estimates for their competitiveness in the medium to long term. 2006 show a further pick-up for Korea. As a share of Currently, R&D expenditures of the top ICT firms GDP, Denmark, Finland, Ireland, and Sweden have the are significantly higher than those of R&D-intensive greatest specialization in ICT services R&D (Figure 4). firms in the chemicals, pharmaceuticals, or automotive sectors.6 In 2006, the top 100 ICT R&D-performing Expenditure on software R&D has risen most rap- idly of all parts of the ICT sector. Data on business R&D firms (ranked by absolute R&D expenditures in 2006) in computer and related services for 2006 show that the spent an average of 6.7 percent of revenues on R&D. United States leads by a large margin (US$30.5 billion), And, as will be explained later, these R&D expenditures roughly 15 times that of Israel (US$2.1 billion), Japan are increasingly spread internationally. (US$2 billion), the United Kingdom (US$2 billion), and The bulk of ICT R&D of the top 250 ICT firms is Germany (US$1.9 billion).The same applies to business conducted by US (43 percent) and Japanese (26 percent) R&D in software consultancy and supply: the United firms, followed by firms from Germany (11 percent), States (US$17 billion) carries out around 10 times more Korea (8 percent), and other European countries. Firms from Chinese Taipei,7 in particular, have overtaken firms R&D than Germany (US$1.8 billion), followed by Korea and France (US$0.9 billion each). from Canada and the United Kingdom in their R&D Also, the global distribution of R&D is changing, spending. Despite rapid growth, Chinese ICT firms still and some non-OECD economies are becoming impor- have a relatively small share of the R&D expenditures of tant ICT R&D spenders. Sectoral spending data are the top 250 ICT firms. hard to produce in a way that allows direct comparison, Korean firms have caught up to firms from other however, for these countries at the aggregate level. advanced OECD countries. Despite initial high starting levels, German and US firms have also significantly R&D spending of top ICT firms stepped up their R&D spending. Japan had a slight The R&D spending of the top ICT firms has grown increase and France a slight decrease. Canada has also consistently over the last decade and held up well during seen a drop, owing to spending declines by Nortel the years following 2001, reaching US$151 billion in Networks and Celestica. In terms of growth in R&D 2006 and expanding in 2007.The question is how ICT spending 2000–06, firms from Chinese Taipei and China firms will react to the current economic downturn, with are leading, albeit from low levels (Figure 5). 7KH *OREDO ,QIRUPDWLRQ 7HFKQRORJ\\ 5HSRUW  ‹  :RUOG (FRQRPLF )RUXP
    117. 1.8: R&D and Innovation in the ICT Sector Figure 4: Business R&D expenditure for ICT goods and services, 1997 and 2005 4a: Selected ICT manufacturing industries 1.5 ■ 2005 1997 1.2 Percent of GDP 0.9 0.6 0.3 0.0 Denmark Belgium Norway Italy Australia Finland Korea, Rep. Japan Sweden United States Germany Netherlands France Ireland Canada United Kingdom Czech Republic Portugal Spain Greece Poland Source: OECD estimates based on ANBERD and RDS databases, June 2008. See also OECD, 2007. Note: When data for class 642 (Telecommunications) are unavailable, division 64 (Post and telecommunications) is used. Class 642 has the major share of divi- 99 sion 64 R&D expenditure; for example, in the United States, class 642 accounts for 97–98 percent of the R&D in division 64. 4b: Selected ICT services industries 0.4 ■ 2005 1997 0.3 Percent of GDP 0.2 0.1 0.0 Denmark Finland Ireland Sweden United Kingdom United States Canada Norway France Belgium Korea, Rep. (1998) Australia Czech Republic Spain Germany Japan Italy Greece Netherlands Portugal Poland Source: OECD estimates based on ANBERD and RDS databases, June 2008. See also OECD, 2007. Note: Research and development (ISIC 73): Research and experimental development on natural sciences and engineering and on social sciences and humanities. 7KH *OREDO ,QIRUPDWLRQ 7HFKQRORJ\\ 5HSRUW  ‹  :RUOG (FRQRPLF )RUXP
    118. 1.8: R&D and Innovation in the ICT Sector Figure 5: Growth of R&D expenditures of top ICT firms, 2000–06 (current terms, percent) Chinese Taipei China Korea, Rep. Germany United States Japan France Canada –50 0 50 100 150 200 250 300 350 Percent Source: OECD Information Technology Outlook database. 100 Other than China and India, ICT companies from In terms of growth in R&D spending, the leaders OECD enhanced engagement countries (Brazil, are Google (114 percent, Internet firm), SanDisk (91 Indonesia, and South Africa) and OECD accession percent, IT equipment), Research in Motion (63 per- countries (Chile, Estonia, Israel, Russia, and Slovenia) are cent, communication equipment), Lenovo (54 percent, not in the top R&D spending group.8 In some cases, IT equipment) and Nvidia (42 percent, electronics and this may be due to lack of reporting (e.g., some Israeli components) (all compound annual growth rate (CAGR), and Russian ICT firms potentially qualify for inclusion, in current US dollar terms), followed by a group of but no data are available). In most cases, however, R&D Internet, service, and software firms despite their smaller expenditures or revenues of these countries’ ICT firms number in the overall top 250 (Table 2). China and are not high enough. India each have one firm in the top 10 in terms of For the top 100 R&D-spending ICT firms, the growth. largest shares are in electronics (33 percent), IT equipment Non-OECD firms are over-represented in terms of (19 percent), communications equipment (17 percent), R&D growth, in part because of their low starting level. and semiconductor firms (14 percent).Telecommuni- Apart from Lenovo (China) and Infosys (India), which cations firms have progressively reduced their R&D are in the top 10, there are a significant number of IT, expenditures and made up only about 5 percent of the electronic equipment, and semiconductor firms from top 100 total in 2006.9 The largest growth of R&D Chinese Taipei (Lite-on Technology, AU Optronics, expenditures over the period 2000–06 was in sectors Taiwan Semiconductor, Benq/Qisda) and communication with lower initial shares: Internet, software, and semi- equipment firms from China (Huawei, ZTE) among the top 50.10 conductor firms. Semiconductor and hardware firms (communication and IT equipment, electronics) are the most intensive in Top ICT R&D spenders by firm Microsoft, Samsung, IBM, and Intel lead the list of ICT terms of R&D expenditures per employee. Broadcom firms ranked by R&D expenditure (Table 1). In 2007, (semiconductors) leads with US$213,000 per employee, Samsung overtook IBM in reported R&D spending.The followed by Qualcomm (communications equipment), first three firms were also top R&D spenders across all Nvidia (electronics and components), and SanDisk (IT industries in 2006, just behind Toyota Motor (US$7.7 equipment). Software firms such as Electronic Arts, billion), Pfizer (US$7.6 billion), and Ford Motor Corp. Microsoft, Adobe Systems, and Intuit are also R&D (US$7.2 billion) in the automotive and pharmaceutical leaders. US ICT firms dominate the top 50, with sectors. notable exceptions such as Nintendo (Japan), Advantest 7KH *OREDO ,QIRUPDWLRQ 7HFKQRORJ\\ 5HSRUW  ‹  :RUOG (FRQRPLF )RUXP
    119. 1.8: R&D and Innovation in the ICT Sector Table 1: Top ICT R&D spenders: Absolute expenditure, 2006 and 2007 (US dollars, millions) Rank Company Country Industry R&D 2006 R&D 2007 1 Microsoft United States Software 6,584 7,121 2 Siemens Germany Electronics & components 6,312 n/a 3 Samsung Korea, Rep. Electronics & components 6,004 6,451 4 IBM United States IT equipment 6,107 6,153 5 Intel United States Semiconductors 5,873 5,700 Nokia1 6 Finland Communication equipment 4,896 n/a 7 Matsushita (Panasonic) Japan Electronics & components 4,854 4,909 8 Sony Japan Electronics & components 4,675 4,619 9 Cisco United States Communication equipment 4,067 4,499 10 Motorola United States Communication equipment 4,106 4,429 Source: OECD Information Technology Outlook database. 1. From 2007, Nokia consolidates financial information for Nokia Siemens Networks, a joint venture between Nokia and Siemens. Nokia’s reported 2007 R&D expenditure of US$7.730 million is therefore not comparable to earlier expenditures. Table 2: Top ICT R&D spenders: Expenditure growth, 2000–07 (CAGR, based on current US dollars) Rank Company Country Industry Growth (%) 2000–07 1 Google United States Internet 113.5 2 SanDisk United States IT equipment 91.2 3 Research in Motion Canada Communication equipment 63.1 4 Lenovo China IT equipment 54.0 5 Nvidia United States Electronics & components 42.2 6 Infosys India Services 39.5 7 Yahoo! United States Internet 38.5 8 eBay United States Internet 35.2 101 9 Symantec/Veritas United States Software 34.6 10 Jabil Circuit United States Electronics & components 33.6 Source: OECD Information Technology Outlook database. (Japan), ASM Lithography (the Netherlands), Samsung very strong revenue growth, coupled with slower (Korea), LG Electronics (Korea), Qimonda (Germany), increases in R&D, have led to declining R&D intensities Nortel Networks (Canada), Nokia (Finland), and in recent years (3.3 percent in 2007), even though the Ericsson (Sweden). Few other European or Japanese company is well known for product innovations, leading firms are among the top 50. design and strong branding. Other IT equipment firms with strong consumer product operations from Chinese Taipei and China such as Benq/Qisda, Lenovo, ASUStek, Trends in R&D intensity R&D expenditure as a share of sales revenues is another and Acer are also at the lower end of the ranking in measure of R&D intensity. Semiconductor firms lead by R&D intensity, but they tend to innovate most in this measure (Figure 6).The top 10 firms in this ranking process technology and supply arrangements. Internet spent between one-fifth and one-third of their revenues firms such as Amazon and Expedia have stronger R&D on R&D. intensities (over 5 percent), but they are still far from On average, in 2006, semiconductor and software other US Internet firms such as Google (13 percent) or firms were the most R&D-intensive, with average R&D Yahoo! (16 percent). spending equivalent to around 15 percent of revenues. Firms from the United States dominate the list of Semiconductor firms had a strong increase in R&D the most R&D intensive. Only one Japanese firm— intensity between 2000 and 2006, while IT equipment, Advantest (IT equipment)—has been in this top 50 for services, and telecommunication firms have seen an some years, and some other Japanese companies (e.g., overall decrease. Rohm, Pioneer, Omron,Yokogawa Electric) have IT equipment firms such as Apple, Dell, and oscillated between 50th and 60th place.There are two Hewlett Packard are often seen as leading innovators, Chinese communications equipment firms (ZTE and but with R&D intensity below 5 percent they are at the Huawei) in the top 50 most R&D-intensive ICT firms, lower end of the top 100 ranking of this variable. Apple’s sharing leading positions with firms such as Juniper 7KH *OREDO ,QIRUPDWLRQ 7HFKQRORJ\\ 5HSRUW  ‹  :RUOG (FRQRPLF )RUXP
    120. 1.8: R&D and Innovation in the ICT Sector Figure 6: Average R&D intensity of top ICT firms by sector, 2000 and 2006 Semiconductor Software Communications equipment Internet Electronics & components IT equipment ■ 2006 ■ 2000 Services Telecommunications 0 5 10 15 Sales revenues (percent) Source: OECD Information Technology Outlook database. 102 Networks,Tellabs, Qualcomm, Motorola, Avaya, and industries were responsible for over 60 percent of all Cisco (all from the United States); Nortel Networks, ICT R&D expenditure in 2005–06. Finance and insur- Research in Motion (both from Canada); Ericsson ance represented 34 percent, largely owing to in-house (Sweden); Alcatel-Lucent (France); and Nokia (Finland). R&D of large Australian banks. Software development plays a particularly important ICT-related R&D in other industries role in ICT R&D expenditures of non-ICT industries, ICT-related R&D is increasingly crucial to technologi- notably in finance and publishing, but also in manufac- cal advances and innovation in non-ICT sectors and turing (e.g., machinery). For example, in the United products.These include space, defense, infrastructure States in 2005, about 30 percent of software was devel- (e.g., power grids), automobiles, automation, robots, oped by non-ICT industries—in the chemical, finance logistics, aviation, health care, environment monitoring, and insurance, automotive, and real estate sectors; in and toys. other manufacturing activities; and in service activities A large share of the R&D in non-ICT industries— such as newspapers and architecture. about one-quarter of economy-wide total ICT R&D— leads to ICT products. Moreover, in some non-ICT Trends in the organization of an increasingly sectors, expenditures on R&D that result in ICT products globalized ICT R&D are a large share of total R&D expenditures.11 Data for The ICT sector is R&D-intensive but is also innovative European countries show that in the Czech Republic, in terms of how it organizes R&D. It has benefited from around 25 percent of ICT R&D in 2006 was performed partnerships with public research and employed a mix of in non-ICT industries. In Denmark, close to 20 percent internal and external as well as national and internation- of business ICT R&D in 2005 was conducted in non- al R&D strategies.While all have been used for many ICT industries, and in Norway, around 25 percent of years, the organization of R&D has been changing: col- ICT R&D was performed outside the ICT sector in 2006. laboration and internationalization of R&D are seen as Within the Asia-Pacific region, in 2006 Japan spent major sources of innovation for the industry, and there US$5.5 billion on ICT-related R&D activities outside are signs that they are increasing. the ICT industry, or 24 percent of economy-wide ICT In recent years OECD countries have substantially R&D spending (Figure 7).The biggest share was in raised their overall public funding for R&D.12 Data on transport equipment, which is dominated by the country’s government budget appropriations or outlays for R&D carmakers and suppliers, and in electrical and general (GBAORD) show that between 2000 and 2006, gov- machinery manufacturing. In Australia, non-ICT- 7KH *OREDO ,QIRUPDWLRQ 7HFKQRORJ\\ 5HSRUW  ‹  :RUOG (FRQRPLF )RUXP
    121. 1.8: R&D and Innovation in the ICT Sector Figure 7: Japanese ICT R&D expenditures, in ICT and non-ICT sectors, 2006 Iron and metal products: 1% Services: 2% Chemical products: 2% Other manufacturing: 3% Electrical machinery equipment and supplies: 5% ICT industry: 76% General machinery: 5% Transportation equipment: 6% Source: Japanese Statistics Bureau, 2007. 103 ernment R&D budgets in the OECD area expanded by follows the trend of globalizing R&D activities as multi- 6.8 percent annually, faster than GDP, although with national enterprises more and more aim at exploiting globally available knowledge and skills.13 considerable differences among countries. Because of the complex interactions among research, development, Yet the available data that are produced with long and innovation, the ICT sector has always relied heavily time lags show that most ICT firms still conduct the on publicly funded R&D and on partnerships involving majority of their R&D in their home country. In 2005, government, public-sector research organizations, around 12 percent of business ICT R&D in the OECD industry, and universities for long-term basic scientific was under foreign control, and most international R&D research. ICT firms are often part of regionally concen- relationships were among affiliated companies rather trated clusters or set up labs close to universities to than between domestic and foreign-owned ICT firms benefit from spillovers of public ICT-related R&D.The or laboratories. Moreover, the R&D intensity of affiliates relative importance of access to public research results abroad is generally far lower than R&D intensity in the increases in times of falling company budgets for basic home country.The need for secrecy, the strong network research. effects, the search for spillovers, and the high costs of dispersed R&D centers favor concentrating R&D activ- Globalization of ICT R&D ities in a few places. The internationalization of R&D is not a new phenom- Outside the home country, ICT-related R&D enon, but it is occurring at a much faster pace today. investments are generally within the OECD area, with Moreover, it is spreading more widely—to emerging Japanese and European ICT firms mostly establishing economies as well. In most OECD countries, the share R&D centers in the United States, and US ICT firms of foreign affiliates in industry R&D is growing as for- mainly establishing centers in Europe and increasingly in eign firms acquire local R&D-performing firms (e.g., Asia (see Box 1). Japan and Korea attract comparatively through mergers and acquisitions) or establish new sub- little foreign ICT R&D. sidiaries. Along with the pharmaceutical, biotechnology, More recent data, however, would show the rapid chemical, health, and automotive sectors, the ICT indus- increase in internationalization that has occurred since try has considerable foreign R&D investment. ICT 2005. Globalized business ICT R&D networks now firms and public research organizations have increasingly involve leading firms such as Cisco, HP, IBM, Nokia, internationalized their activities and are establishing Motorola,Toshiba, NEC, Microsoft, and Google, which R&D laboratories in, or links with, foreign locations, are likely to have between five and ten global ICT including in non-OECD countries.The ICT sector thus research centers. A quarter of Samsung’s workforce 7KH *OREDO ,QIRUPDWLRQ 7HFKQRORJ\\ 5HSRUW  ‹  :RUOG (FRQRPLF )RUXP
    122. 1.8: R&D and Innovation in the ICT Sector research activities now complement headquarter research activities. For example, Hewlett Packard’s data Box 1: R&D activities of US affiliates mining in Russia, IBM’s research on speech technolo- gies in India and embedded systems in China, and US-based non-bank multinational enterprises (MNEs) have Intel/Yahoo!’s software or search technologies in Israel more than doubled the value of their overseas R&D activities through their foreign affiliates since the mid-1990s, to all draw on the local talent pool of domestic firms and US$28.3 billion in 2005 or around 15 percent of total R&D research organizations. In addition, ICT firms from expenditures of US MNEs (home and abroad).1 In 2005, emerging markets (e.g., Huawei,Tata) increasingly have seven countries—the United Kingdom, Germany, Canada, their own globalized innovation networks. France, Japan, and, more recently, Singapore and China— accounted for two-thirds of total R&D performed by US for- Collaborative R&D and “open innovation” on an eign affiliates. The share of R&D in computers and electronic international scale products is about 20 percent of total US MNE R&D abroad— The terms collaborative R&D and open innovation are more a share that has fallen slightly—but the share of ICT services and more used to characterize new forms of R&D and has increased to around 5 percent of total overseas R&D. innovation that rely less on traditional in-house R&D and more on collaborating on research and innovation with universities, public laboratories, other firms, and R&D performed abroad by majority-owned foreign other knowledge sources. Major incentives include cost affiliates of US parent companies, 2002 and 2005 and risk reduction (especially for pre-competitive R&D) (current US$ millions) and possibilities of entering new markets with jointly Industry/sector 2002 2005 developed technologies.16 Such collaboration is increas- All industries 21,063 28,316 ingly international and spans across various ICT sectors Manufacturing 18,736 24,036 and adjacent industries (e.g., biotechnology). Computers and electronic products 4,975 5,376 Externally organized R&D activities of the ICT Non-manufacturing business sector have mainly taken the following forms: Information services and data processing services 24 657 Computer systems design and related services 447 n/a 104 • partnerships, framework agreements, or R&D Source: National Science Board, 2008; Bureau of Economic Analysis, 2007. contracts with universities, R&D laboratories, and Note: Data for Computer systems design and related services for 2005 research institutes, often with a focus on longer- are suppressed for reasons of confidentiality. 1. BEA 2007, Table 3.6. term R&D (including the creation of joint laboratories or high-technology zones by ICT firms on university campuses);17 • the involvement of PhD and postdoctoral researchers in the work of company R&D labs; (36,000 employees) is involved in R&D with facilities in • R&D partnerships, industrial technology alliances, Korea, India, China, Russia, the United States, and and consortia of ICT firms (some focused on Japan. Global innovation networks also increasingly upstream research and some on product co- involve smaller firms.14 development); and The internationalization of ICT R&D more and more entails establishing ICT R&D centers in emerging • prospecting for new ideas from individuals and economies.The sector is one of the first to have trans- startups with promising research (including through formed these into fully fledged elements of globalized venture capital, incubation and acquisitions, and research networks. Despite internationalization, R&D new participative web strategies). activities remain tightly clustered, as in previous national examples.15 Only a few non-OECD locations are These trends have strengthened with the greater increasingly involved on a larger scale: China (Shanghai internationalization of collaboration and the development and Beijing), Israel (Haifa), India (Bangalore and Delhi), of global innovation networks. ICT R&D has become Russia (Moscow and St. Petersburg), and, to a lesser more modular and increasingly takes place outside the extent, cities in Chinese Taipei, Malaysia, and Singapore. OECD region.The internationalization of R&D in Affiliates under foreign control continue to devote general is also driven by the growing use of ICT as the a smaller share of turnover to R&D than do national basic international science and technology infrastructure firms. However, in contrast to a few years ago when for- (e.g., broadband research networks), by programs that eign R&D, particularly in developing countries, mainly encourage international research collaboration (e.g., the reflected an investment requirement or the mere need EU’s Seventh Framework Programme (FP7) focuses on to adapt product for the local market, some foreign cooperation with entities from Asian countries) and by 7KH *OREDO ,QIRUPDWLRQ 7HFKQRORJ\\ 5HSRUW  ‹  :RUOG (FRQRPLF )RUXP
    123. 1.8: R&D and Innovation in the ICT Sector specialized organizations (e.g., the International Techno- Finally, a growing number of research partnerships logy Roadmap for Semiconductors). Long-standing public have formed around open standards or common tech- research organizations (Fraunhofer ICT institutes in nology platforms.The Open Handset Alliance (formerly Germany, Battelle in the United States,VTT in Finland, Google Android) engages in developing an open source or TNO in the Netherlands) also increasingly form global mobile platform: its over 30 members include Google, research alliances or public-corporate R&D consortia. Broadcom, Intel, China Mobile, KDDI, and Samsung. At the firm level, Asia is becoming the target for Further examples of joint handset development platforms new collaboration, both within Asia (e.g., co-development include the LiMo Foundation (whose founding members of optical storage media by Samsung and Toshiba) and are Motorola, NEC, NTT DoCoMo, Orange, Panasonic, between OECD ICT firms and Asian partners. Chinese Samsung, and Vodafone) and the joint venture Symbian, and Indian firms in particular have become strategic which was taken over by Nokia in December 2008 to research partners for OECD ICT firms (e.g., Siemens develop it as a nonprofit organization with many part- and China’s Huawei; Ericsson and China’s Datang ners in bases in Europe, Korea, Japan, the United States, Telecom on alternative 3G network protocols; Agilent China, and India. Open source software development and China’s Chengdu Qianfeng on communication test and the rising co-development of application interfaces equipment; Microsoft and India’s Infosys on enterprise and services are also leading to collaboration and exter- resource planning software;Yahoo! and India’s Tata on nally focused ICT R&D.The Eclipse Foundation is an cloud computing). OECD ICT firms also collaborate open source platform supported by IBM that creates with Asian universities (e.g., Philips with China’s Zhejiang development environments—for example, for enterprise University, US Xybernaut with Beijing University of software.Yahoo! partners with the Apache Software Aeronautics for software solutions). A few alliances are Foundation on the development of Hadoop, an open also forming between Indian and Chinese ICT firms source project for distributed computing and data- (mainly in the area of software and ICT services) and intensive applications that is being used for commercial between Russian and Chinese ICT firms (e.g., Russia’s purposes by Amazon Web Services, as well as for research Sitronics and ZTE for global navigation satellite systems). into distributed computing by Yahoo! in collaboration Besides the new collaboration with Asia at the firm with Computational Research Laboratories (India), 105 level, R&D partnerships and alliances have encompassed IBM, and Google. different ICT subsectors, often with links to universities. In sum, ICT companies increasingly use in-house Semiconductors and microelectronics pioneered such R&D and their knowledge base (including their intel- collaboration in the ICT sector in the 1970s. Recent lectual property portfolios) to build more and more examples include (1) the Reliable Adaptive Distributed complex global innovation networks, to shape global Systems Laboratory (RAD Lab) at the University of standards, to develop platform strategies, and to access globalizing markets for knowledge workers.18 Berkeley, which is supported by Google, Sun Microsystems, Microsoft, Siemens, Oracle, Cisco and According to Innovation Surveys, the ICT sector is others; (2) RESERVOIR, a research initiative led by one of the most collaborative sectors after the energy and chemical industries.19 Among innovative ICT firms IBM in the field of cloud computing, with support from the EU FP7, involving ICT firms from the United States in four EU countries, about 34 percent engage in some (e.g., Sun Microsystems), the European Union (e.g., type of collaboration for innovation (versus 24 percent SAP,Telefonica), and European universities; (3) Microsoft’s of all firms), and 13 percent of ICT firms cooperate and Intel’s joint funding of academic research into soft- with universities and public research organizations (ver- ware development for parallel computing, business intel- sus 8.5 percent of all firms). ligence, and radio-frequency identification (RFID); and In spite of these examples, there are few comparable (4) the joint laboratory for large-scale computer network data on expenditures or on the impact of R&D collabo- research formed by the Chinese companies Baidu and ration and alliances. Some of the available data suggest Huawei. Collaboration between ICT firms on horizontal that ICT firms and institutions have a large array of topics such as the environment is also more and more cooperative activities, particularly of an exploratory common (e.g., the StEP initiative for e-waste). nature, but that the competitive dynamics of the industry ICT R&D is also becoming more interdisciplinary, mean that most development and innovation close to with more research involving nanotechnology, biotech- market is still often tightly held within firms.The organ- nology, and ICT firms. Such collaboration has not been ization of joint R&D projects continues to raise poten- widely publicized (e.g., Sun Microsystems and SimBioSys tial difficulties relating to the sharing of research results for pharmaceuticals; the BioIT Alliance, co-founded and the protection of strategic company information. by Microsoft, HP, Sun Microsystems, and pharmaceutical Internationalization of ICT-related patents and biotechnology companies; Google’s investment in 23andMe, a company providing personalized genome The number of ICT-related patents grew significantly analysis). from the mid 1990s to 2005, when some 50,500 inter- national ICT-related patent applications were filed under 7KH *OREDO ,QIRUPDWLRQ 7HFKQRORJ\\ 5HSRUW  ‹  :RUOG (FRQRPLF )RUXP
    124. 1.8: R&D and Innovation in the ICT Sector Figure 8: ICT-related patents filed under the PCT, by country, 1994–2005 ■ 1995 ■ 2000 ■ 2005 20,000 15,000 Number of patents 10,000 5,000 0 Israel United Kingdom France China Korea, Rep. BRIICS Germany Japan EU27 United States Source: OECD, Patent database, June 2008. Note: BRIICS stands for Brazil, Russia, India, Indonesia, China, and South Africa, all of which are OECD accession or enhanced engagement countries. 106 the Patent Co-operation Treaty (PCT) with an average percent of all ICT-related patents), Japan (18 percent), increase of 16 percent a year (CAGR) over 1995–2005.20 and Germany (8 percent) lead in ICT-related patenting From 2000 to 2004, ICT was the third fastest growing under the PCT and together make up well over half of technical field among PCT international applications ICT patent filings. Korea stands sixth, just before China, (an increase of 28 percent), behind medical (up 32.2 which is ahead of many other OECD economies. percent) and audiovisual technology (up 28.3 percent). Patent data also reveal that ICT patents are more The United States, Europe, and Japan continue to internationalized than patents of other sectors: 17.5 per- lead in terms of total PCT applications (Figure 8).The cent of all ICT patents granted between 2001 and 2003 involve cross-border ownership.21 Non-OECD coun- number of ICT-related patents grew considerably in Korea and in China, with 2,308 and 2,099 international tries such as China, India, Brazil, and Russia still show a patents, respectively, in 2005; Chinese ICT patents more high level of foreign ownership in ICT-related patents. than doubled between 2004 and 2005. Resident ICT Patent data also confirm the growing role of non-ICT patent filings in the home country have grown particu- industries in ICT R&D and innovation. In Europe, for larly significantly in Korea and China.The main drivers example, the automotive sector accounted for 4 percent of total software patents.22 are Samsung (Korea), LG Electronics (Korea), Huawei (China), Electronics and Telecommunications Research Clustering on international level is also evident Institute (Korea), ZTE (China), and NHN (Korea). when looking at patent data.Table 3 shows the regional ICT-related patents represent on average 35 percent clusters with the greatest intensity of ICT patenting. of total PCT filings, and the share of ICT patents has Next to other regions in the OECD, Japan, the United been rising in almost all countries since the late 1990s States, and Korea take up the first spots. China and Israel (Figure 9).The shares are higher in some countries are now also represented in this ranking. owing to the focus on ICT inventions in Finland (59 ICT firms occupy the top positions with respect to percent of all national PCT filings), Singapore (56 per- patents granted or applications for patents. Patent grants cent), the Netherlands (48 percent), Korea (44 percent), result from applications a few years earlier and are more and Japan (41 percent).The proportion of ICT patents a retrospective than prospective indicator. As shown in in total Chinese filings tripled in a decade, from 17.3 Table 4, 18 ICT firms are among the first 20 firms with percent in 1996–98 to 50.3 percent in 2002–05. India, patents granted by the United States Patent and Russia, South Africa, Brazil, Chile, and other OECD- Trademark Office (USPTO). enhanced engagement or accession countries are lower, with Israel as the exception.The United States (35 7KH *OREDO ,QIRUPDWLRQ 7HFKQRORJ\\ 5HSRUW  ‹  :RUOG (FRQRPLF )RUXP
    125. 1.8: R&D and Innovation in the ICT Sector Figure 9: Revealed technology advantage of countries in ICT, 2003–05 Finland Singapore China Netherlands Korea, Rep. Japan Israel Ireland Chinese Taipei Canada United States Sweden United Kingdom France EU27 Australia Russian Federation Norway Austria Germany Hungary Denmark Switzerland New Zealand Poland Belgium South Africa Italy Spain India Czech Republic Brazil Slovenia 107 Mexico Turkey 0 10 20 30 40 50 60 Percent Source: OECD, Patent and REGPAT Databases, June 2008; EPO Worldwide Statistical Patent Database, October 2007. Note: Patent counts are based on the priority date and the inventor’s country of residence, and use fractional counts on PCT filings at international phase (European Patent Office, or EPO, designations). The figure shows the share of ICT in the country’s patents relative to the share of ICT in total patents, by country. Only countries/economies with more than 250 patents over the period are included in the graph. Table 3: Top 15 regions in ICT-related patents, 2003–05 Share (%) Region1 Country ICT patents of total Tokyo Japan 9,382 6.8 San Jose–San Francisco–Oakland United States 8,576 6.2 New York-Newark-Bridgeport United States 4,420 3.2 Capital region (Seoul–Incheon–Gyeonggi-do) Korea, Rep. 4,412 3.2 Noord-Brabant Netherlands 3,801 2.8 Boston–Worcester–Manchester United States 3,579 2.6 Kanagawa Japan 3,390 2.5 San Diego–Carlsbad–San Marcos United States 2,788 2.0 Osaka Japan 2,701 2.0 Los Angeles–Long Beach–Riverside United States 2,687 2.0 Île de France France 2,424 1.8 Oberbayern Germany 2,295 1.7 Shenzhen–Guangdong China 2,033 1.5 Seattle–Tacoma–Olympia United States 1,998 1.5 Israel Israel 1,974 1.4 Source: OECD, Patent and REGPAT Databases, June 2008 (see also OECD, 2008f); EPO Worldwide Statistical Patent Database, October 2007. Note: Patent counts are based on the priority date and the inventor’s country/region of residence, and they use fractional counts of PCT filings at international phase (EPO designations). 1. The regional breakdown is presented at EU’s Nomenclature of Units for Territorial Statistics (NUTS) level 2, except for Japan (NUTS 3), the United Kingdom (NUTS 1), and the United States (TL 3). In this breakdown, smaller countries such as Denmark and Israel are treated as regions. 7KH *OREDO ,QIRUPDWLRQ 7HFKQRORJ\\ 5HSRUW  ‹  :RUOG (FRQRPLF )RUXP
    126. 1.8: R&D and Innovation in the ICT Sector Table 4: ICT firms among the top 20 patenting firms, 2007 nologies to market; interest in licensing technologies, including by firms specializing in patenting; the desire to Number ward off patent disputes; and the building of a domestic Rank Firm Country of patents technology base to avoid paying royalties. 1 IBM United States 3,125 The ICT sector has also played a leading role in 2 Samsung Korea, Rep. 2,723 3 Canon Inc Japan 1,983 post-R&D alliances, product innovation, and other 4 Matsushita Electric Industrial Japan 1,910 innovation related to intellectual property. ICT firms 5 Intel United States 1,864 have long been, and are increasingly, engaged in strategies 6 Microsoft United States 1,637 involving, for example, technology cross-licensing 7 Toshiba Japan 1,519 (including to competitors), the creation of patent pools 8 Micron Technology United States 1,476 (e.g., the MPEG-2 patent pool), patent clearinghouses, 9 Hewlett Packard United States 1,466 10 Sony Japan 1,454 and the granting of patents to wide communities of 11 Hitachi Japan 1,381 users (e.g., IBM).These commercial exchanges of 12 Fujitsu Japan 1,293 intellectual property allow for combining patented tech- 13 Seiko Epson Japan 1,205 nologies from various sources into new products, for 15 Infineon Tech AG Germany 847 potentially avoiding patent disputes, and for facilitating 17 Texas Instruments United States 749 18 Ricoh Japan 727 product innovation at lower costs. 19 Siemens Germany 698 However, the overall impact of increased patenting 20 LG Electronics Korea, Rep. 682 and of new intellectual property alliances on innovation Source: USPTO, 2008. and the patent system remains unclear. Patent data need Note: The USPTO does not publish patent applications but patents granted. to be complemented by research that seeks to establish Figures show the total number of patents granted to these firms, in all industries, and not only ICT-related patents better patent quality indicators and links with the measurement of innovation. Conclusion The majority of the top 20 patent applicants in The ICT industry leads in R&D expenditures, employ- 108 Europe, Japan, and under the PCT are ICT firms: 13 ment, and patents; the software and semiconductor out of 20 in Europe, 14 out of 20 in Japan, and 16 out sectors are particularly R&D-intensive.The share of of 20 under the PCT.23 No ICT firm from outside the ICT R&D conducted in non-ICT industries is also OECD region or from OECD accession/enhanced high (about one-quarter of total ICT R&D), and in engagement countries is in the top 20 firms granted some non-ICT sectors, ICT R&D spending (especially patents in the United States or among the top 20 appli- software-related) accounts for a large share of total cants at the European Patent Office (EPO) or the Japan R&D.The United States and Japan still have a large Patent Office (JPO).The picture is different for applica- lead in terms of ICT firms’ R&D expenditures and of tions under the PCT.Whereas Huawei occupies slot ICT firms that spend the most. Korea has caught up number 93 at the EPO (1,365 applications in 2007, impressively in this area. Although some other OECD according to Eurostat 2007), it is in fourth position for and non-OECD countries also have relatively high levels PCT patent applications. of ICT R&D spending, ICT R&D expenditures from Patent applications rose by 41 percent from 2006 to non-OECD ICT firms (especially from China and India, 2007 at the Chinese patent office (SIPO), owing in but also other emerging economies) are still compara- large part to ICT applications (mainly for communica- tively low. However, new ICT firms from non-OECD tions equipment). Huawei, with 1,544 applications, countries are emerging rapidly, are increasingly R&D- ranked first in 2007. Four out of ten patent applications intensive, and are rapidly forging new partnerships with came from foreign entities, with firms from Chinese OECD ICT firms and research organizations. Taipei among the top ten applicants. Samsung was the The organization of R&D in the ICT sector con- leader in foreign patent applications in China. Matsushita tinues to evolve, in particular around new kinds of col- Electric Industrial, Philips, and IBM were also among laboration involving emerging ICT subsectors or com- the leaders. mon standards and technology platforms.The sector’s Strong growth in ICT sector patenting is first and research activities are increasingly international, although foremost a result of high R&D expenditures and the ICT firms commonly form global R&D networks with innovative nature of the ICT sector. It also reflects the a limited number of R&D centers located in only a few trend toward more patenting, new ICT subsectors, locations. Moreover, the reliance on long-term ICT- patenting by non-OECD ICT firms, and the rise of related public R&D and public-private collaboration new forms of patenting—for example, of software or continues to be important for the ICT sector.There has business methods in certain OECD countries. been a striking growth in the number of ICT patents Additional drivers are strategies to take out multitudes from the OECD region (in particular from Korea) but of patents (so-called patent thickets) or to bring tech- 7KH *OREDO ,QIRUPDWLRQ 7HFKQRORJ\\ 5HSRUW  ‹  :RUOG (FRQRPLF )RUXP
    127. 1.8: R&D and Innovation in the ICT Sector also from non-OECD ICT firms (e.g., some Chinese References firms).The impacts of this patent increase—that is, BEA (Bureau of Economic Analysis). 2007. “Operations of U.S. Multinational Companies in 2005,” by R. Mataloni. Survey of whether this increase spurs or deters innovation—merit Current Business. US Department of Commerce. Available at more study. http://www.bea.gov/scb/pdf/2007/11%20November/1107_ mnc.pdf. Dedrick, J. and K. L. Kramer. 2008. “Globalization of Innovation: The Personal Computing Industry.” 2008 Industry Studies Conference Notes Paper. Available at http://ssrn.com/abstract=1125025. 1 OECD work on ICT R&D and innovation is conducted in the Ernst, D. 2008. “The New Geography of Innovation and U.S. recently published OECD Information Technology Outlook 2008 Comparative Competitiveness.” Presentation at the 83rd Western and in the context of the OECD Innovation Strategy Economic Association International Conference, Honolulu, July 2. (www.oecd.org/innovation/strategy). The topics of globalization of R&D activities and open innovation are elaborated in more detail Freeman, C. and L. Soete. 2007. “Developing Science, Technology and in OECD 2008a, b, c, and d. The OECD develops the guidelines Innovation Indicators: What We Can Learn from the Past.” for international measurement of R&D, innovation, and patents. Maastricht Economic and Social Research and Training Centre on See OECD 2002, 2006, 2008e. Innovation and Technology, UNU-MERIT Working Paper No. 2007-001. Available at www.merit.unu.edu/publications/wppdf/ 2 OECD 2008a. 2007/wp2007-001.pdf. 3 The BRICS countries are Brazil, Russia, India, China, and South Hall, B. H., G. Thoma, and S. Torrisi. 2006. “The Market Value of Africa. Patents and R&D: Evidence from European Firms.” NBER 4 The OECD 21 countries are Austria, Australia, Belgium, Canada, Working Paper No. 13426. Cambridge, MA: National Bureau of the Czech Republic, Denmark, Finland, France, Germany, Greece, Economic Research. Ireland, Italy, Japan, Korea, the Netherlands, Norway, Poland, Japanese Statistics Bureau. Various years. “Report on the Survey of Portugal, Spain, the United Kingdom, and the United States. Research and Development.” Ministry of Internal Affairs and 5 The EU15 countries are Austria, Belgium, Denmark, Finland, Communications. France, Germany, Greece, Ireland, Italy, Luxembourg, Jaruzelski, B. and K. Dehoff. 2007. “The Customer Connection: The Netherlands, Portugal, Spain, Sweden, and the United Kingdom. Global Innovation 1000.” Strategy+Business 49. Booz Allen 6 See also Jaruzelski and Dehoff 2007. Hamilton. Available at http://www.strategy-business.com/ resiliencereport/resilience/rr00053 7 In compliance with the policies of the authors’ institution, this chapter exceptionally employs OECD’s terminology for Taiwan, National Science Board. 2008. Science and Engineering Indicators 2008. China. Arlington, VA: National Science Foundation. 8 In May 2007, OECD countries agreed to invite Chile, Estonia, OECD (Organisation for Economic Co-operation and Development). 109 Israel, Russia, and Slovenia to open discussions for membership 2002. Frascati Manual. Proposed Standard Practice for Surveys on in the Organisation and offered enhanced engagement, with a Research and Experimental Development. Paris: Directorate for view to possible membership, to Brazil, China, India, Indonesia, Science, Technology and Industry, OECD. and South Africa. The approval of “road maps” in December 2008 ———. 2006. OECD Information Technology Outlook 2006. Paris: marks the start of accession talks with Chile, Estonia, Israel, OECD. Available at www.oecd.org/sti/ito. Russia, and Slovenia. See http://www.oecd.org/document/33/ 0,3343,en_2649_34487_38603809_1_1_1_1,00.html. ———. 2007. Compendium of Patent Statistics 2007. Paris: Directorate for Science, Technology and Industry, OECD. Available at 9 OECD 2009. www.oecd.org/sti/ipr-statistics. 10 See OECD 2006. ———. 2008a. OECD Science, Technology and Industry Outlook 2008. 11 Not considered is ICT research that leads to non-ICT products that Paris: Directorate for Science, Technology and Industry, OECD. can also be identified in product-field data. Available at www.oecd.org/sti/outlook. 12 OECD 2008a. ———. 2008b. “Open Innovation in Global Networks.” Paris: Directorate for Science, Technology and Industry, OECD. 13 Wunsch-Vincent 2000; OECD 2008a, 2008c. ———. 2008c. “The Internationalisation of Business R&D: Evidence, 14 Ernst 2008. Impacts and Implications.” Paris: Directorate for Science, Technology and Industry, OECD. 15 In the United States, for example, 70 percent of the R&D per- formed by all domestic and foreign computer and electronic firms ———. 2008d. OECD Information Technology Outlook 2008. Paris: in 2005 took place in four locations: Cambridge and Route 128 in Directorate for Science, Technology and Industry, OECD. Available Massachusetts; the Silicon Hills of Austin, Texas; Champaign at www.oecd.org/sti/ito. County in Illinois; and Silicon Valley in California. ———. 2008e. OECD Patent Manual 2008. Paris: Directorate for 16 Freeman and Soete 2007. Science, Technology and Industry, OECD. 17 Examples of partnerships with universities include Oracle and the ———. 2008f. OECD Compendium of Patent Statistics 2008. Paris: European Organisation for Nuclear Research (CERN) for grid- Directorate for Science, Technology and Industry, OECD. computing technologies; Microsoft, Nokia, Hitachi, and Toshiba with research centers at the University of Cambridge; and Fujitsu ———. 2009, forthcoming. OECD Communications Outlook 2009. with the Universities of Tokyo and Cambridge on quantum Paris: Directorate for Science, Technology and Industry, OECD. technologies. OECD and Eurostat. 2005. Oslo Manual: Guidelines for Collecting and 18 Ernst 2008; Dedrick and Kraemer 2008. Interpreting Innovation Data. A joint publication of OECD and Eurostat, 3rd edition. Paris: OECD. 19 OECD, based on the Fourth European Community Innovation Survey (CIS4). United States Patent and Trademark Office (USPTO). 2008. “Report on Patenting by Organizations 2007.” Available at www.uspto.gov/ 20 See OECD 2008c. web/offices/ac/ido/oeip/taf/topo_07.htm. 21 OECD 2008c. Wunsch-Vincent, S. 2000. “Should Policy-Makers Attract Foreign R&D? Understanding and Reacting to Industrial R&D Globalisation.” 22 Hall et al. 2006. Thesis. Maastricht Economic Research Institute on Innovation and 23 See OECD 2008e for methodology. Technology (MERIT). July 2000. 7KH *OREDO ,QIRUPDWLRQ 7HFKQRORJ\\ 5HSRUW  ‹  :RUOG (FRQRPLF )RUXP
    128. 7KH *OREDO ,QIRUPDWLRQ 7HFKQRORJ\\ 5HSRUW  ‹  :RUOG (FRQRPLF )RUXP
    129. Part 2 ICT as a Bridge to Increased Growth and Competitiveness: Selected Case Studies 7KH *OREDO ,QIRUPDWLRQ 7HFKQRORJ\\ 5HSRUW  ‹  :RUOG (FRQRPLF )RUXP
    130. 7KH *OREDO ,QIRUPDWLRQ 7HFKQRORJ\\ 5HSRUW  ‹  :RUOG (FRQRPLF )RUXP
    131. 2.1: How Outsourcing Can Help Mobilize Talents Globally CHAPTER 2.1 Egypt’s strategy is based on the development of out- sourcing capability with the objective of competing How Outsourcing Can Help efficiently worldwide and maximizing the revenues generated by the investments in this industry. Mobilize Talents Globally: —Dr. Tarek Kamel, Minister of Communications and Information Technology, Egypt Egypt’s Success Story Under the current wave of globalization, a variety of NAGWA EL SHENAWI, Ministry of Communications and new forms of international trade has emerged, accompa- Information Technology (MCIT), Egypt nied by profound changes in the ways in which talents can be mobilized and combined across national borders. BRUNO LANVIN, INSEAD, eLab Outsourcing has become one major component of this new landscape, and Egypt one of its champions. The outsourcing market continues to grow.With some estimates placing the value of the total worldwide outsourcing market, including information technology outsourcing (ITO) and business process outsourcing (BPO), at almost US$300 billion at the end of 2007— an increase of about 19 percent over the previous year— service providers and their enterprise customers are seeking new regions where low-cost, high-quality work can be done. From the point of view of emerging economies, outsourcing represents an innovative way of benefitting from globalization while offering international businesses new ways of mobilizing talents worldwide, and at the 113 best price. Over the last 20 years or so, countries such as India, China, and other Asian economies have significant- ly benefited from the outsourcing wave. Progressively, several middle-income countries in Europe (Hungary and Poland, for example), Latin America (Mexico and Brazil, for instance) and the Middle East (Egypt, the United Arab Emirates, and Jordan, in particular) also became outsourcing hubs. The evidence shows that outsourcing has entered a new phase, whereby emerging countries are no longer just offering lower-cost labor to accomplish unsophisti- cated tasks (the “airline stubs” syndrome). Instead, through outsourcing, they can create jobs of growing quality and sophistication, with significant positive spillovers on their respective national processes of economic growth, technological development, and skills upgrading. In this new context, the experience of Egypt is remarkable. Many observers see this 80 million person economy as the emerging gateway for outsourcing in the Middle East.This emergence, however, did not hap- pen by chance.1 The purpose of this chapter is to show This chapter benefitted from valuable input from Maie Ashraf, Manager of Studies Unit, Information Center, Egyptian Ministry of Communications and Information Technology (MCIT); Eman El Shewy, Economic Analyst at the Economic Analysis Section, Information Center, MCIT; Heba Youssef, Manager of the Economic Analysis Unit, Information Center, MCIT; Martin Shehzad Kralik, Director, INSEAD eLab in Abu Dhabi; Amin Kaireldin, Advisor and Board Member of Egypt’s Information Technology Industry Development Agency (ITIDA); and Mohamed Abusedera, Project Manager, ITIDA. 7KH *OREDO ,QIRUPDWLRQ 7HFKQRORJ\\ 5HSRUW  ‹  :RUOG (FRQRPLF )RUXP
    132. 2.1: How Outsourcing Can Help Mobilize Talents Globally how Egypt’s success in the area of outsourcing has been A closer look at the ingredients of Egypt’s current outsourcing strategy and initiatives the result of a carefully built strategy to create the prop- A more detailed analysis of Egypt’s strategy vis-à-vis the er environment for business and generate the required BPO market offers important lessons with regard to spirit of mutual trust and partnership. how a country can become a regional leader in out- sourcing while maximizing the resulting benefits within Building a network of trust and partnership with global its own national economy. Among the key components business of this strategy, Egypt’s national vision and framework Egypt’s road to success in outsourcing started with a and its national strategy deserve particular attention, as limited number of small steps. One pioneering experi- well as some of the key initiatives they allowed and ence was developed with IBM.The company started its supported. presence in Egypt with a small application development center, which was an early precursor of outsourcing. It National vision and framework picked up momentum in the late 1990s, when the IT The Egyptian national vision is mainly focused on outsourcing pace began to speed up.The first project attracting more FDI, especially in BPO activities, in undertaken by IBM in Egypt was to “Arabize” some IT view of its positive spillover on employment rates.This projects; this was followed by software development is carried out through a comprehensive framework that projects. aims to attract more MNCs that are interested in BPO, By the end of the 1980s, the Information Decision encouraging technology and know-how transfer and Support Centre (IDSC) of the Egyptian Cabinet was building qualified human capital that would meet inter- established with the aim of introducing information national standards while being cost-competitive. communication technologies (ICT) within the Egyptian government and leveraging it for the country’s socioe- National strategy conomic development. Later on (by the end of the The national strategy established for the development 1990s), President Mubarak announced the launching of of the BPO market in Egypt is defined by the ITIDA’s a national program for ICT in Egypt along with the strategy grid, which includes the following pillars: establishment of a new Ministry of Communications 114 and Information Technology (MCIT) headed by Dr • Ensure that all requirements (human resources, Ahmed Nazif, who later became Egypt’s Prime Minister. infrastructure, legislative matters, etc.) are ready and In 2004, the Egyptian government, represented by the available.This was a prerequisite for promoting MCIT, realized the importance of establishing by law a Egypt as a BPO destination. specialized entity, the Information Technology Industry Development Agency (ITIDA),2 which would shoulder • Enhance the volume and quality of the local talent the major role of developing Egypt’s IT industry pool, particularly through the training of 4,500 through the implementation of special programs tailored university students (this is expected to scale up to to attract foreign direct investment (FDI) to Egypt.The 40,000 students within three years) with a view of targets were private investors, private companies, and enhancing their skills in order to make them able multinational corporations (MNCs), with a particular to contribute to the BPO segment. focus on BPO activities.This renewed focus on BPO, call centers, and technical support centers was very suc- • Promote Egypt as a BPO destination using the cessful: from 2004 to 2008, the total volume of Egypt’s services of a world-class public relations company. offshore industry grew from US$100–150 million to US$700 million. • Offer ready-made incentive packages tailored to In recent years, seizing a larger share of the global suit all investors in accordance with the numbers outsourcing market has become a priority objective for of positions to be deployed in Egypt, training and the Egyptian government. Several key measures have telecommunications costs, and so on. been implemented to achieve this goal, with immediate results: in 2007, Egypt was ranked 13th as an outsourc- • Encourage local companies to cooperate with ing destination, according to the A.T. Kearney Global foreign investors. Services Location Index.3 This puts Egypt ahead of delivery locations in Eastern Europe such as the Czech • Provide single-window clearance, thanks to full Republic, Hungary, and Poland, as well as other African cooperation from relevant governmental agencies locations such as South Africa and Tunisia. and authorities. 7KH *OREDO ,QIRUPDWLRQ 7HFKQRORJ\\ 5HSRUW  ‹  :RUOG (FRQRPLF )RUXP
    133. 2.1: How Outsourcing Can Help Mobilize Talents Globally life cycle. It also aims at offering training on data Key initiatives collection and analysis, strategic planning, and busi- Egypt has been undertaking many initiatives with the ness models.The SECC, in partnership with the objective of creating an attractive and conducive busi- Customer Operations Performance Center (COPC), ness environment for multinational organizations.The is also involved in providing technical and financial government announced the development of a new support to Egypt’s contact center industry to help it delivery business hub, called Maadi Investment Park, compete at the world level. which is specifically aimed at attracting BPO compa- nies.This hub will be centrally located in Cairo and eas- • Developing basic BPO skills: A pilot university ily accessible by public transportation. Moreover, a UK- project has been launched to train 5,000 students based company (SpinVox) has signed a deal to establish a on basic BPO skills.This course is being offered to business center in Alexandria, while several other lead- final year students in Cairo University, Ain Shams ing MNCs are also actively considering Alexandria as a University, and Alexandria University. MCIT has business hub. roped in the leading BPO partners, such as IBM, MCIT also took a number of initiatives focusing Infosys, and Firstsource, to be the content develop- on the development of the necessary high-quality ers and to train the trainers and delivery partners in human capital needed to drive forward the IT and BPO this important talent-enablement program.The aspi- industries: ration of MCIT is to scale this program to 20,000 students in the next two to three years and, in par- • Talent building: The National Telecom Institute allel, launch a finishing school program also scaling (NTI), the Information Technology Institute (ITI), up to 20,000 students by 2011–12. and the E-Learning Competence Center (e-LCC) are providing specialized ICT training programs. • Adding partnerships: One of the initiatives An internationally competitive IT industry requires hosted by ITIDA is implemented by McKinsey & a strong pool of local talents. Over the next four Company. Known as the Talent Pool Initiative, or years, MCIT will focus on the enhancement of “Edu-Egypt,” its main goal is to enhance the supply specialized technical skills as well as on programs 115 of talent pool within universities and train 4,500 that provide participants with additional soft and students in the next academic semester. It is expect- business skills. MCIT will also transform the basic ed to scale up to 40,000 students within the next ICT literacy programs into certification programs three years.This will work for both the outsourcing and will provide academic programs to develop and the captive industry in BPO service lines.This managerial and business skills for practitioners in program is being designed and customized for the ICT sector. Egypt by Indian BPO service providers (IBM Daksh, Infosys BPO, and Firstsource) and will cover • Developing research: MCIT championed the English language and voice training (including establishment of the Nile University, a high-tech, grammar, accent, mother tongue influence neutral- nonprofit research and development institution ization, comprehension, and writing), soft skills and specialized in engineering technology and business presentation skills, customer servicing, culture sensi- administration.The university’s Executive tivity, analytical and reasoning skills, and basic personal Development Program, designed in collaboration computer and data skills. with the Egyptian Foundation for Technology Education Development (EFTED), offers general management training courses for middle- to senior- level managers working in both private- and pub- Sources of Egypt’s advantage and success in BPO lic-sector companies in the Middle East region. The following ingredients deserve particular attention in the context of Egypt’s goal to be among the top five • Providing strategic training: The Software BPO destinations within the next 10 years: attractive Engineering Competence Center (SECC) is pro- costs, a competitive pool of human resources, a stable viding Capability Maturity Model (CMM) and macroeconomic environment, strategic geographical Capability Maturity Model Integrated (CMMI) locations, government support, telecommunications services to local software companies, offering tech- infrastructure, and an improved business environment. nical and financial support to help them achieve level 2 and 3 CMMI accreditation. Project staff Attractive cost of operation members provide consulting advice, training, pre- Egypt’s cost competitiveness is not only sustainable appraisal, and formal appraisal services.The project’s but also expected to improve.This is primarily due to goal is to train software engineers on software stan- the low cost of human resources, telecommunications, dards application as part of the system development and infrastructure (see Figure 1). It is possible to hire 7KH *OREDO ,QIRUPDWLRQ 7HFKQRORJ\\ 5HSRUW  ‹  :RUOG (FRQRPLF )RUXP
    134. 2.1: How Outsourcing Can Help Mobilize Talents Globally Figure 1: Egypt’s cost advantage in ICT 1a: Real estate cost 1b: Electricity cost (commercial) Annual US$ per square mile, 2007 US$ per kWh, 2007 0.10 239 0.09 220 0.08 184 180 0.07 120 0.03 India Bulgaria Morocco Philippines Egypt India Bulgaria Morocco Philippines Egypt Source: McKinsey Global Institute, 2008b. Source: McKinsey Global Institute, 2008b. 116 1c: Internet usage charges 1d: Telecommunications cost Monthly cost of 2-megabit leased line to the United States Total cost of 2-minute outbound call to the United States 0.95 18,500 18,000 VoIP allowed 0.39 for B2B applications 6,000 0.26 3,500 3,500 0.10 0.01 India Bulgaria Morocco Philippines Egypt India Bulgaria Morocco Philippines Egypt Source: McKinsey Global Institute, 2008b. Source: McKinsey Global Institute, 2008b. 7KH *OREDO ,QIRUPDWLRQ 7HFKQRORJ\\ 5HSRUW  ‹  :RUOG (FRQRPLF )RUXP
    135. 2.1: How Outsourcing Can Help Mobilize Talents Globally Figure 2: Egypt’s population 2a: Population 15–39 years old, percent (2007) 2b: Population size, millions (2007) 48 6.0 Jordan Jordan 45 76.9 Egypt Egypt 45 10.3 Tunisia Tunisia 43 32.4 Morocco Morocco 43 75.2 Turkey Turkey 42 1,135.6 India India + 41 85.9 Philippines Philippines 39 21.5 Romania Romania 37 38.5 Poland Poland 36 10.0 Hungary Hungary 35 7.6 Bulgaria Bulgaria 35 4.8 United Arab Emirates United Arab Emirates 30 191.3 Brazil Brazil Source: McKinsey Global Institute 2008b. Source: UNFPA, 2007. 117 high-quality BPO agents in Cairo for US$225 to Leveraging Egypt’s stable macroeconomic environment US$250 per month, whereas for other established and With an average growth rate of 7 to 8 percent a year, a emerging countries—such as the Philippines and India fairly stable currency, and strong financial and credit —the figure is about twice as high. Real estate, electric- markets, Egypt has been an attractive business and ity, and telecommunications costs are also competitive. investment destination over the last decade.This has been reinforced by the government’s policy of allocating A strong focus on human resources a substantial portion of public investment to the devel- Egypt’s large population (close to 80 million) is also opment and improvement of infrastructure, especially young, with an average age of 24 (see Figure 2).This telecommunications. constitutes a strong advantage in a world in which talent Figure 4 shows the evolution of total investment needs to be built (or upgraded) at a rapid pace. Egypt is from 2003 to 2007. rich in talented, skilled workers who are eager to work The Egyptian government has leveraged its advan- and value multilingual abilities. Egypt has also been able tages by offering incentive packages to both local and to build on its familiarity with Western culture and its foreign investors.The government works in partnership long-established international educational institutions with every investor to customize an incentive package (English, French, and German high schools and that caters to the specific investor’s needs. Such packages universities).4 include tax exemptions and reductions for ICT indus- Moreover, around 330,000 students graduate annu- tries, reduced land prices to investors in the ICT sector, ally from universities in Egypt; hence the total number and eased export and import regulations. of multilingual and therefore suitable talent pool willing to work in the BPO industry in Cairo is estimated to be A special focus on offering world-class telecommunications at least 24,000. Combined with its solid base of IT and infrastructure and services technical skills, this provides Egypt with a strong critical Efforts made by Egypt over the last decade have allowed mass of talents available to the global BPO industry (see significant improvements that have benefitted its BPO Figure 3).Together with an advantageous geographical strategy. Currently, Egypt enjoys high-quality network position (Egypt is at the crossroads of Europe, the facilities that are built around a world-class infrastructure, Middle East, and Africa, and is in a favorable time zone including 10 gb/s optical fiber and 2.5 gb/s rings, deliv- for working with Europe-based companies), such ele- ering services over a public switched telephone network ments have helped Egypt to make attractive value (PSTN). Mobile and packet-based networks spread across propositions to the global BPO industry. the country. Internet and telephone penetration have increased significantly as a result (see Figures 5 and 6). 7KH *OREDO ,QIRUPDWLRQ 7HFKQRORJ\\ 5HSRUW  ‹  :RUOG (FRQRPLF )RUXP
    136. 2.1: How Outsourcing Can Help Mobilize Talents Globally Figure 3: Egypt’s talent pool 3a: Annual number of graduating students (thousands) 3b: Total suitable and willing talent pool (number of graduates) ~330 English Commerce 63 ~19,000–20,500 French 2,800–3,000 Education 44 Large commerce, German 1,500–1,700 Arts 43 sciences & tech, and engineering Law 28 talent pool Spanish 700–1,050 Arabic studies 27 Engineering 17 Italian 350–550 Sciences & tech 14 Medicine 8 Total suitable 24,000–27,000 talent pool Other ~86 Source: McKinsey Global Institute, 2008b. Note: The figures above refer to the greater Cairo metropolitan area alone, not the entire country. 118 Figure 4: Total investment evolution, 2003–07 30 28 25 22% 20 21 US$ (billions) 18 15 15 13 10 5 0 2003 2004 2005 2006 2007 Source: McKinsey Global Institute, 2008a. 7KH *OREDO ,QIRUPDWLRQ 7HFKQRORJ\\ 5HSRUW  ‹  :RUOG (FRQRPLF )RUXP
    137. 2.1: How Outsourcing Can Help Mobilize Talents Globally Figure 5: Internet users and penetration ■ Internet users (millions) 15 Internet penetration (percent) 9.17 8.62 12 6.00 9 12.30 5.10 11.65 3.90 6 3.00 8.25 7.15 1.70 5.57 3 1.00 4.37 0.65 2.53 1.52 1.01 0 2000 2001 2002 2003 2004 2005 2006 2007 March 2008 Source: Ministry of Communications and Information Technology, Egypt. 119 Figure 6: Mobile and fixed telephony diffusion rates ■ Mobile 50 ■ Fixed 40 40.62 35.86 30 32.32 Percent 27.86 24.76 20 14.86 14.94 14.94 14.98 15.14 10 0 Oct–Dec 2006 Jan–Mar 2007 Apr–Jun 2007 Jul–Sep 2007 Oct–Dec 2007 Source: Ministry of Communications and Information Technology, Egypt. 7KH *OREDO ,QIRUPDWLRQ 7HFKQRORJ\\ 5HSRUW  ‹  :RUOG (FRQRPLF )RUXP
    138. 2.1: How Outsourcing Can Help Mobilize Talents Globally Special projects have been launched to showcase The attractiveness of Egypt’s business environment the new business capabilities that such infrastructure has been further enhanced by the government’s incentive makes possible. For example, Egypt’s first Contact packages offered to investors, mentioned earlier. Besides Center Park in Maadi should help the country to bene- tax exemptions, land price reductions, and easing of reg- fit from the strategic advantages described earlier.The ulations, these packages include training programs for Smart Village Business Park, located outside Cairo, has professionals in the ICT industry who are intended to attracted a number of global IT players thanks to its be recruited by investors, and the assignment of a gov- state-of-the-art infrastructure. Additional business parks ernment official to facilitate investors’ interaction with are planned in Alexandria, Damietta, and New Cairo. government organizations. Providing a business-friendly environment Egypt’s current and future challenges as a BPO One of the main pillars of the business environment that champion has helped Egypt to attract outsourcing companies is its Thanks to the combination of structural advantages and set of labor laws and regulations. Reforms of the Egyptian government policies described above, Egypt has become labor laws in 2003 created a very powerful, flexible one of the main success stories in the outsourcing scene workforce and removed many of the previous impedi- of the last few years. However, in the current context ments to recruiting staff. Reforms have focused on of financial crisis and modified international economic creating a balance between employees’ and employers’ relations, Egypt has to prepare for unprecedented rights. Specifically, the reforms have addressed areas such challenges to maintain its position as a successful BPO as the employer’s right to fire an employee under relevant destination. conditions.The reforms also regulated the employee’s Current and future challenges include, for example, right to strike peacefully according to a set of controls intellectual property rights and security risks. Moreover, and procedures. Egypt cannot afford to relax its efforts to promote itself Since 2004, the Egyptian government has been as a BPO destination: on the international outsourcing consistently working to increase the attractiveness of scene, compared with pioneers such as China and India, Egypt’s business environment. Hence an antitrust law it is still viewed as a relatively new player.The country 120 and a unified tax law have been promulgated.The latter must also improve access to finance and micro-financing increased the transparency of the Egyptian tax system for small- and medium-size enterprises. and reduced corporate and personal taxes by half (see In terms of human resources, Egypt’s challenges Box 1). include the lack of “middle-level graduates” (i.e., those who have achieved a level somewhere between that of university graduates and technical institute graduates). Such profiles are in high demand among outsourcing Box 1: Egypt’s main reforms companies, especially those offering IT and engineering services.This shortage leads to hiring university graduates Tax reforms (initiated in 2005) to perform less-skilled jobs that, in turn, de-motivates • Highest personal tax rate cut from 32 percent to them and causes both a fast turnover and suboptimal use 20 percent of financial resources and talents. • Corporate tax rate cut from 42 percent to 20 percent Overcoming potential middle management bottle- • Streamlined collection procedures adopted necks is another challenge that needs to be tackled. Egyptian middle managers lack the skills to run different Customs reforms (initiated in 1991) processes and businesses. In that context, the efforts • Tariffs reduced from an average of 14.6 percent to 6.2 percent already deployed by the Egyptian government to encour- • Tariff bands simplified and reduced from 27 to 6 age MNCs in transferring the know-how and the • Streamlined customs procedures adopted managerial skills required will need to be pursued. In the rapid development of its outsourcing activities, Financial sector reforms (initiated in 1991) Egypt has benefitted from the existence of a vibrant and • Banking sector consolidated and restructured abundant fabric of small- and medium-sized enterprises. • Privatization of public banks initiated This is now creating an additional challenge, as many of • Supervisory role of autonomous Central Bank those small players have relied on their own set of norms, strengthened standards, and practices. Now faced with the rigors of • Anti–money laundering regulations brought in line international competition, such standards and practices with international standards instated (2002) need to be harmonized and brought in line with inter- national benchmarks. 7KH *OREDO ,QIRUPDWLRQ 7HFKQRORJ\\ 5HSRUW  ‹  :RUOG (FRQRPLF )RUXP
    139. 2.1: How Outsourcing Can Help Mobilize Talents Globally Conclusions Egypt’s efforts to build itself as a first-class competitor in Box 2: Seven lessons learned from Egypt’s outsourcing experience the area of outsourcing have led to measurable success. They also offer a basis for further efforts and ambitions Among the lessons that other countries may wish to adapt in this area. from Egypt’s success in outsourcing, the following are partic- The way in which Egypt has chosen to pursue this ularly clear: path can be a source of inspiration and reference for other emerging economies. A central characteristic of 1. Investment in the talent pool to enhance suitability is Egypt’s strategy has been to focus on a few “natural” vital to ensure the long-term viability of the country’s strengths (its young population, high level of education, service delivery strategy. Similarly, it is crucial to and the availability of a language-proficient and interna- ensure overall supply in terms of infrastructure and tionally open talent pool), and to combine those with have connectivity at world-class levels and ahead of the demand curve. (1) a series of targeted government measures (especially on the regulatory side) and (2) a selected use of external 2. Creation of a well-funded investment agency with ade- expertise (especially in the early stages of the process). quate regulatory authority is critical. Egypt’s ITIDA is an Moreover, Egypt has put a critical emphasis on the example of how a public-private partnership can work merits of communicating about its outsourcing strategy effectively in this domain. and achievements, be it externally (to attract additional 3. A promotion campaign is essential after making sure outsourcing partners from abroad) or internally (to that all requirements are already in place. It is only pru- encourage more Egyptian private businesses to be dent to launch a marketing campaign for a location only involved). Public-private partnerships have played a cen- when supply in terms of talent pool and infrastructure is tral role in building mutual respect among the various ready. Documented examples of successful outsourcing players involved and in feeding an appetite for further ventures are the best marketers for a location. collaboration (see Box 2). 4. Getting key decision makers, such as ministers, signed In the emerging global knowledge economy, the off and committed to an explicit target is a strong signal relative mobility of factors is changing as rapidly as their of overall commitment and is viewed very positively by 121 relative prices. In such a maelstrom of changes, out- investors. sourcing—and BPO in particular—is assuming different forms, directions, and volumes.Whether the current 5. There is a clear need to focus on fair, transparent poli- crisis leads companies to focus on cost reductions or cies and international regulatory laws such as employ- on new strategies to conquer markets, BPO is bound ment laws, data security, and intellectual property laws. to attract increasing interest worldwide. As the size of 6. International expertise and consultancy firms should be the outsourcing market increases, however, early and used in launching and implementing the early phase of new contenders such as Egypt should expect increased the strategy so as to bring into the country the much- competition. needed know-how and to open different opportunities. For all outsourcing host countries, current or 7. Many high-impact programs—such as the incentive prospective, moving to (or staying at) the top of the list packages to encourage BPO foreign investors—must of BPO destinations will require a constant adaptation be in place to accelerate the growth of the industry; of national and corporate strategies as well as increased these should go hand in hand with programs to encour- agility in responding to unexpected changes in relative age local companies. factor prices. Central to such agility will be efforts to always maintain a high level of responsiveness in terms of the skills and human resources required. As e-skills (i.e., skills for the knowledge economy) continue to be further defined and identified across the world, national outsourcing strategies will remain a laboratory where inputs from governments and businesses will continue to be combined and shaped to provide innovative Last but not least, Egypt’s ability to move from a approaches and environments (see Box 3). In turbulent monopoly-based telecommunications environment to a times even more than in quieter periods, innovative competitive market for telecommunication services will thinking and strategies will be required.There are rea- be a litmus test for many foreign investors contemplating sons to think that Egypt will live up to the challenge. an increase in their activities in the country, especially in the BPO sector. 7KH *OREDO ,QIRUPDWLRQ 7HFKQRORJ\\ 5HSRUW  ‹  :RUOG (FRQRPLF )RUXP
    140. 2.1: How Outsourcing Can Help Mobilize Talents Globally Box 3: Three examples of successful outsourcing strategies in Egypt Orange Business Services structure were no less than they are in any other part of the The MSC (Major Service Centre), established in Cairo, is the world. It was opened in June 2005 with 20 engineers in its largest service center that Orange operates globally. Its physi- application product support division; currently, Egypt GSC is cal security meets the highest standards required by Orange’s the fastest-growing center for Oracle around the globe. It global clients, and it provides many different services—such started by importing its entire consultancy from abroad. Today, as solution designs, service delivery management, and online Oracle’s Egypt GSC is satisfying all its human resources needs support and design implementations. It operates 24 hours a day, from Egypt. 7 days a week, and has a highly resilient network architecture. Oracle has chosen the Egyptian market because of its It provides service for a large array of technical functions for time-zone affinity with Europe, its cost competitive environment, Orange’s global multinational clients. The MSC currently and the large highly skilled labor pool with multilingual skills: employs more than 1,500 highly qualified and trained staff in the Arabic, English, French, German, Italian, and Spanish. 23 languages supported by the company. The largest support Moreover, the excellent government support (including educa- teams are those that employ Arabic, English, French, German, tion programs for working Egyptian professionals) and an Italian, and Spanish. advanced telecommunications infrastructure are important Orange Corporation has chosen Egypt for its qualified and advantages. low-cost talent pool and its ability to comply with technical and language requirements. Moreover, the government incentive Xceed Contact Center package offered by the Egyptian government includes: Xceed is one of the companies established in late 2001 to act as the IT arm for Telecom Egypt, the incumbent operator. Today • reduced international circuit charges, Xceed is the largest and most sophisticated contact center in • relocation costs from downtown Cairo to the Smart the southern Mediterranean region, offering BOP and inbound Village, and and outbound integrated customer contact solutions. • reduced cost of staff training. Arabic, English, French, Italian, Spanish, Greek, Portuguese, and Hebrew are languages currently supported Oracle Global Support Center (GSC) by Xceed for its clients worldwide; it also has a capacity of 122 Oracle GSC is located in Cairo within the Smart Village. It 1,600 Web-enabled workstations. employs over 400 world-class engineers to support over 100,000 customers in 140 countries worldwide. In 1999, Oracle group headquarters in the United States began investigating whether Egypt could make a good outsourcing destination and verified that the country’s labor productivity and the quality of its infra- Note ———. 2007b. “Outsourcing in Africa: Can the Promise Overcome the Hurdles?” Yankee Group Report, January. Boston: Yankee Group 1 For example, Egypt won the first place for the best outsourcing Research, Inc. provider for the year 2008 from the National British Society for Outsourcing Services. ———. 2008. “Can Middle Eastern Countries Fulfill the ‘Eastern’ Promise?” Yankee Group Report, July. Boston: Yankee Group 2 The Information Technology Industry Development Agency (ITIDA) Research, Inc. is a governmental entity affiliated with the Ministry of Communications and Information Technology. It is responsible for McKinsey Global Institute. 2008a, “Destination Egypt: Introducing the growing and developing Egypt's position as a leading global out- Egypt Delivery Opportunity.” June. McKinsey & Company, Inc., sourcing location by attracting foreign direct investments to the San Francisco. industry and maximizing the exports of IT services and applica- ———. 2008b. “Destination Egypt: Value Proposition.” July. McKinsey tions. & Company, Inc., San Francisco. 3 A. T. Kearney 2007. MCIT (Ministry of Communications and Information Technology). 4 Traditionally, Egyptians have been noted for their neutral accent in “Egypt: The Investor’s Smart Choice.” Available at Arabic; moreover, the Egyptian Arabic dialect is commonly under- http://www.mcit.gov.eg/Investors_Guide.aspx. stood among Arab speaking countries. UNFPA (United Nations Population Fund). 2007. State of World Population 2007: Unleashing the Potential of Urban Growth. Available at http://www.unfpa.org/swp/2007/english/print/ introduction.html. References A. T. Kearney. 2007. “Offshoring for Long-Term Advantage.” The 2007 A.T. Kearney Global Services Location Index. Available at http://www.atkearney.com/main.taf?p=5,3,1,185. Marson, T. and M. Blodgett. 2007a. “Is the Future Bright for Outsourcing IT Services to Egypt?” Yankee Group Report, May. Boston: Yankee Group Research, Inc. 7KH *OREDO ,QIRUPDWLRQ 7HFKQRORJ\\ 5HSRUW  ‹  :RUOG (FRQRPLF )RUXP
    141. 2.2: IT Korea: Past, Present, and Future CHAPTER 2.2 Half a century after the Korean War, Korea, Rep. (Korea) has become one of the leading information technology (IT) nations of the 21st century. Korea has IT Korea: Past, Present, achieved rapid economic growth by focusing on the electronics industry. It has grown to be an economic and Future power by revitalizing the IT industry, whose remarkable leadership began at the turn of the 21st century. Many JAE KYU LEE, Korea Advanced Institute of Science and Technology have analyzed the reasons for Korea’s amazing economic CHOONMO AHN, Electronics and Telecommunications growth, looking at its proactive acceptance of technolo- gy, value-added development with enhanced perform- Research Institute, Korea ance, and quick transition through industrial structuring. KIHOON SUNG, Electronics and Telecommunications Now Korea is facing the financial crisis that is currently Research Institute, Korea sweeping the world, along with a slowdown in the growth of the IT industry, so the proactive development of new IT-enabled growth engines is essential. This chapter provides an account of the four devel- opment phases of the history of the Korean IT industry and the progress of related policies.We start by review- ing the first phase (which lasted until 1980), looking at how Korea has achieved economic growth on the basis of the electronics industry.We then describe the second phase (early 1980–90) and consider how the electronics industry evolved into the IT industry and the third phase (early 1990–2000), looking at the growth and consolidation of IT in Korea. Next, we focus on the fourth phase, in which Korea’s global IT leadership was 123 established with the IT839 Policy. Finally, we introduce Korea’s vision of the New IT Initiative, which seeks a new momentum for the future of the industry as an engine of economic growth. Phase I: The electronics industry in its infancy As early as the 1920s, Korea operated telecommunica- tions networks that included the wired telephone line that connected Seoul and Incheon; it had also launched the first radio broadcasting station, Gyeongseong Station. During the Korean War, which broke out in 1950, most of the country’s industrial infrastructure was destroyed and Korea’s electronics industry was left para- lyzed. Forty-three percent of its industrial facilities and 41 percent of its power-generating facilities were ruined. About half of the nation’s mining facilities, which provided most of the energy at that time, were also destroyed.The power shortages were the biggest hardship for Korea in those days.The power supply dropped to just 20 percent of its pre-war level immedi- ately after the war, making it impossible to produce home appliances in the domestic market.The power shortage continued until the Korea Electric Power Corporation was established in 1961. We are grateful to Dr Moonki Choi, President of the Electronics and Telecommunications Research Institute, and Dr Changhee Hyun, Executive Director at the Electronics and Telecommunications Research Institute, for their support and comments. 7KH *OREDO ,QIRUPDWLRQ 7HFKQRORJ\\ 5HSRUW  ‹  :RUOG (FRQRPLF )RUXP
    142. 2.2: IT Korea: Past, Present, and Future Electronics after the Korean War (late 1950s) electronic products. Although the establishment of KIST was based on US assistance in return for sending Korean The desire to develop vacuum tubes (devices used to troops to Vietnam, it consequently helped the advance- modify electric signals, which were crucial for the ment of Korea’s science and technology. As the fruit of development of electronic technology), grew when US these efforts, LG Electronics introduced Korea’s first and Japanese vacuum tube products were introduced to black-and-white television, the model VD-191, which the Korean market. Goldstar (now LG Electronics) start- captured 10 percent of the domestic market only five ed to produce Korea’s first radios one year after its months after its launch. establishment in 1959. It was the start of Korea’s elec- tronics industry. The Age of Exports (early 1970s) As the volume of commercial capital from foreign Around the beginning of the 1970s, owing to the Act aid expanded during the process of economic develop- on the Development and Creation of Industrial ment, conglomerates such as Samsung Electronics, LG Complex for Export, enacted in 1964, specialized indus- Electronics, and Hyundai emerged.The proportion of trial complexes were established.These included govern- the manufacturing sector devoted to electronics ment-owned industrial complexes, free export zones, increased, mainly because of the successful industrializa- local government-owned industrial complexes, and civil tion of these conglomerates during the eight years after industrial complexes, all of which contributed to the the war, when they registered an annual growth rate of emergence of the Age of Exports. 10.8 percent. Electric and telecommunications infra- Since the adoption of the Act for Promotion of structure had recovered to its pre-war level by the early Industry Complex Development in 1973, the develop- 1960s. ment of industrial complexes has matured and the Kumi The rise of the electronics industry (1960s) Industrial Complex and the Masan Free Export Zone have become the Mecca of the electronics industry in After General Jung Hee Park seized power in 1961, Korea. In the 1970s, Korea started to build large indus- Korea’s real economic development took off.The gov- trial complexes across the nation.The Korea Electronics ernment recognized that the electronics and IT indus- Export Association, established in 1970, contributed to tries were promising and began to actively promote 124 building up a single export channel of electronic prod- their development.To fulfill its goal of developing the ucts, exploring the overseas market more aggressively. two industries, the government pushed electric power Owing to the efforts made by the industry and govern- and telephones as the priority infrastructure of the ment, the value of electronics exports increased from a national modernization policy that focused on (1) the mere US$50,000 in 1962 to US$1 billion in 1976. construction of the infrastructure industry, (2) the pro- On a related note, the Korea Advanced Institute of motion of exports, and (3) the renovation of state-man- Science and Technology (KAIST) was created in 1973 aged businesses. to become one of the world’s leading research universi- At that time, Korea’s electric power and telecom- ties. Over the years, KAIST has supplied quality Masters munications industries were promoted by the Electric and PhD graduates who have become the foundational Power Bureau within the Ministry of Commerce and human resources for the sustainable growth of IT tech- the Electric Power and the Telecommunication Bureau nology and industry. within the Ministry of Postal Services, respectively.The former led the electronics industry by introducing sever- Oil shocks and the development of the electronic al regulations, such as the Electricity Business Act, while switching system (late 1970s) the latter attempted to create demand for telecommuni- After the first oil crisis in 1973, the Korean electronics cations services. industry began to focus on the development of promis- The government announced its first Five-Year ing products with large growth potential. In 1976, the Economic Development Plan in February 1962. A Korea International Trade Association commissioned notable aspect of this plan is the measure that increased Arthur D. Little (ADL), a consultancy, to do a study on foreign capital inflows.The government allowed an the long-term outlook of Korea’s electronics industry. unlimited inflow of foreign capital to promote the elec- ADL suggested focusing on 24 items, including the tronics industry and opened the way for governmental color TV, video cassette recorder (VCR), Private Branch support.To enhance research and development (R&D) eXchanger (PBX), and computer and peripheral capability, the first national research institute, the Korea devices.The move toward manufacturing these promis- Institute for Science and Technology (KIST), was estab- ing items was made on the basis of this report. lished in 1966; this institute performed the role of pro- The first color TV was successfully developed in viding a talent pool to the IT industry.The division of 1974; exports reached 110,000 units in 1977.Three electronics and telecommunications in KIST became an manufacturers (Korea National, Samsung Electronics, independent institution, the Electronics and and LG Electronics), who were already producing home Telecommunications Research Institute (ETRI), which appliances, were ready to produce color TVs.These laid the foundations for the domestic production of 7KH *OREDO ,QIRUPDWLRQ 7HFKQRORJ\\ 5HSRUW  ‹  :RUOG (FRQRPLF )RUXP
    143. 2.2: IT Korea: Past, Present, and Future companies began to compete for their mass production, from an emphasis on stable growth with low-cost pro- thus cultivating the capability of quality enhancement. duction to high value added creation through high- After the successful development of the color TV, investment production systems. Korea’s position as one national attention shifted to the development of the of the world’s leading IT countries was established in electronic switching system, which was planned by this period, and the electronics industry began to KIST in 1976. Also ETRI was created in 1977. ETRI expand its business to incorporate the production of contracted foreign partners for technical cooperation, semiconductors and mobile telecommunications. and launched the production of the electronic switching system. However, the second oil shock in 1978 caused Phase III: Growth of the IT industry the export-led electronics industry to face another diffi- The next phase of the evolution of the IT industry cult period of negative growth, as a result of the new involved the globalization of enterprises as well as many protectionism and import regulations imposed by devel- technological advances. oped countries. Initial development (early 1990s) Phase II: The emergence of the IT industry TDX-10, a time-division switching system that has After its somewhat erratic beginning mentioned above, been called the “pioneer” of Korea’s telecommunications the electronics industry developed further and consoli- industry, was developed by ETRI with purely local dated. Also an IT industry truly emerged and began to technology in 1991.This resulted in an import substitu- grow quickly. tion effect worth 300 billion Korean won (about US$300 million) earned every year after 1992; the TDX-10 The electronics industry’s transformation (early 1980s) provided the basis for various applied products, such as The government started color TV broadcasting in the pager and code division multiple access (CDMA) December 1980, ushering in the era of this medium. As products. a variety of sports turned professional in the early 1980s, The IT industry’s growth was closely associated people came to derive more entertainment from color with the spread of telecommunication services. After a TV and demand skyrocketed.This spurred the develop- long debate, CDMA was adopted over time division 125 ment of other related electronics industries. Color TV multiple access (TDMA) as the general standard. KCS-1, made a significant contribution to the domestic produc- Korea’s first prototype of the CDMA system, was pro- tion and export of VCRs because it enabled video duced in 1993 after a contract with US Qualcomm viewing. Content, including adult movies, was produced for the joint development of the CDMA digital cellular in large quantities, and the videotape market grew system; as a result, the world’s first CDMA digital vibrantly, thus popularizing the VCR. mobile phone service was commercialized in 1996. In the 1990s, Samsung Electronics and LG The IT industry comes into its own (late 1980s) Electronics, which by then had grown into global con- In the 1980s, Korea’s IT industry truly emerged.The glomerates, became the core of Korea’s IT development. Korea Electric and Telecommunications Corporation Samsung Electronics became the world’s leader in the (current KT) and Korea Data Telecommunication (cur- home appliance business in the early 1990s, overwhelm- rent LG Dacom Corporation) were established in 1981 ing Motorola (which had dominated Korea’s mobile and 1982, respectively. ETRI succeeded in the domestic phone market for 10 years), and made Anycall a world- development of the electronic switching system TDX-1 famous brand. Developing the world’s first 64MB in 1984. By 1987, the number of wired telephones DRAM in 1992, Samsung Electronics also became a exceeded 10 million; R&D in the telecommunications global leader in the DRAM semiconductor field. LG field progressed greatly after the Seoul Olympics, which Electronics also started investing massively overseas, were held in 1988. In this period, the local development growing quickly into a global player. of personal computers (PCs), which gave strong The blossoming of the mobile telecommunications industry momentum to the IT industry, really took off.The PC (late 1990s) industry—which really got off the ground when Samsung Electronics developed an 8-bit PC, the SPC- By passing the Framework Act on Informationalization 1000, in December 1982—saw an enormous growth in Promotion and laying out the plans for a high-speed production from 1983 to 1988, increasing from 17,000 information network in 1995, the Korean government PC units to 205,000. revealed its strong intention of fostering the IT industry. After the 1988 Olympics, the happy era of the Age As the mobile telecommunications industry diversified of the Three Lows (low interest rates, low oil prices, and into the personal communication services (PCS), cord- low dollar value) was over, and profitability worsened less telephone generation 2 (CT-2), and wireless data rapidly amidst the global competition.Thus the electron- services in 1997, the number of mobile telecommunica- ics industry was forced to change its strategy, moving tions subscribers soared, reaching 22.68 million at the 7KH *OREDO ,QIRUPDWLRQ 7HFKQRORJ\\ 5HSRUW  ‹  :RUOG (FRQRPLF )RUXP
    144. 2.2: IT Korea: Past, Present, and Future management (LG CNS),8 relationship-based online end of 1997.The increased export of mobile phones community (Cyworld.com;9 NHN),10 smart-chip led to the expansion of related industries. SK Telecom, based mobile banking (KB Bank),11 online brokerage KTF, and LG Telcom became important players in (Kiwoom.com),12 and online auction (Internet mobile services. Auction Co.).13 With the foreign exchange crisis of November 1997, however, both domestic and overseas markets instantly shrank, causing negative growth. A great num- Phase IV: Global IT leadership ber of businesses went bankrupt as a result of the fall in Korea has seen tremendous success in its IT industry, the value of the Korean won and the rise in interest establishing itself as a global player in the international rates.The electronics industry was not immune to this markets. Moreover, this success has had an important crisis; it experienced a long series of bankruptcies and impact on the country’s economic growth and anticipated difficult times ahead. competitiveness. The government introduced a number of initia- tives—such as those encouraging foreign capital loans, The IT industry’s contribution to the national economy providing elastic tax rates, and offering an extension of By contributing to economic growth and export expan- trade liberalization measures—to overcome the crisis. sion, the IT industry played an important role in Korea’s The electronics industry underwent restructuring and achieving a per capita income of US$20,000 and over- improved its management