SlideShare a Scribd company logo
1 of 61
Carlo Magno, PhD
        De La Salle University, Manila
PEMEA BOT, Psychometrics and Statistics Division
                                                   1
   Approaches in Analyzing Test Data
   Classical test Theory (CTT)
     Focus of Analysis in CTT
     Limitations of CTT
   Item Response Theory (IRT)
     Approaches in IRT
     Advantages of the IRT
     Example of an IRT model: Rasch Model
   What to interpret?
   IRT for scales
   Applications of IRT on Tests
   Workshop
                                             2
   Classical Test Theory
   Item Response Theory


                            3
 Regarded as the “True Score Theory”
 Responses of examinees are due only to variation in
  ability of interest
 Sources of variation  external conditions or
  internal conditions of examinees that assumed to be
  constant through rigorous standardization or to
  have an effect that is nonsystematic or random by
  nature


                                                        4
TO = T + E
   The implication of the classical test theory for
    test takers is that test are fallible imprecise
    tools
   Error = standard error of measurement
                     Sm = S 1 - r
   True score = M +- Sm = 68% of the normal
    curve

                                                       5
One SE


       Range of True
mean   Scores

                       6
• Frequency of correct responses (to indicate
  question difficulty);
• Frequency of responses (to examine distracters);
• Reliability of the test and item-total correlation
  (to evaluate discrimination at the item level)


                                                       7
 A score is dependent on the performance of the group tested
  (Norm referenced)
 The group on which the test has been scaled has outlived has
  usefulness across time
   Changes in the defined population
   Changes in educational emphasis
 There is a need to rapidly make new norms to adopt to the
  changing times
 If the characteristics of a person changes and does not fit the
  specified norm then a norm for that person needs to be
  created.
 Each collection of norms has an ability of its own = rubber
  yardstick

                                                                    8
 Synonymous with latent trait theory, strong true
  score theory or modern mental test theory
 Initially designed for tests with right and wrong
  (dichotomous) responses.
 Examinees with more ability have higher
  probabilities for giving correct answers to items
  than lower ability students (Hambleton, 1989).
 Each item on a test has its own item characteristic
  curve that describes the probability of getting each
  particular item right or wrong given the ability of
  the test takers (Kaplan & Saccuzzo, 1997)

                                                         9
 A function of ability
  () – latent trait
 Forms the boundary
  between the
  probability areas of
  answering an item
  incorrectly and
  answering the item
  correctly


                          10
11
   One dimension (Rasch Model) One
    parameter model = uses only the difficulty
    parameter
   Two dimension  Two parameter Model =
    difficulty and ability parameter
   Three dimension (Logistic Model) Three
    Parameter Model = item difficulty, item
    discrimination, and psuedoguessing

                                                 12
 Mathematical model
                                   linking the observable
                                   dichotomously scored
                   b
                                   data (item performance)
          a                        to the unobservable data
                                   (ability)
c                                 Pi(θ) gives the probability
                                   of a correct response to
                                   item i as a function if
                                   ability (θ)
                                  b is the probability of a
    b=item difficulty              correct answer (1+c)/2
    a=item discrimination
    c=psuedoguessing parameter
 Two-parameter model:
          c=0
         One-parameter model:
a         c=0, a=1
    b
   Three items
    showing
    different item
    difficulties (b)
 The calibration of test item difficulty is independent
  of the person used for the calibration.
 The method of test calibration does not matter
  whose responses to these items use for comparison
 It gives the same results regardless on who takes
  the test
 The scores a person obtain on the test can be used
  to remove the influence of their abilities from the
  estimation of their difficulty. The result is a sample
  free item calibration.


                                                           16
   Rasch’s (1960) main motivation for his model
    was to eliminate references to populations of
    examinees in analyses of tests.
   According to him that test analysis would
    only be worthwhile if it were individual
    centered with separate parameters for the
    items and the examinees (van der Linden &
    Hambleton, 2004).


                                                    17
   The Rasch model is a probabilistic
    unidimensional model which asserts that:
       (1) the easier the question the more likely
    the student will respond correctly to it, and
       (2) the more able the student, the more
    likely he/she will pass the question compared
    to a less able student.


                                                     18
 The model was enhanced to assume that the
  probability that a student will correctly answer a
  question is a logistic function of the difference
  between the student's ability [θ] and the difficulty
  of the question [β] (i.e. the ability required to
  answer the question correctly), and only a function
  of that difference giving way to the Rasch model
 Thus, when data fit the model, the relative
  difficulties of the questions are independent of the
  relative abilities of the students, and vice versa
  (Rasch, 1977).


                                                         19
   (1) Unidimensionality. All items are
    functionally dependent upon only one
    underlying continuum.
   (2) Monotonicity. All item characteristic
    functions are strictly monotonic in the latent
    trait. The item characteristic function
    describes the probability of a predefined
    response as a function of the latent trait.


                                                     20
   (3) Dichotomy of the items. For each item there are
    only two different responses, for example positive
    and negative. The Rasch model requires that an
    additive structure underlies the observed data. This
    additive structure applies to the logit of Pij, where
    Pij is the probability that subject i will give a
    predefined response to item j, being the sum of a
    subject scale value ui and an item scale value vj, i.e.
    In (Pij/1 - Pij) = ui + vj


                                                              21
   Source: Magno, C. (2009). Demonstrating the difference between classical test theory and
    item response theory using derived data. The International Journal of Educational and
    Psychological Assessment, 1, 1-11..                                                        22
   Source: Magno, C. (2009). Demonstrating the difference between classical test theory and item response theory using
    derived data. The International Journal of Educational and Psychological Assessment, 1, 1-11.
                                                                                                                          23
   Source: Magno, C. (2009). Demonstrating the difference between classical test theory and item response theory using
    derived data. The International Journal of Educational and Psychological Assessment, 1, 1-11.

                                                                                                                          24
   Item Characteristic Curve (ICC) – Test
    Characteristics Curve (TCC)
   Logit measures for each item
   Item Information Function (IIF) – Test
    Information Function (TIF)
   Infit measures


                                             25
   TCC: Sum of ICC that make
    up a test or assessment
    and can be used to predict
    scores of examinees at
    given ability levels.
          TCC(Ѳ)=∑Pi(Ѳ)
   Links the true score to the
    underlying ability
    measures by the test.
   TCC shift to the right of the
    ability scale=difficult items
   Steeper slopes indicate greater
    discriminating ability
   Flat slopes indicates weak discrimination
    ability


                                                27
Figure 4. Test Characteristic Curve of the PRPF for the Primary Rater   Figure 5. Test Characteristic Curve of the Secondary Rater
   I(Ѳ), Contribution of
    particular items to the
    assessment of ability.
   Items with higher
    discriminating power
    contribute more to
    measurement precision than
    items with lower
    discriminating power.
   Items tend to make their
    best contribution to
    measurement precision
    around their b value.
   Tests with highly constrained TIF are
    imprecise measures of the for much of the
    continuum of the domain
   Tests with TIF that encompass a large range
    provides precise scores along the continuum
    of the domain measured.
   -2.00 SD units to +2.00 SD units – includes
    95% of the possible values of the distribution.

                                                      30
Figure 2. Test Information Function of PRPF for the Primary Raters   Figure 3. Test Information Function of the PRPF of the Secondary Rater
             -4.00 SD to +4.00 SD units                                             -4.00 SD to +4.00 SD units
1
                                                                      2
                                                                                                           2
                         1           2            3
0.8
                                                                   1.5


0.6                                           4
                                                                                            1

                                                                     1
0.4


0.2                                                                 0.5
                                                                                                               3

                                                                                                   4
  0                                                                   0
      –3   –2     –1         0           1    2       3                   –3   –2      –1         0                1   2   3
                       Ability ()                                                           Ability ()

            Four item characteristic curves                                    Item information for four test items


                       Figure 6: Item characteristics curves and corresponding item information functions
their corresponding IFF


        The sum of item information functions in a test.
        Higher values of the a parameter increase the
         amount of information an item provides.
        The lower the c parameter, the more information an
                      
         item provides.
        The more information provided by an assessment at
         a particular level, the smaller the errors associated
         with ability estimation.
2


    1.5


      1


     0.5


          0

                                        0                                3

                                  Ability ()


              Figure 7: Test information function for a four–item test
   Item Analysis
     Determining item difficulty (logit measure of +
      means an item is difficult, and – means easy).
     Utilizing goodness-of-fit criteria to detect items
      that do not fit the specified response model (Z
      statistic, INFIT Mean square).
   Item Selection
     Assess the contribution of each items’ test
     information function that are independent of
     other items.

                                                           36
   Item Difficulty
     MEASURE=logit measures of proportion correct
     Negative values (-) item is easy
     Positive values (+) item is difficult
   Goodness of fit
     Values of MNSQ INFIT within 0.8 to 1.2
     Z standard scores of 2.o and below are acceptable
     High values of item MNSQ indicate a “lack of construct
      homogeneity” with other items in a scale, whereas low
      values indicate “redundancy” with other items” (Linacre &
      Wright, 1998).
   Item Discrimination
     Point biserial estimate=close to 1.0
                                                                  37
   Having more than 2 points in the responses
    (ex. 4 point scale)
   Rating scale Model/polytomous Model
    (Andrich, 1978)
   Partial Credit Model
   Graded Response Model
   Nominal model
   Item Response Thresholds
     Logistic curves for each scale category
     The extent to which the items response levels differ along
      the continuum of the latent construct (different of a
      response of “strongly agree” to “agree”).
     Ideal to monotonic – the higher the scale, higher threshold
      values are expected.
     Easier items have smaller response threshold than difficult
      items.
     Threshold values that are very close means
      indistinguishable from each other.

                                                                    40
Example
   Primary rater: -3.79, -1.95, .96, and 4.35,
   Secondary rater: -3.90, -2.25, .32, and 3.60.
42
Magno, C. (2010). Looking at Filipino preservice teachers value for education through epistemological beliefs. TAPER, 19(1), 61-78.
 Self-regulation is defined by Zimmerman (2002) as
  self-generated thoughts, feeling, and actions that
  are oriented to attaining goals.
 Self-regulated learners are characterized to be
  “proactive in their efforts to learn because they are
  aware of their strengths and limitations and
  because they are guided by personally set goals and
  task-related strategies” (p. 66).


                                                          43
   Subprocesss of self-regulation (Zimmerman,
    1986).
     Metacognition (planning, organizing, self-
      instructing, monitoring, self-evaluating)
     Motivation (competence, self-efficacy, autonomy)
     Behavioral (select, structure, and optimize
      learning environments) aspects of learning.
   Self-regulation structured interview – 14
    questions (Zimmerman & Martinez-Pons,
    1986)                                                44
   SRLIS
     Reliability – percentage of agreement between 2
      coders
     Discriminant validity - high and low achievers
      were compared across the 14 categories.
     Construct validity - self-regulated learning scores
      were used to predict scores of the students in the
      Metropolitan Achievement Tests (MAT) together
      with gender and socio-economic status of
      parents.
                                                            45
   To continue the development in the process
    of arriving at good measures of self-
    regulation.
   A Polytomous Item Response Theory
   This analysis allows reduction of item
    variances because the influence of person
    ability is controlled by having a separate
    calibration (Wright & Masters, 1982; Wright &
    Stone, 1979).
                                                    46
   Method
     222 college students
     SRLIS was administered to 1454
     Responses were converted into items dpicting the
      14 categories
     Item review


                                                         47
   Principal components analysis: 7 factors were
    extracted that explains 42.54% of the total
    variance (55 items loaded highly >.4)
   The seven factors were conformed (N=305)
     All 7 factors were significantly correlated .
     7-factor structure was supported:
      ▪ χ2=332.07, df=1409
      ▪ RMS=.07
      ▪ RMSEA=.06
      ▪ GFI=.91,
      ▪ NFI=.89                                       48
49
50
   The average step calibrations for
     Memory strategy are, -1.57, .25, 1.71, and 3.41
     Goal setting, -3.19, -.92, 1.37, and 3.61
     Self-evaluation, -2.71, -.59, 1.25, and 3.15
     Seeking assistance, -2.70, -1.06, .41, and 2.30
     Environmental structuring, 2.32, -.42, 1.40, and
      3.47
     Responsibility, -3.43, -1.20, .98, and 3.98
     Organizing, -2.88, -.95, .79, and 2.76
                                                         51
52
53
54
   3. I take my own notes in class
                                      55
   2. I isolate myself from unecessary noisy
    places                                      56
57
   3. I put my notebooks, handouts, and the like in a certain container.
   4. I study at my own pace.
                                                                            58
   Item Analysis
     Determining sample invariant item parameters.
     Utilizing goodness-of-fit criteria to detect items
     that do not fit the specified response model (χ2,
     analysis of residuals).
   Item Selection
     Assess the contribution of each item the test
     information function independent of other items.
   Item banking
     Test developers can build an assessment to fit any
      desired test information function with items
      having sufficient properties.
     Comparisons of items can be made across
      dissimilar samples.
   Workshop


               61

More Related Content

What's hot

IRT - Item response Theory
IRT - Item response TheoryIRT - Item response Theory
IRT - Item response TheoryAjay Dhamija
 
ETHICAL STANDARDS IN TESTING.
ETHICAL STANDARDS IN TESTING.ETHICAL STANDARDS IN TESTING.
ETHICAL STANDARDS IN TESTING.ANCYBS
 
Research methods in industrial and organizational psychology
Research methods in industrial and organizational psychologyResearch methods in industrial and organizational psychology
Research methods in industrial and organizational psychologySeta Wicaksana
 
Introduction principles of psychological measurement
Introduction principles of psychological measurementIntroduction principles of psychological measurement
Introduction principles of psychological measurementPauline Veneracion
 
CHAPTER 1 - PSYCHOLOGICAL TESTING AND MEASUREMENT.ppt
CHAPTER 1 - PSYCHOLOGICAL TESTING AND MEASUREMENT.pptCHAPTER 1 - PSYCHOLOGICAL TESTING AND MEASUREMENT.ppt
CHAPTER 1 - PSYCHOLOGICAL TESTING AND MEASUREMENT.pptkriti137049
 
Reliability by Vartika Verma .pdf
Reliability by Vartika Verma .pdfReliability by Vartika Verma .pdf
Reliability by Vartika Verma .pdfVartika Verma
 
Behavioral assessment
Behavioral assessmentBehavioral assessment
Behavioral assessmentIqra Shahzad
 
Item Analysis: Classical and Beyond
Item Analysis: Classical and BeyondItem Analysis: Classical and Beyond
Item Analysis: Classical and BeyondMhairi Mcalpine
 
Validity in psychological testing
Validity in psychological testingValidity in psychological testing
Validity in psychological testingMilen Ramos
 
Ravens Progressive Matrices
Ravens Progressive MatricesRavens Progressive Matrices
Ravens Progressive MatricesHemangi Narvekar
 
All Reports Psychological Testing and Assessment
All Reports Psychological Testing and AssessmentAll Reports Psychological Testing and Assessment
All Reports Psychological Testing and AssessmentAsad Abbas
 
The differential aptitude test (dat)
The differential aptitude test (dat)The differential aptitude test (dat)
The differential aptitude test (dat)Muhammad Musawar Ali
 
A visual guide to item response theory
A visual guide to item response theoryA visual guide to item response theory
A visual guide to item response theoryahmad rustam
 

What's hot (20)

IRT - Item response Theory
IRT - Item response TheoryIRT - Item response Theory
IRT - Item response Theory
 
ETHICAL STANDARDS IN TESTING.
ETHICAL STANDARDS IN TESTING.ETHICAL STANDARDS IN TESTING.
ETHICAL STANDARDS IN TESTING.
 
Irt assessment
Irt assessmentIrt assessment
Irt assessment
 
Research methods in industrial and organizational psychology
Research methods in industrial and organizational psychologyResearch methods in industrial and organizational psychology
Research methods in industrial and organizational psychology
 
Introduction principles of psychological measurement
Introduction principles of psychological measurementIntroduction principles of psychological measurement
Introduction principles of psychological measurement
 
CHAPTER 1 - PSYCHOLOGICAL TESTING AND MEASUREMENT.ppt
CHAPTER 1 - PSYCHOLOGICAL TESTING AND MEASUREMENT.pptCHAPTER 1 - PSYCHOLOGICAL TESTING AND MEASUREMENT.ppt
CHAPTER 1 - PSYCHOLOGICAL TESTING AND MEASUREMENT.ppt
 
Reliability by Vartika Verma .pdf
Reliability by Vartika Verma .pdfReliability by Vartika Verma .pdf
Reliability by Vartika Verma .pdf
 
Assessment of Intellectual Abilities
Assessment of Intellectual AbilitiesAssessment of Intellectual Abilities
Assessment of Intellectual Abilities
 
Behavioral assessment
Behavioral assessmentBehavioral assessment
Behavioral assessment
 
Item Analysis: Classical and Beyond
Item Analysis: Classical and BeyondItem Analysis: Classical and Beyond
Item Analysis: Classical and Beyond
 
Item writing
Item writingItem writing
Item writing
 
Steps of assessment
Steps of assessmentSteps of assessment
Steps of assessment
 
Validity in psychological testing
Validity in psychological testingValidity in psychological testing
Validity in psychological testing
 
The research instruments
The research instrumentsThe research instruments
The research instruments
 
Ravens Progressive Matrices
Ravens Progressive MatricesRavens Progressive Matrices
Ravens Progressive Matrices
 
All Reports Psychological Testing and Assessment
All Reports Psychological Testing and AssessmentAll Reports Psychological Testing and Assessment
All Reports Psychological Testing and Assessment
 
Sack s sentence completion test report
Sack s sentence completion test reportSack s sentence completion test report
Sack s sentence completion test report
 
The differential aptitude test (dat)
The differential aptitude test (dat)The differential aptitude test (dat)
The differential aptitude test (dat)
 
A visual guide to item response theory
A visual guide to item response theoryA visual guide to item response theory
A visual guide to item response theory
 
Edward personal preference scales
Edward personal preference scalesEdward personal preference scales
Edward personal preference scales
 

Similar to Analyzing Test Data with Classical and Item Response Theories

The+application+of+irt+using+the+rasch+model presnetation1
The+application+of+irt+using+the+rasch+model presnetation1The+application+of+irt+using+the+rasch+model presnetation1
The+application+of+irt+using+the+rasch+model presnetation1Carlo Magno
 
Introduction to unidimensional item response model
Introduction to unidimensional item response modelIntroduction to unidimensional item response model
Introduction to unidimensional item response modelSumit Das
 
Irene Martelli - PhD presentation
Irene Martelli - PhD presentationIrene Martelli - PhD presentation
Irene Martelli - PhD presentationIrene Martelli
 
algorithmic-decisions, fairness, machine learning, provenance, transparency
algorithmic-decisions, fairness, machine learning, provenance, transparencyalgorithmic-decisions, fairness, machine learning, provenance, transparency
algorithmic-decisions, fairness, machine learning, provenance, transparencyPaolo Missier
 
Computer Adaptive Test (cat)
Computer Adaptive Test (cat)Computer Adaptive Test (cat)
Computer Adaptive Test (cat)Tabraiz Bukhari
 
Relationships Among Classical Test Theory and Item Response Theory Frameworks...
Relationships Among Classical Test Theory and Item Response Theory Frameworks...Relationships Among Classical Test Theory and Item Response Theory Frameworks...
Relationships Among Classical Test Theory and Item Response Theory Frameworks...AnusornKoedsri3
 
High Dimensional Biological Data Analysis and Visualization
High Dimensional Biological Data Analysis and VisualizationHigh Dimensional Biological Data Analysis and Visualization
High Dimensional Biological Data Analysis and VisualizationDmitry Grapov
 
To Explain Or To Predict?
To Explain Or To Predict?To Explain Or To Predict?
To Explain Or To Predict?Galit Shmueli
 
A New Concurrent Calibration Method For Nonequivalent Group Design Under Nonr...
A New Concurrent Calibration Method For Nonequivalent Group Design Under Nonr...A New Concurrent Calibration Method For Nonequivalent Group Design Under Nonr...
A New Concurrent Calibration Method For Nonequivalent Group Design Under Nonr...Kathryn Patel
 
DIFFERENCE OF PROBABILITY AND INFORMATION ENTROPY FOR SKILLS CLASSIFICATION A...
DIFFERENCE OF PROBABILITY AND INFORMATION ENTROPY FOR SKILLS CLASSIFICATION A...DIFFERENCE OF PROBABILITY AND INFORMATION ENTROPY FOR SKILLS CLASSIFICATION A...
DIFFERENCE OF PROBABILITY AND INFORMATION ENTROPY FOR SKILLS CLASSIFICATION A...ijaia
 
LAK13 linkedup tutorial_evaluation_framework
LAK13 linkedup tutorial_evaluation_frameworkLAK13 linkedup tutorial_evaluation_framework
LAK13 linkedup tutorial_evaluation_frameworkHendrik Drachsler
 
Whitcher Ismrm 2009
Whitcher Ismrm 2009Whitcher Ismrm 2009
Whitcher Ismrm 2009bwhitcher
 
The effect of number of concepts on readability of schemas 2
The effect of number of concepts on readability of schemas 2The effect of number of concepts on readability of schemas 2
The effect of number of concepts on readability of schemas 2Saman Sara
 
Intro to Model Selection
Intro to Model SelectionIntro to Model Selection
Intro to Model Selectionchenhm
 
KatKennedy REU D.C. Poster
KatKennedy REU D.C. PosterKatKennedy REU D.C. Poster
KatKennedy REU D.C. PosterKatlynn Kennedy
 
To Explain, To Predict, or To Describe?
To Explain, To Predict, or To Describe?To Explain, To Predict, or To Describe?
To Explain, To Predict, or To Describe?Galit Shmueli
 
Practical Language Testing by Fulcher (2010)
Practical Language Testing by Fulcher (2010)Practical Language Testing by Fulcher (2010)
Practical Language Testing by Fulcher (2010)Mahsa Farahanynia
 

Similar to Analyzing Test Data with Classical and Item Response Theories (20)

The+application+of+irt+using+the+rasch+model presnetation1
The+application+of+irt+using+the+rasch+model presnetation1The+application+of+irt+using+the+rasch+model presnetation1
The+application+of+irt+using+the+rasch+model presnetation1
 
Introduction to unidimensional item response model
Introduction to unidimensional item response modelIntroduction to unidimensional item response model
Introduction to unidimensional item response model
 
Slide Psikologi.docx
Slide Psikologi.docxSlide Psikologi.docx
Slide Psikologi.docx
 
Irene Martelli - PhD presentation
Irene Martelli - PhD presentationIrene Martelli - PhD presentation
Irene Martelli - PhD presentation
 
algorithmic-decisions, fairness, machine learning, provenance, transparency
algorithmic-decisions, fairness, machine learning, provenance, transparencyalgorithmic-decisions, fairness, machine learning, provenance, transparency
algorithmic-decisions, fairness, machine learning, provenance, transparency
 
Computer Adaptive Test (cat)
Computer Adaptive Test (cat)Computer Adaptive Test (cat)
Computer Adaptive Test (cat)
 
Relationships Among Classical Test Theory and Item Response Theory Frameworks...
Relationships Among Classical Test Theory and Item Response Theory Frameworks...Relationships Among Classical Test Theory and Item Response Theory Frameworks...
Relationships Among Classical Test Theory and Item Response Theory Frameworks...
 
High Dimensional Biological Data Analysis and Visualization
High Dimensional Biological Data Analysis and VisualizationHigh Dimensional Biological Data Analysis and Visualization
High Dimensional Biological Data Analysis and Visualization
 
To Explain Or To Predict?
To Explain Or To Predict?To Explain Or To Predict?
To Explain Or To Predict?
 
A New Concurrent Calibration Method For Nonequivalent Group Design Under Nonr...
A New Concurrent Calibration Method For Nonequivalent Group Design Under Nonr...A New Concurrent Calibration Method For Nonequivalent Group Design Under Nonr...
A New Concurrent Calibration Method For Nonequivalent Group Design Under Nonr...
 
DIFFERENCE OF PROBABILITY AND INFORMATION ENTROPY FOR SKILLS CLASSIFICATION A...
DIFFERENCE OF PROBABILITY AND INFORMATION ENTROPY FOR SKILLS CLASSIFICATION A...DIFFERENCE OF PROBABILITY AND INFORMATION ENTROPY FOR SKILLS CLASSIFICATION A...
DIFFERENCE OF PROBABILITY AND INFORMATION ENTROPY FOR SKILLS CLASSIFICATION A...
 
Morse et al 2012
Morse et al 2012Morse et al 2012
Morse et al 2012
 
LAK13 linkedup tutorial_evaluation_framework
LAK13 linkedup tutorial_evaluation_frameworkLAK13 linkedup tutorial_evaluation_framework
LAK13 linkedup tutorial_evaluation_framework
 
Whitcher Ismrm 2009
Whitcher Ismrm 2009Whitcher Ismrm 2009
Whitcher Ismrm 2009
 
The effect of number of concepts on readability of schemas 2
The effect of number of concepts on readability of schemas 2The effect of number of concepts on readability of schemas 2
The effect of number of concepts on readability of schemas 2
 
Intro to Model Selection
Intro to Model SelectionIntro to Model Selection
Intro to Model Selection
 
KatKennedy REU D.C. Poster
KatKennedy REU D.C. PosterKatKennedy REU D.C. Poster
KatKennedy REU D.C. Poster
 
To Explain, To Predict, or To Describe?
To Explain, To Predict, or To Describe?To Explain, To Predict, or To Describe?
To Explain, To Predict, or To Describe?
 
Item analysis
Item analysisItem analysis
Item analysis
 
Practical Language Testing by Fulcher (2010)
Practical Language Testing by Fulcher (2010)Practical Language Testing by Fulcher (2010)
Practical Language Testing by Fulcher (2010)
 

More from Carlo Magno

Assessment Using the SOLO Framework.pptx
Assessment Using the SOLO Framework.pptxAssessment Using the SOLO Framework.pptx
Assessment Using the SOLO Framework.pptxCarlo Magno
 
Social and Emotional Learning
Social and Emotional LearningSocial and Emotional Learning
Social and Emotional LearningCarlo Magno
 
Educational assessment in the 4 ir
Educational assessment in the 4 irEducational assessment in the 4 ir
Educational assessment in the 4 irCarlo Magno
 
The process of research mentoring
The process of research mentoringThe process of research mentoring
The process of research mentoringCarlo Magno
 
Quality management services sustainability training
Quality management services sustainability trainingQuality management services sustainability training
Quality management services sustainability trainingCarlo Magno
 
Managing technology integration in schools
Managing technology integration in schoolsManaging technology integration in schools
Managing technology integration in schoolsCarlo Magno
 
Integrating technology in teaching
Integrating technology in teachingIntegrating technology in teaching
Integrating technology in teachingCarlo Magno
 
Empowering educators on technology integration
Empowering educators on technology integrationEmpowering educators on technology integration
Empowering educators on technology integrationCarlo Magno
 
Designing an online lesson
Designing an online lessonDesigning an online lesson
Designing an online lessonCarlo Magno
 
Curriculum integration
Curriculum integrationCurriculum integration
Curriculum integrationCarlo Magno
 
Accountability in Developing Student Learning
Accountability in Developing Student LearningAccountability in Developing Student Learning
Accountability in Developing Student LearningCarlo Magno
 
The Instructional leader: TOwards School Improvement
The Instructional leader: TOwards School ImprovementThe Instructional leader: TOwards School Improvement
The Instructional leader: TOwards School ImprovementCarlo Magno
 
Guiding your child on their career decision making
Guiding your child on their career decision makingGuiding your child on their career decision making
Guiding your child on their career decision makingCarlo Magno
 
Assessing Science Inquiry Skills
Assessing Science Inquiry SkillsAssessing Science Inquiry Skills
Assessing Science Inquiry SkillsCarlo Magno
 
Assessment in the Social Studies Curriculum
Assessment in the Social Studies CurriculumAssessment in the Social Studies Curriculum
Assessment in the Social Studies CurriculumCarlo Magno
 
Quantitative analysis in language research
Quantitative analysis in language researchQuantitative analysis in language research
Quantitative analysis in language researchCarlo Magno
 
Integrating technology in teaching
Integrating technology in teachingIntegrating technology in teaching
Integrating technology in teachingCarlo Magno
 
Hallmarks of textbook
Hallmarks of textbookHallmarks of textbook
Hallmarks of textbookCarlo Magno
 
managing the learner centered-classroom
managing the learner centered-classroommanaging the learner centered-classroom
managing the learner centered-classroomCarlo Magno
 
Assessing learning objectives
Assessing learning objectivesAssessing learning objectives
Assessing learning objectivesCarlo Magno
 

More from Carlo Magno (20)

Assessment Using the SOLO Framework.pptx
Assessment Using the SOLO Framework.pptxAssessment Using the SOLO Framework.pptx
Assessment Using the SOLO Framework.pptx
 
Social and Emotional Learning
Social and Emotional LearningSocial and Emotional Learning
Social and Emotional Learning
 
Educational assessment in the 4 ir
Educational assessment in the 4 irEducational assessment in the 4 ir
Educational assessment in the 4 ir
 
The process of research mentoring
The process of research mentoringThe process of research mentoring
The process of research mentoring
 
Quality management services sustainability training
Quality management services sustainability trainingQuality management services sustainability training
Quality management services sustainability training
 
Managing technology integration in schools
Managing technology integration in schoolsManaging technology integration in schools
Managing technology integration in schools
 
Integrating technology in teaching
Integrating technology in teachingIntegrating technology in teaching
Integrating technology in teaching
 
Empowering educators on technology integration
Empowering educators on technology integrationEmpowering educators on technology integration
Empowering educators on technology integration
 
Designing an online lesson
Designing an online lessonDesigning an online lesson
Designing an online lesson
 
Curriculum integration
Curriculum integrationCurriculum integration
Curriculum integration
 
Accountability in Developing Student Learning
Accountability in Developing Student LearningAccountability in Developing Student Learning
Accountability in Developing Student Learning
 
The Instructional leader: TOwards School Improvement
The Instructional leader: TOwards School ImprovementThe Instructional leader: TOwards School Improvement
The Instructional leader: TOwards School Improvement
 
Guiding your child on their career decision making
Guiding your child on their career decision makingGuiding your child on their career decision making
Guiding your child on their career decision making
 
Assessing Science Inquiry Skills
Assessing Science Inquiry SkillsAssessing Science Inquiry Skills
Assessing Science Inquiry Skills
 
Assessment in the Social Studies Curriculum
Assessment in the Social Studies CurriculumAssessment in the Social Studies Curriculum
Assessment in the Social Studies Curriculum
 
Quantitative analysis in language research
Quantitative analysis in language researchQuantitative analysis in language research
Quantitative analysis in language research
 
Integrating technology in teaching
Integrating technology in teachingIntegrating technology in teaching
Integrating technology in teaching
 
Hallmarks of textbook
Hallmarks of textbookHallmarks of textbook
Hallmarks of textbook
 
managing the learner centered-classroom
managing the learner centered-classroommanaging the learner centered-classroom
managing the learner centered-classroom
 
Assessing learning objectives
Assessing learning objectivesAssessing learning objectives
Assessing learning objectives
 

Recently uploaded

Grant Readiness 101 TechSoup and Remy Consulting
Grant Readiness 101 TechSoup and Remy ConsultingGrant Readiness 101 TechSoup and Remy Consulting
Grant Readiness 101 TechSoup and Remy ConsultingTechSoup
 
Web & Social Media Analytics Previous Year Question Paper.pdf
Web & Social Media Analytics Previous Year Question Paper.pdfWeb & Social Media Analytics Previous Year Question Paper.pdf
Web & Social Media Analytics Previous Year Question Paper.pdfJayanti Pande
 
Kisan Call Centre - To harness potential of ICT in Agriculture by answer farm...
Kisan Call Centre - To harness potential of ICT in Agriculture by answer farm...Kisan Call Centre - To harness potential of ICT in Agriculture by answer farm...
Kisan Call Centre - To harness potential of ICT in Agriculture by answer farm...Krashi Coaching
 
The basics of sentences session 2pptx copy.pptx
The basics of sentences session 2pptx copy.pptxThe basics of sentences session 2pptx copy.pptx
The basics of sentences session 2pptx copy.pptxheathfieldcps1
 
Nutritional Needs Presentation - HLTH 104
Nutritional Needs Presentation - HLTH 104Nutritional Needs Presentation - HLTH 104
Nutritional Needs Presentation - HLTH 104misteraugie
 
Paris 2024 Olympic Geographies - an activity
Paris 2024 Olympic Geographies - an activityParis 2024 Olympic Geographies - an activity
Paris 2024 Olympic Geographies - an activityGeoBlogs
 
Presentation by Andreas Schleicher Tackling the School Absenteeism Crisis 30 ...
Presentation by Andreas Schleicher Tackling the School Absenteeism Crisis 30 ...Presentation by Andreas Schleicher Tackling the School Absenteeism Crisis 30 ...
Presentation by Andreas Schleicher Tackling the School Absenteeism Crisis 30 ...EduSkills OECD
 
Mastering the Unannounced Regulatory Inspection
Mastering the Unannounced Regulatory InspectionMastering the Unannounced Regulatory Inspection
Mastering the Unannounced Regulatory InspectionSafetyChain Software
 
1029 - Danh muc Sach Giao Khoa 10 . pdf
1029 -  Danh muc Sach Giao Khoa 10 . pdf1029 -  Danh muc Sach Giao Khoa 10 . pdf
1029 - Danh muc Sach Giao Khoa 10 . pdfQucHHunhnh
 
Sanyam Choudhary Chemistry practical.pdf
Sanyam Choudhary Chemistry practical.pdfSanyam Choudhary Chemistry practical.pdf
Sanyam Choudhary Chemistry practical.pdfsanyamsingh5019
 
Call Girls in Dwarka Mor Delhi Contact Us 9654467111
Call Girls in Dwarka Mor Delhi Contact Us 9654467111Call Girls in Dwarka Mor Delhi Contact Us 9654467111
Call Girls in Dwarka Mor Delhi Contact Us 9654467111Sapana Sha
 
Russian Call Girls in Andheri Airport Mumbai WhatsApp 9167673311 💞 Full Nigh...
Russian Call Girls in Andheri Airport Mumbai WhatsApp  9167673311 💞 Full Nigh...Russian Call Girls in Andheri Airport Mumbai WhatsApp  9167673311 💞 Full Nigh...
Russian Call Girls in Andheri Airport Mumbai WhatsApp 9167673311 💞 Full Nigh...Pooja Nehwal
 
Measures of Dispersion and Variability: Range, QD, AD and SD
Measures of Dispersion and Variability: Range, QD, AD and SDMeasures of Dispersion and Variability: Range, QD, AD and SD
Measures of Dispersion and Variability: Range, QD, AD and SDThiyagu K
 
Organic Name Reactions for the students and aspirants of Chemistry12th.pptx
Organic Name Reactions  for the students and aspirants of Chemistry12th.pptxOrganic Name Reactions  for the students and aspirants of Chemistry12th.pptx
Organic Name Reactions for the students and aspirants of Chemistry12th.pptxVS Mahajan Coaching Centre
 
9548086042 for call girls in Indira Nagar with room service
9548086042  for call girls in Indira Nagar  with room service9548086042  for call girls in Indira Nagar  with room service
9548086042 for call girls in Indira Nagar with room servicediscovermytutordmt
 
Student login on Anyboli platform.helpin
Student login on Anyboli platform.helpinStudent login on Anyboli platform.helpin
Student login on Anyboli platform.helpinRaunakKeshri1
 
Z Score,T Score, Percential Rank and Box Plot Graph
Z Score,T Score, Percential Rank and Box Plot GraphZ Score,T Score, Percential Rank and Box Plot Graph
Z Score,T Score, Percential Rank and Box Plot GraphThiyagu K
 

Recently uploaded (20)

Mattingly "AI & Prompt Design: The Basics of Prompt Design"
Mattingly "AI & Prompt Design: The Basics of Prompt Design"Mattingly "AI & Prompt Design: The Basics of Prompt Design"
Mattingly "AI & Prompt Design: The Basics of Prompt Design"
 
Grant Readiness 101 TechSoup and Remy Consulting
Grant Readiness 101 TechSoup and Remy ConsultingGrant Readiness 101 TechSoup and Remy Consulting
Grant Readiness 101 TechSoup and Remy Consulting
 
Web & Social Media Analytics Previous Year Question Paper.pdf
Web & Social Media Analytics Previous Year Question Paper.pdfWeb & Social Media Analytics Previous Year Question Paper.pdf
Web & Social Media Analytics Previous Year Question Paper.pdf
 
Mattingly "AI & Prompt Design: Structured Data, Assistants, & RAG"
Mattingly "AI & Prompt Design: Structured Data, Assistants, & RAG"Mattingly "AI & Prompt Design: Structured Data, Assistants, & RAG"
Mattingly "AI & Prompt Design: Structured Data, Assistants, & RAG"
 
Kisan Call Centre - To harness potential of ICT in Agriculture by answer farm...
Kisan Call Centre - To harness potential of ICT in Agriculture by answer farm...Kisan Call Centre - To harness potential of ICT in Agriculture by answer farm...
Kisan Call Centre - To harness potential of ICT in Agriculture by answer farm...
 
The basics of sentences session 2pptx copy.pptx
The basics of sentences session 2pptx copy.pptxThe basics of sentences session 2pptx copy.pptx
The basics of sentences session 2pptx copy.pptx
 
Nutritional Needs Presentation - HLTH 104
Nutritional Needs Presentation - HLTH 104Nutritional Needs Presentation - HLTH 104
Nutritional Needs Presentation - HLTH 104
 
Paris 2024 Olympic Geographies - an activity
Paris 2024 Olympic Geographies - an activityParis 2024 Olympic Geographies - an activity
Paris 2024 Olympic Geographies - an activity
 
Presentation by Andreas Schleicher Tackling the School Absenteeism Crisis 30 ...
Presentation by Andreas Schleicher Tackling the School Absenteeism Crisis 30 ...Presentation by Andreas Schleicher Tackling the School Absenteeism Crisis 30 ...
Presentation by Andreas Schleicher Tackling the School Absenteeism Crisis 30 ...
 
Mastering the Unannounced Regulatory Inspection
Mastering the Unannounced Regulatory InspectionMastering the Unannounced Regulatory Inspection
Mastering the Unannounced Regulatory Inspection
 
1029 - Danh muc Sach Giao Khoa 10 . pdf
1029 -  Danh muc Sach Giao Khoa 10 . pdf1029 -  Danh muc Sach Giao Khoa 10 . pdf
1029 - Danh muc Sach Giao Khoa 10 . pdf
 
Sanyam Choudhary Chemistry practical.pdf
Sanyam Choudhary Chemistry practical.pdfSanyam Choudhary Chemistry practical.pdf
Sanyam Choudhary Chemistry practical.pdf
 
Call Girls in Dwarka Mor Delhi Contact Us 9654467111
Call Girls in Dwarka Mor Delhi Contact Us 9654467111Call Girls in Dwarka Mor Delhi Contact Us 9654467111
Call Girls in Dwarka Mor Delhi Contact Us 9654467111
 
Russian Call Girls in Andheri Airport Mumbai WhatsApp 9167673311 💞 Full Nigh...
Russian Call Girls in Andheri Airport Mumbai WhatsApp  9167673311 💞 Full Nigh...Russian Call Girls in Andheri Airport Mumbai WhatsApp  9167673311 💞 Full Nigh...
Russian Call Girls in Andheri Airport Mumbai WhatsApp 9167673311 💞 Full Nigh...
 
Measures of Dispersion and Variability: Range, QD, AD and SD
Measures of Dispersion and Variability: Range, QD, AD and SDMeasures of Dispersion and Variability: Range, QD, AD and SD
Measures of Dispersion and Variability: Range, QD, AD and SD
 
Organic Name Reactions for the students and aspirants of Chemistry12th.pptx
Organic Name Reactions  for the students and aspirants of Chemistry12th.pptxOrganic Name Reactions  for the students and aspirants of Chemistry12th.pptx
Organic Name Reactions for the students and aspirants of Chemistry12th.pptx
 
Advance Mobile Application Development class 07
Advance Mobile Application Development class 07Advance Mobile Application Development class 07
Advance Mobile Application Development class 07
 
9548086042 for call girls in Indira Nagar with room service
9548086042  for call girls in Indira Nagar  with room service9548086042  for call girls in Indira Nagar  with room service
9548086042 for call girls in Indira Nagar with room service
 
Student login on Anyboli platform.helpin
Student login on Anyboli platform.helpinStudent login on Anyboli platform.helpin
Student login on Anyboli platform.helpin
 
Z Score,T Score, Percential Rank and Box Plot Graph
Z Score,T Score, Percential Rank and Box Plot GraphZ Score,T Score, Percential Rank and Box Plot Graph
Z Score,T Score, Percential Rank and Box Plot Graph
 

Analyzing Test Data with Classical and Item Response Theories

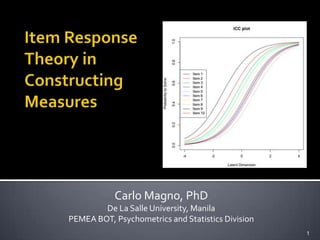
  • 1. Carlo Magno, PhD De La Salle University, Manila PEMEA BOT, Psychometrics and Statistics Division 1
  • 2. Approaches in Analyzing Test Data  Classical test Theory (CTT)  Focus of Analysis in CTT  Limitations of CTT  Item Response Theory (IRT)  Approaches in IRT  Advantages of the IRT  Example of an IRT model: Rasch Model  What to interpret?  IRT for scales  Applications of IRT on Tests  Workshop 2
  • 3. Classical Test Theory  Item Response Theory 3
  • 4.  Regarded as the “True Score Theory”  Responses of examinees are due only to variation in ability of interest  Sources of variation  external conditions or internal conditions of examinees that assumed to be constant through rigorous standardization or to have an effect that is nonsystematic or random by nature 4
  • 5. TO = T + E  The implication of the classical test theory for test takers is that test are fallible imprecise tools  Error = standard error of measurement Sm = S 1 - r  True score = M +- Sm = 68% of the normal curve 5
  • 6. One SE Range of True mean Scores 6
  • 7. • Frequency of correct responses (to indicate question difficulty); • Frequency of responses (to examine distracters); • Reliability of the test and item-total correlation (to evaluate discrimination at the item level) 7
  • 8.  A score is dependent on the performance of the group tested (Norm referenced)  The group on which the test has been scaled has outlived has usefulness across time  Changes in the defined population  Changes in educational emphasis  There is a need to rapidly make new norms to adopt to the changing times  If the characteristics of a person changes and does not fit the specified norm then a norm for that person needs to be created.  Each collection of norms has an ability of its own = rubber yardstick 8
  • 9.  Synonymous with latent trait theory, strong true score theory or modern mental test theory  Initially designed for tests with right and wrong (dichotomous) responses.  Examinees with more ability have higher probabilities for giving correct answers to items than lower ability students (Hambleton, 1989).  Each item on a test has its own item characteristic curve that describes the probability of getting each particular item right or wrong given the ability of the test takers (Kaplan & Saccuzzo, 1997) 9
  • 10.  A function of ability () – latent trait  Forms the boundary between the probability areas of answering an item incorrectly and answering the item correctly 10
  • 11. 11
  • 12. One dimension (Rasch Model) One parameter model = uses only the difficulty parameter  Two dimension  Two parameter Model = difficulty and ability parameter  Three dimension (Logistic Model) Three Parameter Model = item difficulty, item discrimination, and psuedoguessing 12
  • 13.  Mathematical model linking the observable dichotomously scored b data (item performance) a to the unobservable data (ability) c  Pi(θ) gives the probability of a correct response to item i as a function if ability (θ)  b is the probability of a b=item difficulty correct answer (1+c)/2 a=item discrimination c=psuedoguessing parameter
  • 14.  Two-parameter model: c=0  One-parameter model: a c=0, a=1 b
  • 15. Three items showing different item difficulties (b)
  • 16.  The calibration of test item difficulty is independent of the person used for the calibration.  The method of test calibration does not matter whose responses to these items use for comparison  It gives the same results regardless on who takes the test  The scores a person obtain on the test can be used to remove the influence of their abilities from the estimation of their difficulty. The result is a sample free item calibration. 16
  • 17. Rasch’s (1960) main motivation for his model was to eliminate references to populations of examinees in analyses of tests.  According to him that test analysis would only be worthwhile if it were individual centered with separate parameters for the items and the examinees (van der Linden & Hambleton, 2004). 17
  • 18. The Rasch model is a probabilistic unidimensional model which asserts that: (1) the easier the question the more likely the student will respond correctly to it, and (2) the more able the student, the more likely he/she will pass the question compared to a less able student. 18
  • 19.  The model was enhanced to assume that the probability that a student will correctly answer a question is a logistic function of the difference between the student's ability [θ] and the difficulty of the question [β] (i.e. the ability required to answer the question correctly), and only a function of that difference giving way to the Rasch model  Thus, when data fit the model, the relative difficulties of the questions are independent of the relative abilities of the students, and vice versa (Rasch, 1977). 19
  • 20. (1) Unidimensionality. All items are functionally dependent upon only one underlying continuum.  (2) Monotonicity. All item characteristic functions are strictly monotonic in the latent trait. The item characteristic function describes the probability of a predefined response as a function of the latent trait. 20
  • 21. (3) Dichotomy of the items. For each item there are only two different responses, for example positive and negative. The Rasch model requires that an additive structure underlies the observed data. This additive structure applies to the logit of Pij, where Pij is the probability that subject i will give a predefined response to item j, being the sum of a subject scale value ui and an item scale value vj, i.e. In (Pij/1 - Pij) = ui + vj 21
  • 22. Source: Magno, C. (2009). Demonstrating the difference between classical test theory and item response theory using derived data. The International Journal of Educational and Psychological Assessment, 1, 1-11.. 22
  • 23. Source: Magno, C. (2009). Demonstrating the difference between classical test theory and item response theory using derived data. The International Journal of Educational and Psychological Assessment, 1, 1-11. 23
  • 24. Source: Magno, C. (2009). Demonstrating the difference between classical test theory and item response theory using derived data. The International Journal of Educational and Psychological Assessment, 1, 1-11. 24
  • 25. Item Characteristic Curve (ICC) – Test Characteristics Curve (TCC)  Logit measures for each item  Item Information Function (IIF) – Test Information Function (TIF)  Infit measures 25
  • 26. TCC: Sum of ICC that make up a test or assessment and can be used to predict scores of examinees at given ability levels. TCC(Ѳ)=∑Pi(Ѳ)  Links the true score to the underlying ability measures by the test.  TCC shift to the right of the ability scale=difficult items
  • 27. Steeper slopes indicate greater discriminating ability  Flat slopes indicates weak discrimination ability 27
  • 28. Figure 4. Test Characteristic Curve of the PRPF for the Primary Rater Figure 5. Test Characteristic Curve of the Secondary Rater
  • 29. I(Ѳ), Contribution of particular items to the assessment of ability.  Items with higher discriminating power contribute more to measurement precision than items with lower discriminating power.  Items tend to make their best contribution to measurement precision around their b value.
  • 30. Tests with highly constrained TIF are imprecise measures of the for much of the continuum of the domain  Tests with TIF that encompass a large range provides precise scores along the continuum of the domain measured.  -2.00 SD units to +2.00 SD units – includes 95% of the possible values of the distribution. 30
  • 31. Figure 2. Test Information Function of PRPF for the Primary Raters Figure 3. Test Information Function of the PRPF of the Secondary Rater -4.00 SD to +4.00 SD units -4.00 SD to +4.00 SD units
  • 32.
  • 33. 1 2 2 1 2 3 0.8 1.5 0.6 4 1 1 0.4 0.2 0.5 3 4 0 0 –3 –2 –1 0 1 2 3 –3 –2 –1 0 1 2 3 Ability () Ability () Four item characteristic curves Item information for four test items Figure 6: Item characteristics curves and corresponding item information functions
  • 34. their corresponding IFF  The sum of item information functions in a test.  Higher values of the a parameter increase the amount of information an item provides.  The lower the c parameter, the more information an item provides.  The more information provided by an assessment at a particular level, the smaller the errors associated with ability estimation.
  • 35. 2 1.5 1 0.5 0 0 3 Ability () Figure 7: Test information function for a four–item test
  • 36. Item Analysis  Determining item difficulty (logit measure of + means an item is difficult, and – means easy).  Utilizing goodness-of-fit criteria to detect items that do not fit the specified response model (Z statistic, INFIT Mean square).  Item Selection  Assess the contribution of each items’ test information function that are independent of other items. 36
  • 37. Item Difficulty  MEASURE=logit measures of proportion correct  Negative values (-) item is easy  Positive values (+) item is difficult  Goodness of fit  Values of MNSQ INFIT within 0.8 to 1.2  Z standard scores of 2.o and below are acceptable  High values of item MNSQ indicate a “lack of construct homogeneity” with other items in a scale, whereas low values indicate “redundancy” with other items” (Linacre & Wright, 1998).  Item Discrimination  Point biserial estimate=close to 1.0 37
  • 38. Having more than 2 points in the responses (ex. 4 point scale)  Rating scale Model/polytomous Model (Andrich, 1978)  Partial Credit Model  Graded Response Model  Nominal model
  • 39.
  • 40. Item Response Thresholds  Logistic curves for each scale category  The extent to which the items response levels differ along the continuum of the latent construct (different of a response of “strongly agree” to “agree”).  Ideal to monotonic – the higher the scale, higher threshold values are expected.  Easier items have smaller response threshold than difficult items.  Threshold values that are very close means indistinguishable from each other. 40
  • 41. Example  Primary rater: -3.79, -1.95, .96, and 4.35,  Secondary rater: -3.90, -2.25, .32, and 3.60.
  • 42. 42 Magno, C. (2010). Looking at Filipino preservice teachers value for education through epistemological beliefs. TAPER, 19(1), 61-78.
  • 43.  Self-regulation is defined by Zimmerman (2002) as self-generated thoughts, feeling, and actions that are oriented to attaining goals.  Self-regulated learners are characterized to be “proactive in their efforts to learn because they are aware of their strengths and limitations and because they are guided by personally set goals and task-related strategies” (p. 66). 43
  • 44. Subprocesss of self-regulation (Zimmerman, 1986).  Metacognition (planning, organizing, self- instructing, monitoring, self-evaluating)  Motivation (competence, self-efficacy, autonomy)  Behavioral (select, structure, and optimize learning environments) aspects of learning.  Self-regulation structured interview – 14 questions (Zimmerman & Martinez-Pons, 1986) 44
  • 45. SRLIS  Reliability – percentage of agreement between 2 coders  Discriminant validity - high and low achievers were compared across the 14 categories.  Construct validity - self-regulated learning scores were used to predict scores of the students in the Metropolitan Achievement Tests (MAT) together with gender and socio-economic status of parents. 45
  • 46. To continue the development in the process of arriving at good measures of self- regulation.  A Polytomous Item Response Theory  This analysis allows reduction of item variances because the influence of person ability is controlled by having a separate calibration (Wright & Masters, 1982; Wright & Stone, 1979). 46
  • 47. Method  222 college students  SRLIS was administered to 1454  Responses were converted into items dpicting the 14 categories  Item review 47
  • 48. Principal components analysis: 7 factors were extracted that explains 42.54% of the total variance (55 items loaded highly >.4)  The seven factors were conformed (N=305)  All 7 factors were significantly correlated .  7-factor structure was supported: ▪ χ2=332.07, df=1409 ▪ RMS=.07 ▪ RMSEA=.06 ▪ GFI=.91, ▪ NFI=.89 48
  • 49. 49
  • 50. 50
  • 51. The average step calibrations for  Memory strategy are, -1.57, .25, 1.71, and 3.41  Goal setting, -3.19, -.92, 1.37, and 3.61  Self-evaluation, -2.71, -.59, 1.25, and 3.15  Seeking assistance, -2.70, -1.06, .41, and 2.30  Environmental structuring, 2.32, -.42, 1.40, and 3.47  Responsibility, -3.43, -1.20, .98, and 3.98  Organizing, -2.88, -.95, .79, and 2.76 51
  • 52. 52
  • 53. 53
  • 54. 54
  • 55. 3. I take my own notes in class 55
  • 56. 2. I isolate myself from unecessary noisy places 56
  • 57. 57
  • 58. 3. I put my notebooks, handouts, and the like in a certain container.  4. I study at my own pace. 58
  • 59. Item Analysis  Determining sample invariant item parameters.  Utilizing goodness-of-fit criteria to detect items that do not fit the specified response model (χ2, analysis of residuals).  Item Selection  Assess the contribution of each item the test information function independent of other items.
  • 60. Item banking  Test developers can build an assessment to fit any desired test information function with items having sufficient properties.  Comparisons of items can be made across dissimilar samples.
  • 61. Workshop 61