Charts from CBO's January 2012 Budget and Economic Outlook
•
4 likes•57,096 views


Recommended
Recommended
More Related Content
What's hot
What's hot (20)
Viewers also liked
Viewers also liked (13)
Similar to Charts from CBO's January 2012 Budget and Economic Outlook
Similar to Charts from CBO's January 2012 Budget and Economic Outlook (20)
More from Congressional Budget Office
More from Congressional Budget Office (20)
Recently uploaded
Recently uploaded (10)
Charts from CBO's January 2012 Budget and Economic Outlook
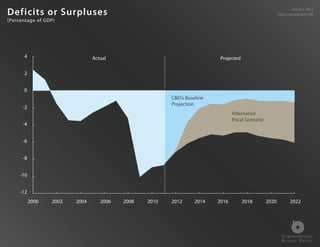
- 1. Def i cits or Surpluses January 2012 http://go.usa.gov/nPi (Percentage of GDP) 4 Actual Projected 2 0 CBO’s Baseline Projection -2 Alternative Fiscal Scenario -4 -6 -8 -10 -12 2000 2002 2004 2006 2008 2010 2012 2014 2016 2018 2020 2022 C ONGRESSIONAL B UDGET O FFICE
- 2. Congressional Budget O ice The Budget and Economic Outlook January 2012 The Budget Outlook
- 3. Def i cits or Surpluses Since 1946 January 2012 http://go.usa.gov/nPi (Percentage of GDP) 6 4 2 Projected 0 -2 -4 -6 -8 -10 -12 1946 1952 1958 1964 1970 1976 1982 1988 1994 2000 2006 2012 As a percentage of GDP, the federal budget will show a de cit of 7.0 percent in 2012, according to CBO’s current-law baseline, nearly 2 percentage points below the shortfall recorded last year but still higher (in percentage terms) than any de cit between 1947 and 2008. C ONGRESSIONAL B UDGET O FFICE
- 4. Outlays Recorded for the January 2012 http://go.usa.gov/nPi Troubled Asset Relief Program (Billions of dollars) 200 Actual Projected 150 100 2009 50 0 2012 2011 -50 2010 -100 -150 Adjustments to the estimated costs of the TARP have had a signi cant impact on budget de cits since 2009. Initial estimates of the cost of transactions in 2009 under the program turned out to be too high and were reduced in both 2010 and 2011. Adjustments recorded in 2012 will increase the de cit by $23 billion, CBO estimates. C ONGRESSIONAL B UDGET O FFICE
- 5. Def i cits or Surpluses, Historically and January 2012 http://go.usa.gov/nPi As Projected in CBO’s Baseline and Under an Alternative Fiscal Scenario (Percentage of GDP) 4 Actual Projected 2 0 CBO’s Baseline Projection -2 -4 -6 Alternative -8 Fiscal Scenario -10 -12 1972 1977 1982 1987 1992 1997 2002 2007 2012 2017 2022 Under current law, CBO projects that de cits will drop markedly, averaging only 1.5 percent of GDP over the 2013-2022 period. But under an alternative scal scenario, in which some changes speci ed in current law would not occur and certain current policies would continue instead, annual de cits from 2013 through 2022 would be much higher—averaging 5.4 percent of GDP. C ONGRESSIONAL B UDGET O FFICE
- 6. Def i cits Projected in CBO’s Baseline and Under an January 2012 http://go.usa.gov/nPi Alternative Fiscal Scenario (Percentage of GDP) 8 7 6 Additional Debt Service 5 Prevent Spending Cuts 4 3 Extend Tax Policies 2 1 Baseline 0 2012 2013 2014 2015 2016 2017 2018 2019 2020 2021 2022 Preventing certain spending cuts scheduled under current law (the automatic spending reductions scheduled for 2013 and reductions in Medicare's payment rates for physicians) and extending certain expiring or recently expired tax provisions would boost de cits substantially relative to the baseline. C ONGRESSIONAL B UDGET O FFICE
- 7. Federal Debt Held by the Public, Historically and January 2012 http://go.usa.gov/nPi As Projected in CBO’s Baseline and Under an Alternative Fiscal Scenario (Percentage of GDP) 140 Actual Projected 120 Alternative 100 Fiscal Scenario 80 60 CBO’s Baseline Projection 40 20 0 1940 1945 1950 1955 1960 1965 1970 1975 1980 1985 1990 1995 2000 2005 2010 2015 2020 With modest de cits anticipated for much of the 10-year projection period of CBO’s current-law baseline, debt held by the public recedes as a percentage of GDP. However, if some of the changes speci ed in current law did not occur and certain current policies were continued instead, debt held by the public would rise to 94 percent of GDP by the end of 2022, the highest gure since just C ONGRESSIONAL B UDGET O FFICE after World War II.
- 8. Congressional Budget O ice The Budget and Economic Outlook January 2012 The Economic Outlook
- 9. Real Gross Domestic Product January 2012 http://go.usa.gov/nPi ( Trillions of 2005 dollars) 18 Actual Projected 16 Potential GDP 14 GDP 12 10 8 0 2000 2002 2004 2006 2008 2010 2012 2014 2016 2018 Although CBO projects the growth in real (in ation-adjusted) GDP to pick up after 2013, the agency expects that the economy’s output will remain below its potential—a level that corresponds to a high rate of use of labor and capital—until the rst half of 2018. C ONGRESSIONAL B UDGET O FFICE
- 10. Gap Between GDP and Potential GDP January 2012 http://go.usa.gov/nPi ( Trillions of 2005 dollars) 0.4 Actual Projected 0.2 $2.6 $3.1 Trillion Trillion 0 -0.2 -0.4 -0.6 -0.8 -1.0 -1.2 2000 2002 2004 2006 2008 2010 2012 2014 2016 2018 A large portion of the economic and human costs of the recession and slow recovery remains ahead. From the rst quarter of the recession through the third quarter of 2011, the cumulative di erence between GDP and estimated potential GDP amounted to $2.6 trillion; by the time the nation’s output rises back to its potential level, the cumulative shortfall is expected to equal $5.7 trillion C ONGRESSIONAL B UDGET O FFICE (the tan-shaded areas in the chart).
- 11. Unemployment Rate January 2012 http://go.usa.gov/nPi (Percent) 12 Actual Projected 10 8 6 4 2 0 1972 1977 1982 1987 1992 1997 2002 2007 2012 2017 2022 In CBO’s forecast, the unemployment rate in 2012 and 2013 remains largely unchanged from its value last year. However, in the forecast, as growth picks up after 2013, the unemployment rate falls to 6.9 percent by the end of 2015 and 5.6 percent by the end of 2017. C ONGRESSIONAL B UDGET O FFICE
- 12. In ation January 2012 http://go.usa.gov/nPi (Percentage change in prices from previous year) 12 3.5 Actual Projected Actual Projected 3.0 10 2.5 2.0 8 1.5 6 1.0 0.5 4 Overall Core 0 2010 2011 2012 2013 2 0 1972 1977 1982 1987 1992 1997 2002 2007 2012 2017 2022 According to the agency’s projections, the price index for personal consumption expenditures (PCE) will increase by 1.2 percent in 2012 (as measured by the change from the fourth quarter of the previous year) and by 1.3 percent in 2013. The core PCE price index—which excludes prices for food and energy—is projected to increase by a similar amount. C ONGRESSIONAL B UDGET O FFICE
- 13. Interest Rates January 2012 http://go.usa.gov/nPi (Percent) 16 Actual Projected 14 12 10 10-Year Treasury Notes 8 6 4 2 3-Month Treasury Bills 0 1972 1977 1982 1987 1992 1997 2002 2007 2012 2017 2022 CBO projects that interest rates will remain very low for the next several years and then will rise to more-normal levels as output approaches its potential. C ONGRESSIONAL B UDGET O FFICE
- 14. Vacant Housing Units January 2012 http://go.usa.gov/nPi (Percentage of total units) 16 14 12 10 8 0 1966 1971 1976 1981 1986 1991 1996 2001 2006 2011 The number of vacancies remains very high. For that reason, among others, CBO projects weak near-term growth in residential investment. C ONGRESSIONAL B UDGET O FFICE
- 15. Net Business Fixed Investment January 2012 http://go.usa.gov/nPi (Percentage of GDP) 6 Actual Projected 5 4 3 2 2.2% 1958 1.8% 1.7% 1992 2003 1 0.6% 2009 0 1950 1960 1970 1980 1990 2000 2010 2020 CBO’s forecast of solid growth in business investment in structures, equipment, and software, especially after 2013, re ects the very low level of net investment (gross investment minus depreciation) in those items relative to GDP. C ONGRESSIONAL B UDGET O FFICE
- 16. Labor Income January 2012 http://go.usa.gov/nPi (Percentage of gross domestic income) 70 Actual Projected 65 61.6 60.1 60 59.6 55 50 0 1972 1977 1982 1987 1992 1997 2002 2007 2012 2017 2022 Labor income has fallen sharply as a share of gross domestic income (GDI) since 2009. In CBO’s projections, labor income grows faster than GDI over the next decade, bringing its share from about 59 percent of GDI in late 2011 to about 62 percent by 2022, approaching its historical average since 1980. C ONGRESSIONAL B UDGET O FFICE
- 17. Economic Growth in the United States and Among January 2012 http://go.usa.gov/nPi Its Leading Trading Partners (Percentage change from same quarter of previous year) 6 Actual Projected 5 4 Leading Trading Partners 3 2 United States 1 0 2010 2012 2014 2016 2018 2020 2022 CBO expects that an increase in real net exports will make a small contribution to the growth of real GDP this year and next, on average. A primary reason for that projection is that average growth among the nation’s leading trading partners will probably be stronger than that in the United States over the period. C ONGRESSIONAL B UDGET O FFICE
- 18. Congressional Budget O ice The Budget and Economic Outlook January 2012 The Spending Outlook
- 19. Outlays Projected in CBO’s Baseline and Under an January 2012 http://go.usa.gov/nPi Alternative Fiscal Scenario (Percentage of GDP) 28 Actual Projected 26 Alternative Fiscal Scenario 24 22 CBO’s Baseline 20 Projection 18 16 14 0 1972 1977 1982 1987 1992 1997 2002 2007 2012 2017 2022 In CBO’s baseline, annual spending averages 21.9 percent of GDP from 2013 through 2022, a percentage that is elevated by historical standards. Under an alternative scal scenario, in which some changes speci ed in current law would not occur and certain current policies would continue instead, outlays between 2013 and 2022 would be higher by 1.4 percent, or $2.9 trillion, than those presented C ONGRESSIONAL in the baseline. B UDGET O FFICE
- 20. Outlays, by Category January 2012 http://go.usa.gov/nPi (Percentage of GDP) 16 Actual Projected 14 Mandatory 12 10 8 6 Discretionary 4 2 Net Interest 0 1972 1977 1982 1987 1992 1997 2002 2007 2012 2017 2022 In CBO’s baseline projections, the biggest di erence in federal spending relative to GDP in the coming decade—as compared with outlays over the past 40 years—will be the widening gap between mandatory and discretionary spending. C ONGRESSIONAL B UDGET O FFICE
- 21. Outlays for Income Security Programs January 2012 http://go.usa.gov/nPi (Billions of dollars) 500 Actual Projected 400 300 Unemployment Compensation Refundable Tax Credits 200 Supplemental Nutrition Assistance Program 100 Other Income Security Programs 0 2005 2006 2007 2008 2009 2010 2011 2012 2013 2014 2015 Federal spending for income security programs peaked in 2010 at $438 billion; in contrast, such spending totaled $202 billion in 2007, before the economic downturn. The surge in spending occurred partly because outlays for many of those programs tend to rise automatically when the economy falters (and ebb later as the economy recovers) and partly because lawmakers enacted temporary C ONGRESSIONAL measures to augment payments to needy populations. B UDGET O FFICE
- 22. Outlays for Unemployment Bene ts January 2012 http://go.usa.gov/nPi (Billions of dollars) (Percent) 180 12 Actual Projected 160 10 140 120 8 Emergency Unemployment Rate Bene ts and 100 (Right scale) Federal Additional 6 Compensation 80 60 4 40 Regular and 2 20 Extended Bene ts 0 0 2000 2001 2002 2003 2004 2005 2006 2007 2008 2009 2010 2011 2012 2013 2014 2015 Since late 2008, spending for unemployment compensation has been boosted signi cantly by changes in law that temporarily provide additional bene ts to people who have been out of work for more than 26 weeks. Payments for those temporary programs will start to phase out in March 2012 under current law. C ONGRESSIONAL B UDGET O FFICE
- 23. Discretionary Outlays, by Category January 2012 http://go.usa.gov/nPi (Percentage of GDP) 12 Actual Projected Total Discretionary 10 8 Defense 6 4 Nondefense 2 0 1972 1977 1982 1987 1992 1997 2002 2007 2012 2017 2022 Discretionary outlays declined from about 10 percent of GDP during much of the 1970s and 1980s to 6.2 percent in 1999. Those outlays then began to increase again relative to the size of the economy, reaching 7.0 percent of GDP in 2002 and 7.9 percent in 2008. In 2009, 2010, and 2011, such outlays were 8.8, 9.3, and 9.0 percent of GDP, respectively. By 2022, under current law, those outlays will have C ONGRESSIONAL B UDGET O FFICE fallen to 5.6 percent of GDP, CBO projects.
- 24. Congressional Budget O ice The Budget and Economic Outlook January 2012 The Revenue Outlook
- 25. Revenues Projected in CBO’s Baseline and January 2012 http://go.usa.gov/nPi Under an Alternative Fiscal Scenario (Percentage of GDP) 28 Actual Projected 26 24 22 Average, CBO’s Baseline 1972-2011 Projection 20 (17.9%) 18 Alternative Fiscal Scenario 16 14 0 1972 1977 1982 1987 1992 1997 2002 2007 2012 2017 2022 CBO projects that under current law, total revenues as a percentage of GDP will rise from their recent unusually low levels to well above their historical average of about 18 percent of GDP. Under an alternative scal scenario, in which some changes speci ed in current law would not occur and certain current policies would continue instead, projected revenues would be near their historical average. C ONGRESSIONAL B UDGET O FFICE
- 26. Revenues, by Major Source January 2012 http://go.usa.gov/nPi (Percentage of GDP) 12 Actual Projected 10 Individual Income Taxes 8 6 Social Insurance (Payroll) Taxes 4 Corporate Income Taxes 2 Other Revenue Sources 0 1972 1977 1982 1987 1992 1997 2002 2007 2012 2017 2022 Individual income taxes have uctuated more over the past 40 years than the other major revenue sources—ranging from 6.3 percent to 10.2 percent of GDP but showing no clear trend over that period. C ONGRESSIONAL B UDGET O FFICE
- 27. Average Corporate Tax Rate and Corporations’ January 2012 http://go.usa.gov/nPi Domestic Economic Pro ts (Percent) 50 Actual Projected 40 Annual Average Tax Rate (Corporate receipts as a Average Tax Rate percentage of domestic 1987-2008 economic pro ts) (25.6%) 30 20 Domestic Economic Pro ts (As a percentage of gross domestic product) 10 0 1972 1977 1982 1987 1992 1997 2002 2007 2012 2017 2022 The average tax rate on corporations’ domestic economic pro ts (taxes as a percentage of pro ts) has been unusually low in recent years. CBO expects that by 2014, that rate will rise to around the 25.6 percent average seen over the 1987–2008 period. C ONGRESSIONAL B UDGET O FFICE
- 28. Selected Major Tax Expenditures in 2012, Compared January 2012 http://go.usa.gov/nPi with Other Categories of Revenues and Outlays (Percentage of GDP) 8 Revenues Outlays 6 Payroll Tax Expenditures 4 Individual Income Tax Expenditures 2 0 Individual Social Corporate Income Selected Major Medicare Defense Social Income Taxes Insurance Taxes and Tax Expenditures Security Taxes Other Revenues In 2012, major tax exclusions, deductions, and other tax expenditures will total 5.3 percent of GDP, CBO projects—equal to about one-third of projected revenues for the year and greater than projected spending on Social Security, defense, or Medicare. C ONGRESSIONAL B UDGET O FFICE
- 29. E ects of Selected Major Tax Expenditures January 2012 http://go.usa.gov/nPi from 2013 to 2022 Exclusion of Employers’ Contributions for Health Care, Health Insurance Premiums, Individual Income Tax E ect Payroll Tax E ect and Long-Term Care Insurance Premiums Net Exclusions of Pension Contributions and Earnings Income Exclusions Exclusion of Capital Gains at Death Exclusion of Untaxed Social Security and Railroad Retirement Bene ts Deduction for Mortgage Interest on Owner-Occupied Residences Deductions Deduction for State and Local Taxes Deduction for Charitable Contributions Reduced Tax Rates on Dividends and Long-Term Capital Gains Preferential Rates Earned Income Tax Credit Credits Child Tax Credit 0 0.2 0.4 0.6 0.8 1.0 1.2 1.4 1.6 1.8 2.0 Percentage of Gross Domestic Product The exclusion of employers’ health insurance contributions is the single largest tax expenditure in the individual income tax code. Including e ects on payroll taxes, it is projected to equal 1.8 percent of GDP between 2013 and 2022. C ONGRESSIONAL B UDGET O FFICE