LegFin: Preliminary Overview of the Governor's FY22 Budget (1.8.2021)
Gujrat
1. Planning Commission
(Financial Resources Division)
State: Gujarat
A. Economic Profile of Gujarat
Annex-I contains Tables 1 to 5. Table 1 compares the growth performance of
Gujarat with its neighboring States. Table 2 compares the per capita GSDP of Gujarat
with its neighboring States and All India average. Table 3 gives the trends in sector-
wise growth of the State. Table 4 & 5 present the credit deposit profile of Gujarat
and its neighboring States and All-India.
B. Fiscal Overview of Gujarat
Annex-II contains Table 6 to 11. Table 6 presents the trends in different
deficits, outstanding liabilities and total expenditure of the State as % of GSDP of the
State. Table 7 indicates the trends of State’s Own Tax Revenue – GSDP ratio of
Gujarat and its neighboring States. Table 8 compares the Public Expenditure ratio of
Gujarat with its neighboring States. Table 9 shows the Social Allocation ratio of
Gujarat with its neighboring States. Table 10 presents per capita Revenue Receipts
(RR), Plan Expenditure and expenditure of the State. Table 11 provides the financial
overview of the State.
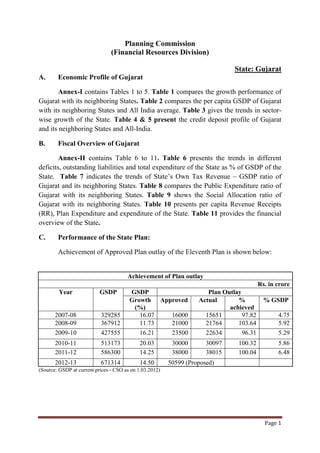
C. Performance of the State Plan:
Achievement of Approved Plan outlay of the Eleventh Plan is shown below:
Achievement of Plan outlay
Rs. in crore
Year GSDP GSDP Plan Outlay
Growth Approved Actual % % GSDP
(%) achieved
2007-08 329285 16.07 16000 15651 97.82 4.75
2008-09 367912 11.73 21000 21764 103.64 5.92
2009-10 427555 16.21 23500 22634 96.31 5.29
2010-11 513173 20.03 30000 30097 100.32 5.86
2011-12 586300 14.25 38000 38015 100.04 6.48
2012-13 671314 14.50 50599 (Proposed)
(Source: GSDP at current prices - CSO as on 1.03.2012)
Page 1
2. D. Assumptions for Annual Plan 2012-13
Assumptions underlying the state government projection of resources for the
Annual Plan 2012-13 are as follows:
Indicators % increase in 2012-13 over 2011-12 LE
GDP growth (nominal prices) 14.50%
Rate of Growth of share in Central Taxes 14.66%
Rate of growth of SOTR 23.45%
Annual growth in own non-tax revenues 19.15%
Interest payments 13.84%
Annual growth in pensions 4.45%
Annual growth in salaries 8.50%
E. The details of Plan grants and Non-Plan grants as rewarded by 13th Finance
Commission are given in the following table:
State:Gujarat
Rs. in crore
(A) Non-Plan Grant 2011-12 2012-13
1 Local Bodies 548.3 802.3
2 Disaster Relief (including for capacity building) 401.42 421.19
3 Post Devolution Non-Plan Revenue Deficit 0 0
4 Performance Incentive 0 0
5 Environment-Water Sector Management 59 59
6 Governance
a) Improvement in Supply of Justice 59.95 59.95
b) Improvement of Statistical Systems at State and District Level 5.2 5.2
c) Employee and Pension Data Base 0 0
7 Maintenance of Roads and Bridges 287 304
Sub-Total 1360.87 1651.64
(B) Plan Grant
1 Elementary Education 85 98
2 Environment-
a) Forest Protection 10.24 20.48
b) Renewable Energy
3 Governance
a) Reduction in Infant Mortality Rates
b) Incentive for issuing UIDs 18.14 18.14
c) District Innovation Fund 13 0
4 State-specific 325 325
Sub-Total 451.38 461.62
Grand Total 1812.25 2113.26
Page 2
3. F. Scheme of Financing Annual Plan 2012-13
Draft scheme of financing Annual Plan 2012-13 is given at Annex-III and
estimates of BCR are at Annex-V. Share of Central Taxes has been incorporated as
per allocation of the Central Budget 2011-12. Normal Central Assistance has been
worked out based on Gadgil-Mukherjee formula. Scheme wise ACAs have been
projected individually at Annex-IV.
G. PSE Plan
The State Government has indicated resources of PSE Plan at Rs. 9000.00
crore for 2012-13. The resources for the entire PSE’s Plan is to be mobilized from
Extra Budgetary Resources (EBR).
H. ACA for EAPs
State Government has proposed Rs.254.87 crore for Externally Aided Projects
(EAPs) including loan of Rs.2.87 crore for normal EAPs and Rs.252.00 crore for
EAPs (back to back) for Annual Plan 2012-13.
I. Issues pertaining to State Finances
Desired Plan Size:
The desired Plan size for 2012-13 as per document provided by the State Government
is of Rs.50599.00 crore which indicates an increase of 33.15% over the approved Plan
size of 2011-12. As against the desired Plan size of Rs.50599.00 crore, resources are
estimated at the same level. This is without one time ACA.
Borrowing Ceiling: MOF has set the borrowing limit for Gujarat for 2012-13 at
Rs.20201.00 crore. Against this borrowing ceiling, the State Government has
estimated the budgetary borrowing for the Annual Plan 2012-13 at Rs.16387.12 crore.
Thus, the budgetary borrowing of the State has been kept well below the level
indicated by Ministry of Finance. This available fiscal space may be utilized to bridge
the resource gap along with some addition from onetime ACA.
11th Plan Achievement: The projected Outlay for 11th Plan for Gujarat was Rs.
106918.00 crore. The financial achievement in the 11th Plan has been Rs. 101736.56
crore at 2006-07 prices. The achievement of the 11th Plan has been, therefore, about
95.15% of the targeted outlay.
Page 3
4. Basis for estimating scheme wise ACA :
o AIBP: The allocation of ACA under AIBP for 2012-13 is fixed at Rs.1255
crore. It was earmarked at Rs. 2000.00 crore in the Annual Plan 2011-12.
o Roads & Bridges: The allocation for Road & Bridges is fixed at Rs.139.42
crore for Annual Plan 2012-13.
o RKVY: The allocation under RKVY is fixed at Rs.602.94 crore for Annual
Plan 2012-13 against Rs. 561.49 crore earmarked in the Annual Plan 2011-12.
o NSAP: The allocation under NSAP is fixed at Rs.166.50 crore for Annual Plan
2012-13 against the allocation of Rs. 89.98 crore in the Annual Plan 2011-12.
o BADP: The allocation under BADP is fixed at Rs.45.80 crore for Annual Plan
2012-13. It was Rs.41.64 crore in the Annual Plan 2011-12.
o Ne-GAP: The allocation under Ne-GAP is fixed at Rs.9.97 crore for Annual
Plan 2012-13.
o ACAs for other schemes are enhanced or provided proportionately to the
increase/decrease in the allocation of Union Budget 2012-13.
OTACA: One time ACA allocated to the State since 2003-04 are as follows
(Rs Crore)
Year 2003-04 2004-05 2005-06 2006-07 2007-08 2008-09 2009-10 2010-11 2011-12
Onetime 18.00 26.02 15.00 24.00 27.00 39.00 45.00 63.00 70.00
ACA (60.00) (86.74) (50.00) (80.00) (90.00) (130.00) (150.00) (147.00) (233.33)
Note: Onetime ACA including loan component is indicated in parentheses.
Page 4
5. Annex-I
Economic Profile of Gujarat
(i) Growth rate trend (2005-06 to 2010-11)
(per cent)
Table-1: Growth Rates of GSDP at constant prices
States 2005-06 2006-07 2007-08 2008-09 2009-10 2010-11
Gujarat 14.95 8.39 11 6.78 10.1 10.47
Maharashtra 14.49 14.13 10.78 3.38 13.28 10.47
Madhya Pradesh 5.31 9.23 4.69 12.37 10.5 8.17
Rajasthan 6.68 11.67 5.14 9.09 5.52 10.97
All India 9.48 9.57 9.32 6.72 8.39 8.39
Source: CSO as on 1.03.2012
(ii) Per Capita NSDP
(In Rupees)
Table-2: Per capita NSDP ( at Constant 2004-05 prices )
States 2005-06 2006-07 2007-08 2008-09 2009-10 2010-11
Gujarat 36102 38568 42498 43685 48511 52708
Maharashtra 40947 46158 50532 51053 57458 62729
Madhya Pradesh 15927 17073 17572 19442 21095 22382
Rajasthan 19445 21342 21922 23356 24166 26436
All India 26015 28067 30332 31754 33843 35993
Source: CSO as on 1.03.2012
(iii) Sectoral Growth Rate
(per cent)
Table-3 :Sectoral growth rate (Real) of GSDP
Sector 2005-06 2006-07 2007-08 2008-09 2009-10 2010-11
Agr. & allied 23.10 -0.73 8.73 -7.17 0.49 14.41
Industry 14.63 9.43 10.81 6.52 15.03 8.97
Services 12.25 11.09 12.00 11.88 8.62 10.79
Total 14.95 8.39 11.00 6.78 10.10 10.47
Source: CSO at 2004-05 prices
Page 5
6. (iv) Credit Deposit Ratio
Table-4 :Credit Deposit Ratio of the state
Rs.in crore
2000 2001 2002 2003 2004 2005 2006 2007 2008 2009 2010 2011
Deposit 48327 55049 65284 72101 84550 97688 105120 119989 150593 186882 216470 261485
Credit 23680 26702 28820 32336 35713 45390 58462 76404 100195 119008 141316 173432
CD ratio 49.00 48.51 44.15 44.85 42.24 46.46 55.61 63.68 66.53 63.68 65.28 66.33
ROG(deposit) 17.81 13.91 18.59 10.44 17.27 15.54 7.61 14.14 25.51 24.10 15.83 20.80
ROG(credit) 18.35 12.76 7.93 12.20 10.44 27.10 28.80 30.69 31.14 18.78 18.74 22.73
Source: RBI, Note -Year refers to financial year ending march, 31
Table-5 :Credit Deposit Ratio of the state including neighboring states
percent
States 2000 2001 2002 2003 2004 2005 2006 2007 2008 2009 2010 2011
Gujarat 49.00 48.51 44.15 44.85 42.24 46.46 55.61 63.68 66.53 63.68 65.3 66.30
Maharashtra 86.39 86.38 92.29 93.71 81.78 94.91 102.24 96.81 93.89 91.22 82.90 81.30
Madhya Pradesh 49.09 47.61 46.59 46.55 46.87 54.66 60.53 62.00 60.14 57.40 60.60 59.70
Rajasthan 46.70 46.63 48.42 50.84 55.75 68.68 77.26 83.00 82.35 80.62 88.40 90.00
All India 56.01 56.71 58.39 59.24 58.25 65.98 72.39 74.97 74.37 72.61 73.3 75.10
Source: RBI, Note - Year refers to financial year ending march, 31
Page 6
7. Annex-II
Fiscal Overview of Gujarat
(i) Fiscal Parameters
Table 6: Fiscal profile of the State (as % of GSDP at current prices)
Indicator 2007-08 2008-09 2009-10 2010-11 2011-12
BE
Fiscal Deficit -1.24 -2.60 -3.58 -2.52 -2.44
Revenue Deficit 0.86 0.22 -1.66 -0.57 0.08
Primary Deficit 1.03 -0.45 -1.57 -0.65 -0.60
OL 26.87 28.72 27.86 26.36 23.07
IP/RR 21.18 20.60 21.38 18.57 18.14
Source: GSDP - CSO as on 1.03.2012. Note: (-) represents deficit and (+) represents surplus
(ii) State’s Own Tax Revenue (SOTR)
Table-7:SOTR as % to GSDP at current prices
States 2007-08 2008-09 2009-10 2010-11 2011-12
BE
Gujarat 6.65 6.40 6.25 7.08 6.66
Maharashtra 7.00 6.88 6.56 7.29 7.13
Madhya Pradesh 7.44 6.93 7.61 8.24 8.01
Rajasthan 6.81 6.47 6.24 6.41 5.92
Source: GSDP - CSO as on 1.03.2012
(iii) Public Expenditure Ratio
Table-8: Public Expenditure as % to GSDP at current prices
States 2007-08 2008-09 2009-10 2010-11 2011-12
Gujarat 12.07 13.06 13.04 12.70 12.60
Maharashtra 11.41 12.67 12.60 12.18 12.34
Madhya Pradesh 20.80 19.38 20.99 22.13 22.82
Rajasthan 18.46 17.55 17.40 15.57 16.79
Source: GSDP– CSO as on 1.03.2012
Note: Public expenditure ratio= the percentage of public expenditure (plan + non-plan) to GSDP.
Page 7
8. (iv) Social Allocation Ratio
Table-9 : Social Allocation Ratio* of the state including neighboring state
(Per cent)
State 2002-03 2003-04 2004-05 2005-06 2006-07 2007-08 2008-09 2009-10 2010-11
(RE) (BE)
Gujarat 30.4 27.3 29.0 32.1 33.4 34.9 35.0 38.6 38.6
Madhya Pradesh 37.7 28.4 24.7 32.5 35.3 35.7 36.7 36.7 39.5
Maharashtra 33.3 30.9 28.1 35.3 37.3 37.0 36.8 42.3 44.3
Rajasthan 37.3 35.7 34.1 40.1 39.5 38.9 45.2 44.8 42.4
All States 32.6 28.4 29.6 33.7 33.9 35.3 37.6 39.1 39.2
*The Social Allocation Ratio=the percentage of Public Expenditure(Plan + Non-Plan) earmarked for social services
Source: RBI-Budget Documents of the State Governments.
(v) Per Capita Profile
(In Rupees)
Table-10 :Per capita Profile Of Gujarat (at current prices)
Year 2007-08 2008-09 2009-10 2010-11 2011-12
BE
Per Capita Total Expenditure 7119.87 8482.21 9706.87 11189.33 12513.79
Per Capita Revenue Receipts 6330.79 6759.53 6994.41 8902.02 10048.95
Per Capita Plan Exp. 2625.34 3665.27 3771.54 4430.26 5311.84
Per Capita SOTR 3921.48 4160.05 4655.82 6240.32 6615.71
Per Capita GSDP 59003.19 64972.27 74442.84 88125.60 99339.23
Page 8
9. (vi) Financial Overview
Rs. in crore
Sl. Item Eleventh Plan
No 2007-08 2008-09 2009-10 2010-11 2011-12
B.E.
1 2 3 4 5 6 7
1 Tax Revenue 27311.66 29282.89 32631.15 43018.07 46318.90
1a State's Own Tax Revenue 21885.01 23556.70 26740.25 36338.63 39045.90
1b Share in Central Taxes 5426.65 5726.19 5890.90 6679.44 7273.00
2 Non Tax Revenue 8019.21 8993.63 7540.53 8820.20 12990.03
2a State's Own Non Tax Revenue 4250.33 4700.13 4984.48 4389.65 5438.63
2b Grants 3768.88 4293.50 2556.05 4430.55 7551.40
3 Total Revenue Receipts 35330.87 38276.52 40171.68 51838.27 59308.93
4 Non Debt Capital Receipts 308.47 201.71 286.97 374.28 268.35
5 Total Receipts 35639.34 38478.23 40458.65 52212.55 59577.28
6 Revenue Expenditure of 32504.80 37457.84 47276.13 54786.15 58865.49
which
i) Subsidies
6a Plan Expenditure of which 7600.05 10385.65 13478.62 15658.56 16625.41
i) Salaries
6b Non Plan Revenue 24904.75 27072.19 33797.51 39127.59 42240.08
Expenditure of which
i) Interest Payments 7484.45 7884.05 8590.09 9627.32 10760.61
ii) Pensions 2979.38 2962.81 4513.00 5779.43 5370.52
iii) Salaries 7353.21 7353.21 7353.21 15205.33 16791.54
vi) Others 7087.71 8872.12 13341.21 8515.51 9317.41
7 Capital Expenditure ( 8+9 ) 7229.79 10573.50 8474.33 10371.55 14990.89
7a Plan ( 8a + 9a ) 7051.43 10369.33 8182.84 10139.71 14725.06
7b Non Plan ( 8b + 9b ) 178.36 204.17 291.49 231.84 265.83
8 Capital Outlay 6801.03 10219.76 8046.73 9683.55 14271.48
8a Plan 6669.71 10087.24 7832.46 9512.54 14075.89
8b Non Plan 131.32 132.52 214.27 171.01 195.59
9 Loans & Advances ( 9a+9b ) 428.76 353.74 427.60 688.00 719.41
9a Plan 381.72 282.09 350.38 627.17 649.17
9b Non Plan 47.04 71.65 77.22 60.83 70.24
10 Total Expenditure ( 6+7 ) 39734.59 48031.34 55750.46 65157.70 73856.38
10a Plan ( 6a+7a ) 14651.48 20754.98 21661.46 25798.27 31350.47
10b Non Plan ( 6b+7b ) 25083.11 27276.36 34089.00 39359.43 42505.91
11 Revenue Deficit ( 3-6 ) 2826.07 818.68 -7104.45 -2947.88 443.44
12 Fiscal Deficit ( 11-7+4 ) -4095.25 -9553.11 -15291.81 -12945.15 -14279.10
13 Primary [12+6(b)(i)] 3389.20 -1669.06 -6701.72 -3317.83 -3518.49
14 Total Outstanding Liabilities 88491.00 105651.00 119115.00 135256.00 135256.00
(at the end of the year)
Page 9
10. Annex-II(A)
Release of Central Funds for Plan Schemes to
Gujarat in 2011-2
Rs. in crore
1 Central Assistance to State Plan 2151.14
2 Centrally Sponsored Schemes 5599.16
Total 7750.30
Page 10
11. Annex-III
Scheme of Financing for the Annual plan 2012-13
(Rs. in crore)
Sl. No. Item Annual Plan
2011-12 2011-12 2012-13 2012-13
A.P. R.E. B.E FR. Est.
1 2 3 4 5
A. States Government Resources (1+2+3) 34457.00 34088.48 42052.98 41599.00
1 States Own Resources 14496.20 16594.81 21266.20 21616.76
a Balance from Current Revenues 14428.31 15012.48 18648.26 18620.91
b Miscellaneous Capital Receipts (Net) -1525.49 1130.95 2156.32 2156.32
c Plan Grants under TFC (a+b) 451.38 451.38 461.62 461.62
d ARM 1142.00 0.00 0.00 0.00
e Adjustment of opening balance 0.00 0.00 0.00 377.91
2 State Borrowings (i-ii) 15489.79 14367.16 16387.12 16387.12
(i) Gross Borrowings ( a to g) 20293.85 19169.87 22839.12 22839.12
a State Provident Fund -465.00 660.00 729.25 729.25
b Net Small Savings 5000.00 500.00 2000.00 2000.00
c Gross Market Borrowings 14249.98 16500.00 18600.00 18600.00
d Negotiated loans 1254.00 1254.00 1254.00 1254.00
e Bonds/Debentures (Non-SLR Based) 0.00 0.00 0.00 0.00
f Loans potion of ACA for EAPs 2.87 2.87 2.87 2.87
g Loans for EAPs 252.00 252.00 252.00 252.00
h Other Loans 0.00 1.00 1.00 1.00
(ii) Repayment 4804.06 4802.71 6452.00 6452.00
3 CENTRAL ASSISTANCE (a+b+c) 4471.01 3126.51 4399.66 3595.12
a Normal Central Assistances 392.53 392.53 392.53 443.39
b ACA for Externally Aided Projects 1.35 1.35 0.00 0.00
c Others 4077.13 2732.63 4007.13 3151.73
B. Resources of Public Sector Enterprises
a Internal Resources
b Extra Budgetary Resources 5742.00 6612.00 9000.00 9000.00
c Budgetary support
Total ( a+b+c ) 5742.00 6612.00 9000.00 9000.00
C. Resources of Local Bodies
(i) Urban Local Bodies
Total ( a+b+c ) 0.00 0.00 0.00 0.00
(ii) Rural Local Bodies
Total ( a+b+c ) 0.00 0.00 0.00 0.00
Total -C. Local Bodies ( i+ii ) 0.00 0.00 0.00 0.00
D. Aggregate Plan Resources ( A +B+C ) 40199.00 40700.48 51052.98 50599.00
Page 11
12. Annex-IV
ACA Components of other Schemes/Programmes for
Annual Plan 2011-12
(Rs. in crore)
Sl. No. ITEMS 2011-12 2012-13
AP Estimated
1 AIBP 2000.00 1255.00
2 JNNURM 900 628.27
3 NSAP 89.98 166.50
4 NPAG
5 BADP 41.64 45.80
6 APDRP
7 Roads and Bridges 132.58 139.42
8 RSVY/BRGF 107.31 115.64
9 TSP 68.53 84.48
10 RKVY 561.49 602.94
11 NE-GAP 11.7 9.97
12 Grants Under Article 275 (1) 93.9 103.71
13 Onetime ACA 70.00
Total 4077.13 3151.73
Page 12
13. Annex-V
Balance from Current Revenues for Annual Plan 2012-13
(Rs. in crore)
Sl. Items XII Plan Annual Plan
No Proj. at 2007-08 2008-09 2009-10 2010-11 2011-12 2012-13 2012-13
. 2010-11 Actual Actual Actual Actual R.E. B.E FR Est.
prices
1 2 3 4 5 6 7 8 9
I. Non-Plan Revenue Receipts 412619.20 32358.76 35359.42 38383.98 48180.12 56072.79 68350.61 68323.26
( 1 to 4 )
1 Share in Central Taxes 62214.06 5426.65 5726.19 5890.90 6679.44 8023.75 9227.31 9199.91
2 State's own Tax Revenue 302720.09 21885.01 23556.70 26740.25 36338.63 41498.65 51231.21 51231.21
3 State's own Non Tax 35964.46 4250.33 4700.13 4984.48 4389.65 5153.65 6140.50 6140.50
Revenue
4 Non-Plan Grants from 11720.59 796.77 1376.40 768.35 772.40 1396.74 1751.59 1751.64
Centre ( 4.1 to 4.4 )
4.1 Revenue Gap Grants 0.00 0.00 0.00 0.00 0.00 0.00 0.00 0.00
4.2 Central Share of Calamity 2254.39 48.57 315.28 224.25 376.59 401.42 421.19 421.19
Relief Fund
4.3 Grants for Local Bodies 5077.00 269.00 403.50 194.48 336.99 548.36 802.34 802.30
4.4 Other Non-Plan Grants 4389.20 479.20 657.62 349.62 58.82 446.96 528.06 528.15
II. Non-Plan Revenue 315506.15 24904.75 27072.19 33797.51 40012.83 41060.31 49702.35 49702.35
Expenditure ( 5 to 8 )
5 Non Development 160039.92 13008.65 12481.07 15709.58 18322.55 18856.24 24748.05 24748.05
Expenditure ( 5.1 to 5.4 )
5.1 Interest Payment 72672.11 7484.45 7884.05 8590.09 9627.32 10948.23 12463.52 12463.52
5.2 Pension Payment 44540.39 2979.38 2962.81 4513.00 5779.43 5977.61 6243.35 6243.35
5.3 Salaries (including DA 12166.97 1520.00 1520.00 1520.00 1520.00 1680.00 1822.80 1822.80
revision etc.)
5.4 Others 30660.45 1024.82 114.21 1086.49 1395.80 250.40 4218.38 4218.38
6 Development Expenditure 148266.23 11896.10 14591.12 18087.93 21690.28 22204.07 24954.30 24954.30
( 6.1+6.2 )
6.1 Salaries (including DA 109441.49 13685.33 13685.33 13685.33 13685.33 15111.54 16396.02 16396.02
revision etc.)
6.2 Others 38824.74 -1789.23 905.79 4402.60 8004.95 7092.53 8558.28 8558.28
7 Pay and DA revision (Not 7200.00 0.00 0.00 0.00 0.00 0.00 0.00 0.00
included in 5.3 & 6.1)
8 Transfer of Local Bodies & 0.00 0.00 0.00 0.00 0.00 0.00 0.00 0.00
PSEs
III BCR ( I-II ) 97113.04 7454.01 8287.23 4586.47 8167.29 15012.48 18648.26 18620.91
Page 13