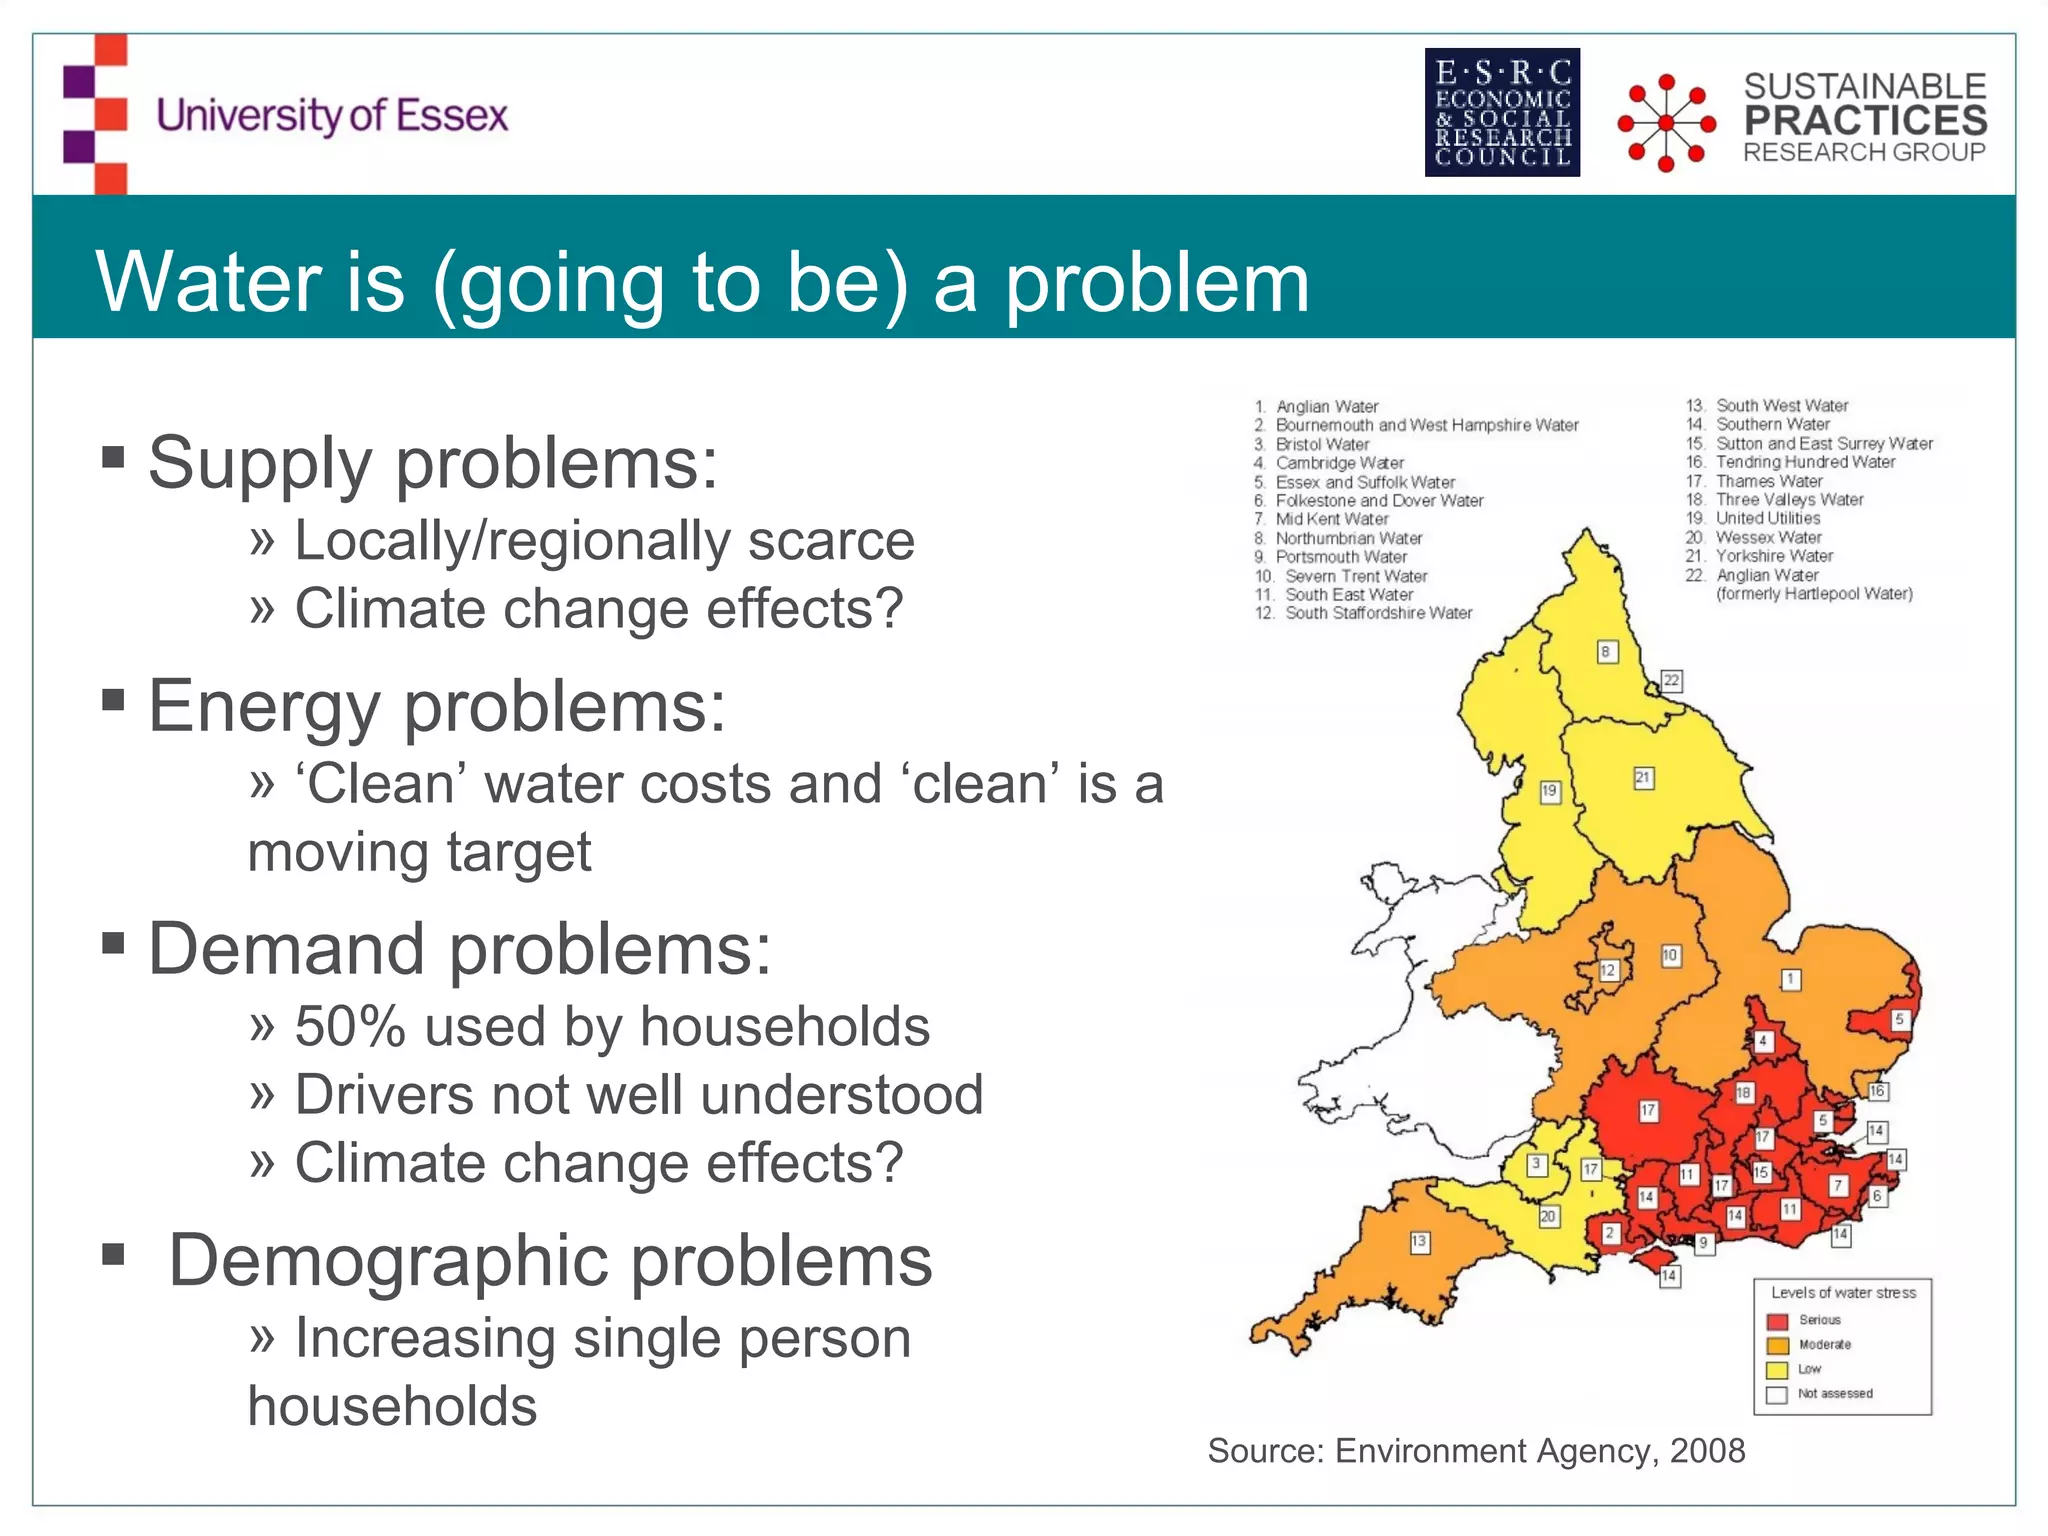
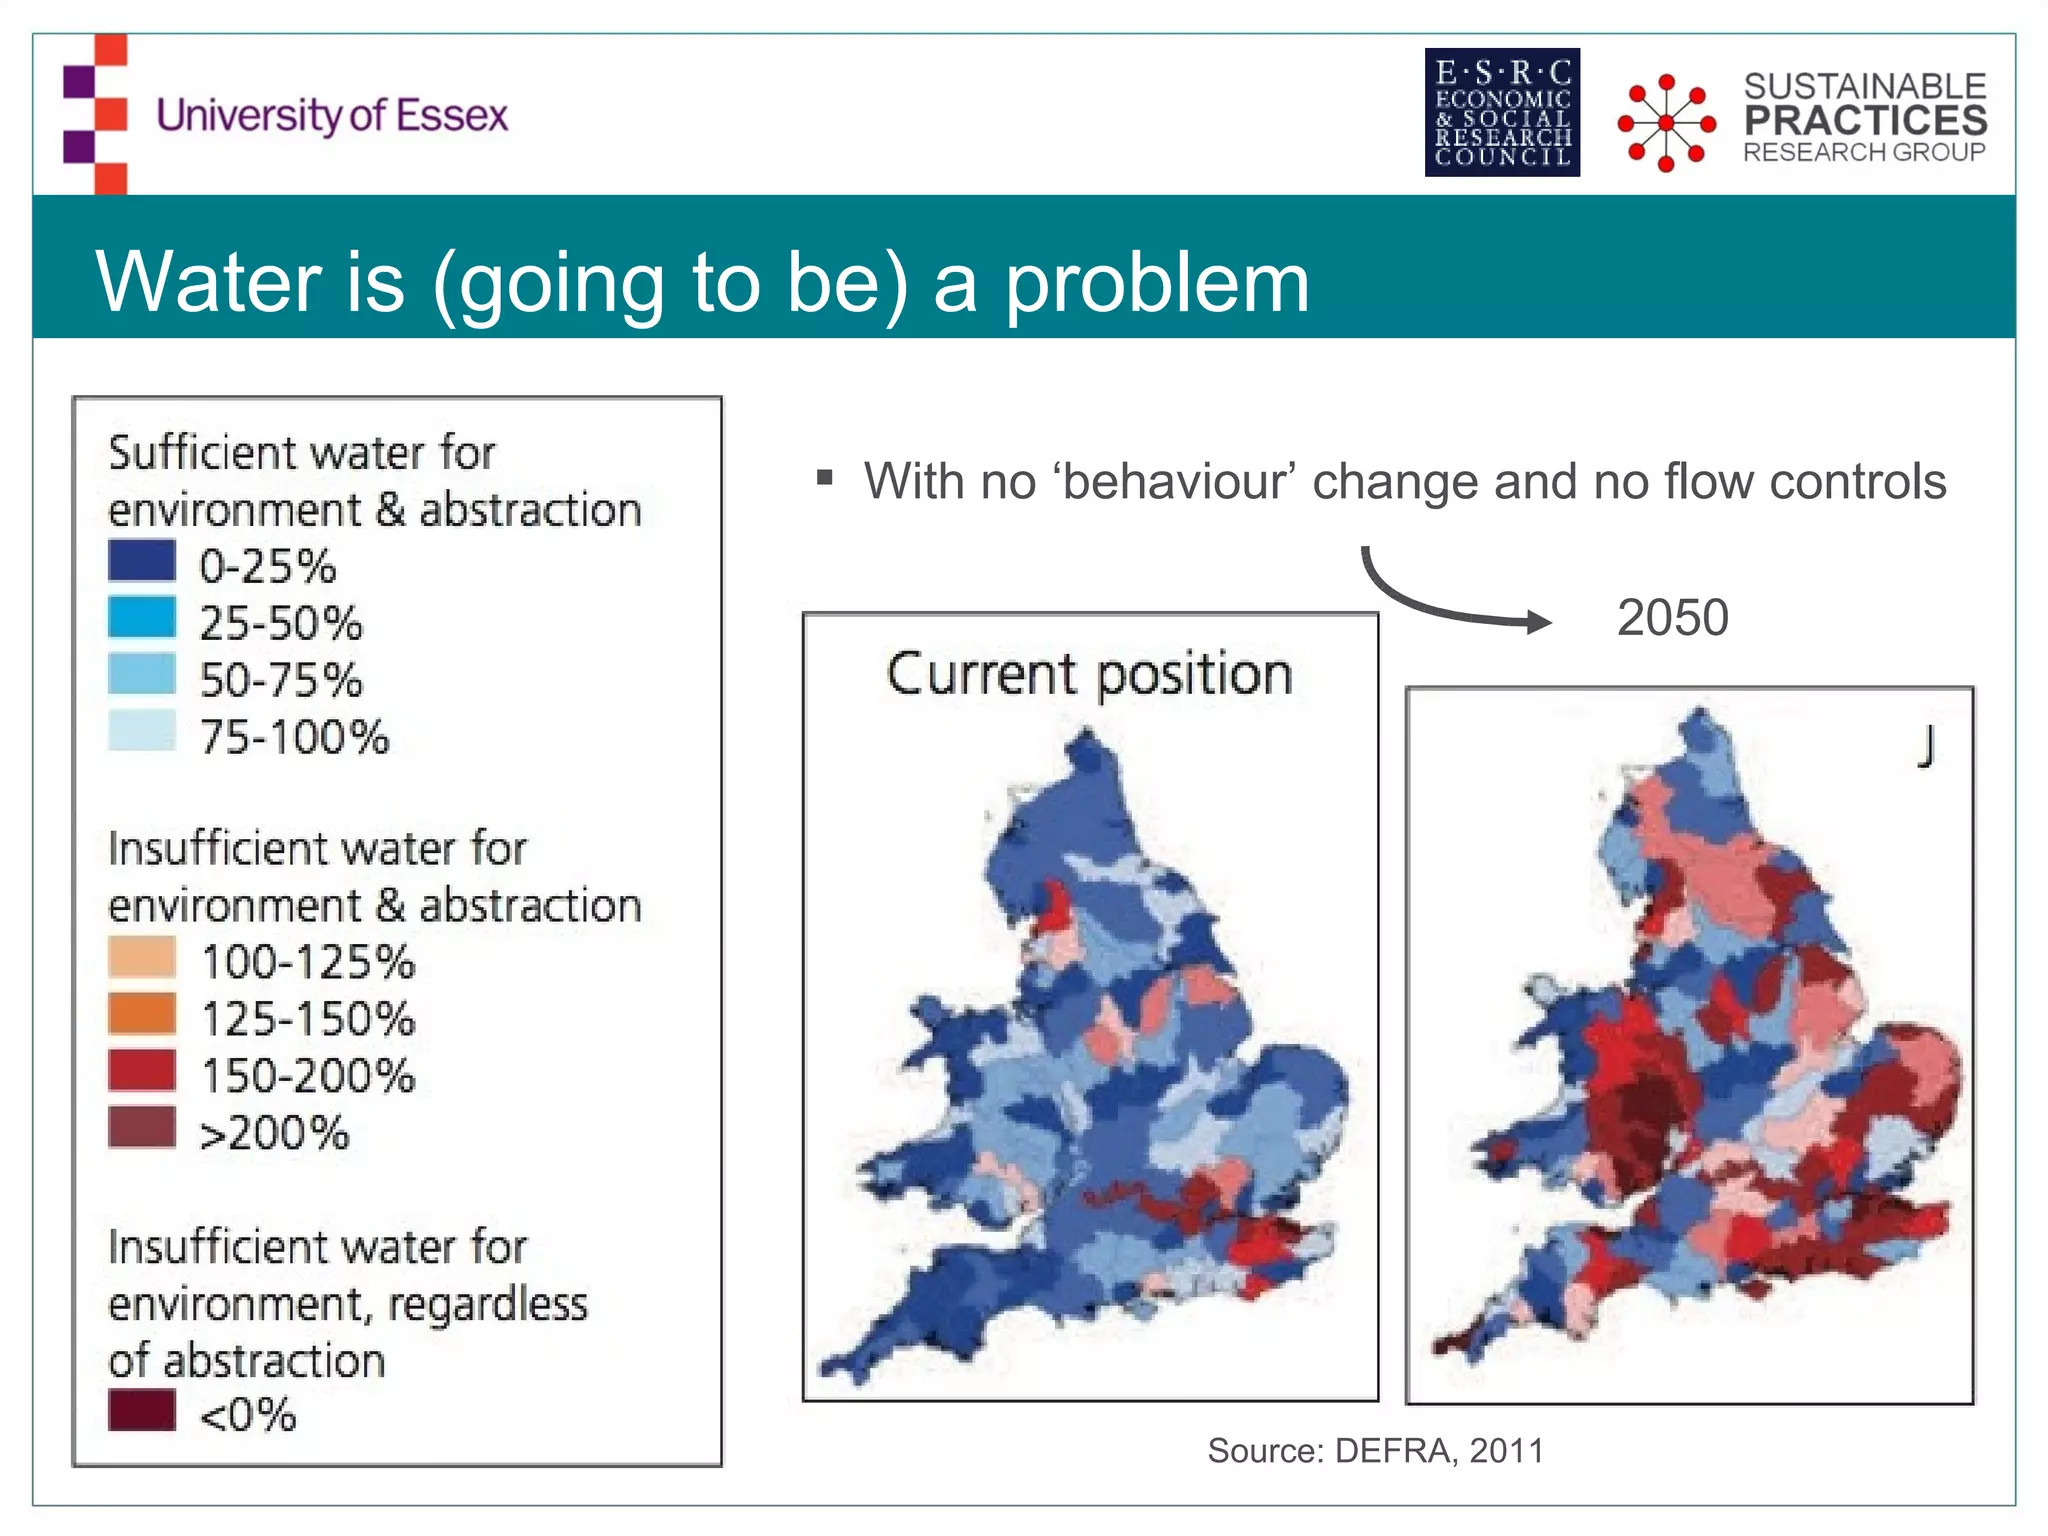
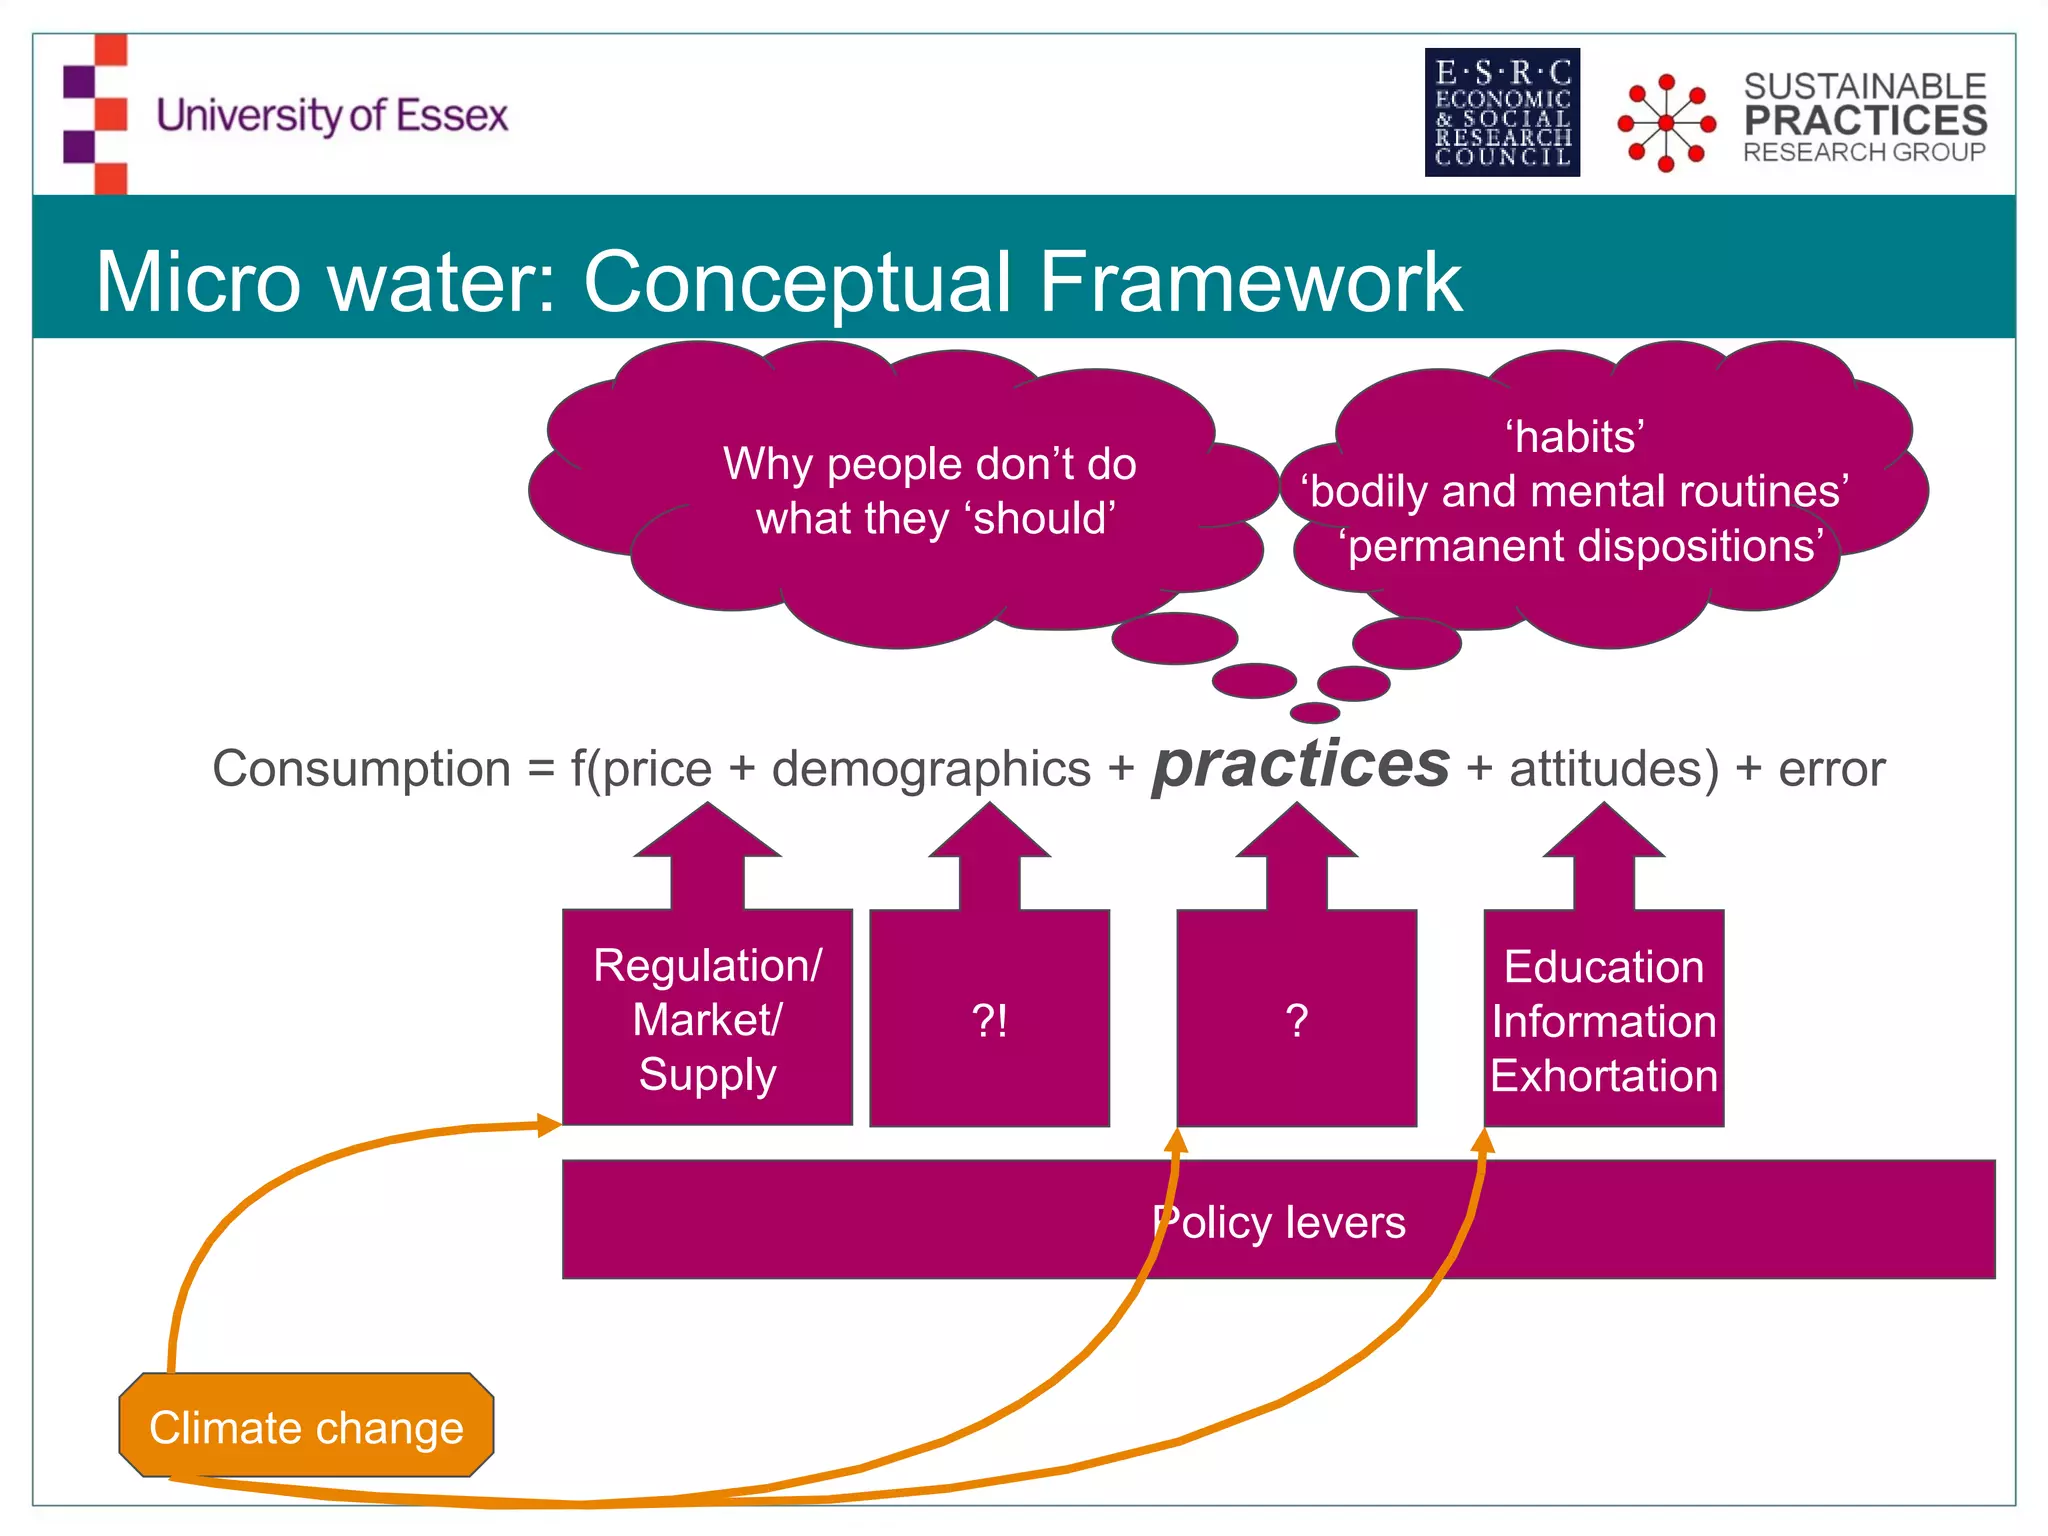
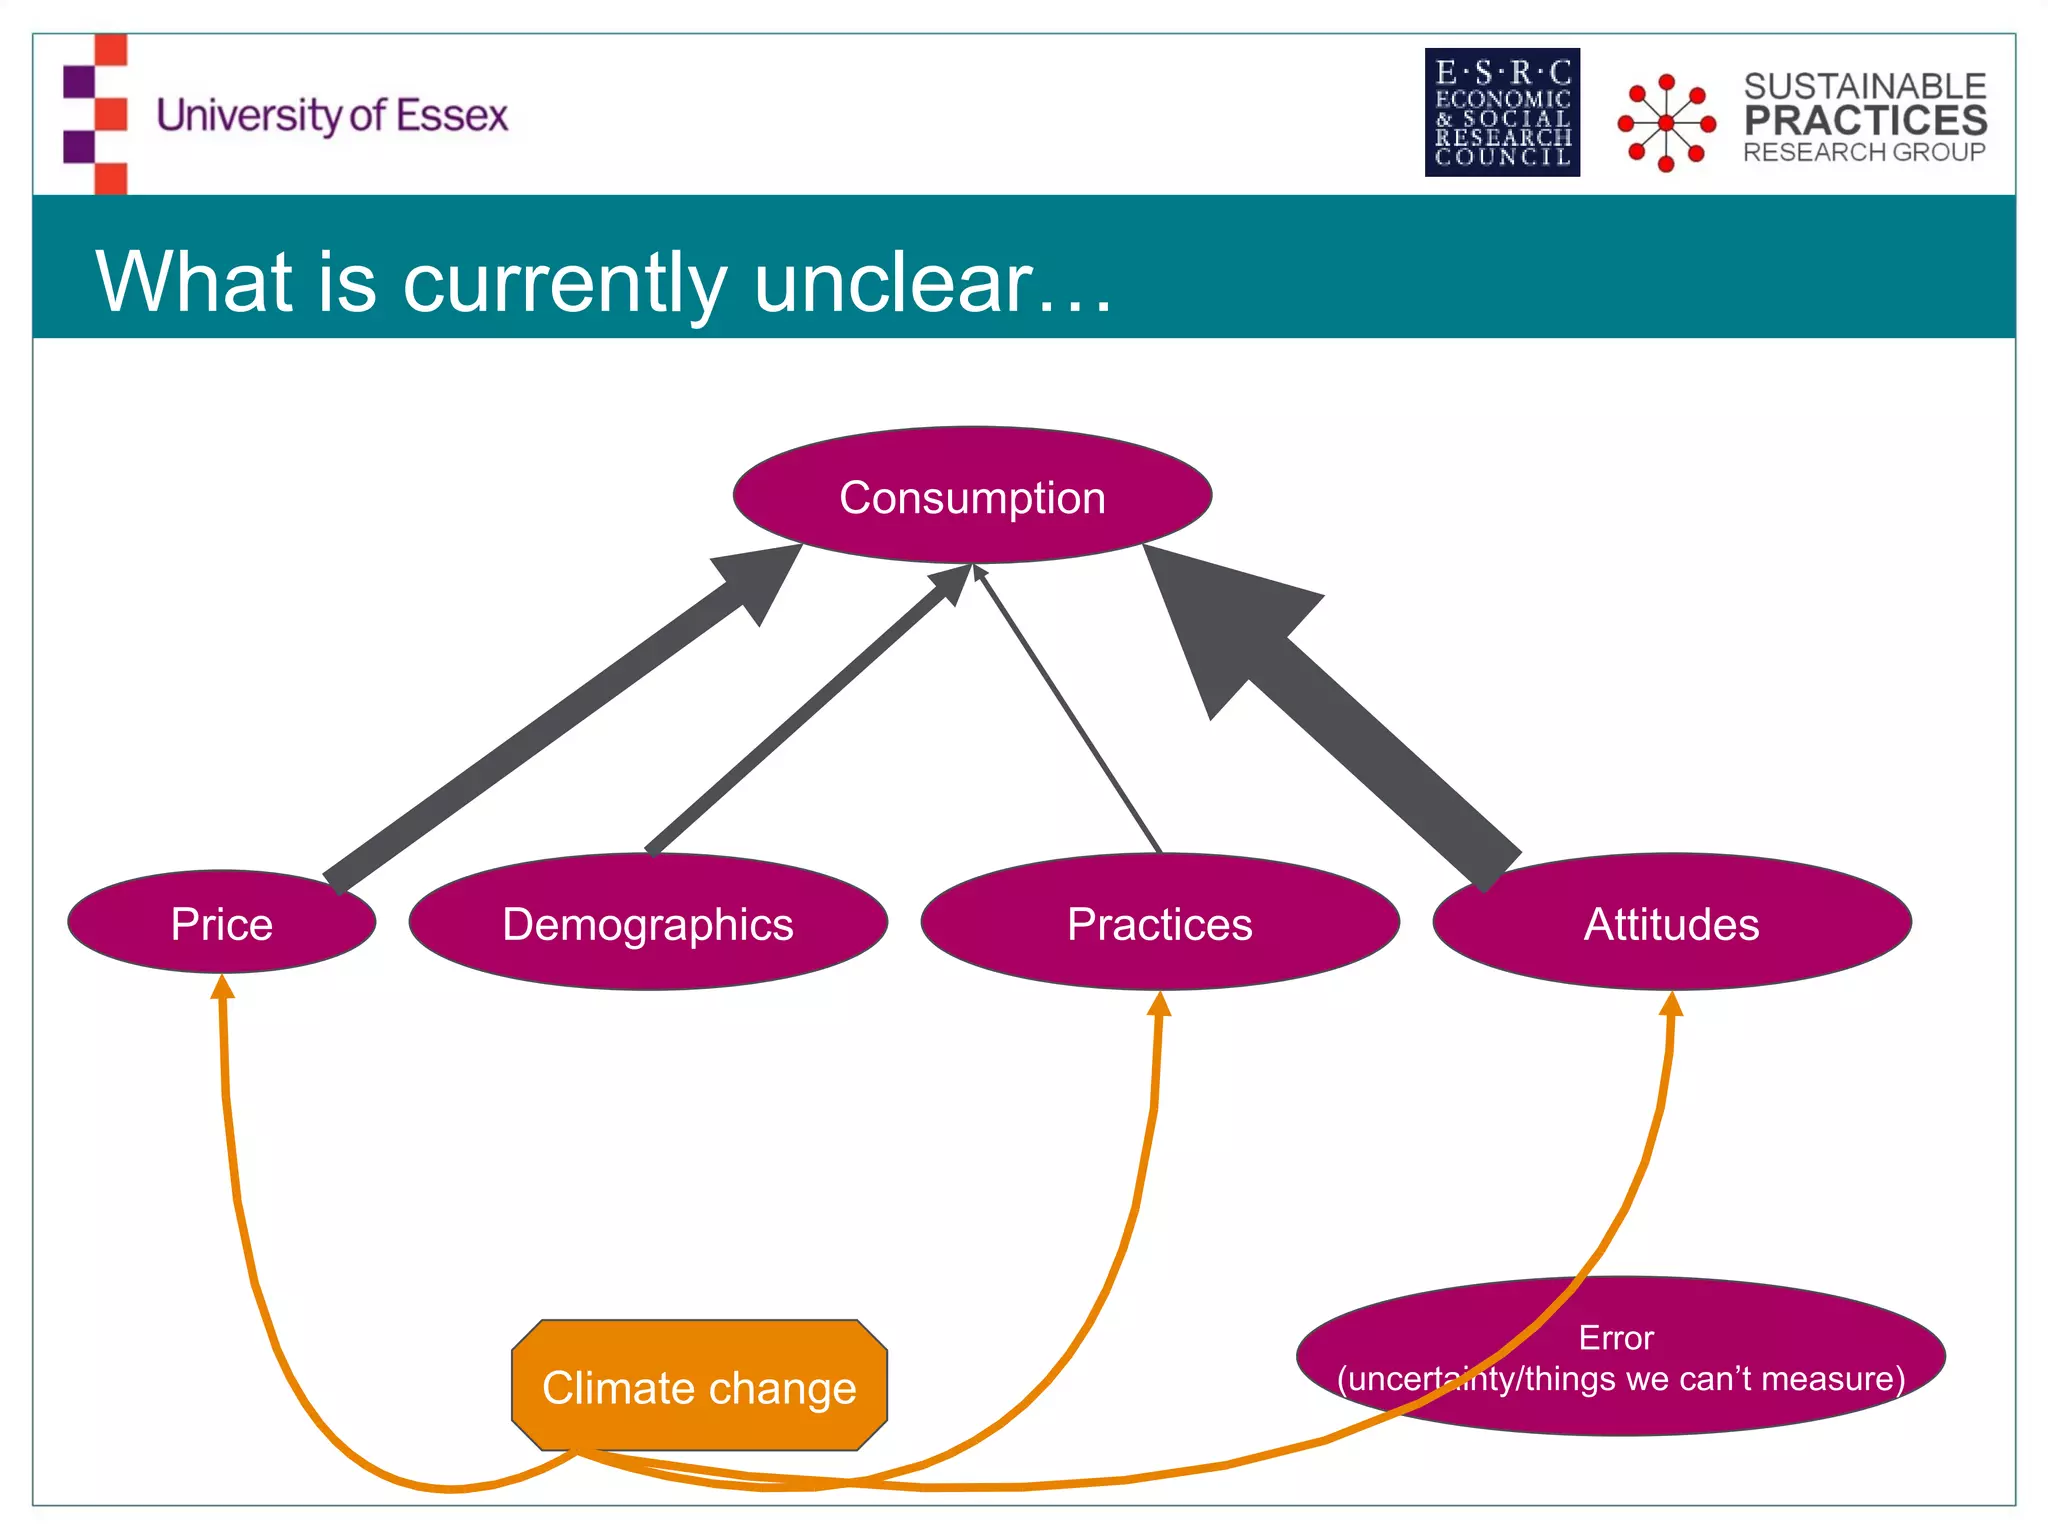
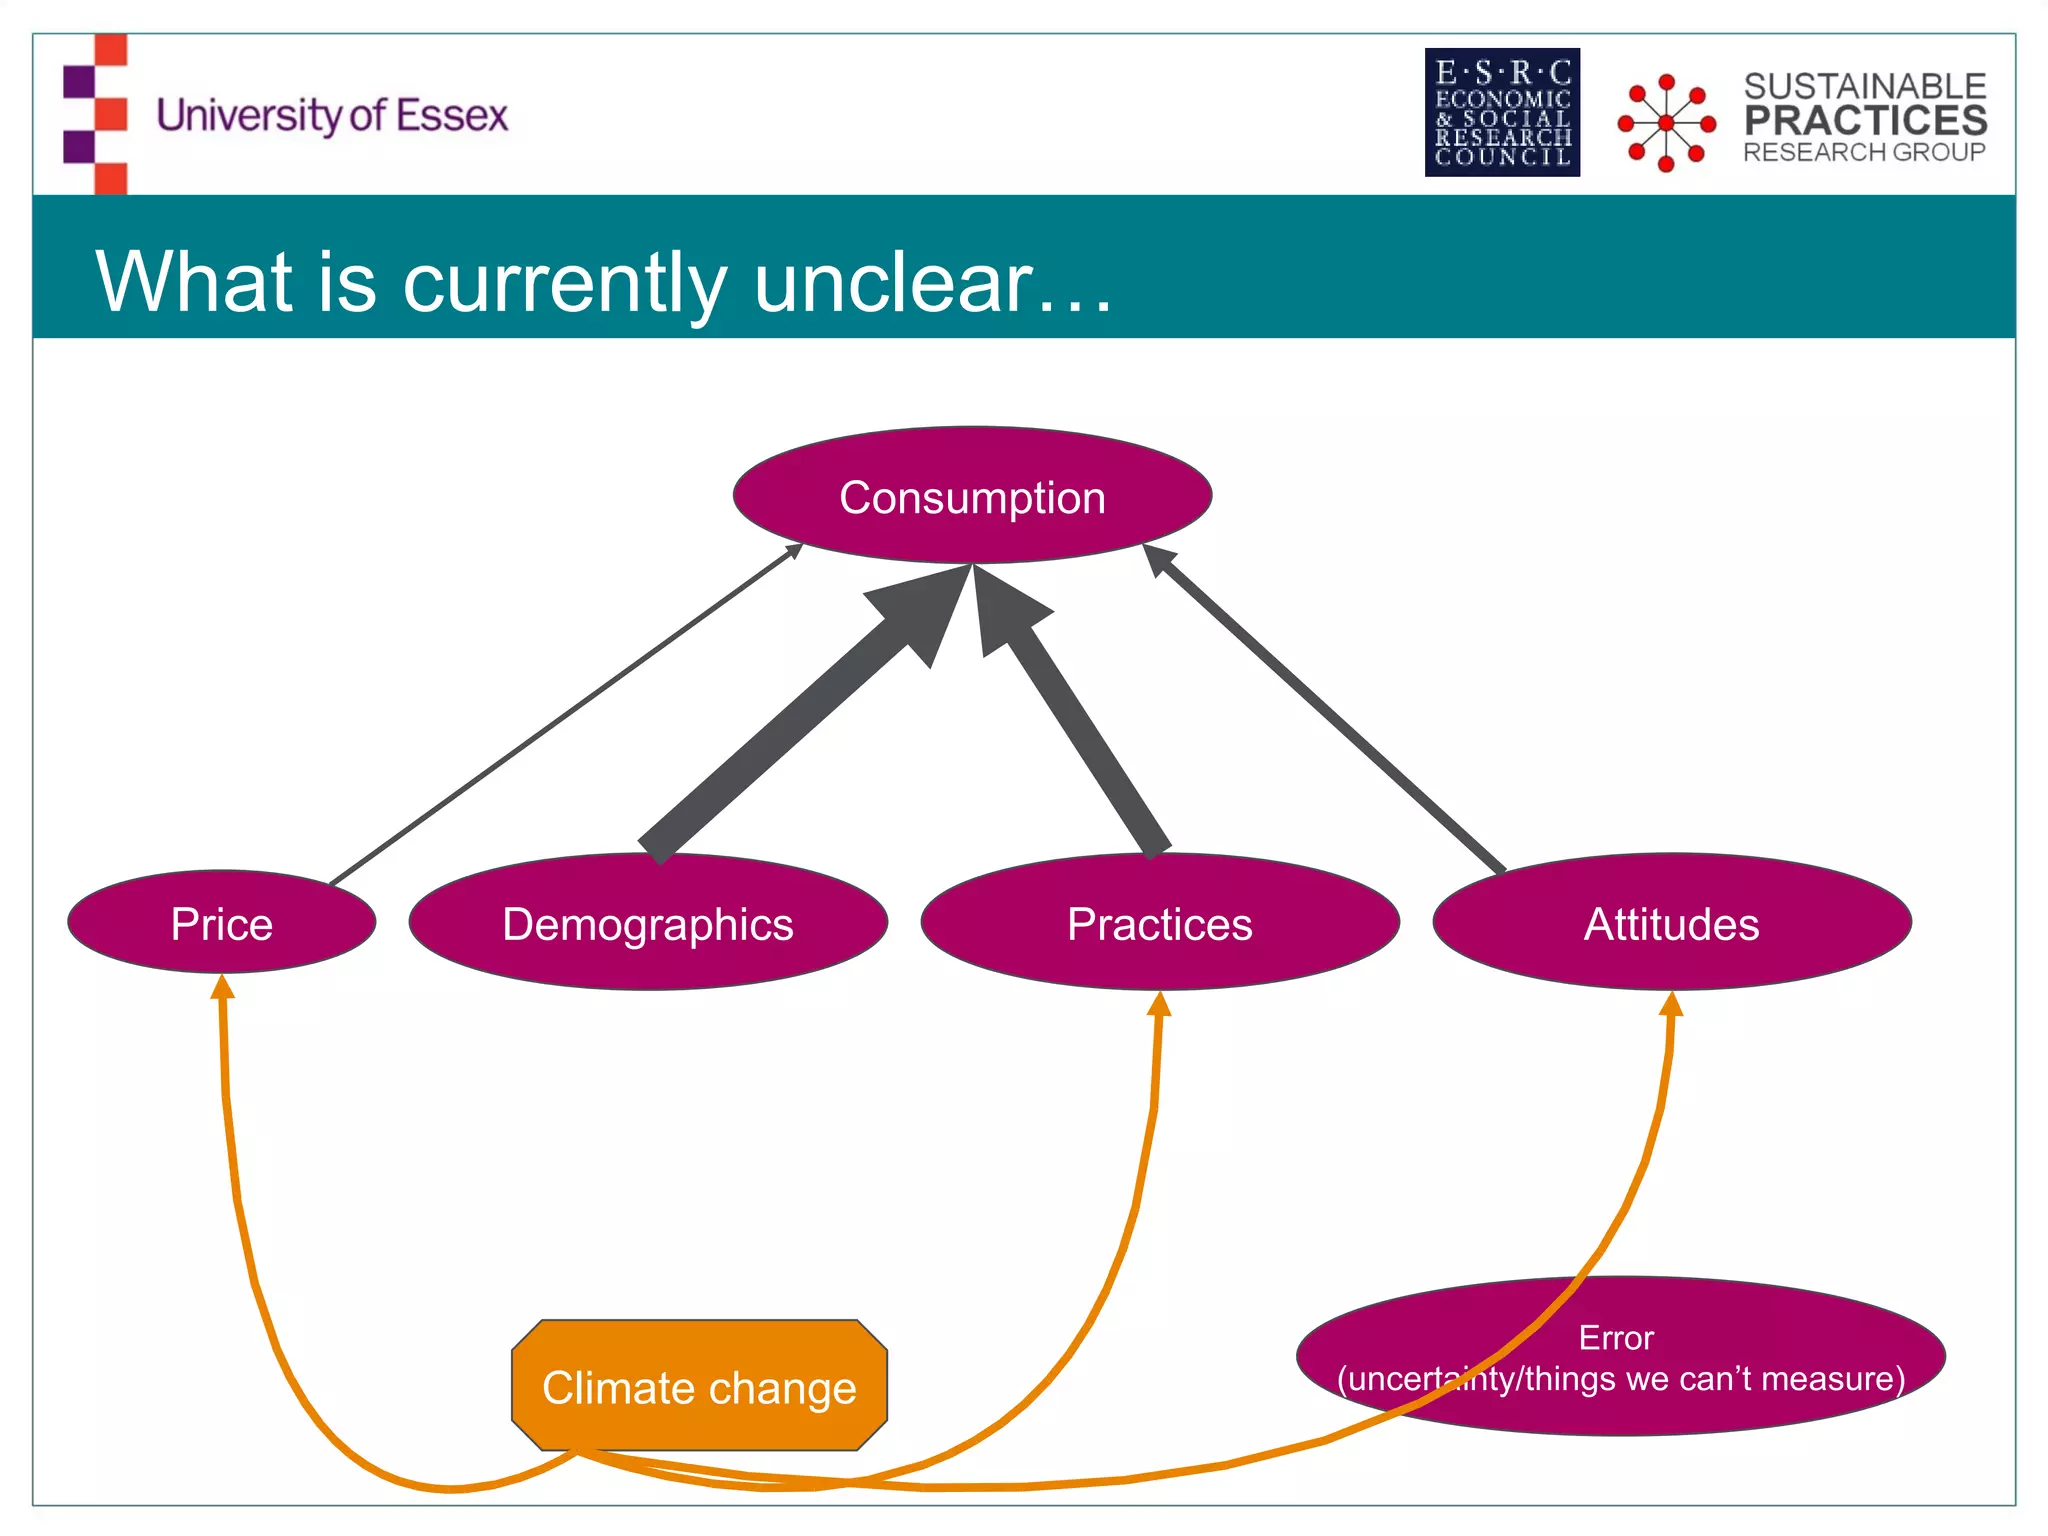
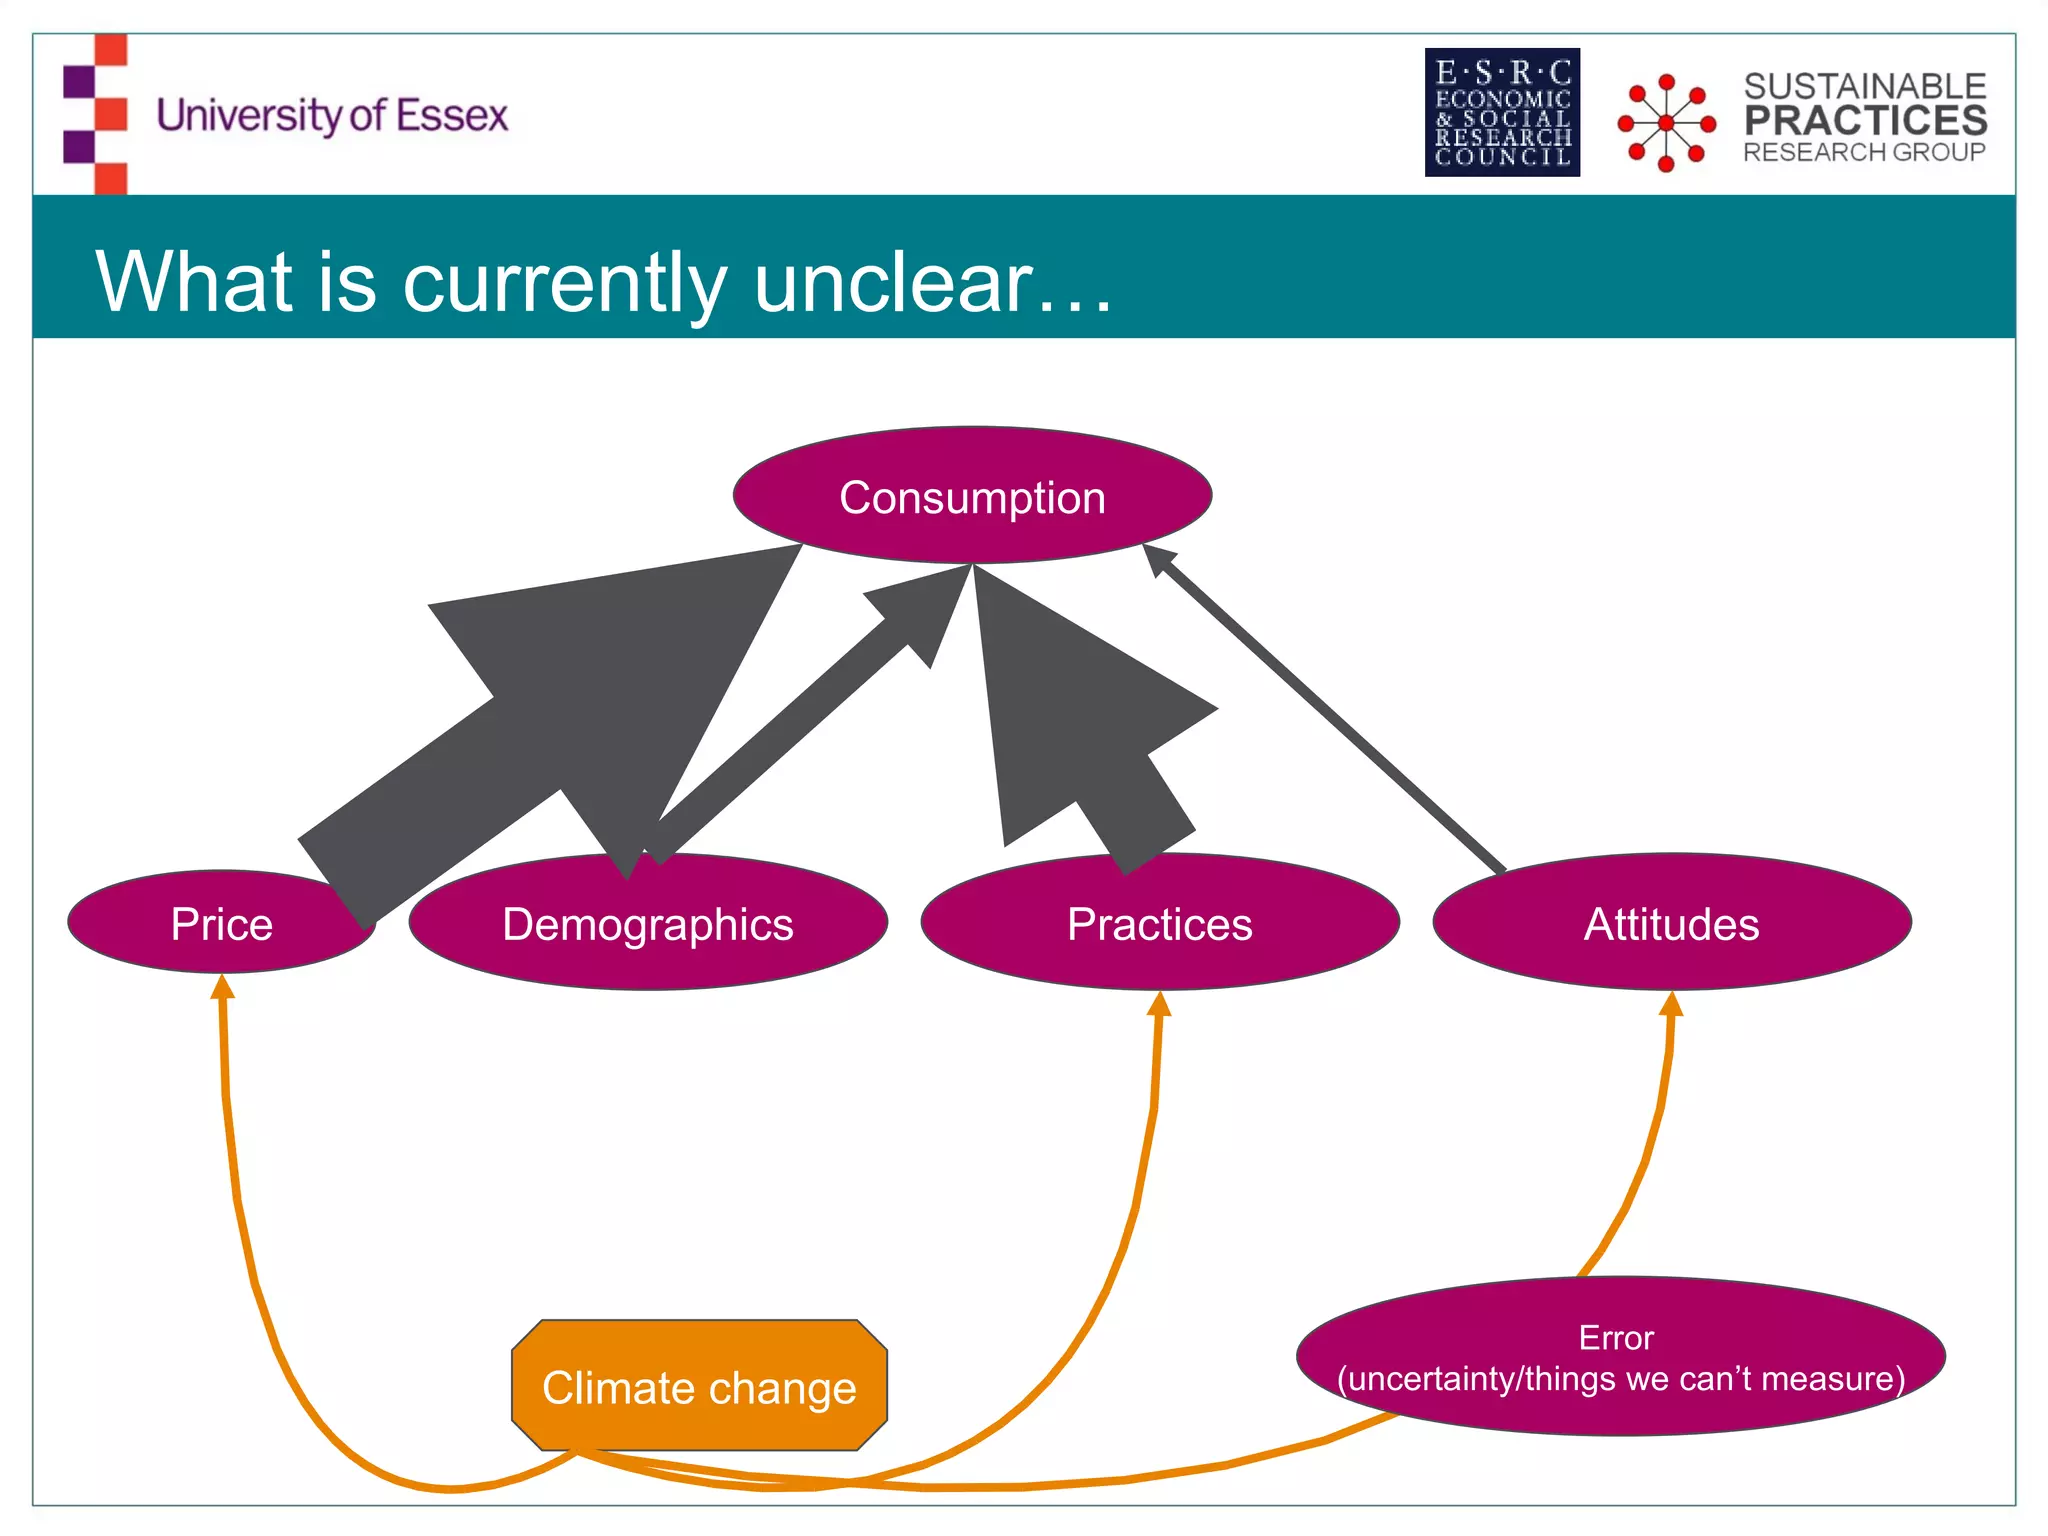
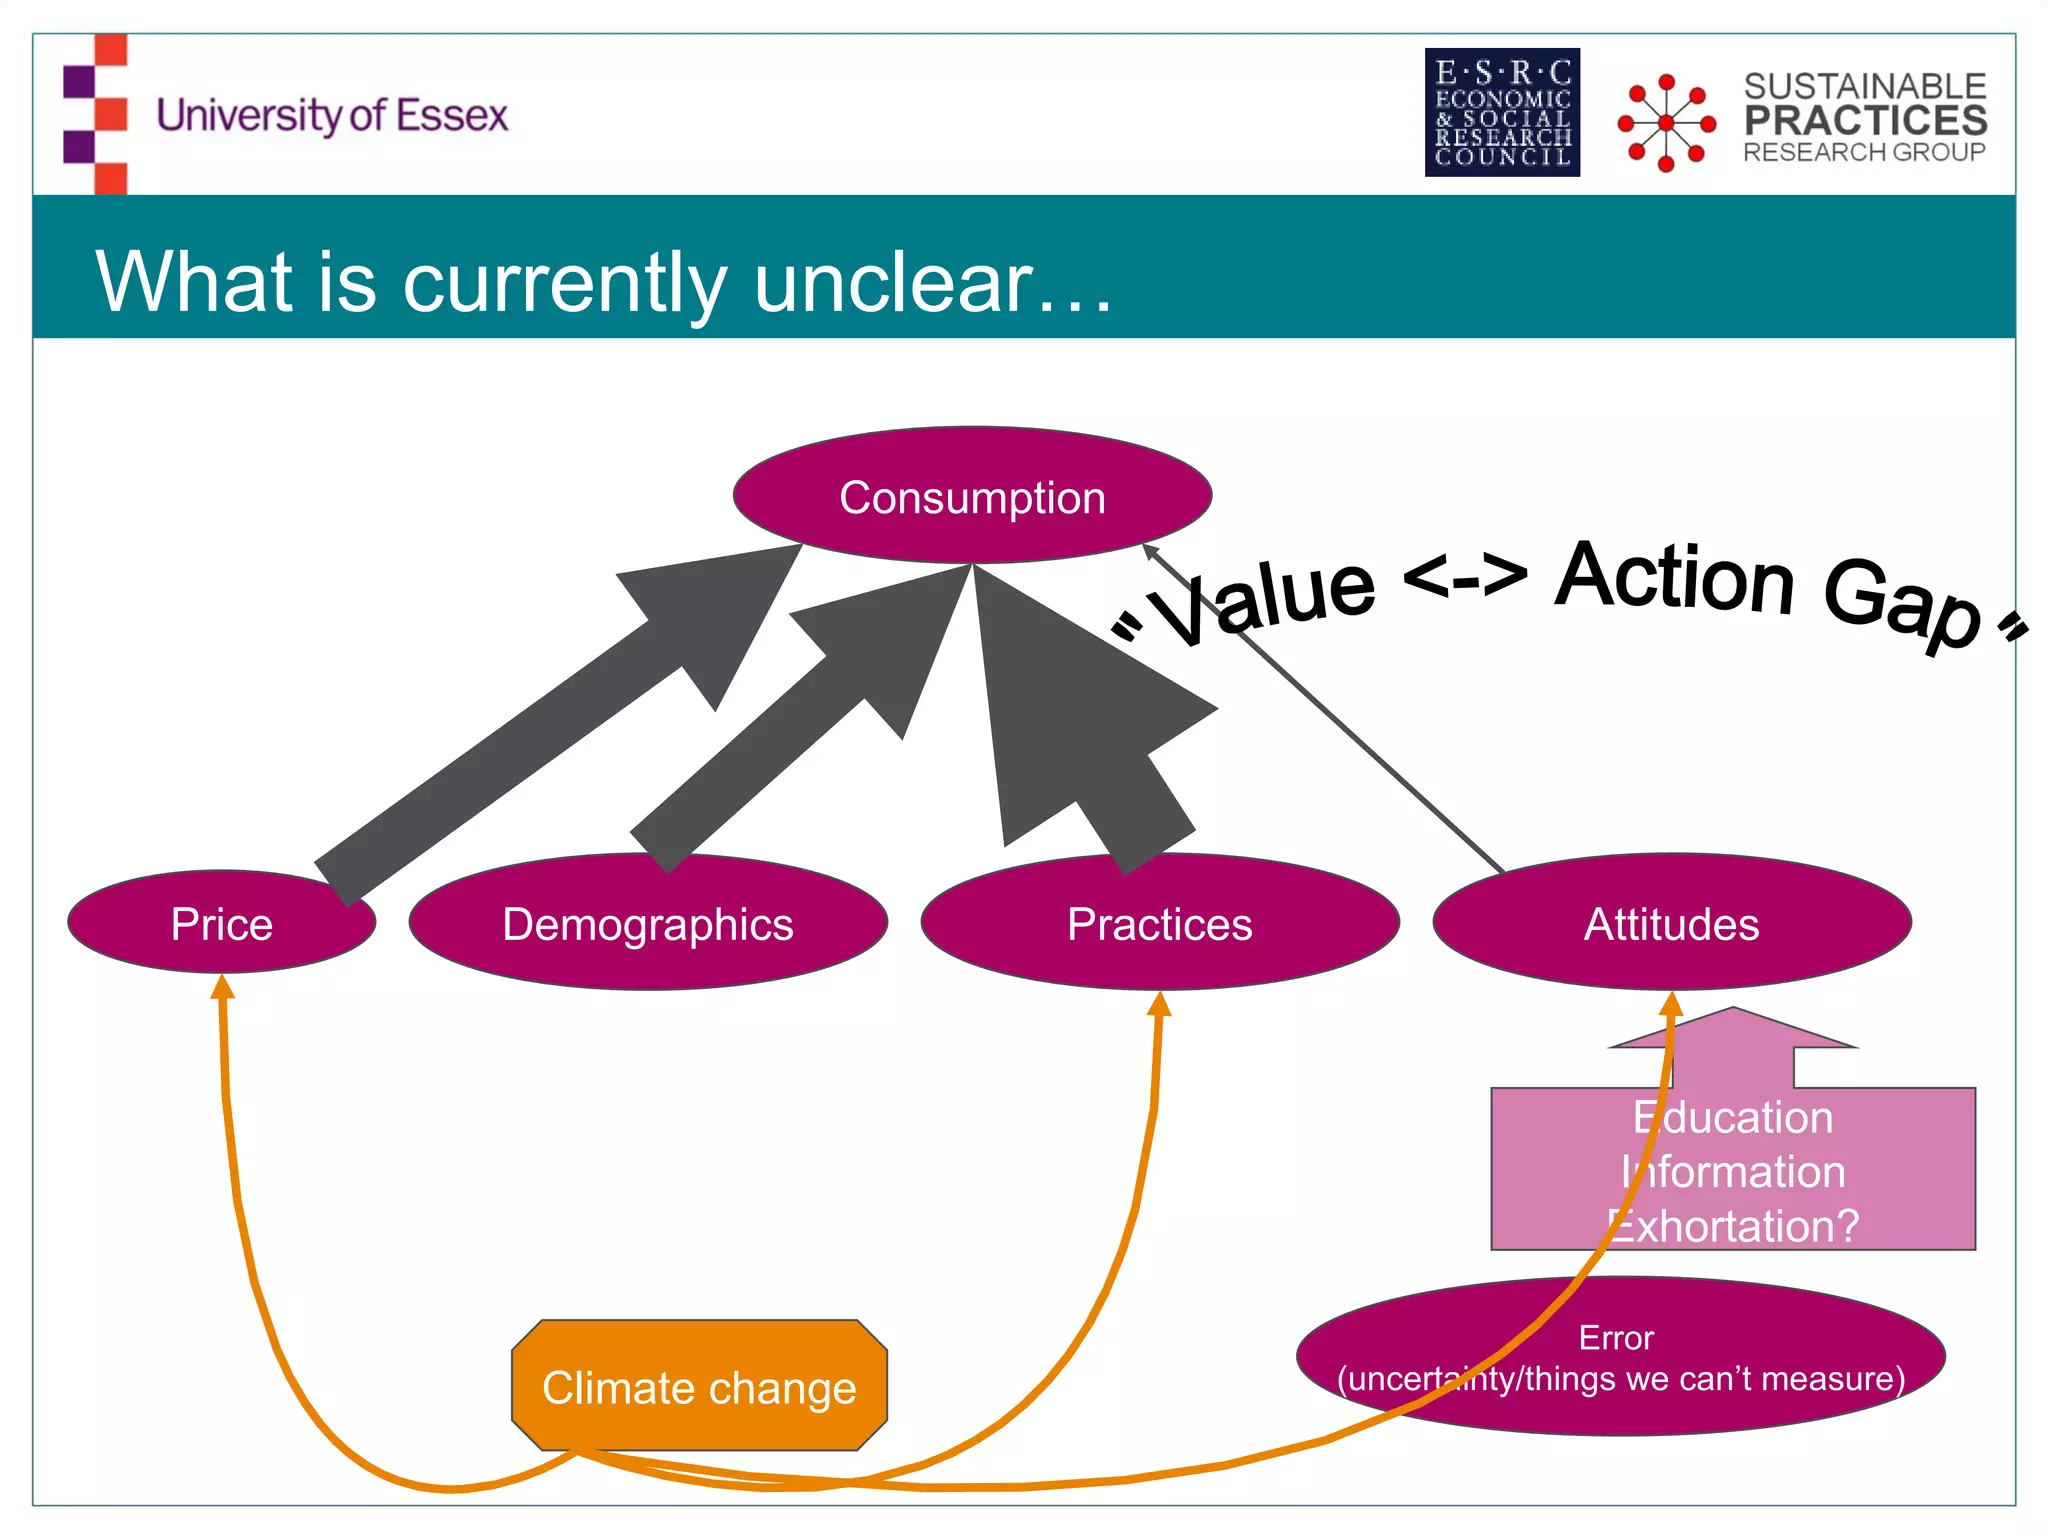
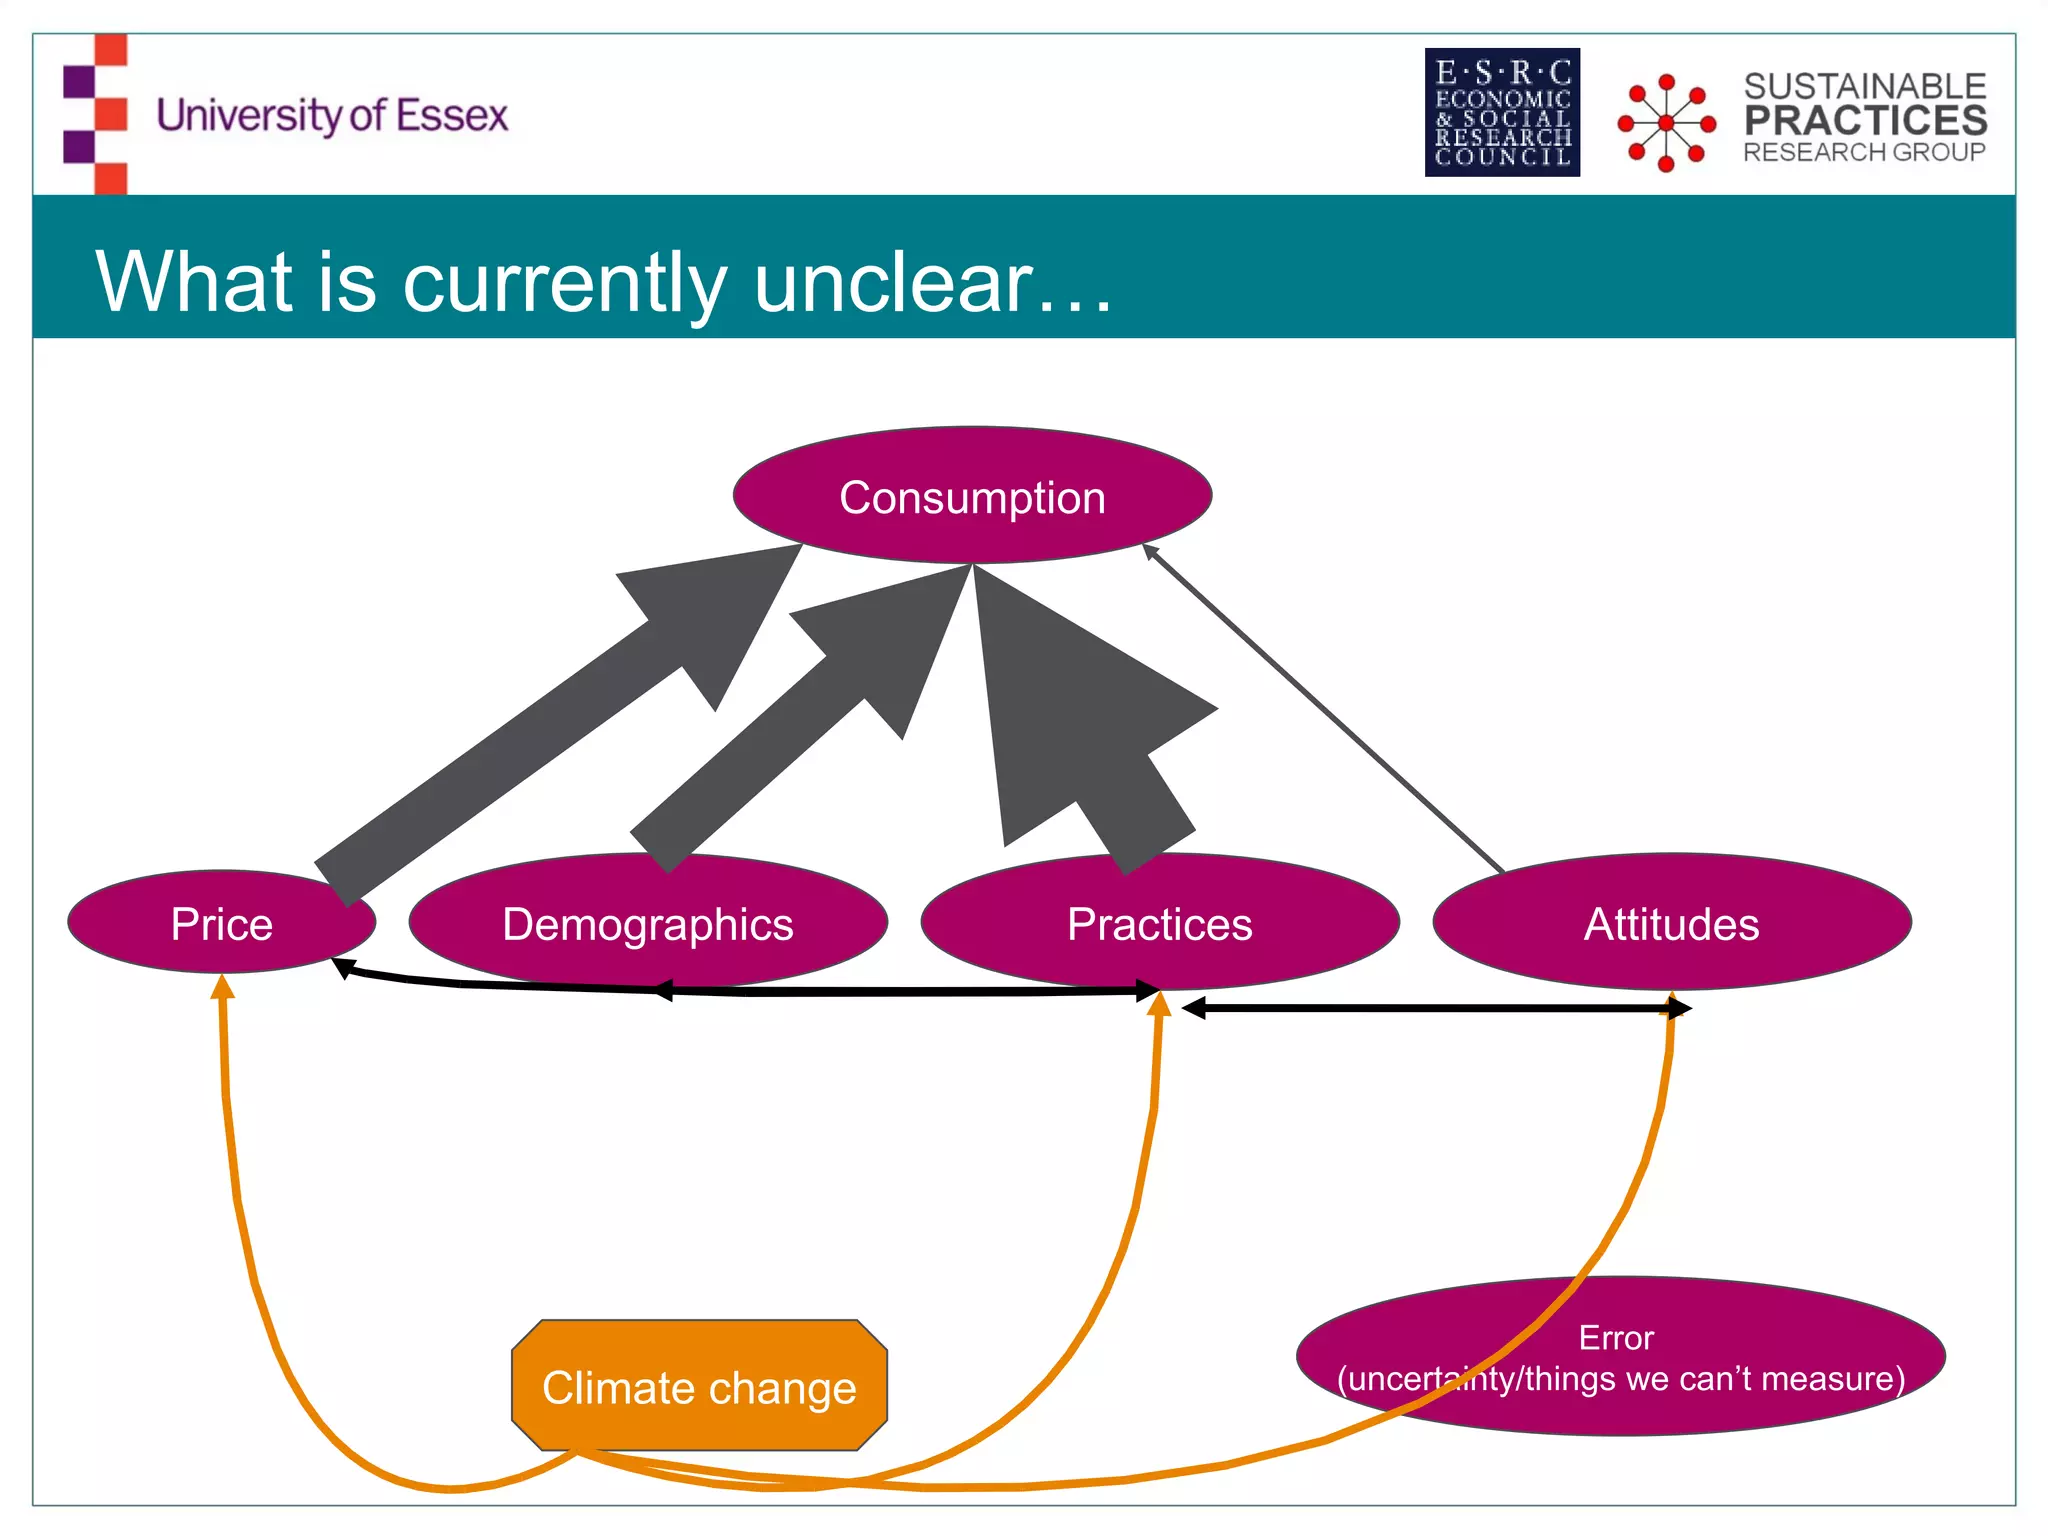
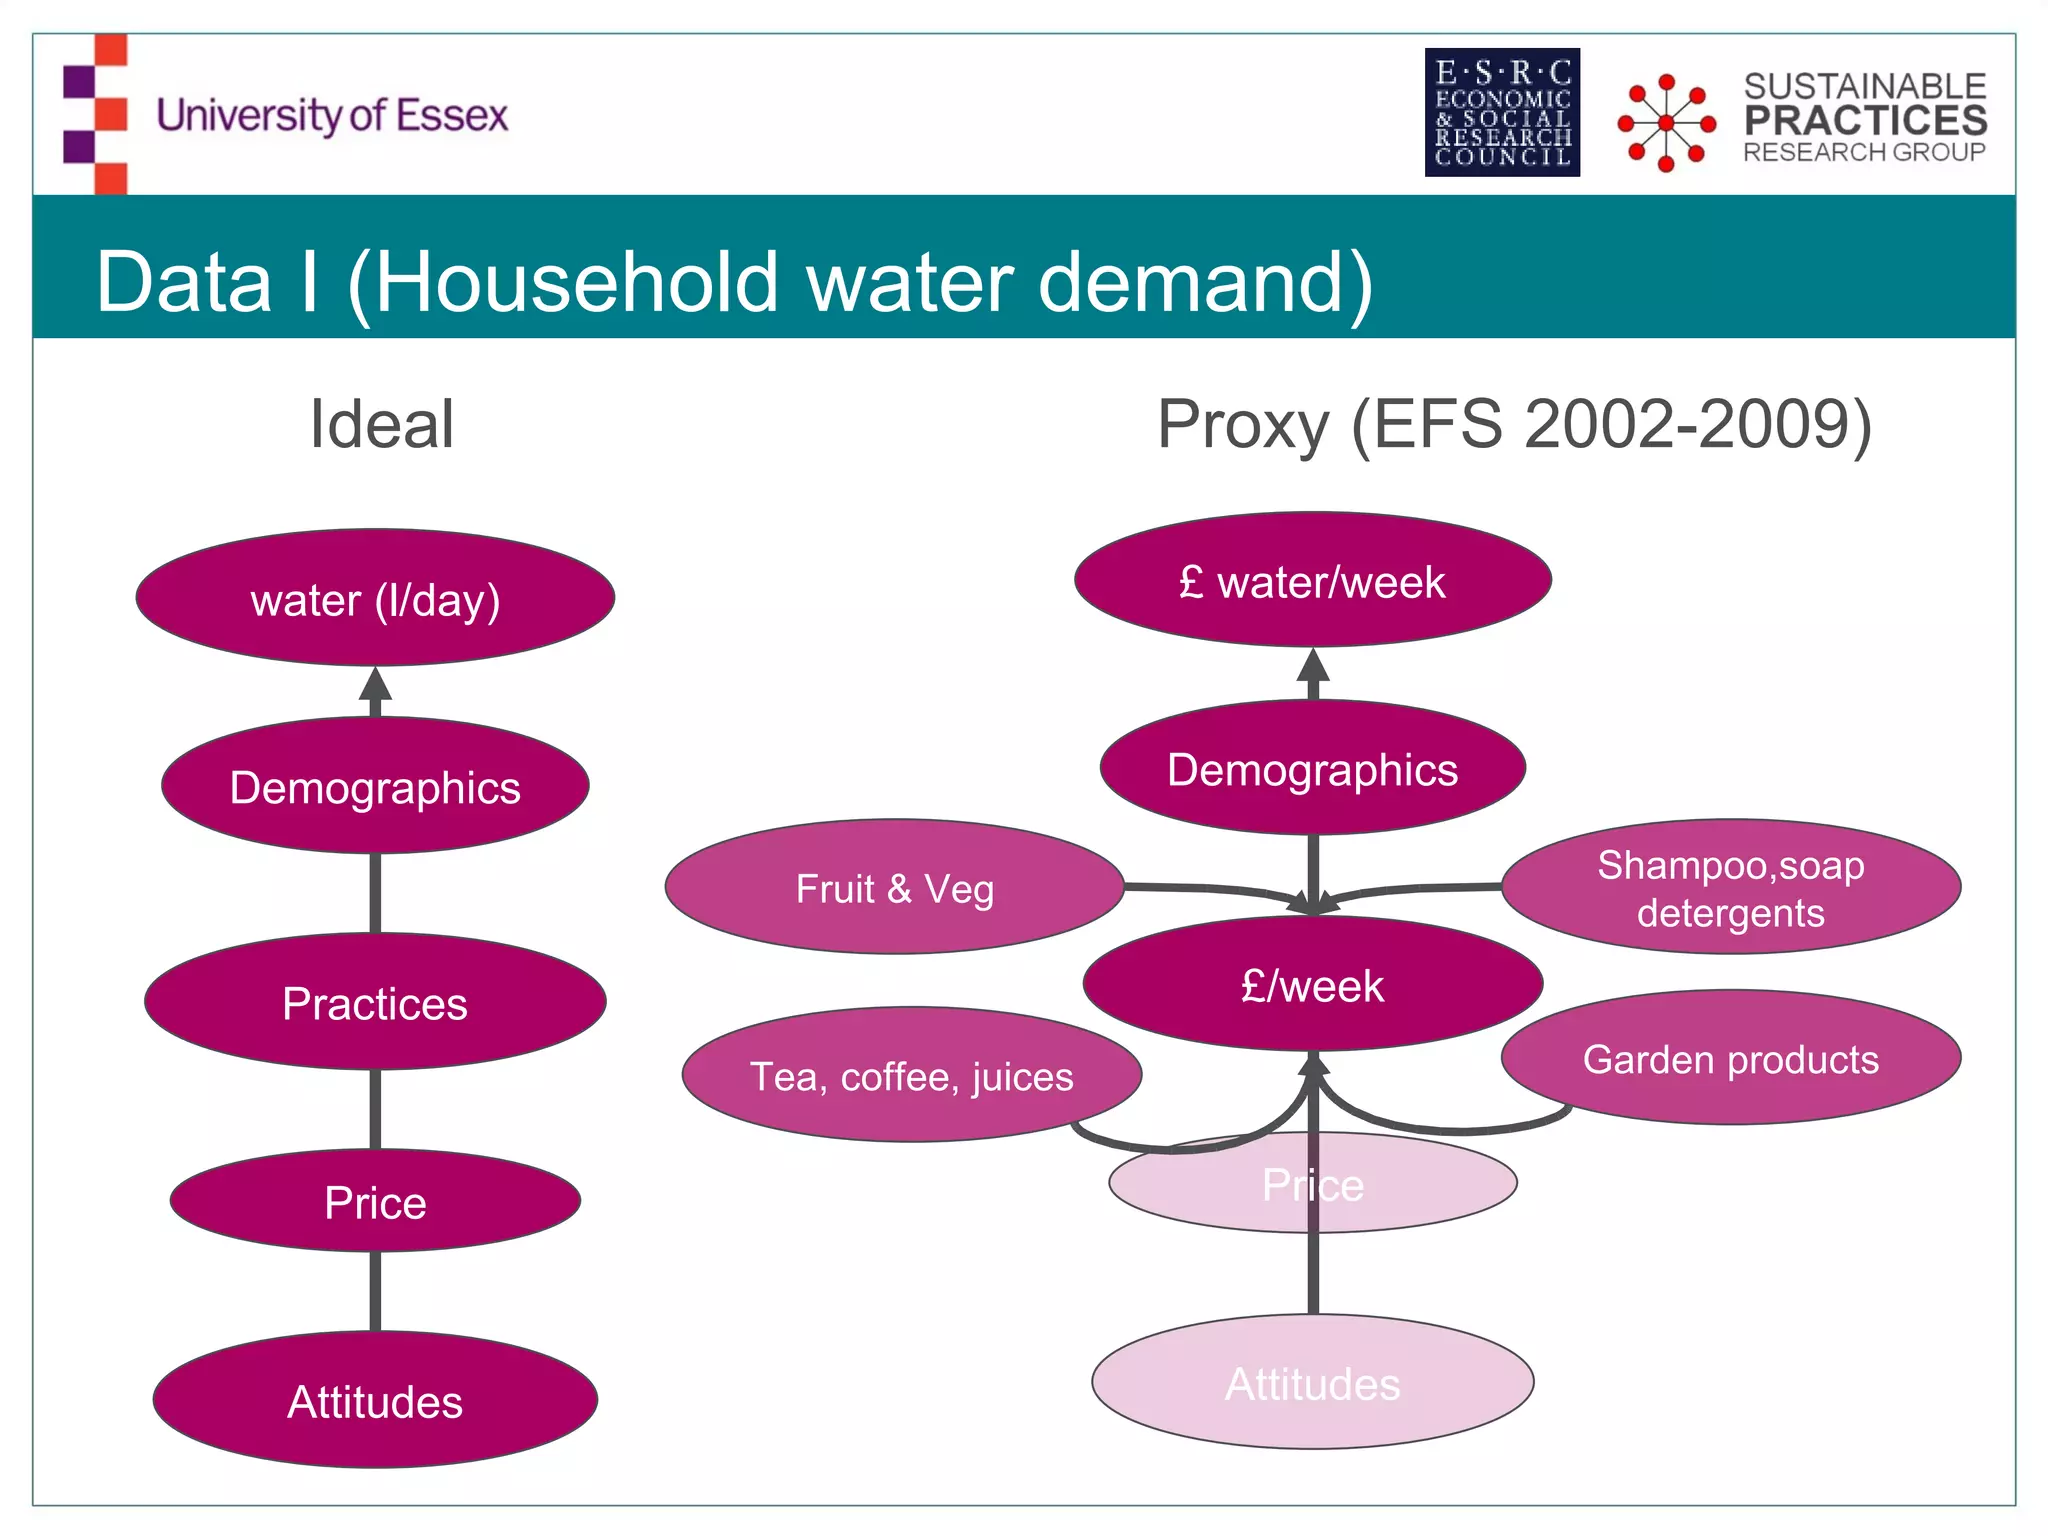
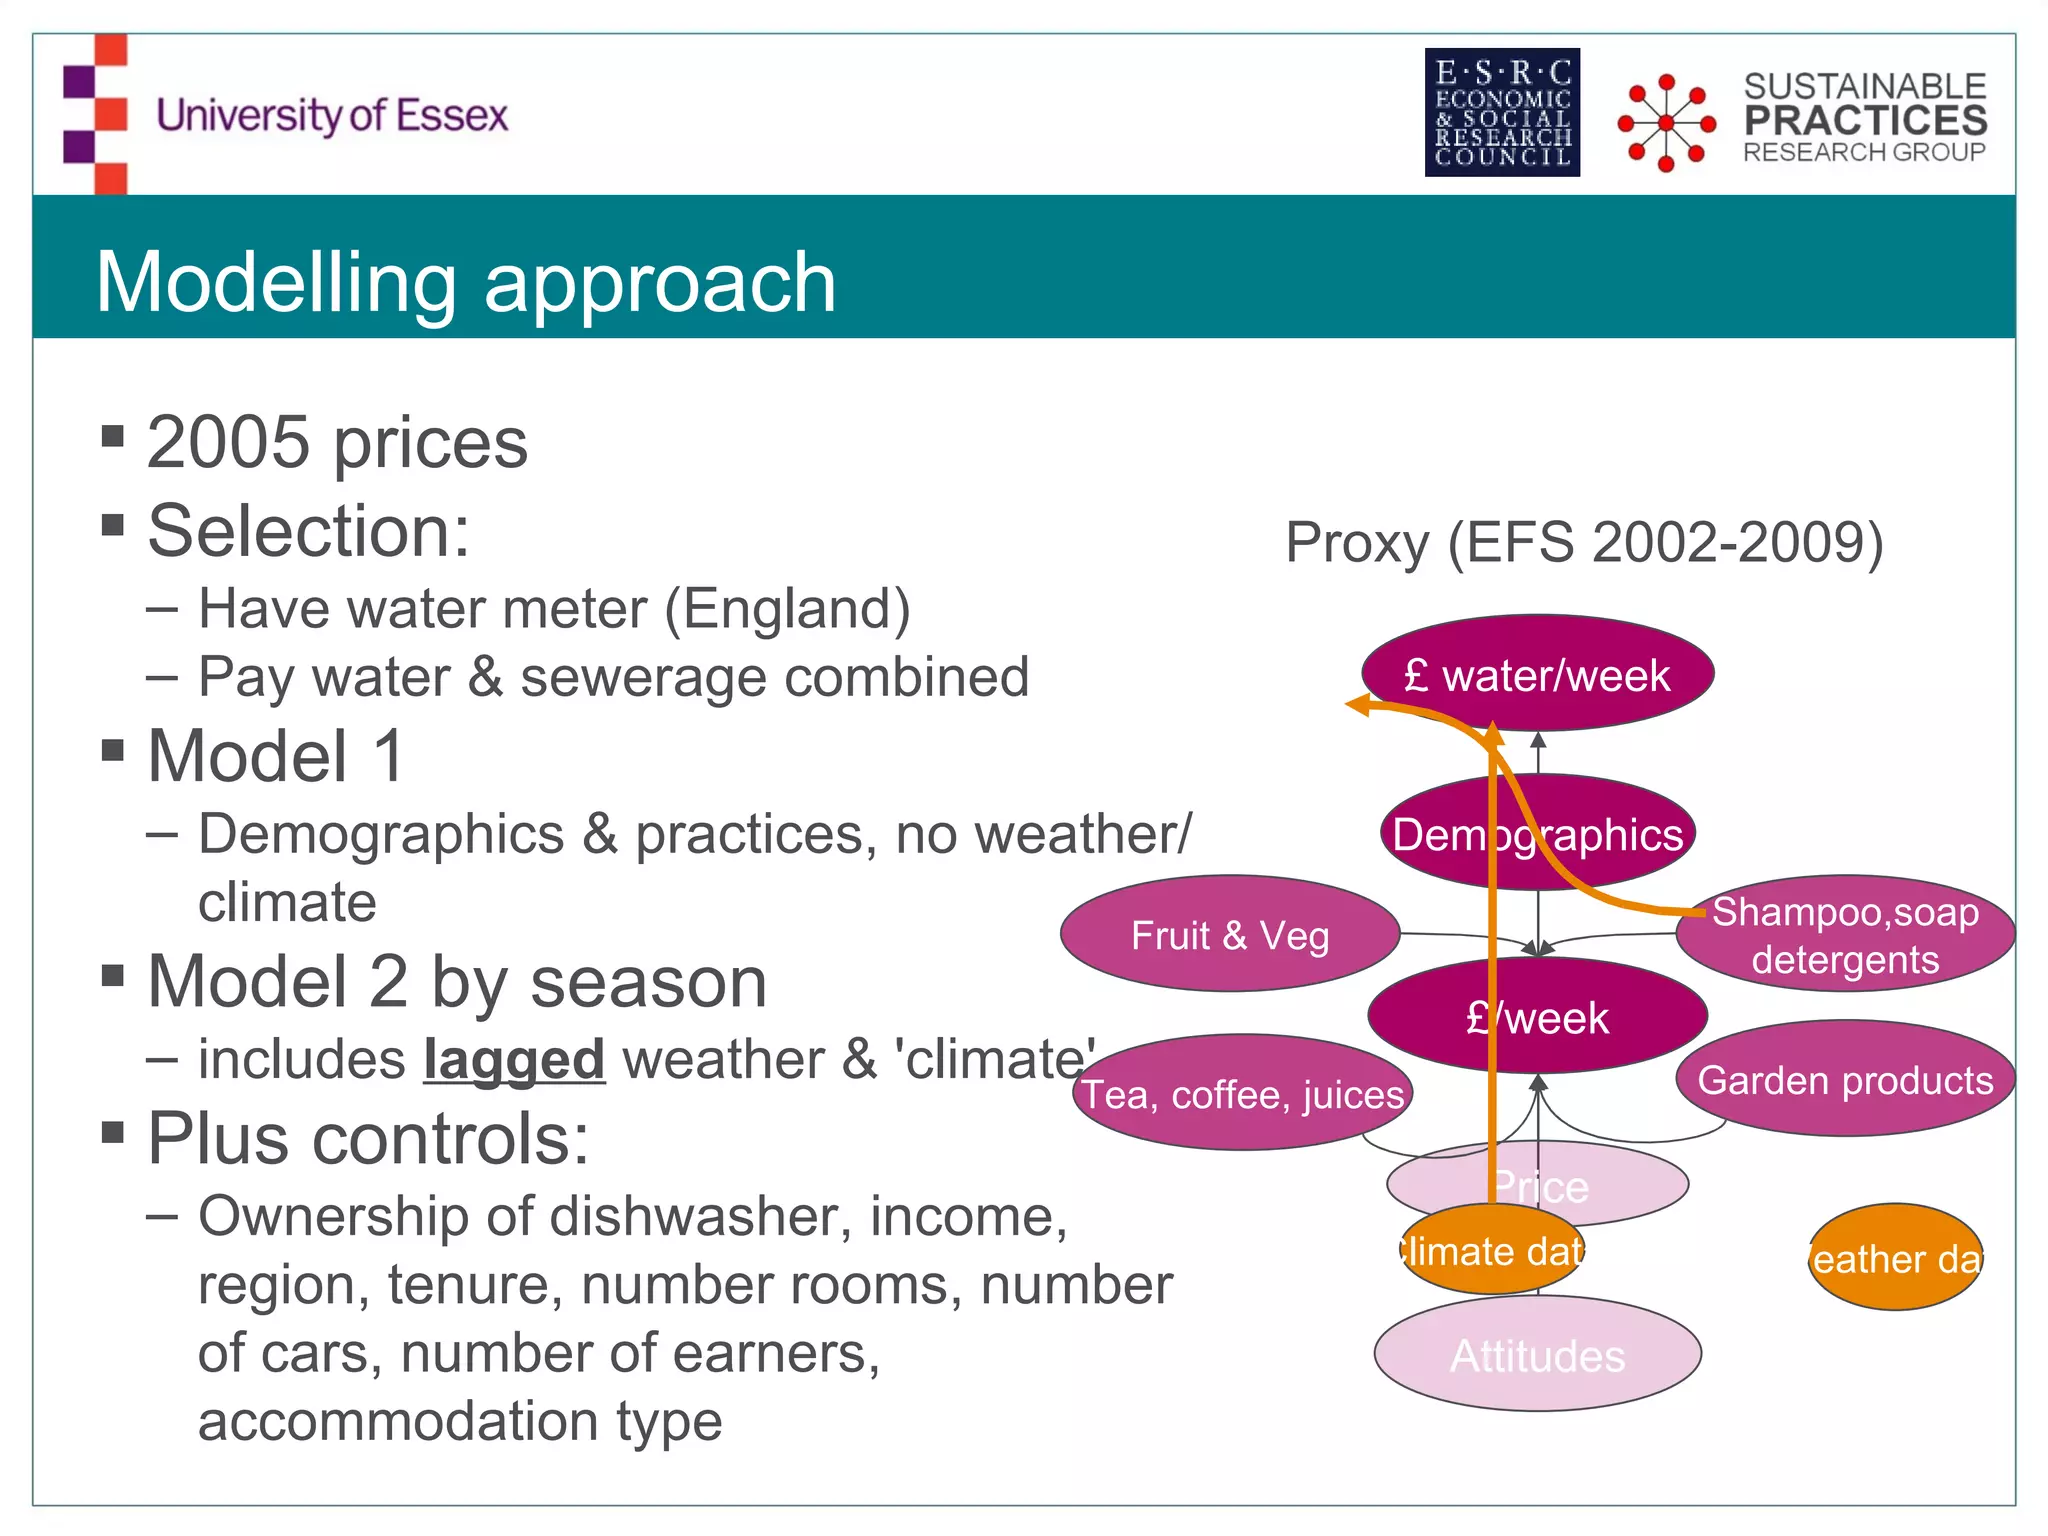
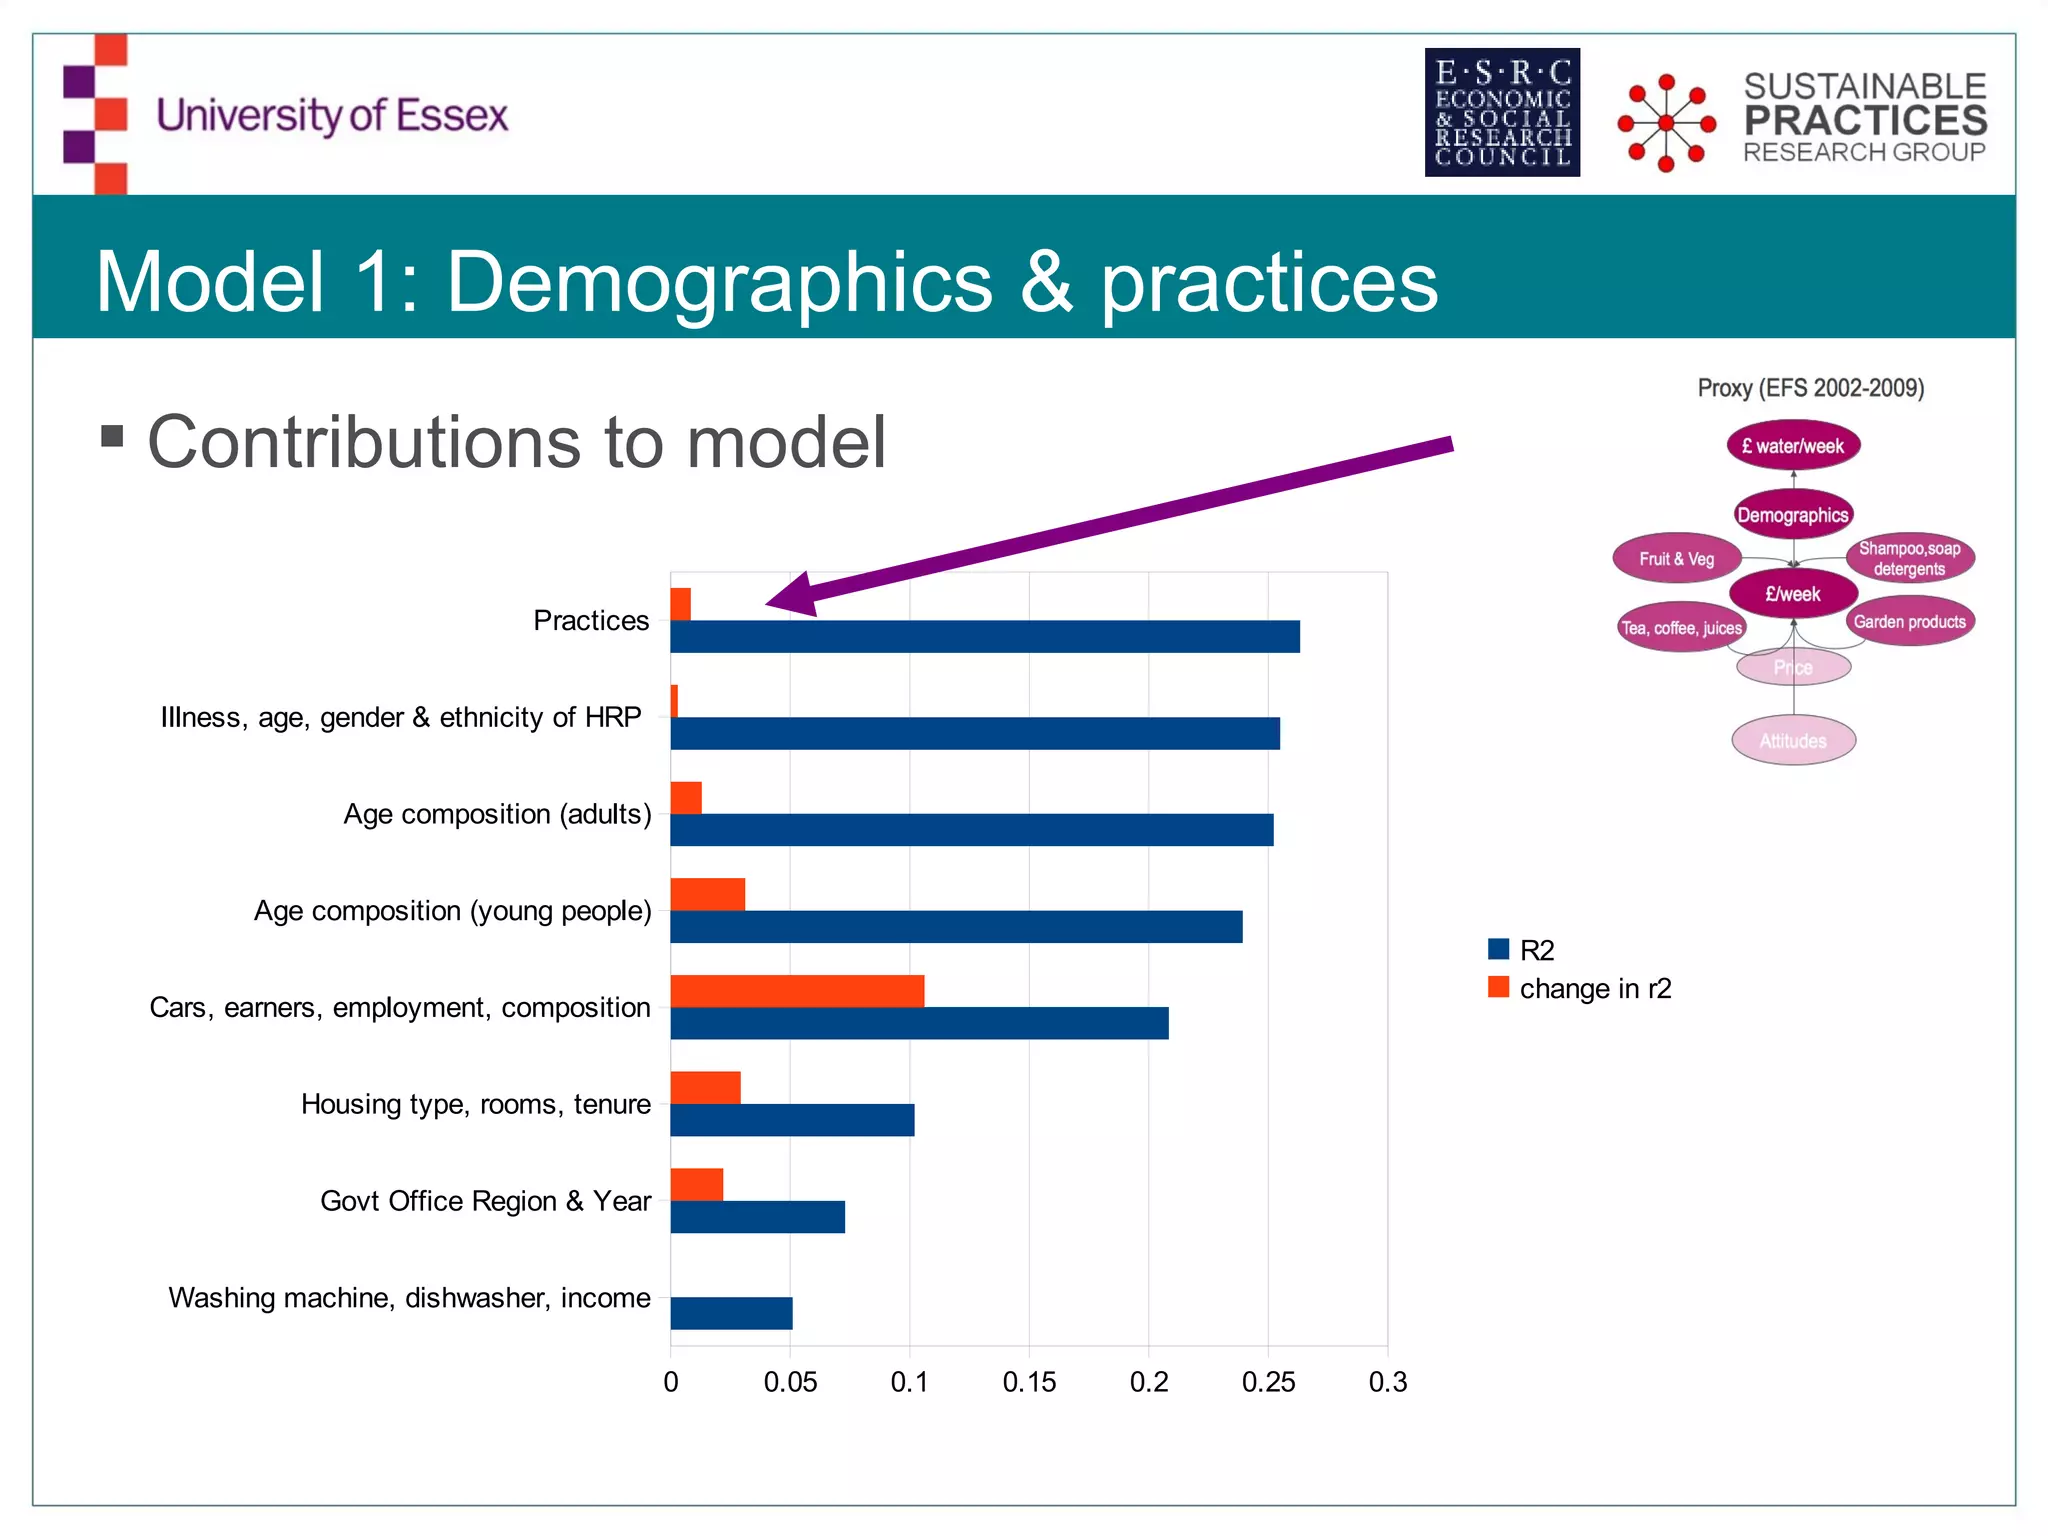
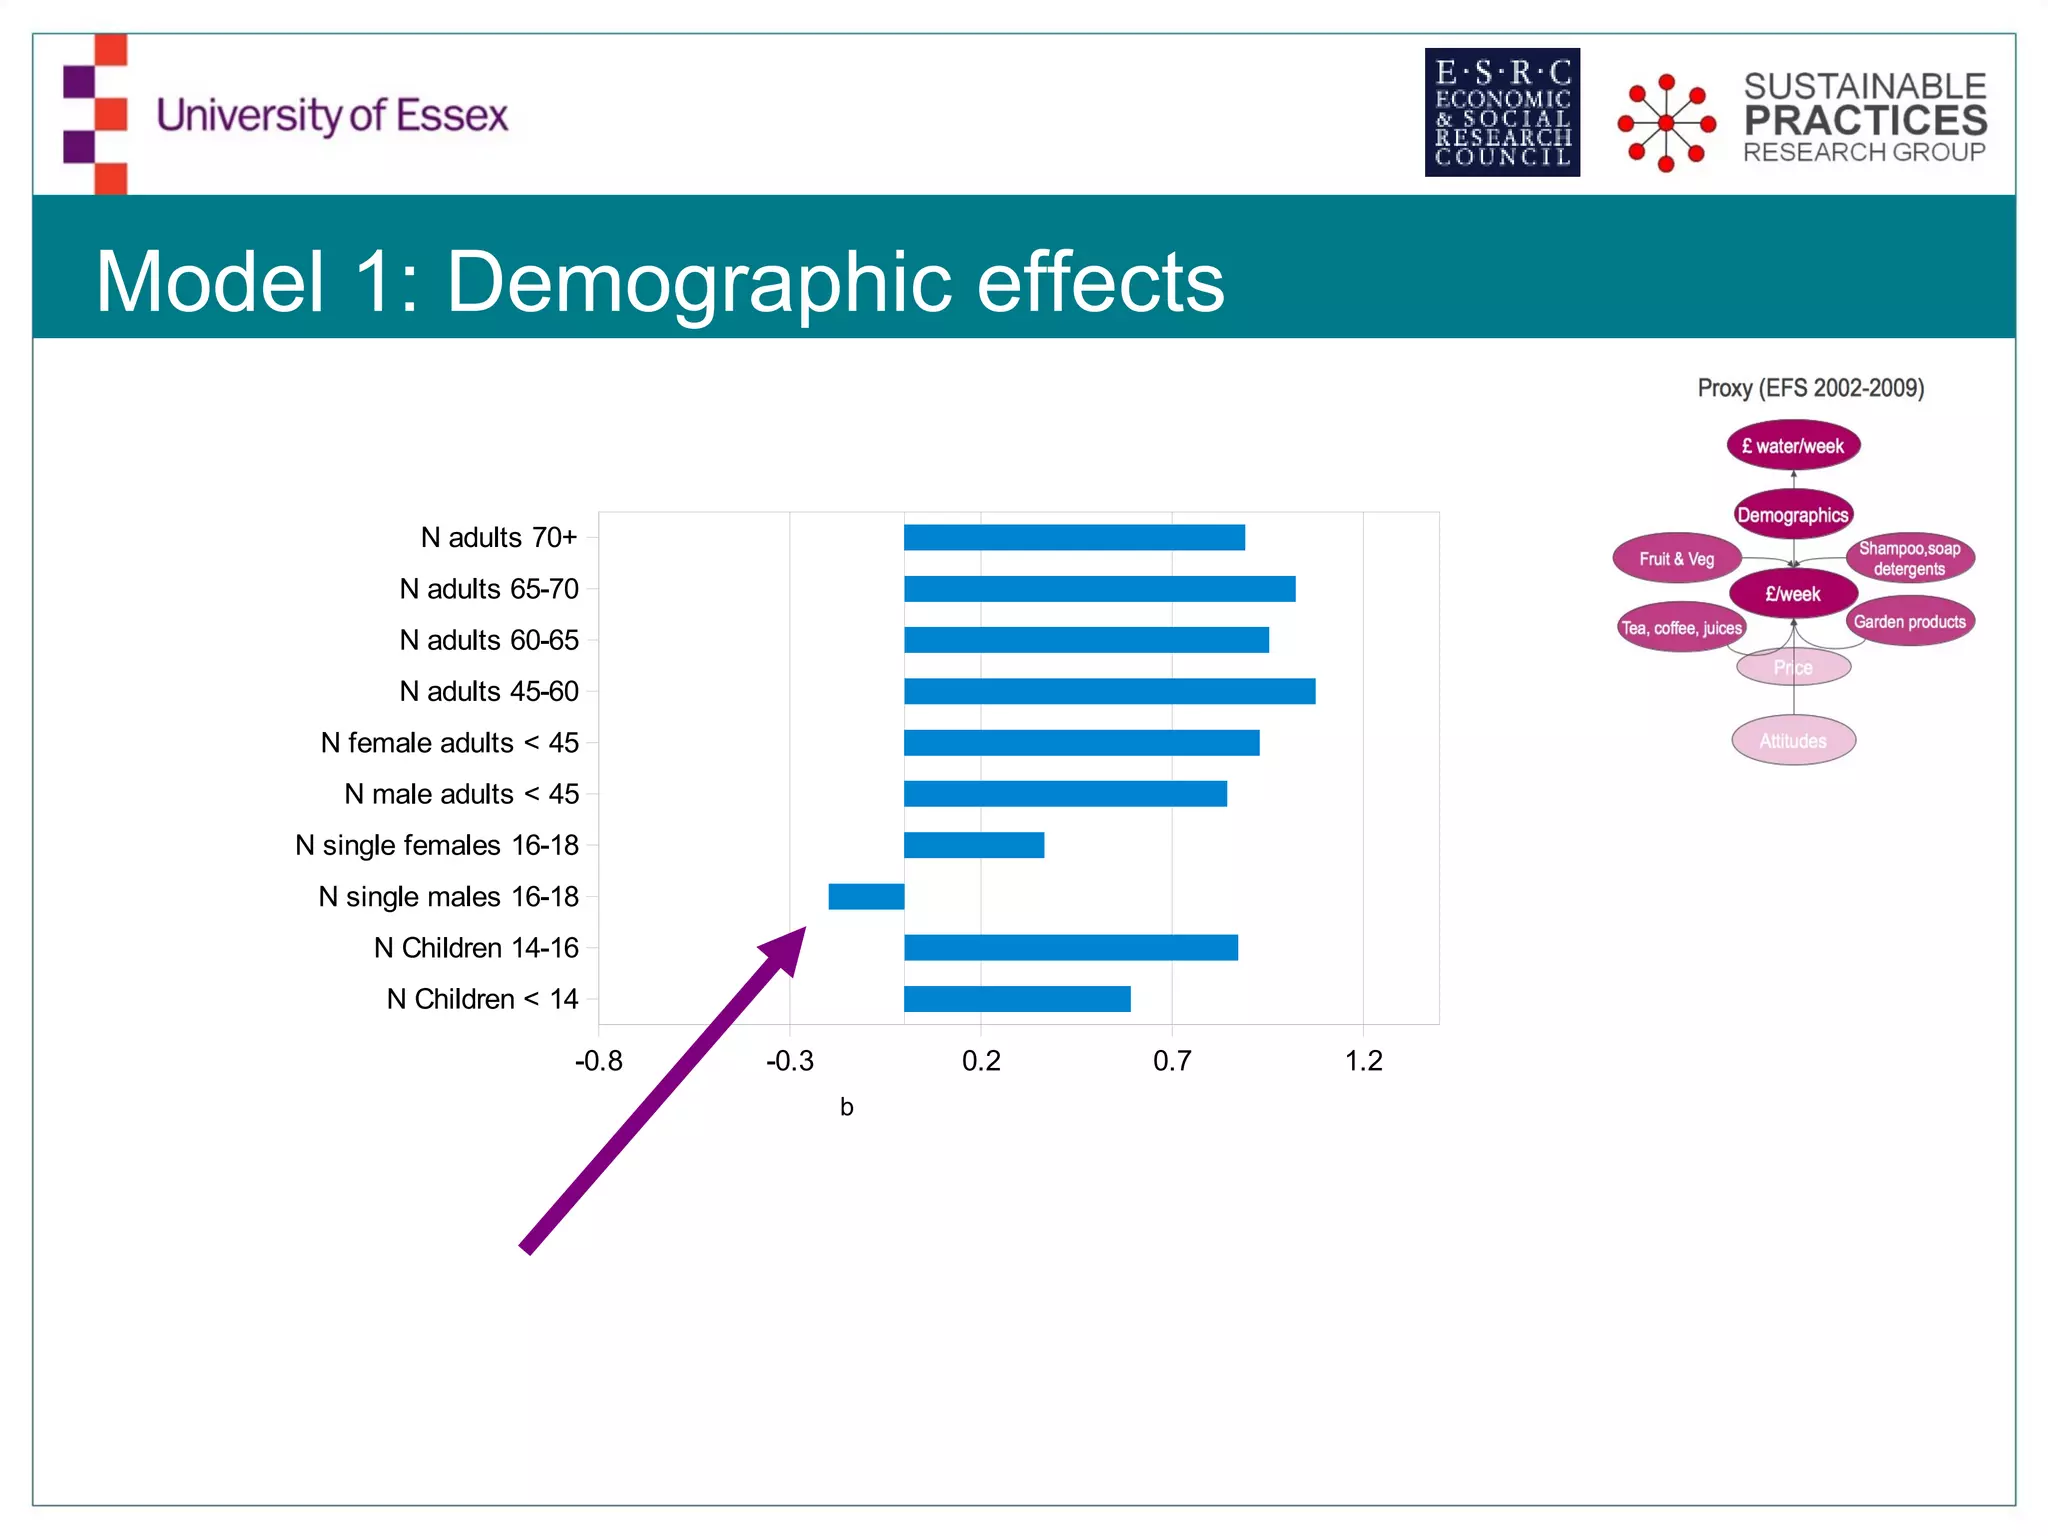
Practices by proxy:
Climate, Consumption and
Water

Dr Ben Anderson
Department of Sociology, University of Essex &
Lancaster Environment Centre

ESRC Sustainable Practices Research Group
20 March 2012
Practices: Climate, Consumption and Water
Why?
How?
What?
Where next?
Why?
Water is (going to be) a problem

 Supply problems:
    » Locally/regionally scarce
    » Climate change effects?
 Energy problems:
    » ‘Clean’ water costs and ‘clean’ is a
    moving target
 Demand problems:
    » 50% used by households
    » Drivers not well understood
    » Climate change effects?
 Demographic problems
    » Increasing single person
    households
                                             Source: Environment Agency, 2008
Water is (going to be) a problem

                   With no ‘behaviour’ change and no flow controls

                                                         2050


                                   Source: DEFRA, 2011
Micro water: Conceptual Framework
                                                               ‘habits’
                        Why people don’t do
                                                     ‘bodily and mental routines’
                         what they ‘should’
                                                       ‘permanent dispositions’


   Consumption = f(price + demographics + practices + attitudes) + error


                  Regulation/                                  Education
                   Market/         ?!               ?         Information
                    Supply                                    Exhortation


                                              Policy levers


 Climate change
What is currently unclear…

                         Consumption


 Price    Demographics            Practices                   Attitudes


                                                               Error
           Climate change                     (uncertainty/things we can’t measure)
What is currently unclear…

                         Consumption


 Price    Demographics            Practices                   Attitudes


                                                               Error
           Climate change                     (uncertainty/things we can’t measure)
What is currently unclear…

                         Consumption


 Price    Demographics            Practices                   Attitudes


                                                               Error
           Climate change                     (uncertainty/things we can’t measure)
What is currently unclear…

                         Consumption


 Price    Demographics            Practices                   Attitudes


                                                                Education
                                                               Information
                                                               Exhortation?

                                                               Error
           Climate change                     (uncertainty/things we can’t measure)
What is currently unclear…

                         Consumption


 Price    Demographics            Practices                   Attitudes


                                                               Error
           Climate change                     (uncertainty/things we can’t measure)
How?
Data I (Household water demand)
      Ideal                              Proxy (EFS 2002-2009)

   water (l/day)                         £ water/week


   Demographics                          Demographics

                                                        Shampoo,soap
                     Fruit & Veg
                                                          detergents

     Practices                              £/week
                   Tea, coffee, juices                  Garden products


       Price                                Price


     Attitudes                             Attitudes
Data II (Weather/Climate)

                  MetOffice Regional Weather records
  Weather data   http://www.metoffice.gov.uk/climate/uk/
                  Linked to
                   25                                                                                  £5.05
                   – household government office region                                                £5.00

                   – Lagged survey month
                   20                                                                                  £4.95
                                                                                                       £4.90
                  Observed
                   15                                                                                  £4.85
                                                                                                       £4.80
                   –
                   10   Mean rainfall                                                                  £4.75
                                                                                                       £4.70
                   –5   Number of rain days                                                            £4.65

                   –0
                        Mean temperature                                                               £4.60
                                                                                                       £4.55
                   –    Mean sunshine hours
                   january
                           february
                                    march
                                           april
                                                  may
                                                          june
                                                                   july
                                                                          august      october
                                                                               september
                                                                                                  december
                                                                                            november
  Climate data    3 year anomalies
                              Water £/week       Mean rainfall (cm)     Mean number
                                                                        raindays
                              Mean sunshine      Mean temperature
                              hours (/10)
Modelling approach
 2005 prices                   £7.00                                             40.00%

 Selection:                    £6.00                                             35.00%
                                                                                  30.00%
                                £5.00
 – Have water meter (England)   £4.00
                                                                                  25.00%
                                                                                  20.00%
                                £3.00
                                                                                  15.00%
                                £2.00                                             10.00%
                                £1.00                                             5.00%
                                £0.00                                             0.00%
                                        2002 2003 2004 2005 2006 2007 2008 2009

                                        No water me-   Has water   % metered
                                        ter            meter
Modelling approach
 2005 prices                      All households     39121

 Selection:                       Metered            11119
 – Have water meter (England)
                                   Separate water &    1387
 – Pay water & sewerage combined   sewerage


                                   Remaining           9732
Modelling approach
 2005 prices                                                                        All households     39121

 Selection:                                                                         Metered            11119
  – Have water meter (England)
                                                                                     Separate water &    1387
  – Pay water & sewerage combined                                                    sewerage
 Split sample into ‘seasons’

      20                                                                  £4.90      Remaining           9732

      15                                                                  £4.85

      10                                                                  £4.80

       5                                                                  £4.75

       0                                                                  £4.70
 Winter (Dec – Feb)       Spring (Mar – May) Summer (Jun – Aug) Autumn (Sep – Nov)
           Water £/week        Mean rainfall (cm)   Mean number
                                                    raindays
           Mean sunshine       Mean temperature
           hours (/10)
Modelling approach
 2005 prices
 Selection:                                     Proxy (EFS 2002-2009)
 – Have water meter (England)
 – Pay water & sewerage combined                        £ water/week
 Model 1
 – Demographics & practices, no weather/                Demographics
   climate                           Fruit & Veg
                                                                        Shampoo,soap
 Model 2 by season                                         £/week
                                                                          detergents

 – includes lagged weather & 'climate'                                  Garden products
                                      Tea, coffee, juices
 Plus controls:
                                                             Price
 – Ownership of dishwasher, income,
                                                       Climate data        Weather data
   region, tenure, number rooms, number
   of cars, number of earners,                              Attitudes
   accommodation type
What?
Model 1: Demographics & practices
 Contributions to model

                               Practices


 Illness, age, gender & ethnicity of HRP


               Age composition (adults)


        Age composition (young people)
                                                                                      R2
                                                                                      change in r2
 Cars, earners, employment, composition


            Housing type, rooms, tenure


             Govt Office Region & Year


  Washing machine, dishwasher, income

                                           0   0.05   0.1   0.15   0.2   0.25   0.3
Model 1: Demographic effects

             N adults 70+
            N adults 65-70
            N adults 60-65
            N adults 45-60
     N female adults < 45
       N male adults < 45
    N single females 16-18
     N single males 16-18
          N Children 14-16
           N Children < 14

                         -0.8   -0.3       0.2   0.7   1.2
                                       b
Model 1: ‘Practices’ effects
 Contributions to model
     Plants, flowers, seeds
              Lawn mowers
               Garden tools
      Kitchen gloves/cloths
 Detergents/washing powder
       Laundry/Laundrettes
           Soap/shower gel
       Mineral/spring water
           Vegetable juices
   Fruit juices (incl squash)
                     Coffee
                        Tea
                      Pasta
                        Rice
    Leaf & stem vegetables
                   Potatoes

                            -0.4   -0.3       -0.2   -0.1   0   0.1   0.2
                                          b
Model 2: Demographics & practices & weather
 Contributions to model (all
  seasons)
                           Weather/climate


                                  Practices


    Illness, age, gender & ethnicity of HRP


                  Age composition (adults)


           Age composition (young people)                                                R2
                                                                                         change in r2
    Cars, earners, employment, composition


               Housing type, rooms, tenure


                        Govt Office Region


     Washing machine, dishwasher, income

                                              0   0.05   0.1   0.15   0.2   0.25   0.3
Model 2: Weather effects
 Only in Autumn:

  Unusually hot & dry (rain days, 3 year anom)

    Unusually hot & dry (rainfall, 3 year anom)

             Mean temperature (3 year anom)

                            Mean temperature

                Mean sunshine (3 year anom)

                               Mean sunshine

                     Rain days (3 year anom)

                                    Rain days

                   Mean rainfall (3 year anom)

                                 Mean rainfall

                                              -3.5   -3   -2.5   -2   -1.5   -1   -0.5   0   0.5   1   1.5
                                                                                  b
Conclusions
 The practice proxies approach offers value?

 The weather data doesn't?

 Confounding problems?
         –   Expenditures as proxies?
         –   Garden/soil type?
         –   Period of water use?
         –   Included sewerage costs?
         –   Poorly matched and coarse grained weather 'regions'?
         –   Consumer water saving responses to 'dry' weather?
Where next?
• Multilevel model?
   – Weather data 'clustered'
   – But is it worth it?
• More accurate water bill period?
   – Closer match to weather
• Better geo-coding?
   – More accurate match to weather, soils,
      water prices/company
 'Practices' Survey
    Linked to water meter data
 Small area estimates of demand
    Census 2001 – 2011
 Application to energy demand?
Thank you!
• ESRC Sustainable Practices Research Group
      • www.sprg.ac.uk/projects-fellowships/patterns-of-water

Contact:
   – Ben Anderson (benander@essex.ac.uk)

Practices by proxy: Climate, Consumption and Water

  • 1.
    Practices by proxy: Climate,Consumption and Water Dr Ben Anderson Department of Sociology, University of Essex & Lancaster Environment Centre ESRC Sustainable Practices Research Group 20 March 2012
  • 2.
    Practices: Climate, Consumptionand Water Why? How? What? Where next?
  • 3.
  • 4.
    Water is (goingto be) a problem  Supply problems: » Locally/regionally scarce » Climate change effects?  Energy problems: » ‘Clean’ water costs and ‘clean’ is a moving target  Demand problems: » 50% used by households » Drivers not well understood » Climate change effects?  Demographic problems » Increasing single person households Source: Environment Agency, 2008
  • 5.
    Water is (goingto be) a problem  With no ‘behaviour’ change and no flow controls 2050 Source: DEFRA, 2011
  • 6.
    Micro water: ConceptualFramework ‘habits’ Why people don’t do ‘bodily and mental routines’ what they ‘should’ ‘permanent dispositions’ Consumption = f(price + demographics + practices + attitudes) + error Regulation/ Education Market/ ?! ? Information Supply Exhortation Policy levers Climate change
  • 7.
    What is currentlyunclear… Consumption Price Demographics Practices Attitudes Error Climate change (uncertainty/things we can’t measure)
  • 8.
    What is currentlyunclear… Consumption Price Demographics Practices Attitudes Error Climate change (uncertainty/things we can’t measure)
  • 9.
    What is currentlyunclear… Consumption Price Demographics Practices Attitudes Error Climate change (uncertainty/things we can’t measure)
  • 10.
    What is currentlyunclear… Consumption Price Demographics Practices Attitudes Education Information Exhortation? Error Climate change (uncertainty/things we can’t measure)
  • 11.
    What is currentlyunclear… Consumption Price Demographics Practices Attitudes Error Climate change (uncertainty/things we can’t measure)
  • 12.
  • 13.
    Data I (Householdwater demand) Ideal Proxy (EFS 2002-2009) water (l/day) £ water/week Demographics Demographics Shampoo,soap Fruit & Veg detergents Practices £/week Tea, coffee, juices Garden products Price Price Attitudes Attitudes
  • 14.
    Data II (Weather/Climate)  MetOffice Regional Weather records Weather data http://www.metoffice.gov.uk/climate/uk/  Linked to 25 £5.05 – household government office region £5.00 – Lagged survey month 20 £4.95 £4.90  Observed 15 £4.85 £4.80 – 10 Mean rainfall £4.75 £4.70 –5 Number of rain days £4.65 –0 Mean temperature £4.60 £4.55 – Mean sunshine hours january february march april may june july august october september december november Climate data  3 year anomalies Water £/week Mean rainfall (cm) Mean number raindays Mean sunshine Mean temperature hours (/10)
  • 15.
    Modelling approach  2005prices £7.00 40.00%  Selection: £6.00 35.00% 30.00% £5.00 – Have water meter (England) £4.00 25.00% 20.00% £3.00 15.00% £2.00 10.00% £1.00 5.00% £0.00 0.00% 2002 2003 2004 2005 2006 2007 2008 2009 No water me- Has water % metered ter meter
  • 16.
    Modelling approach  2005prices All households 39121  Selection: Metered 11119 – Have water meter (England) Separate water & 1387 – Pay water & sewerage combined sewerage Remaining 9732
  • 17.
    Modelling approach  2005prices All households 39121  Selection: Metered 11119 – Have water meter (England) Separate water & 1387 – Pay water & sewerage combined sewerage  Split sample into ‘seasons’ 20 £4.90 Remaining 9732 15 £4.85 10 £4.80 5 £4.75 0 £4.70 Winter (Dec – Feb) Spring (Mar – May) Summer (Jun – Aug) Autumn (Sep – Nov) Water £/week Mean rainfall (cm) Mean number raindays Mean sunshine Mean temperature hours (/10)
  • 18.
    Modelling approach  2005prices  Selection: Proxy (EFS 2002-2009) – Have water meter (England) – Pay water & sewerage combined £ water/week  Model 1 – Demographics & practices, no weather/ Demographics climate Fruit & Veg Shampoo,soap  Model 2 by season £/week detergents – includes lagged weather & 'climate' Garden products Tea, coffee, juices  Plus controls: Price – Ownership of dishwasher, income, Climate data Weather data region, tenure, number rooms, number of cars, number of earners, Attitudes accommodation type
  • 19.
  • 20.
    Model 1: Demographics& practices  Contributions to model Practices Illness, age, gender & ethnicity of HRP Age composition (adults) Age composition (young people) R2 change in r2 Cars, earners, employment, composition Housing type, rooms, tenure Govt Office Region & Year Washing machine, dishwasher, income 0 0.05 0.1 0.15 0.2 0.25 0.3
  • 21.
    Model 1: Demographiceffects N adults 70+ N adults 65-70 N adults 60-65 N adults 45-60 N female adults < 45 N male adults < 45 N single females 16-18 N single males 16-18 N Children 14-16 N Children < 14 -0.8 -0.3 0.2 0.7 1.2 b
  • 22.
    Model 1: ‘Practices’effects  Contributions to model Plants, flowers, seeds Lawn mowers Garden tools Kitchen gloves/cloths Detergents/washing powder Laundry/Laundrettes Soap/shower gel Mineral/spring water Vegetable juices Fruit juices (incl squash) Coffee Tea Pasta Rice Leaf & stem vegetables Potatoes -0.4 -0.3 -0.2 -0.1 0 0.1 0.2 b
  • 23.
    Model 2: Demographics& practices & weather  Contributions to model (all seasons) Weather/climate Practices Illness, age, gender & ethnicity of HRP Age composition (adults) Age composition (young people) R2 change in r2 Cars, earners, employment, composition Housing type, rooms, tenure Govt Office Region Washing machine, dishwasher, income 0 0.05 0.1 0.15 0.2 0.25 0.3
  • 24.
    Model 2: Weathereffects  Only in Autumn: Unusually hot & dry (rain days, 3 year anom) Unusually hot & dry (rainfall, 3 year anom) Mean temperature (3 year anom) Mean temperature Mean sunshine (3 year anom) Mean sunshine Rain days (3 year anom) Rain days Mean rainfall (3 year anom) Mean rainfall -3.5 -3 -2.5 -2 -1.5 -1 -0.5 0 0.5 1 1.5 b
  • 25.
    Conclusions  The practiceproxies approach offers value?  The weather data doesn't?  Confounding problems? – Expenditures as proxies? – Garden/soil type? – Period of water use? – Included sewerage costs? – Poorly matched and coarse grained weather 'regions'? – Consumer water saving responses to 'dry' weather?
  • 26.
    Where next? • Multilevelmodel? – Weather data 'clustered' – But is it worth it? • More accurate water bill period? – Closer match to weather • Better geo-coding? – More accurate match to weather, soils, water prices/company  'Practices' Survey  Linked to water meter data  Small area estimates of demand  Census 2001 – 2011
  • 27.
    Where next? • Multilevelmodel? – Weather data 'clustered' – But is it worth it? • More accurate water bill period? – Closer match to weather • Better geo-coding? – More accurate match to weather, soils, water prices/company  'Practices' Survey  Linked to water meter data  Small area estimates of demand  Census 2001 – 2011  Application to energy demand?
  • 28.
    Thank you! • ESRCSustainable Practices Research Group • www.sprg.ac.uk/projects-fellowships/patterns-of-water Contact: – Ben Anderson (benander@essex.ac.uk)

Editor's Notes

  • #5 Climate change effects on supply side - fewer rain days, heavier rain - can’t capture, supply less predictable so more storage needed Demand side - warmer summers -&gt; more domestic (bathing) &amp; gardening use?
  • #14 We can’t directly observe practices - and no data (yet) does this and also collects all the other data we need. The EFS offers a way to do this by proxy £ water expenditure/week n people, age etc Proxies for practices Shampoo, soap, detergents, gardening etc Bottled water Garden products ?