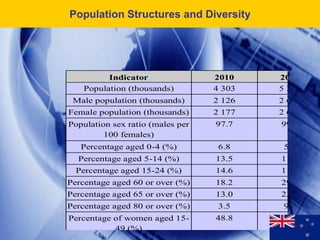
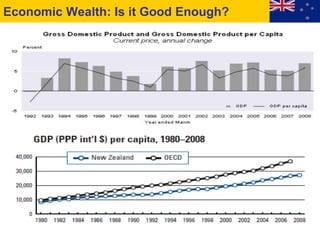
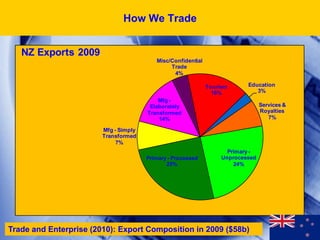
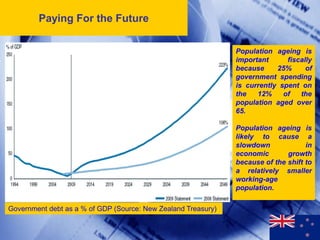
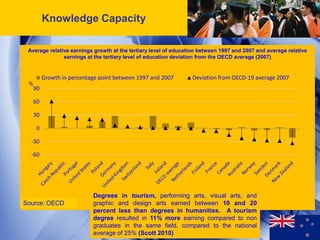
The document summarizes economic trends in the US from 1990-2010, with a focus on the housing market boom and bust. It shows that the housing market experienced strong growth from 2000-2005, with rising home sales, construction, prices and ownership. However, prices began to outstrip incomes, affordability declined, and demand started to fall after 2005, indicating the housing boom could not last.
Productivity & the Performance of the Jamaican EconomyPMI_JDBC
Dr Charles Douglas, Executive Director of the Jamaica Productivity Center, addresses the Jamaica Doctor Bird Chapter of the Project Management Institute, on the causes and possible solutions for chronic low productivity in Jamaica.
The document provides an overview of Burlington County, New Jersey with information on its labor force, employment rates, major employers, fastest growing employment sectors, largest occupations, demographics, education, transportation infrastructure, and costs of doing business. Some of the key points are:
1) The county has a civilian labor force of over 244,000 and an unemployment rate of 8.8%, higher than both New Jersey and national rates.
2) Major private sector employers include Lockheed Martin, PHH Mortgage, and Virtua hospital. The fastest growing employment sectors are nonstore retailers and administrative/support services.
3) The county has good transportation infrastructure with access to several highways, the Atlantic
Measure, measure, measure.
More and more, we hear about the importance of metrics. But what does that really mean?
Join strategy consultants Sam Frank and Michele Levy for a practical discussion about the metrics that really matter for nonprofit organizations.
The document summarizes TIM's acquisition of AES Atimus. Key points:
1) TIM is acquiring AES Atimus for R$1.6 billion, gaining 5,500 km of fiber optic network assets primarily in Sao Paulo and Rio de Janeiro.
2) Closing is expected in Q4 2011 with integration to be completed by Q1 2012.
3) The acquisition is expected to create shareholder value through OPEX/CAPEX savings of R$250 million in 2012 and R$1 billion over 3 years, accelerating mobile revenue growth, and expanding TIM's fixed line business.
This document provides an overview of key statistics and information about Newark, New Jersey. It summarizes that Newark has a civilian labor force of 108,100 with an unemployment rate of 14%. It is home to major companies like Prudential and universities like NJIT. Transportation infrastructure includes Newark Liberty International Airport and the Port of NY/NJ. The document outlines demographic, economic, educational, and cultural information about Newark.
Eaton Corporation is a diversified industrial manufacturer that saw record revenues and earnings in 2007. The company achieved this through an integrated diversification strategy focused on balancing its business across industries, geographies, and economic cycles. In 2007, Eaton continued expanding its capabilities through acquisitions in electrical systems and fluid power. It is positioned for ongoing growth in sustainable energy and power management.
Vivo Participações reported its 1Q06 results with the following highlights:
- Vivo maintained its leadership in the Brazilian cellular market with a 33.7% share and over 30 million subscribers.
- Key metrics like EBITDA, operating cash flow, and mobile ARPU declined compared to 1Q05 and 4Q05 due to competitive pressures.
- Vivo continued investing in its network to expand 3G coverage and meet Anatel quality standards, with capex of R$878 million in 1Q06.
- The company proposed a second stage of corporate restructuring to further incorporate its subsidiaries.
1) While GDP has significantly increased over the last 50 years in the UK, a new measure called the Measure of Domestic Progress (MDP) that factors in environmental and social costs has struggled to increase and has even decreased at times.
2) When environmental and social costs are considered, the data shows that despite GDP growth, people's quality of life and well-being has not improved and these costs have substantially increased over the same time period.
3) The document argues that achieving a better quality of life means meeting social, environmental, resource, and economic goals simultaneously, which governments have so far failed to do as indicated by the divergence between GDP and MDP trends.
Multiplus - Bank of America Merril Lynch 2011 Brazil ConferenceMultiplus
This investor presentation discusses Multiplus, a Brazilian loyalty program coalition. It summarizes that Multiplus has over 8 million members, partnerships with over 150 companies, and allows members to accumulate points across programs. The presentation also outlines Multiplus' sources of profit including margins on point sales, breakage on unused points, and interest income. It identifies opportunities for growth in credit card usage, consumption, air travel, and among higher income demographics in Brazil. Main strategic objectives include improving the customer experience, acquiring new partners and members, expanding redemption options, and strengthening the Multiplus brand.
This document summarizes TIM Participações S.A.'s presentation at the Morgan Stanley Latin America CEO Conference in January 2010. It discusses TIM's issues in 2008 with its strategic approach and offerings. TIM's re-launch plan focused on a new commercial approach with simplified post-paid and pre-paid plans. Some key achievements highlighted were reversing its declining market share, growing its pre-paid customer base, and ending the erosion of its post-paid base through its new plans and commercial efforts.
owens & minor F181C306-CD84-4711-A74D-75E5BFE97AA3_2008_ARfinance33
Teamwork is essential for Owens & Minor's success. The company relies on its 5,300 employees working together to (1) continuously innovate and provide new supply chain management solutions to help healthcare providers lower costs and improve efficiency, (2) maintain high customer satisfaction by accurately and quickly fulfilling orders, and (3) live the company's mission, vision, and values through community service.
This document provides an update on TIM Participações S.A.'s relaunch plan following issues in 2008. It summarizes that TIM reversed declining trends by launching new commercial approaches, including segmented plans, a "chip only" business model, and exclusive handsets. This helped grow TIM's subscriber base and market share while self-financing relaunch costs through efficiency gains. Key achievements included improved brand awareness, customer satisfaction recovery, and confirming its position as the number 2 mobile operator in Brazil by quality metrics.
NTT Company & Services provides an overview of NTT Group's global business. Key points include:
- NTT Group generates over $130 billion in annual revenue and employs over 45,000 people globally.
- NTT Com has a presence in 69 countries/regions, with subsidiaries and offices in 84 cities across 30 countries/regions.
- NTT offers a wide range of network, cloud, consulting, and other services to enterprise clients globally.
1. BRMALLS reported strong financial results in 1Q11, with net revenue up 68.4% and NOI increasing 70.5% compared to 1Q10. Same store sales growth remained strong, particularly for leisure and satellite stores.
2. The company acquired interests in three malls during the quarter for a total of R$108.7 million, with actual NOI exceeding projections. BRMALLS also opened two new projects according to schedule.
3. Subsequent to 1Q11, BRMALLS acquired Shopping Center Paralela for R$285 million, and expects to improve occupancy and NOI through active management.
1. BRMALLS reported strong financial results in 1Q11, with net revenue up 68.4% and NOI increasing 70.5% compared to 1Q10. Same store sales growth remained strong, particularly for leisure and satellite stores.
2. The company acquired interests in three malls during the quarter for a total of R$108.7 million, with actual NOI exceeding projections. BRMALLS also opened two new projects - Via Brasil Shopping and an expansion of Shopping Tamboré.
3. Looking ahead, BRMALLS has a development pipeline expected to add over 188k sqm of GLA by 2013, and concluded an acquisition of Shopping Center Paralela for
1) The company's net revenue in 1Q11 totaled R$179.1 million, up 68.4% from 1Q10. NOI reached R$158.6 million, up 70.5% from 1Q10. Adjusted EBITDA increased 58.6% to R$140.6 million.
2) Same store sales growth remained strong, particularly for leisure and satellite stores which posted double digit growth. Occupancy rates increased to 98.1% while same store rent growth was 10.1%.
3) The company acquired interests in 3 malls representing R$108.7 million in capex with an average IRR of 13.7%. Actual NO
This document discusses services marketing and provides information on several related topics. It begins with a brief introduction to services marketing and business models. It then discusses why enrolling in a services program can add value. Several pages cover the differences between products and offers, what comprises a product, and barriers to purchasing services. The document also examines the product and services lifecycle in detail. Finally, it introduces the concept of service blueprinting and why it is useful, providing an example blueprint for a design engineering process.
The document provides a presentation of TIM Participações S.A.'s 4Q09 results. Some key points:
1) TIM Brasil has undergone a repositioning track over the past 15 months to reverse client losses and return to growth, focusing on offer innovation, quality recovery, and efficiency savings of over R$1 billion.
2) 4Q09 results show signs of turnaround with growing subscriber base, traffic, ARPU and revenues increasing quarter-over-quarter. EBITDA margin expanded to 28.2% in 4Q09.
3) For the full year 2009, EBITDA increased 5.6% and net profit grew 29% compared to 2008,
1) This document presents information about SEB, a Nordic-Baltic banking group. It discusses SEB's markets, business areas, strategies for growth, and managing risks in the Baltic countries.
2) SEB has significant operations in the Nordic countries, Baltic countries, and Germany. Its main business areas are merchant banking, retail banking, and wealth management.
3) SEB's strategy is to focus on areas of strength, coordinate its universal banking offering, and achieve sustainable profit growth through productivity and operational excellence initiatives.
Natura is a Brazilian cosmetics company with $2.1 billion in annual sales and over 1 million consultants. It has a sustainable supply chain focused on biodiversity and community development. Key aspects include sourcing from over 200 suppliers in Brazil and benefiting over 2,000 families, investing $30 million annually in social responsibility programs, and having carbon neutral operations. Natura's sustainable approach to its supply chain helps drive its success while creating social and environmental value.
Trenton is New Jersey's capital city located in Mercer County. It has a population of 83,242 and its largest private sector employers include hospitals and insurance companies. The city has an unemployment rate of 12% which is higher than both the state and national rates. Major industries in Trenton include education/healthcare, professional services, and trade/transportation.
The document provides an overview of Terex Corporation for investors attending a credit suisse conference. It summarizes Terex's strategic goals to achieve $12 billion in sales and 12% operating margin by 2010. It describes Terex's diversified business segments and their growth opportunities. Finally, it shows that Terex has among the highest returns on invested capital in the machinery industry.
Motorola experienced a difficult year in 2001 with declining sales and losses. The company implemented a 5-point plan to rebuild value that included strengthening management, stabilizing finances, reducing costs, pursuing growth through innovation, and reevaluating strategies. While most sectors struggled, PCS improved market share and profitability and BCS bolstered its leadership in cable equipment through acquisitions. The company remains focused on innovation in communications solutions and returning to profitability.
This document provides information about a unit of study titled "The Changing Faces of New Zealand". It discusses three main topics that will be covered: how culture is formed and expressed; reasons why people move between places; and how the movement of people has impacted places like New Zealand. The unit will build on students' prior knowledge and teach new concepts and skills. It will look at how different cultures have influenced New Zealand through aspects like language. It also provides examples of activities and assignments students will complete, such as taking notes, creating graphic organizers, and writing summaries.
The Maori are the indigenous people of New Zealand, making up around 15% of the country's population today. They arrived in New Zealand from eastern Polynesia around 1200 AD. Before European settlement, the Maori lived throughout New Zealand. In the late 18th century, British colonists began arriving and conflicts arose between the Maori and European settlers in the 1800s. While some Maori lands were confiscated, the population has since rebounded and Maori culture remains an important part of New Zealand's national identity.
Culture counts! Official Statistics on Māori Culture from Te Kupenga 2013innovate change
In 2013, Statistics NZ undertook a sample survey that measures, among other things, how Māori engage with their culture in modern times. Check it out or click here for more information on the survey http://www.stats.govt.nz/browse_for_stats/people_and_communities/maori/TeKupenga_HOTP13.aspx
Official Whānau Statistics, Statistics NZ, 2013innovate change
The document summarizes key findings from the 2013 Te Kupenga survey conducted by Statistics New Zealand about Māori whānau and well-being. The survey focused on measuring whānau rather than just households, recognizing that whānau extend beyond single households. It found that the median whānau size is 11 people, compared to the average household size of 2.3. While most Māori feel their whānau are doing well, the traditional concept of whānau as larger than just household members is important to capture the full scope of whānau support networks.
This document summarizes key facts about New Zealand's government and politics. It notes that New Zealand has a parliamentary system with Queen Elizabeth II as head of state represented by a Governor-General. The Prime Minister leads the government as head of government. It outlines the major political parties represented in parliament, including the governing National Party led by Prime Minister John Key and the opposition Labour Party. It also provides background on the capital Wellington and largest city Auckland, as well as brief biographies of Governor-General Sir Jerry Mateparae and Prime Minister John Key.
Three generations of Distance Education Pedagogy: Challenges and OpportunitiesTerry Anderson
This document discusses three generations of distance education pedagogy: behavioral/cognitive, constructivist, and connectivist. The behavioral/cognitive approach focuses on individual learning of content through direct instruction. The constructivist approach emphasizes group learning and social construction of knowledge. The connectivist approach involves learning through networks by building connections between information and sharing knowledge. Each generation built upon the previous ones and was influenced by emerging technologies and social needs. The document provides examples of how different tools and approaches can be used to support these pedagogies in distance education.
A presentation for English HoDs in Wellington, looking at the draft Māori Education strategy through the lens of the new Curriculum and Te Mana Korero resources.
New Zealand has several types of early childhood education programs that are regulated by the Ministry of Education. These include kindergartens, education and care centers, home-based care, play centers, and kohanga reo (Maori language immersion programs). Programs follow various philosophies like believing children are gifts from God and respecting their dignity, or following the Reggio Emilia approach. The New Zealand early childhood curriculum is called Te Whāriki. Programs have qualified teachers and focus on the environment as a third teacher. Parents can access at least 20 hours per week of free early education, and subsidies are available for low-income families and those in rural areas. Staff to child ratios depend on ages,
New Zealand traditions include eating foods like meat, potatoes, fish and chips wrapped in newspaper. Popular drinks are beer and wine. Holidays celebrated include New Year's Day, Waitangi Day commemorating a treaty between Maori and Britain, and Christmas. Famous landmarks are the Auckland Harbour Bridge and Lake Wanaka which offers hiking and boating. The Parnell Rose Garden features different flowers. Notable New Zealander Russell Crowe is an Oscar-winning actor born in 1964 who began his career in 1980 and won awards for films like Gladiator. New Zealand has been the filming location for movies such as The Piano, King Kong, and The Lord of the Rings trilogy.
The document provides details about a person living in Auckland, New Zealand. It mentions the beach near their house, their high school, family members including sister Anna and parents Barry and Felicity, their cats Max and Mia, and some typical New Zealand foods like pavlova, L&P drink, and pineapple lumps. It also briefly mentions the indigenous Maori people and rugby as the national sport.
New Zealand is an island country located in the southwest Pacific Ocean comprised of two main islands and smaller surrounding islands. It has a varied climate depending on location that is generally temperate and oceanic with mild temperatures and consistent rainfall throughout the year. Temperatures and rainfall differ in specific regions, with the north generally warmer and wetter and the south cooler and drier. Notable geographic features include volcanoes, mountains, and a long coastline.
The document discusses the history of flags in New Zealand. It describes the United Tribes flag from 1834-1840, the Union Jack flag from 1840-1902 after Britain colonized New Zealand, and the current flag adopted in 1902. The current flag represents New Zealand's realm, government and people and acknowledges the country's history as a British colony. The document then expresses disagreement with changing the New Zealand flag, arguing that it would be an unnecessary expense of over $25 million that could be better spent addressing problems like the housing crisis. Changing the flag could also cause community uproar and change the face of New Zealand.
This document provides an overview of New Zealand, including that it has two main islands and cities like Auckland, Wellington, Christchurch, and Hamilton. It notes that the main languages spoken are English and Maori, and shares videos and information about Maori culture, traditions like the hongi greeting, and symbols of New Zealand like the kiwi bird, rugby, and volcanoes. It includes links to learn more about New Zealand through videos and encourages participation in games.
New Zealand is an island country located in the South Pacific Ocean. John Key is the Prime Minister and is represented by the Governor-General Sir Jerry Mateparae. The New Zealand Parliament holds legislative power and consists of the Queen and the House of Representatives. New Zealand has strong democratic institutions, high government transparency, low corruption, and high levels of civic participation and trust in political systems. The climate varies across the country and the population is growing with a diverse ethnic composition. Wellington serves as the capital and the economy relies on agriculture and tourism, including visits to Hobbiton from The Lord of the Rings films.
This document introduces the iluvnz Facebook community page, which is dedicated to celebrating and promoting New Zealand values, culture, brands, and achievements. With over 360,000 members, mostly located in New Zealand, Australia, and other English-speaking countries, iluvnz provides brands a way to engage with a large, passionate audience interested in supporting Kiwi brands. The document outlines the vision, values, and tools iluvnz offers brands to interact with the community, gain feedback, and increase awareness and sales in a positive, transparent environment.
The author prefers the first proposed New Zealand flag over the current flag because it is more colorful, creative, and uniquely represents the country with symbols like the silver fern and southern cross. They find the current flag dull, colorless, and random looking. While they feel the first flag is missing blue, they think the second proposed flag from the late 1800s has a nice creative combination.
New Zealand is an island country located in the South Pacific Ocean southeast of Australia. It has a total area of 268,680 square kilometers and a population of over 4 million people. The capital and largest city is Wellington. New Zealand has a diverse landscape that includes volcanoes, rainforests, fjords, beaches, and mountain peaks. The culture is a mix of British, Maori, and other European influences.
New Zealand is an island country located in Oceania. It has a diverse landscape that includes beaches, forests, volcanoes and thermal areas. The culture is a blend of Maori and British influences. The most popular sports are rugby and cricket. The climate varies from cool temperate to warm temperate depending on latitude and altitude. New Zealand has a modern, prosperous economy with a relatively high standard of living.
This is the presentation I gave for the event that took place on Tuesday 17 January at the War Museum, and was moderated by Ioannis Stournaras , Professor at the University of Athens and General Director of IOBE.
It was organised by ELIAMEP, IOBE, Kantor and Citizens’ Movement and was entitled:
“Investments, Development, Unemployment”
Speakers were:
Andreas Andreadis, President of the Association of Greek Tourism Enterprises
Efthymios Vidalis, President of the Board for Sustainable Development of the Hellenic Federation of Enterprises
Nikos Zonzilos Scientific Advisor of IOBE
Dimitris Papalexopoulos Managing Director of S.A. Titan
Abraham Tsoukalidis President of Positive Energy
The document discusses poverty trends in Buncombe County, North Carolina. It shows that since the recession, employment has declined the most in manufacturing, construction, and among younger workers. Female employment declined more sharply than male. The number of people receiving public assistance like Medicaid and food stamps has risen greatly. A living wage in the county is estimated to be between $13-20 per hour depending on family size, but many jobs pay less than this.
This document discusses the potential for green growth in Pacific island countries. It notes that while the Pacific islands are small and vulnerable due to their size and isolation, they have a rich resource base including fisheries and biodiversity. However, high production costs and impacts from climate change have slowed economic growth. The document outlines opportunities for green growth in the Pacific islands, including through sustainable management of marine resources like tuna and coral reefs, developing renewable energy sources, improving food security through local agriculture and fishing, reducing fuel costs through bulk purchasing, and enabling regional cooperation. Government policies like carbon taxes and green budgeting are needed to transition economies to fully green growth.
The document describes Indonesia's National Community Empowerment Program (PNCE), which consolidates 53 poverty reduction programs into a unified system to be implemented in 2009. The PNCE aims to empower communities and alleviate poverty through community-driven development. It provides block grants and technical assistance to communities to implement small-scale infrastructure projects and economic activities. The program is expected to more efficiently and effectively reduce poverty and inequality in Indonesia by harmonizing existing poverty initiatives and ensuring resources reach vulnerable communities.
ETP: 2nd year in action
This document provides an update on Malaysia's Economic Transformation Program (ETP) after 2 years of implementation. It discusses progress made in the National Key Economic Areas (NKEAs) and Strategic Reform Initiatives (SRIs), how the Malaysian economy has performed, and challenges faced. Key updates include milestones achieved in various NKEAs, liberalization efforts and regulatory reforms under the SRIs, steady GDP growth and increasing private investment, and the gradual reduction of fiscal deficit.
Promoting Rural Innovation in Western NebraskaEd Morrison
This document discusses leveraging broadband to connect Western Nebraska. It begins by asking about opportunities for rural innovation and improving quality of life through broadband. It then provides population and economic data about Western Nebraska, showing declines but also strengths in industries like agribusiness. Broadband penetration, business churn, and establishment size are discussed. Strategic doing is introduced as a process for quickly building collaborations around measurable outcomes. The regions' assets are mapped and connecting them could create opportunities. One opportunity is selected and defined with outcomes and metrics. A project is outlined with milestones to reach the outcome. An action plan is drafted and follow up details are decided to continue the work.
This chapter discusses the importance of studying services marketing. It notes that services now dominate most economies and account for over 60% of GDP worldwide. Most new employment is also being generated by the services sector. The chapter provides an overview of key topics to be covered, including the challenges of marketing services, developing an extended marketing mix for services, and integrating marketing with other management functions. It also examines factors driving the transformation of service economies, such as advances in information technology, globalization, social changes, and government policies.
National Key Economic Area – Tourism (12-5-2012)chinesechamber
This document provides an overview of the Tourism National Key Economic Area (NKEA) in Malaysia, including its projected contribution to the economy and key strategic focuses. It outlines 12 high impact projects across 5 themes to achieve the ambition of tripling tourism receipts by 2020. Each project provides details on its projected gross national income contribution, jobs created, funding, case for change, target, and progress to date. The document aims to strategically grow tourism in Malaysia through initiatives such enhancing shopping, developing integrated resorts and entertainment zones, improving nature and events offerings, and regulating the local spa industry.
This document provides an overview of the Tourism National Key Economic Area (NKEA) in Malaysia, including its projected contribution to the economy and key strategic focuses. It outlines 12 high impact projects across 5 themes to achieve the ambition of tripling tourism receipts by 2020. Each project provides details on its projected Gross National Income contribution, jobs created, funding, and progress to date. The document aims to position Malaysia as a global tourism destination through initiatives like enhancing shopping, events, nature adventure, and entertainment opportunities.
The document summarizes a procurement outreach seminar presented by the World Bank. It provides an overview of the World Bank Group's history and structure, current lending trends for projects, and how businesses can participate in World Bank-funded projects. Specifically, it discusses the Bank's top borrowing countries and sectors in fiscal year 2011, with a focus on infrastructure, health, education, energy and finance. It also outlines the typical project cycle and relationships between the Bank, borrowing countries, and contractors.
This document provides statistics and summaries of workforce services provided from July 1, 2011 to June 30, 2012. It shows that 2910 businesses were served and 305 were new businesses. The majority of services requested were job orders/job matches (63%) and training/grant information (6%). Most of the customers served were in the consumer/hospitality/tourism (29%), business/finance (7%), and manufacturing/engineering/technology (29%) industries. A total of 29,426 customers were served overall across the three workforce centers in Aberdeen, Bel Air, and Cecil counties.
Blake Lapthorn and Lane Clark & Peacock LLP Southern Pensions conference - 24...Blake Morgan
The document summarizes the agenda and presentations for the Southern Pensions conference on November 24, 2011. Nicola Walker will discuss challenges in assessing scheme liabilities, including issues around equalization, GMP equalization, drafting problems, and data quality. Richard Murphy will address steps trustees and employers can take today and tomorrow to derisk schemes, including progressive buy-ins. He emphasizes the importance of good data for managing risk and uncertainty. The conference aims to help attendees address the challenges of defined benefit schemes in the current environment.
The document compares transportation modes and development challenges between the United States, France, Sweden, and China. It also provides summaries of development plans and scenarios for various regions and cities. Key points include:
1) Auto use is higher in the US (86%) compared to other countries like France (48%) and Sweden (37%). China's auto use is currently lower at 11% but growing rapidly.
2) Plans for regions like Portland, Metro aim to reduce vehicle miles traveled through compact and mixed-use development near transit.
3) Scenarios for California's future examine impacts of different growth patterns like infill versus suburban sprawl, finding compact development saves infrastructure costs and land.
4)
The document provides an overview of efforts to advance continuum of care for military members through health information technology. It discusses integrating federal and state healthcare, patient-centered care, precision healthcare, technology integration, and working together to achieve success through a common vision of integrity, service, and excellence.
This document analyzes and compares three sustainable banks and global systemically important financial institutions (GSIFIs). It finds that the sustainable banks have higher loan-to-asset and loan-to-deposit ratios, indicating they contribute more to the real economy. The sustainable banks also have higher return on assets and faster asset and loan growth rates over 5 years. However, the GSIFIs operate more cost-efficiently with lower overhead and compensation ratios. In conclusion, while the sustainable banks and GSIFIs differ in their markets and performance, the sustainable banks generally show better support for communities and stronger financial growth.
New Zealand has experienced moderate economic growth since the 1980s after implementing market-oriented reforms in response to an economic crisis. However, GDP per capita still lags OECD peers and productivity gains have been modest. To increase prosperity, New Zealand needs to diversify away from reliance on agriculture and pursue value-added industries less impacted by isolation through entrepreneurship and foreign direct investment, especially in sectors promoting skills transfer. The marine cluster presents an opportunity as a globally competitive non-agricultural industry that could expand into related fields.
Critical Review Kepariwisataan Nasional 2012 ( Pendekatan Keilmuan )
Prof. Dr. Ir. Chafid Fandeli, MS ( Ketua Badan Penasehat Puspar UGM )
Thursday, November 22, 2012
Main Meeting Room
UGM Center for Tourism Studies
Note :
Some important things that could be discussed
1.Product better determine the success of a tourism destination
2.Economy factor will drive change values
3.A standardization not to eliminate the Authenticity Locality Uniqueness and Beauty
Bruce Morton's Talent Landscape Presentation to MassEcontaitken1
Bruce Morton, Marketing and Social Media Innovator at Allegis Group Services, shares his experience and insight on the future of hiring, talent retention and employment trends for the next decade. Expert resources brought to you by MassEcon, The Mass Alliance for Economic Development.
The document analyzes opportunities in Nigeria, finding that the country has experienced strong economic growth supported by a growing population and rising incomes. This has led to the emergence of a larger consumer base that is driving growth in industries like telecommunications, food, and film. The growing middle class and expanding populations in cities like Lagos are creating new opportunities for retailers to tap into Nigeria's rising consumer demand.
The document discusses the changing identity of tourists in the future. It suggests tourists may have more fluid identities, being educated, multicultural, and knowledgeable from increased global connections. Some tourists may seek extreme experiences, while others prefer simplicity and discretionary thrift. The concept of luxury is also changing, prioritizing quality of life and experiences over material goods and conspicuous consumption. Overall, tourists of the future may have identities defined by slowing down and focusing on authentic, basic human experiences.
This document discusses emerging technologies and their potential impact on the tourism industry by 2050. It describes how technologies like ubiquitous computing, virtual and augmented reality, gestural interfaces, and biometrics could transform the tourism experience. A story is provided about a woman named Maria who uses many of these technologies on a hypothetical trip to Edinburgh in 2050, such as an intelligent agent to plan her itinerary, augmented reality apps, and eye scans to check into her hotel. The document also discusses artificial intelligence, brain-computer interfaces, virtual avatars, and the concept of technological singularity. In conclusion, it suggests that ubiquitous connectivity and immersive technologies will continue blurring the lines between real and virtual experiences for travelers.
Demography is the most important external factor that will shape the future of tourism. In many developed nations this discussion has centred on the rapidly ageing populations and the impact of this phenomena. Governments and populations are facing changes whether it is increased cost of government pensions, the growth of health care costs, the impact of population growth in cities or the emergence of new family and household structures due to delayed family formulation, declining birth rates and growing divorce rates. The direction and composition of demographic trends will significantly shape the future of society and tourism. But it is not all doom and gloom, for the tourism industry, there is massive opportunity as we enter an era of ageless society where age is undefined. Drawing material from 'Tourism and Demography' a new book by Yeoman et al, Drs Yeoman and Smith address the contribution of the book to the literature on tourism and demography through a series of cognitive maps.
A description of the key tourism drivers that shape tourists behaviour in 2050 based upon a wealth and a desire for new experiences. Part of the www.tourism2050.com project
1. New Zealand
Population structures and
diversity
Climate change
Economic wealth :
Is it good enough?
Nothing is sacred:
Defining resource use
How we trade
Earthquake central: shocks
Paying for the future:
Fiscal responsibility or
irresponsibility
A sclerosis of
governance or not Knowledge capacity
Identity, perception
and culture
1
2. Population Structures and Diversity
Indicator 2010 2050
Population (thousands) 4 303 5 349
Male population (thousands) 2 126 2 661
Female population (thousands) 2 177 2 688
Population sex ratio (males per 97.7 99.0
100 females)
Percentage aged 0-4 (%) 6.8 5.5
Percentage aged 5-14 (%) 13.5 11.1
Percentage aged 15-24 (%) 14.6 11.4
Percentage aged 60 or over (%) 18.2 29.2
Percentage aged 65 or over (%) 13.0 23.2
Percentage aged 80 or over (%) 3.5 9.0
Percentage of women aged 15- 48.8 40.7
49 (%)
4. Economic Wealth: Is it Good
Enough?
According Gareth Morgan
(2006) New Zealand is on
the brink of a retirement
tsunami, a tidal wave of
ageing baby boomers is
about to swamp a dwindling
number of taxpayers.
Wealth Distribution Per Cohort (2007)
6. How We Trade
Median Earnings $NZ by Sector 2008
50000 $38,900
40000 $33,170
30000 $21,730 $21,700 $24,010
20000 $13,170
10000
0
Accommodatio
Recreation
Forestry and
Agriculture,
Warehousing
Retail Trade
Total Industry
Arts and
Services
Transport,
Postal and
n and Food
Fishing
Services
6
Source: Statistics New Zealand (2010)
7. Paying For the Future
Population ageing is
important fiscally
because 25% of
government spending
is currently spent on
the 12% of the
population aged over
65.
Population ageing is
likely to cause a
slowdown in
economic growth
because of the shift to
a relatively smaller
working-age
population.
Government debt as a % of GDP (Source: New Zealand Treasury)
7
8. Knowledge Capacity
Average relative earnings growth at the tertiary level of education between 1997 and 2007 and average relative
earnings at the tertiary level of education deviation from the OECD average (2007)
Growth in percentage point between 1997 and 2007 Deviation from OECD-19 average 2007
%
90
60
30
0
-30
-60
Degrees in tourism, performing arts, visual arts, and
Source: OECD graphic and design arts earned between 10 and 20
percent less than degrees in humanities. A tourism
degree resulted in 11% more earning compared to non
graduates in the same field, compared to the national 8
average of 25% (Scott 2010)
9. Knowledge Capacity
Broadband average monthly subscription price, Oct. 2008, USD PPP
Greece 30.06
Japan 30.46
Finland 30.61
United Kingdom 30.63
Italy 31.25
Switzerland 32.71
France 35.60
Hungary 36.21
Korea 37.04
Denmark 37.08
Belgium 39.64
Ireland 43.92
United States 45.52
Canada 45.65
Portugal 46.10
Austria 46.35
Luxembourg 46.66
New Zealand 47.77
Turkey 48.02
Spain 48.22 Listen to Futurist Dr
Germany 48.22
Poland 49.69 Patrick Dixon discuss
Norway 51.10 why consumers won’t
Czech Republic 52.69
Netherlands 53.86 wait here and the
Iceland 54.92 future of mobile
Australia 56.21
Mexico 59.52 technologies here
Slovak Republic 78.86
0 10 20 30 40 50 60 70 80 90 9
10. Please indicate how much Agree % Disagree % Neither agree Strongly agree Strongly
you agree or disagree with or disagree % % disagree %
Identity Perception and Culture
each of the following
statements about NZ in 2008
NZ is a bit old-fashioned 15.59% 45.49% 21.28% 1.06% 16.02%
Identity Perception and Culture
NZ is a great place to raise a 25.07% 0.73% 2.61% 70.80% 0.59%
family
NZ is like Britain in the 1950s 6.64% 35.48% 30.49% 1.09% 25.87%
NZ lives in Australia's shadow 23.39% 40.44% 15.16% 2.51% 18.17%
NZ is doing a great job seizing 31.65% 21.74% 37.73% 5.12% 3.20%
all its opportunities in the global
economy
Maori and Pacific Island cultures 48.36% 4.00% 8.06% 38.32% 0.99%
are an important part of what
makes NZ unique
NZ is strongly environmentally 48.86% 9.68% 12.36% 27.22% 1.39%
conscious as a country
NZ puts too much emphasis on 3.34% 50.94% 32.18% 0.99% 12.26%
"work-life balance"
NZ "punches above its weight" 33.30% 23.42% 31.78% 7.93% 3.14%
in global affairs
NZ is too much of a career 38.32% 23.62% 26.69% 8.72% 2.35%
dead-end for the most talented
Kiwis
NZ isn't really doing as well as 26.99% 29.07% 36.37% 4.16% 2.97%
Kiwis give themselves credit for
NZ is a great place to invest in 27.22% 14.77% 53.12% 3.11% 1.26%
business venture
I'm optimistic about NZ's 53.22% 10.14% 29.34% 6.21% 0.79
economic future
NZ is a great place to retire 37.23% 1.22% 4.29% 56.43% 0.30%
NZ arts, film and literature are 45.56% 7.73% 20.55% 24.51% 1.06%
world-class
NZ is doing a great job 52.82% 4.53% 10.80% 30.99% 0.53%
promoting its image in the rest
of the world 10
NZ has really moved ahead in 45.85% 6.31% 22.93% 22.93% 1.65%
the last 10 years
11. Identity Perception and Culture
Too New Zealand, rugby is the symbol of national identity which is
the cornerstone of conversations, stories, life and culture and
some would say there isn’t anything else …and it is the All Blacks
KaMate haka that is the symbol this identity (Yeoman 2010)
Some people might see a New Zealand identity in aspects of New Zealand history or in
New Zealand achievements in sporting, artistic or other endeavours, while others might
see it through a sense of national characteristics or traits, or through national symbols
11
and icons. Mäori culture may form one aspect of national identity, since it is both unique
12. A Sclerosis of Governance
"There have been numerous attempts since
the 1980s to make improvements to
regulatory processes. The problem is that
politicians have poor incentives; they must get
re-elected, and the political cycle is short.
Politicians are vulnerable to interest group
pressure, and at times invite that pressure by
pandering to various interest groups in search
of votes. It's unfortunate, but it's a fact of life
in a democracy” (Hide 2010)
12
13. New Zealand’s Global Competitiveness Index Results (Source WEF 2010)
Pillars World Ranking Score
A Sclerosis of Governance
Institutions 5 6.03
Infrastructure 35 4.64
Macroeconomic Stability 33 5.24
Health and Primary Education 4 6.43
Higher Education and Training 11 5.49
Goods and Services Market 8 5.20
Efficiency
Labour Market Efficiency 11 5.12
Financial Market Sophistication 3 5.69
Technological Readiness 23 5.24
Market Size 59 3.89
Business Sophistication 34 4.64
13
Innovation 23 4.10
14. Nothing is Sacred
California spends approximately $400
million annually running national parks
and beaches. California’s budget deficit is
now $24.3 billion and Governor Arnold
Schwarzenegger is proposing closure of
220 state parks to reduce this deficit
(Young, 2009).
14
15. Earthquake Central
According to the ‘Its Our
Fault’ project the major
fault running through
Wellington is 50% less
likely to rupture than
previously thought. New
findings show the
Wellington fault ruptures
every 900 years and last
ruptured about 300 years
ago. Therefore, a
catastrophic earthquake
is predicted for 600
years (GNS Science,
2009).
Watch the TV programme, Aftershock which
simulates an earthquake in Wellington 15
16. Climate Change
Direct effects………
• Shipping reasonably low value goods long distances
increasingly unsustainable.
• Potential emissions trading regime, bio fuels and
energy efficiency.
• Increases in temperatures of between 1.8 and 4.0
degrees.
• Extreme weather, rising sea levels and changed
rainfall patterns.
• Higher temperatures in the South may boost primary
sector productivity.
• Relatively favourable climate may mean NZ becomes
a preferred holiday destination (potential to attract
talented migrants)
• Strengthen competitive position but disrupt global
supply chains.
Editor's Notes
Driver Explained:New Zealand’s GDP has grown at a compound annual growth rate (CAGR) of about 6% since 2003, but other factors such as savings have declined at a rate of over twice this (Statistics New Zealand 2008). Taxes and employee remuneration have also kept pace with GDP growth, but it is the relative growth of New Zealand versus its principal trading partners that addresses the question: Is NZ’s GDP growth enough for the future? In 2010, Australia’s GDP/capita forecast to be $US50,500 versus $US31,000 for New Zealand. This gap is significant and closing it before 2050 would require growth in Australia’s economy to remain unchanged whilst New Zealand’s economy improved continuously. Australia won’t wait for us!. If New Zealand’s GDP growth manages to outstrip that of its trading partners, relative prosperity accrues at the difference between those rates outstripped Australia’s by a single percent per annum, its relative position against Australia between 2010 and 2050 would transform the current 15% lag into a 33% lead. Labour productivity contrasts unfavourably with most other OECD countries (although labour utilisation is favourable). If the objective is higher GDP per capita, there is a long-term challenge that must be surmounted. For New Zealand to achieve such an advantageous GDP growth rate, annual national (multi-factor: capital plus labour) productivity should improve by a factor of at least two! (New Zealand Treasury 2008) New Zealand’s industries have high labour utilisation (amongst the highest in the world), but the productivity of this labour is both an opportunity and a threat! It is already recognised that we are relatively hard-working, but perhaps a reputation for both hard and smart-working offers better prospects.The benefit accruing from currently high labour utilisation is that social costs of unemployment reduce, but the threat is that too much reliance on labour – as opposed to a better labour/capital mix - could stifle career development, lower wages and prompt emigration of skilled people. Comparisons with exemplars (e.g. USA) suggests that national multi-factor productivity should increase from its medium term average of about 0.9% to well over 1.7% in the future[1]. Such a shift in productivity would also suggest annual GDP growth of over 8%. These observations also heighten the need for improved productivity (mainly capital) from NZ’s future tourism product offerings if the relative performance of New Zealand is to improve. The difference between the compound annual growth rates for New Zealand’s GDP/Capita versus the OECD (World Economic Forum 2010) average is slight: 5.08% versus 4.14% over the 28 year period shown above. However, over time, this small difference compounds and creates a significant gap – recovery from which is probably equally lengthy! If the OECD average continues at 5.08% CAGR, New Zealand would need to lift its own growth rate from 4.14%/yr to 5.85%/yr between 2009 and 2050 to catch up! In other words, NZ’s GDP/capita would need to increase by 41% and remain so. This harmonises with the previous slide that suggests total factor productivity should more or less double from 0.9% to over 1.7%. If NZ’s GDP/capita growth could be doubled and held there for the next 40 years it would position the country within the top three OECD states by 2050.For the Future:New Zealand will need to enjoy some extraordinary, but positive change, in its economy. If population continues to rise, productivity needs to rise at a significantly faster rate. If population falls, the challenge is not as acute, but the skill sets remaining in NZ must be highly productive – i.e. no brain drain! Simply put, NZ is at a crossroad: the journey towards the prosperity once enjoyed (e.g. the early 1960’s when NZ was in the OECD’s top tier) requires changes in what we do and how we do it - and more radically so it if population increases also widen the socio-economic gap amongst sectors of the community.References:New Zealand Treasury (2008) New Zealand’s Productivity Performance. Accessed on the 10th April at http://www.treasury.govt.nz/publications/research-policy/tprp/08-02/05.htm/#ref8 Statistics New Zealand. (2008). National Accounts. Accessed on the 21st April 2010 at http://www.stats.govt.nz/browse_for_stats/economic_indicators/NationalAccounts/NationalAccounts_HOTPyeMar08.aspxWorld Economic Forum. (2010). The Global Competitiveness Report 2009-2010. Accessed on the 10th April 2010 at http://www.weforum.org/pdf/GCR09/GCR20092010fullreport.pdf.
Driver explained:The median earnings for a sample of the characteristic and related sectors of tourism as well as agriculture identifies further challenges that need to be considered en route to 2050 (Statistics New Zealand 2010). These sectors are important contributors to exports (the retail sector accounts for approximately 45% of tourism value added). Accommodation and food services are somewhat fundamental to any form of physical tourism yet the relatively low level of median earnings reflects several underlying factors: the inability of these two sectors to retain highly skilled people and the seasonal nature of opportunities. Analysis of the economic surpluses (the contribution to capital employed) of tourism characteristic and tourism related industries indicated relatively poor returns from the accommodation sector - in contrast with those arising from retail and recreational services (Moriarty 2010). The issue for tourism in the years ahead, at least for the latter half of the scenario horizon (2025-2050), is whether relatively low-wage products are capable of generating levels of economic value consistent with the goal of improved productivity and higher rankings within the OECD. It may also be said that the same issues apply with equal urgency to agriculture – despite this sector’s high level of research and development and technology uptake. Tourism and agriculture contribute well over 50% of total exports despite the encumbrance of seasonality. The productive capacity of these crucial sectors would rise dramatically if seasonality was overcome. Tourism’s resource utilisation would improve by at least 40% if seasonality was defeated: agriculture would likely improve by about 25 to 30%. For the future:A question that arises from the above chart is the ongoing level of tolerance that skilled people will have for the serving services sectors if they continue to remunerate at relatively low levels compared with other sectors in the economy. Those who see tourism as a vital future export sector must reconcile this desire with the reality that the median earnings of its workforce are less than half of the national average and show little sign of improving unless there is a serious change in the profitability of our visitor streams.References:Moriarty, J. P. (2007). Division Benchmarks for New Zealand Tourism and Characteristic and Related Industries 2001-2005 (No. 6c). Canterbury, NZ: TRREC, Lincoln University.Statistics New Zealand (2010): LEED Table Builder; 2008 Tax Year, Tourism Characteristic and Related Sectors. Accessed on the 1st March 2010 at http://www.stats.govt.nz/methods_and_services/access-data/TableBuilder/leed-quarterly-tables.aspx
Driver Explained: Current tax revenue is insufficient to balance current spending. Left unchanged, the income tax system will raise more revenue by pushing more and more taxpayers into higher income tax brackets – an average wage earner is projected to earn more than $70,000 by around 2023, and so face the top rate of 38%. Although increased tax revenue could help achieve a more sustainable long-term fiscal position, higher taxes are likely to result in slower economic growth and lower incomes for New Zealanders. There are serious issues around the current design of the tax system: the effect of different taxes on economic growth; international competition for people and capital; and the coherence and fairness of the tax system” (The Treasury, 2009).The recent review of the taxation system by the Tax Working Group (2010) echoed the concerns of the NZ Treasury – the current system is unsustainable as its structural deficiencies cannot support future needs. A graduated personal income taxation regime is a relatively inexpensive and pervasive method of revenue generation, more so if deductions are minimal and income is collected at source. However the situation in 2009 shows that personal income taxation not only accounts for over 50% of government income, but is sourced from a relatively small pool of “high” income earners. This pool supplies about 60% of total tax – much of which is re-distributed to others who meet the qualifying criteria for tax credits. Can New Zealand afford it’s future? The chart extrapolates to a situation that is unlikely to occur as the risk associated with funding a country like NZ to this level of sovereign deficit.Currently (2010) Greece has sovereign debt of €216b versus a GDP of about €180b (120%) but it is within the EU and remedial action from member states will occur – if only to protect the euro. New Zealand's exchange rate would collapse under similar circumstances and default would be a likely outcome as refinancing would become impossible.However, Treasury’s position is that radical restructuring is preferred over incrementalism given the demographic shifts that will occur, chronically low levels of productivity and distance-related threats (from our geographic position) in a future world of energy constraint.For the future:Many sacred cows prevent a rational approach to taxation. During the 1970s, an oil shock, widespread subsidisation of poorly performing agricultural products and an overvalued currency and excessive borrowing resulted in the near default of the New Zealand economy by 1984. History has shown that a reversal in economic prosperity can occur rapidly if a number of conditions conspire! Expectations seldom change in direct harmony with economic circumstances and this allows the possibility of wild cards to influence our ability to pay for the future. Seemingly a crisis of sorts is necessary to sanction improvements to revenue generation methods that have only changed incrementally for the past 50 years. A key issue for future debate is the policy approach: incremental change versus radical restructuring. The former risks serious underachievement in the years ahead and the latter risks immediate political backlash as it attacks current practices that a great many people have relied upon (for decades) to improve their personal wealth (property, tax loss entities - Loss Attributing Qualifying Companie, etc). What do you think should happen?References:New Zealand Treasury (2009). Challenges and Choices: New Zealand’s Long Term Fiscal Statement.Accessed on the 10th March 2010 at http://www.treasury.govt.nz/government/longterm/fiscalposition/2009 Tax Working Group(2010). A Tax System for New Zealand’s Future.Accessed on the 10th March 2010 at http://www.victoria.ac.nz/sacl/cagtr/pdf/tax-report-website.pdf
Driver Explained:New Zealand’s population performance in higher education is comparative in the OECD (2008) range with approximately 16% of the population acquiring type A tertiary education attainment (3 year degree of better), which is also the OECD average. Few would argue that improved levels of higher education are desirable and increase the knowledge capacity of a country. One of the measures of higher education is the extent to which graduates enjoy a return on their investment (in many cases a substantial liability) in comparison with those who do not undertake such studies. For the 10 years preceding 2007, those with higher education in New Zealand suffered a 30% erosion in relative earnings growth-the worst recorded in the OECD. Where have our graduates gone to? Is this situation sustainable? If this information is coupled with a relatively high proportion of skilled immigrants choosing Australia as a permanent place of residence i.e., the Brain Drain Effect. Studies by Scott (2010) highlight that tourism is a poor cousin compared to other fields of study. Degrees in tourism, performing arts, visual arts, and graphic and design arts earned between 10 and 20 percent less than degrees in humanities. A tourism degree resulted in 11% more earning compared to non graduates in the same field, compared to the national average of 25% For the Future:Modern graduates require local opportunities to earn substantially more than the average wage if they are to repay the liabilities incurred during their years of study. If these local opportunities are scarce or poorly remunerated, the outcome could be a brain drain that would not only reduce capacity for innovation but also effectively write-off public debts (student loans repaid via the tax system) incurred by departing graduates.References:Scott, D (2010) What Do Students Earn After Their Tertiary Education? Accessed on 10th March 2010 at http://www.stats.govt.nz/Publications/WorkKnowledgeAndSkills/LEED-reports/eote-what-do-students-earn-after-their-tertiary-education.aspxOECD (2008)OECD Reviews of Tertiary Education. Accessed on the 10th April at http://www.oecd.org/dataoecd/11/52/38012419.pdf.
Driver explained:The Association of broadband access with knowledge has many different facets and dimensions, the bandwidth required to replace print media is approximately 1 to 2 MB per second whereas multisensory communications require substantially more bandwidth- approximately 10 MB per second.Virtual reality not only requires high bandwidth but unlike the previous two examples, requires streaming. For example, replication of human stereo vision requires a streaming bandwidth of approximately 10 MB per second per eye.Countries that can provide cheap, fast and pervasive broadband access offer greater potential for participation, innovation and automation in future personal and business functions. This information prompts debate about the price-elasticity opportunities for broadband that lie ahead. Just as mobile telephony expanded from 0% in 1987 to about 95% by 2008, so too will broadband expand as technology is deployed. New Zealand ranks at about 50% on the OECD league table. This status also reflects the geographic challenges and low population densities and exist outside of the four major population centres(Greater Auckland, Wellington, Christchurch and Dunedin). In 2001 (Ministry of Economic Development), tourism was already assessed to be the most IT-ready sector in the New Zealand economy and well-placed to make even more extensive use of the wired world in the future - provided it can retain the skills and profitability to do so. Broadband is well advanced for urban but not so well advanced a rural tourism businesses. New Zealand also has significant legacy technology: terrestrial connectivity has restricted bandwidth (ADSL), limited competition and conveniently established duopoly pricing that suits suppliers in our small and geographically challenging market. Geographic and population density considerations that have elevated prices may one day fall victim to the currently expensive alternatives-for example satellite systems. Satellite systems remain expensive and are unlikely to replace terrestrial networks in the short to medium term (current satellite bandwidth is at best message-orientated with costs of the order of $US1 per minute). Mobile wireless currently offers approximately 2 Mb per second for fixed units and about 0.4 Mb per second for mobile units. Wireless technologies require bandwidth – a scarce global resource that is only reusable if interference can be avoided. The politics of bandwidth are also global - like the politics of air transport. A mobile network that is truly global must solve the problems of bandwidth – availability, its ‘ownership’ and pricing.For the future:Imagine global roaming using commoditisedsatellite access at streaming 4G (>>20Mb/sec) bandwidth! Further imagine that 4G bandwidth represents the lower limit of service quality. The political issues of interconnection are overcome and price competition becomes global with many competing providers. Demand and technological innovation for wireless or extended terrestrial high-speed connectivity (communities, downtown, etc) will steadily reduce costs and improve capabilities. Improved technologies and current willingness for public sector investment or subsidisation of services outside the main centres will, in the future, make steady improvements in the accessibility of high-speed telecommunications to schools, small rural communities, farms and remote tourism providers – about 25% of the population. One thing is sure, sophisticated tourists from Germany or the UK won’t tolerate poor broadband or the lack of wireless internet connection, they will simply do business else where or tell others about poor the countries poor infrastructure.References:Ministry of Economic Development (2001) Comparative Net Readiness Results: New Zealand Industries.Accessed on 10th March 2010 at http://www.med.govt.nz/templates/MultipageDocumentPage____16457.aspxOECD (2010) Broadband Portal.Accessed on the 10th March at http://www.oecd.org/document/54/0,3343,en_2649_34225_38690102_1_1_1_1,00.html
Driver Explained:It will come as no surprise to learn that New Zealanders have a very strong opinion of themselves-a can-do attitude, punches above its weight, adventurous and highly regarded by other nationalities. On the other hand there are indications of narrowness-heavy reliance on sporting success for a sense of national identity and a level of modesty or perhaps honesty - sometimes known as the tall poppy syndrome: we do not see ourselves as being the smartest and most innovative of workers. New Zealand’s isolation has not prevented reasonable performances amongst its OECD peers (KEA2009).Key results from the survey suggest: New Zealanders don’t think New Zealand is old fashionedNew Zealanders don’t think New Zealand is like Britain 48.8% of New Zealanders think New Zealand is an environmentally conscious country56.3% of New Zealanders think New Zealand is a great place to retireFor the futureReferences:KEA (2009) What does it mean to be Kiwi- Kiwi Identity Survey. Accessed on the 10th April 2010 at http://www.keanewzealand.com/sites/default/files/survey.pdf
Driver explained: Defining a national identity is not simple (Ministry of Social Development 2009) New Zealand is a diverse nation, made up of many cultural groups, with many different customs and traditions. While people may describe themselves as “New Zealanders”, how they define their “New Zealand-ness” will vary from person to person. For example, some people might see a New Zealand identity in aspects of New Zealand history or in New Zealand achievements in sporting, artistic or other endeavours, while others might see it through a sense of national characteristics or traits, or through national symbols and icons. Mäori culture may form one aspect of national identity, since it is both unique to New Zealand and a part of our identity in the outside world. Cultural identity is an important contributor to people’s wellbeing. Identifying with a particular culture makes people feel they belong and gives them a sense of security. It also provides access to social networks, which provide support and shared values and aspirations. Social networks can help to break down barriers and build a sense of trust between people. However, strong cultural identity expressed in the wrong way can contribute to barriers between groups. An established cultural identity has also been linked with positive outcomes in areas such as health and education. Mäori language is a central component of Mäori culture, and an important aspect of participation and identity. It also forms part of the broader cultural identity and heritage of New Zealand. In 1987, the Mäori language was recognised as an official New Zealand language. Almost one-quarter of all Mäori (24 per cent, or 131,600 people) reported in the 2006 Census they could hold a conversation in Mäori about everyday things. Of the 157,100 people (or 4 per cent of the total New Zealand population) who could speak Mäori in 2006, 84 per cent were Mäori. Too New Zealand, rugby is the symbol of national identity which is the cornerstone of conversations, stories, life and culture and some would say there isn’t anything else. The All Blacks is New Zealand number one brand and it is the infamousKaMate haka that symbolises what New Zealand is. For the future:In a fast paced and global world, national identity and culture say what you are and distinguish you from others. However at the same time in a fluid society, the ethnic mix of nations changes which reshapes what a country is. For example, participation in rugby faces many challenges as the number one sport of participation due increased choice and new immigrants. One of the key issues that might change in the future, like other commonwealth countries is the relationship with the United Kingdom and whether New Zealand should be a republic (Holden 2008)? References:Holden, L (2008) The Republican Handbook. www.publishme.co.nzMinistry of Social Development (2009) Cultural Identity. Accessed on 25th March 2010 at http://www.socialreport.msd.govt.nz/cultural-identity/Yeoman, I (2010) 2050: Tomorrows Tourism. Channelview, Bristol.
Driver explained:There have been numerous attempts since the 1980s to make improvements to regulatory processes. The problem is that politicians have poor incentives; they must get re-elected, and the political cycle is short. Politicians are vulnerable to interest group pressure, and at times invite that pressure by pandering to various interest groups in search of votes. It's unfortunate, but it's a fact of life in a democracy”(Hide 2010).Hides (2010) politics shares an ideology with Prof Frank Furedi (2002), author of the ‘Culture of Fear’, who writes that as society gets richer it creates more regulation as safety becomes a paramount driver. The politics of society has moved from social change to individual issues, in which government tells you what to do, whether it is ‘what you can eat’, ‘what you can drink’ or ‘we recommend you don’t do this’. Furedi (2002) is not advocating that the issues of climate change and healthy eating shouldn’t be debated and advice offered, just that government across the world are focusing on ‘you and how you live your life’ at a very micro level, all of which creates regulation and adverse risk society. This is the motivation of the ACT Party under Roger Hide, a political agenda based upon less regulation and less state intervention. A viewpoint, which is the nature of politics. However no man is an island in the present world order: considerable legislative obligations arise from the World Health Organisation, the International LabourOrganisation, the World Trade Organisation, International Air Transport Authority, the Stockholm Convention and so on and so on. The concepts of sovereignty are steadily being eroded by mandatory ratification of global decisions and there is no hint of this trend declining. Rapid and pervasive communications also establish ‘fashionable patterns’ at personal and community level. Although the correlation seems rather weak at times, Western countries also engender the perception of sensitivity to trade or aid associations with those exhibiting indifferent regard to the human rights of others. For the future:Extrapolation of what occurs between European Union member states is a possibility for an increasingly regulated New Zealand and the world. The consequences of opting out of global regulations-particularly for small nations such as ours-would become increasingly disadvantageous in terms of trade and travel.References: Hide, R (2010) published by Rodney Hide at 3:25pm on 13 Apr 2010. Accessed on the 21st April at http://www.act.org.nz/news/regulatory-responsibility-billFuredi, F (2002) Culture of Fear, Continuum. LondonYeoman, I (2008) Tomorrows Tourist. Elsevier. Oxford.
Driver explained:The World Economic Forum blithely recommends a course of action that may be desirable but likely lies beyond the capacity of New Zealand in the short to medium term. Innovation capacity calls for a greater interest in and application of science and engineering - examples of which can be found in fledgeling” incubators” in the major centres. Infrastructure (broadband, rating, knowledge facilities-universities and research institutes) are problematic in the short term as the revenue to do so is not available and government debt levels are rising in support of “business as usual”. The higher rankings at New Zealand has secured in health and education and government institutions are exemplary but they do not contribute directly to GDP. The two areas where New Zealand’s global competitiveness has exemplary ratings are in labour market efficiency and financial market sophistication. Historically, New Zealand’s labour market reflected the practices of the United Kingdom and Australia-heavily unionised, highly regulated and inflexible. Since the economic restructuring of 1984, labour markets have slowly trended towards less regulation with an oscillating bias in favour of the employer and the employee. Financial market sophistication has arisen primarily from a laissez-faire approach by government. This approach attracts criticism for its sclerosis in providing sufficient resources to regulatory bodies such as the Commerce Commission, the Serious Fraud Office and the Securities Commission. Whereas transgressions are dealt with rapidly in overseas jurisdictions such as the United States, similar transgressions in New Zealand may take years to reach the courts and provide relief to those disadvantaged by this lack of enforcement or regulatory capacity. The financial crisis of 2008 highlights many of these concerns.In the areas of technological readiness, business sophistication and innovation the remaining factor of market size exerts its influence. In a report to the Ministry of Economic Development, University of Otago (2006) found that many small and medium-sized businesses eschewed export readiness because shareholder aspirations could be satisfied from moderate growth in a relatively risk-free manner from trading in the local marketplace. Export readiness provides those who seek it with the incentive to improve the sophistication of their business and production methodologies. The tourism industry relies upon the export market for approximately 45% of its seasonal opportunity and as mentioned earlier, is significantly more technologically prepared than other sectors. For the future:There is a tension between this driver and its counterpart “nothing is sacred”. The conjunction of a small market, naïve un-sophistication, under resourced regulatory authorities and a pressing need for greater government income to correct these disadvantages may lead to a future where previously unpalatable alternatives are placed before the public. The question for the future is whether a significant shift in priority towards GDP enhancing activities will be resisted because of the threats they pose to our current, relatively comfortable, lifestyle.Efficient infrastructure coupled with more pervasive use of technology and intellectual property production of the possibilities that would also assist tourism. As mentioned in previous drivers, with the theoretical efficiency tourism’s infrastructure was achieved by the elimination of seasonality, the overall efficiency improvement would be about 40 percent and improve New Zealand’s GDP by about five or six percent (based on TSA 2009).References:Ministry of Economic Development (2006) COMET Accelerator Project Report, http://www.med.govt.nz/templates/MultipageDocumentTOC____23758.aspxStatistics New Zealand (2009) Tourism Satellite Account. Accessed on the 1st April at http://www.stats.govt.nz/reports/analytical-reports/tourism-satellite-account-2009.aspxWorld Economic Forum. (2010). The Global Competitiveness Report 2009-2010. Accessed on 1st April at http://www.weforum.org/pdf/GCR09/GCR20092010fullreport.pdf.
Driver explained:The New Zealand governments proposal to allow mining in conversation land, from areas on the Great Barrier Island to Abel Tasman National park (Brownlee & Wilkinson 2010) is a debate and a fact that is happening around the world, whether it is Alaska and oil or a Donald Trump golf course and sand dunes in Aberdeenshire. This is an example that nothing is scared and futures are contested. Gain without pain seldom occurs! The parallel of California’s predicament (Young 2009) is the current situation facing New Zealand’s government in 2010-new revenues are needed to satisfy the future needs of the electorate. However, the electorate does not wish to sacrifice the generous intergenerational inequities that have arisen from a tax system that has principally been driven by fiscal drag. Examples of sacred cows abound: an abhorrence of capital gain taxation on personal property investments, free health care, a liveable superannuation, static consumption taxation, saving incentives, greater energy availability without altering the conservation estate and invisible mineral extraction.For the future:A quandary for the future will be the tension between those who are earning and paying taxes and those who are not. Will their values be the same? Will the balance of the voter power reside with those responsible for earning or will it be with those principally consuming? The answers to these questions will shape the future of tourism as the principal driver for inbound tourism is the diversity and ease of access to our landscapes. Can the public estate simultaneously satisfy the needs of our visitors, ardent conservationists and mineral extractors?ReferencesYoung, S (2009) Schwarzenegger Would Close 220 State Parks To Cut Deficit. Accessed on the 12th April at http://www.huffingtonpost.com/2009/05/29/schwarzenegger-would-clos_n_208941.htmlBrownlee, G & Wilkinson, K (2010) Time to Discuss Maximising our Mineral Potential. Accessed on 14th April at http://www.beehive.govt.nz/release/time+discuss+maximising+our+mineral+potential
Driver explained:The apocalyptic impact of a severe earthquake is hardly the stuff of fiction for New Zealanders. Chile suffered an 8.8 magnitude earthquake on February 27th 2010 and high severities have been no strangers to New Zealand in our geological history. Records dating from the 1840s show that, on average, New Zealand can expect several magnitude 6 earthquakes every year, one magnitude 7 every 10 years, and an 8 every century. Large earthquakes are not evenly spaced, and they sometimes arrive in bunches (GNS 2010). The earthquake is also a metaphor for a low probability, high severity event that might affect the future of tourism in New Zealand. Unless a high severity earthquake (magnitude 6 or more) affects a major visitor centre or transport corridor (e.g. Fiordland Lakes District), such an event is unlikely to have a long-lasting impact on visitor preferences. Of course contingency plans, available relief resources and corridor diversity help to assuage the effects of a serious earthquake, as does the design and construction of critical infrastructure such as bridges and buildings. There are also other low probability but high severity events; pandemics, volcanic eruption (and lahars), tsunamis, hurricanes and meteor strikes being examples of natural phenomena that have the capacity to inflict great harm at both local and regional level. Mt Tarawera (1886) and the TangiwaiLahar (1953) are modern examples of natural events that claimed many hundreds of travelers' lives. A modern-day Tarawera could affect the future of tourism (over 1.5 million visitors annually) in Rotorua for a decade. For the future:Identification of possible low probability but high impact events that might affect the future of tourism in New Zealand require linkage to key visitor centers and corridors so that impacts in excess of what would be suffered by local residents can also be considered. References:GNS (2010). EarthquakeFrequency Accessed on 20th April at http://www.gns.cri.nz/what/earthact/earthquakes/earthquakefaq.html#2