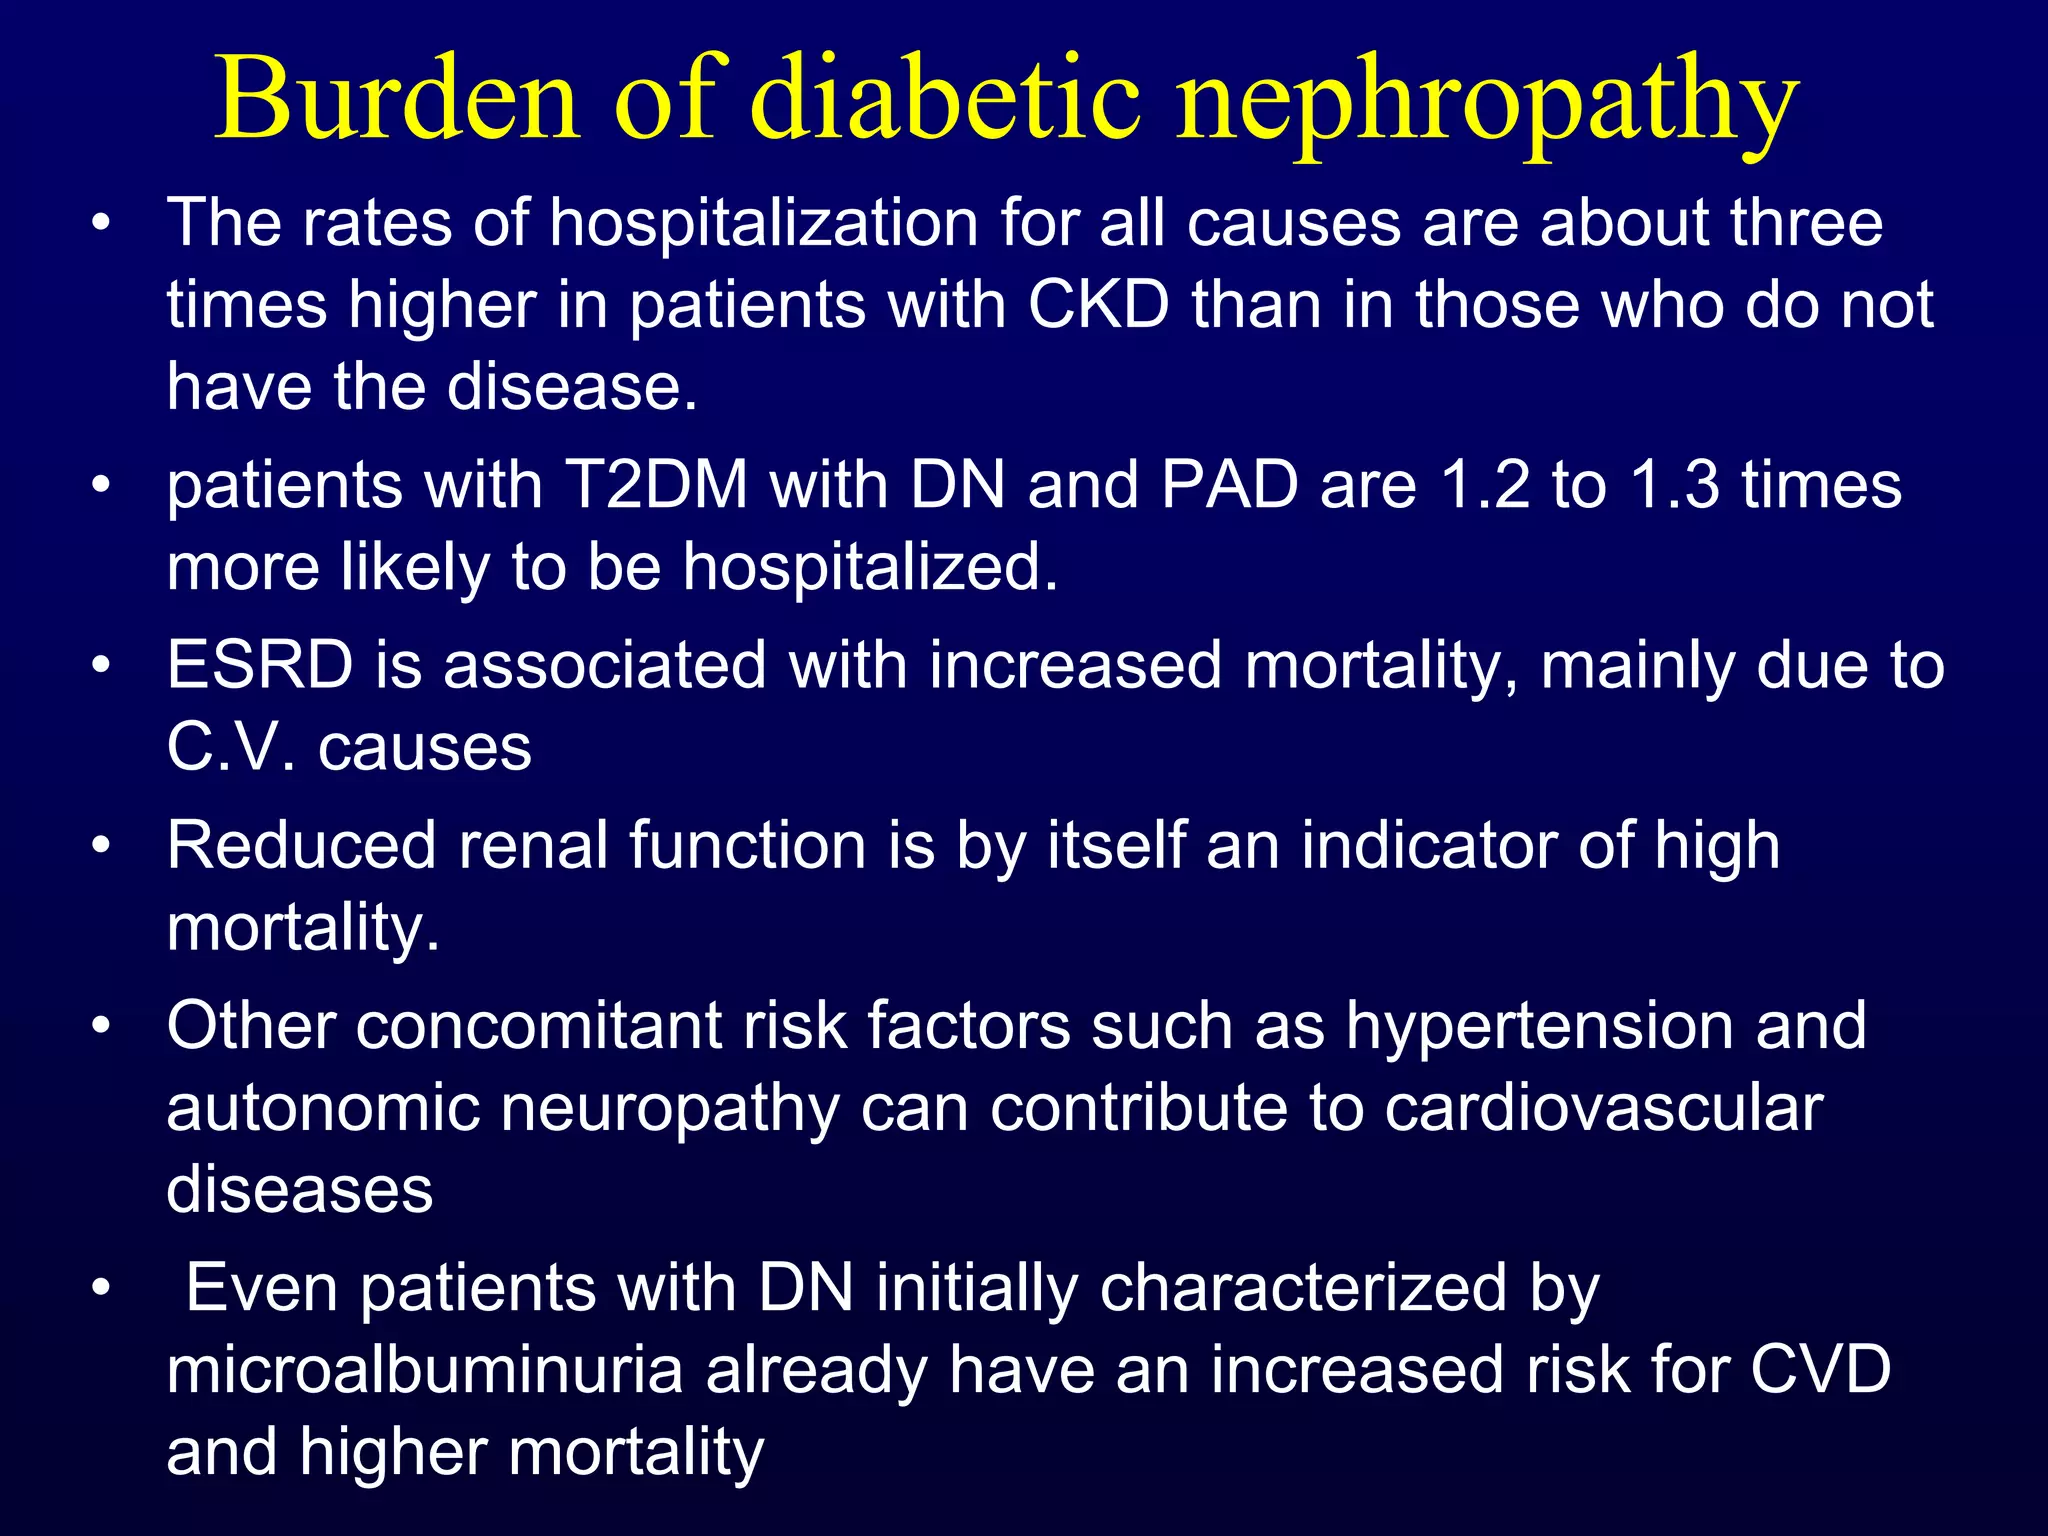
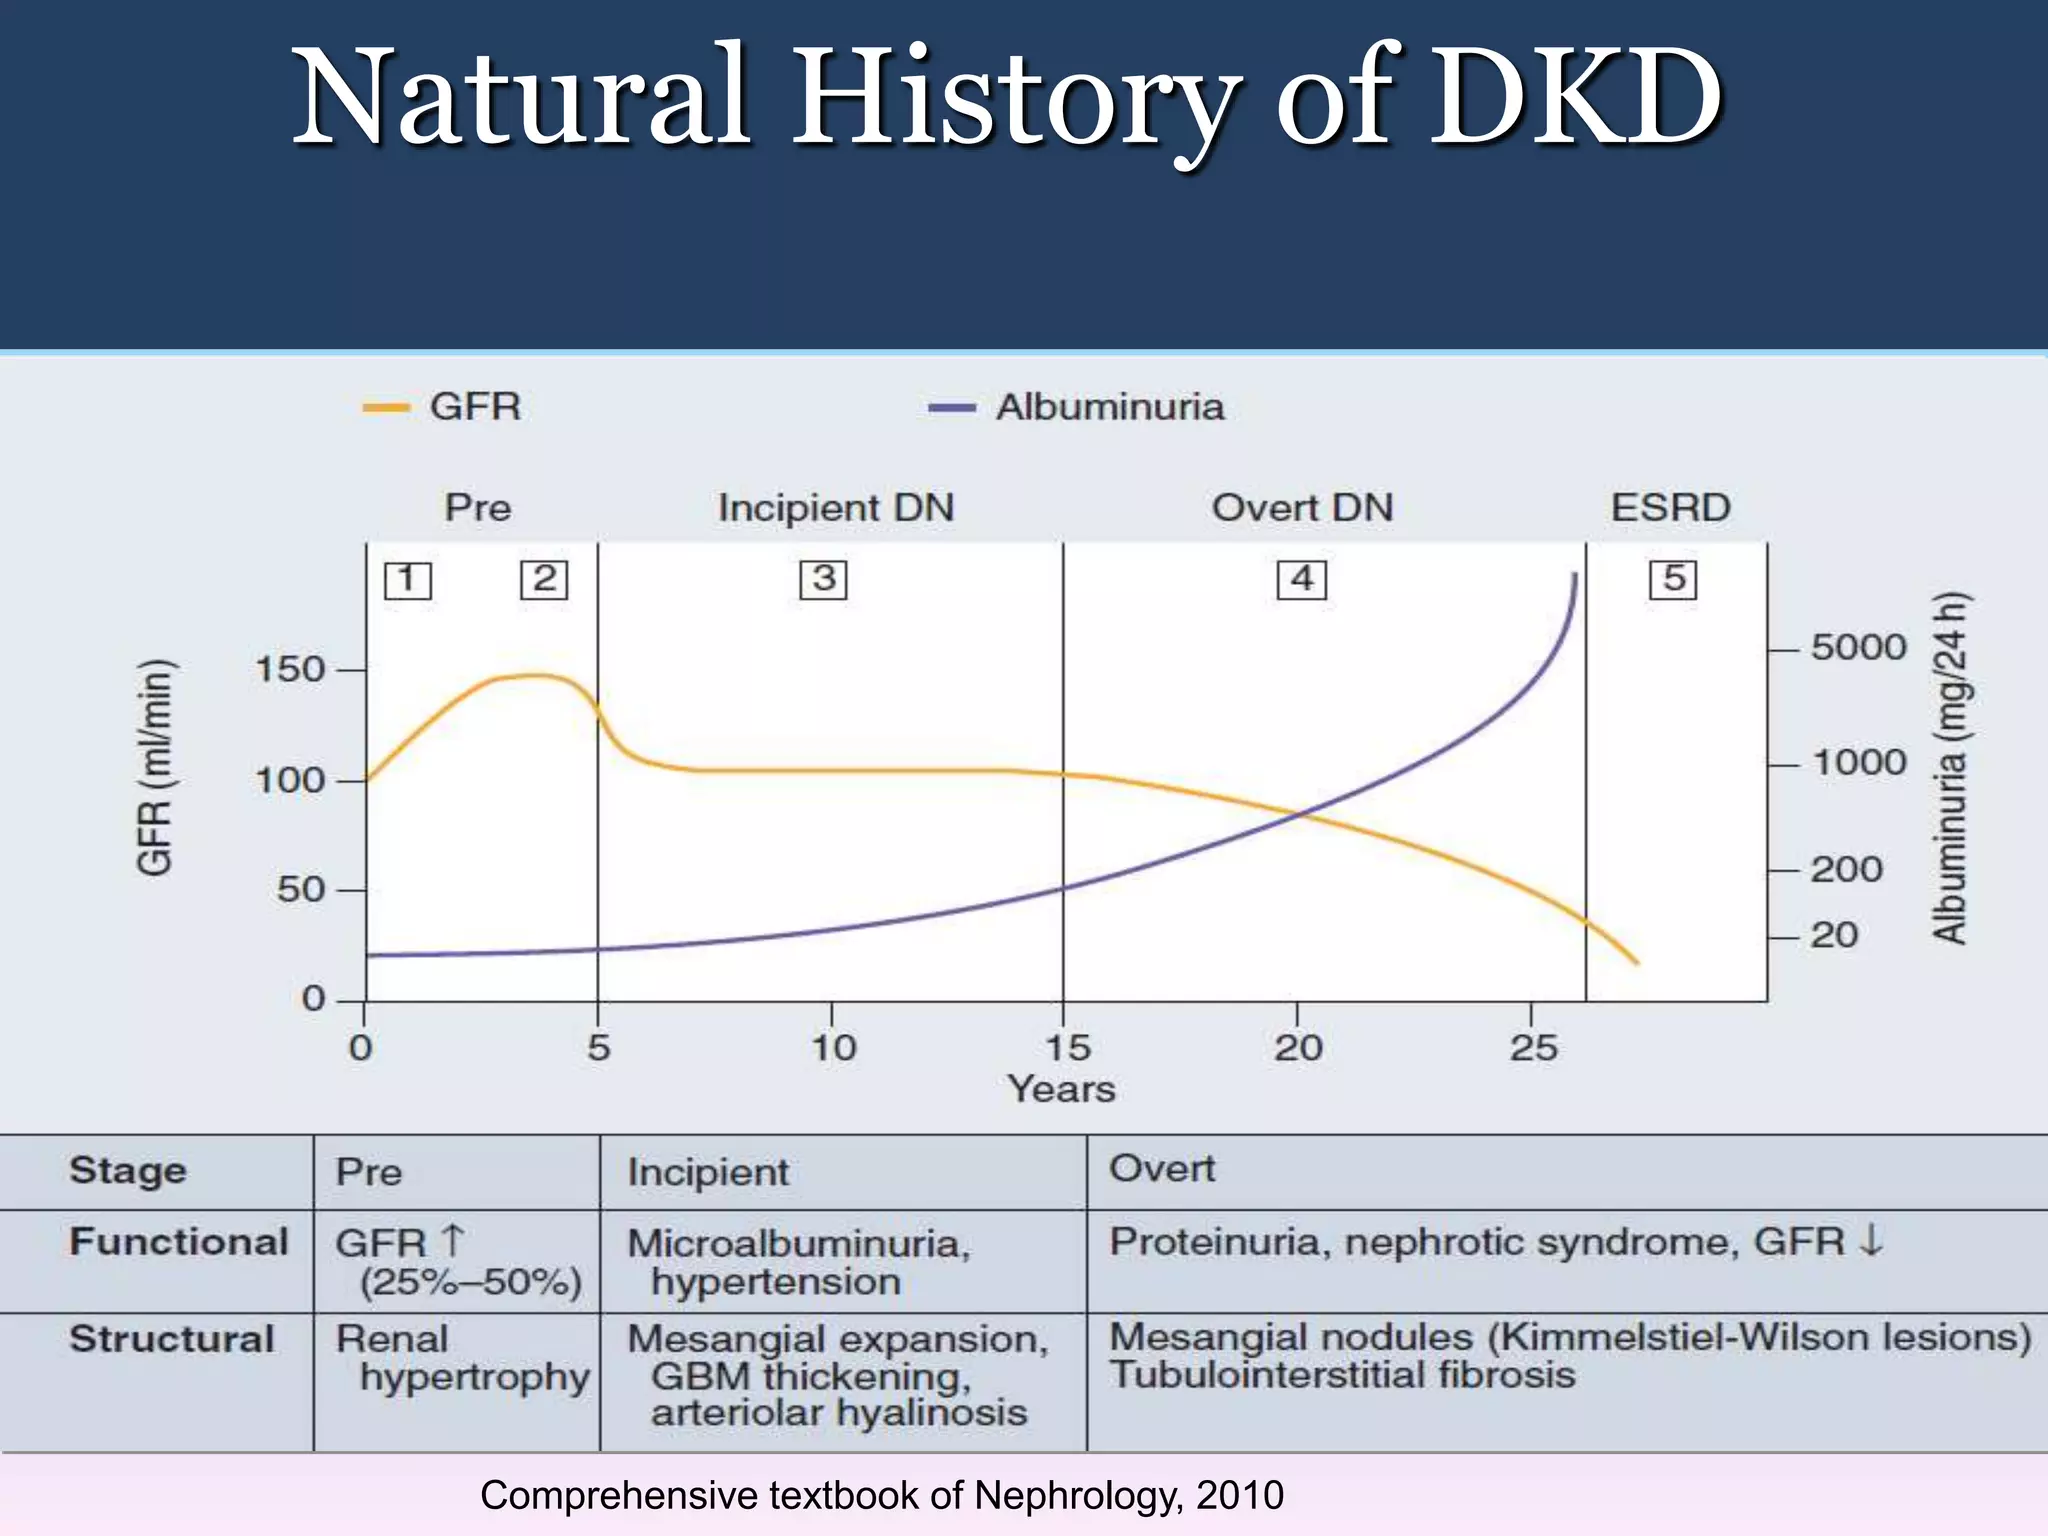
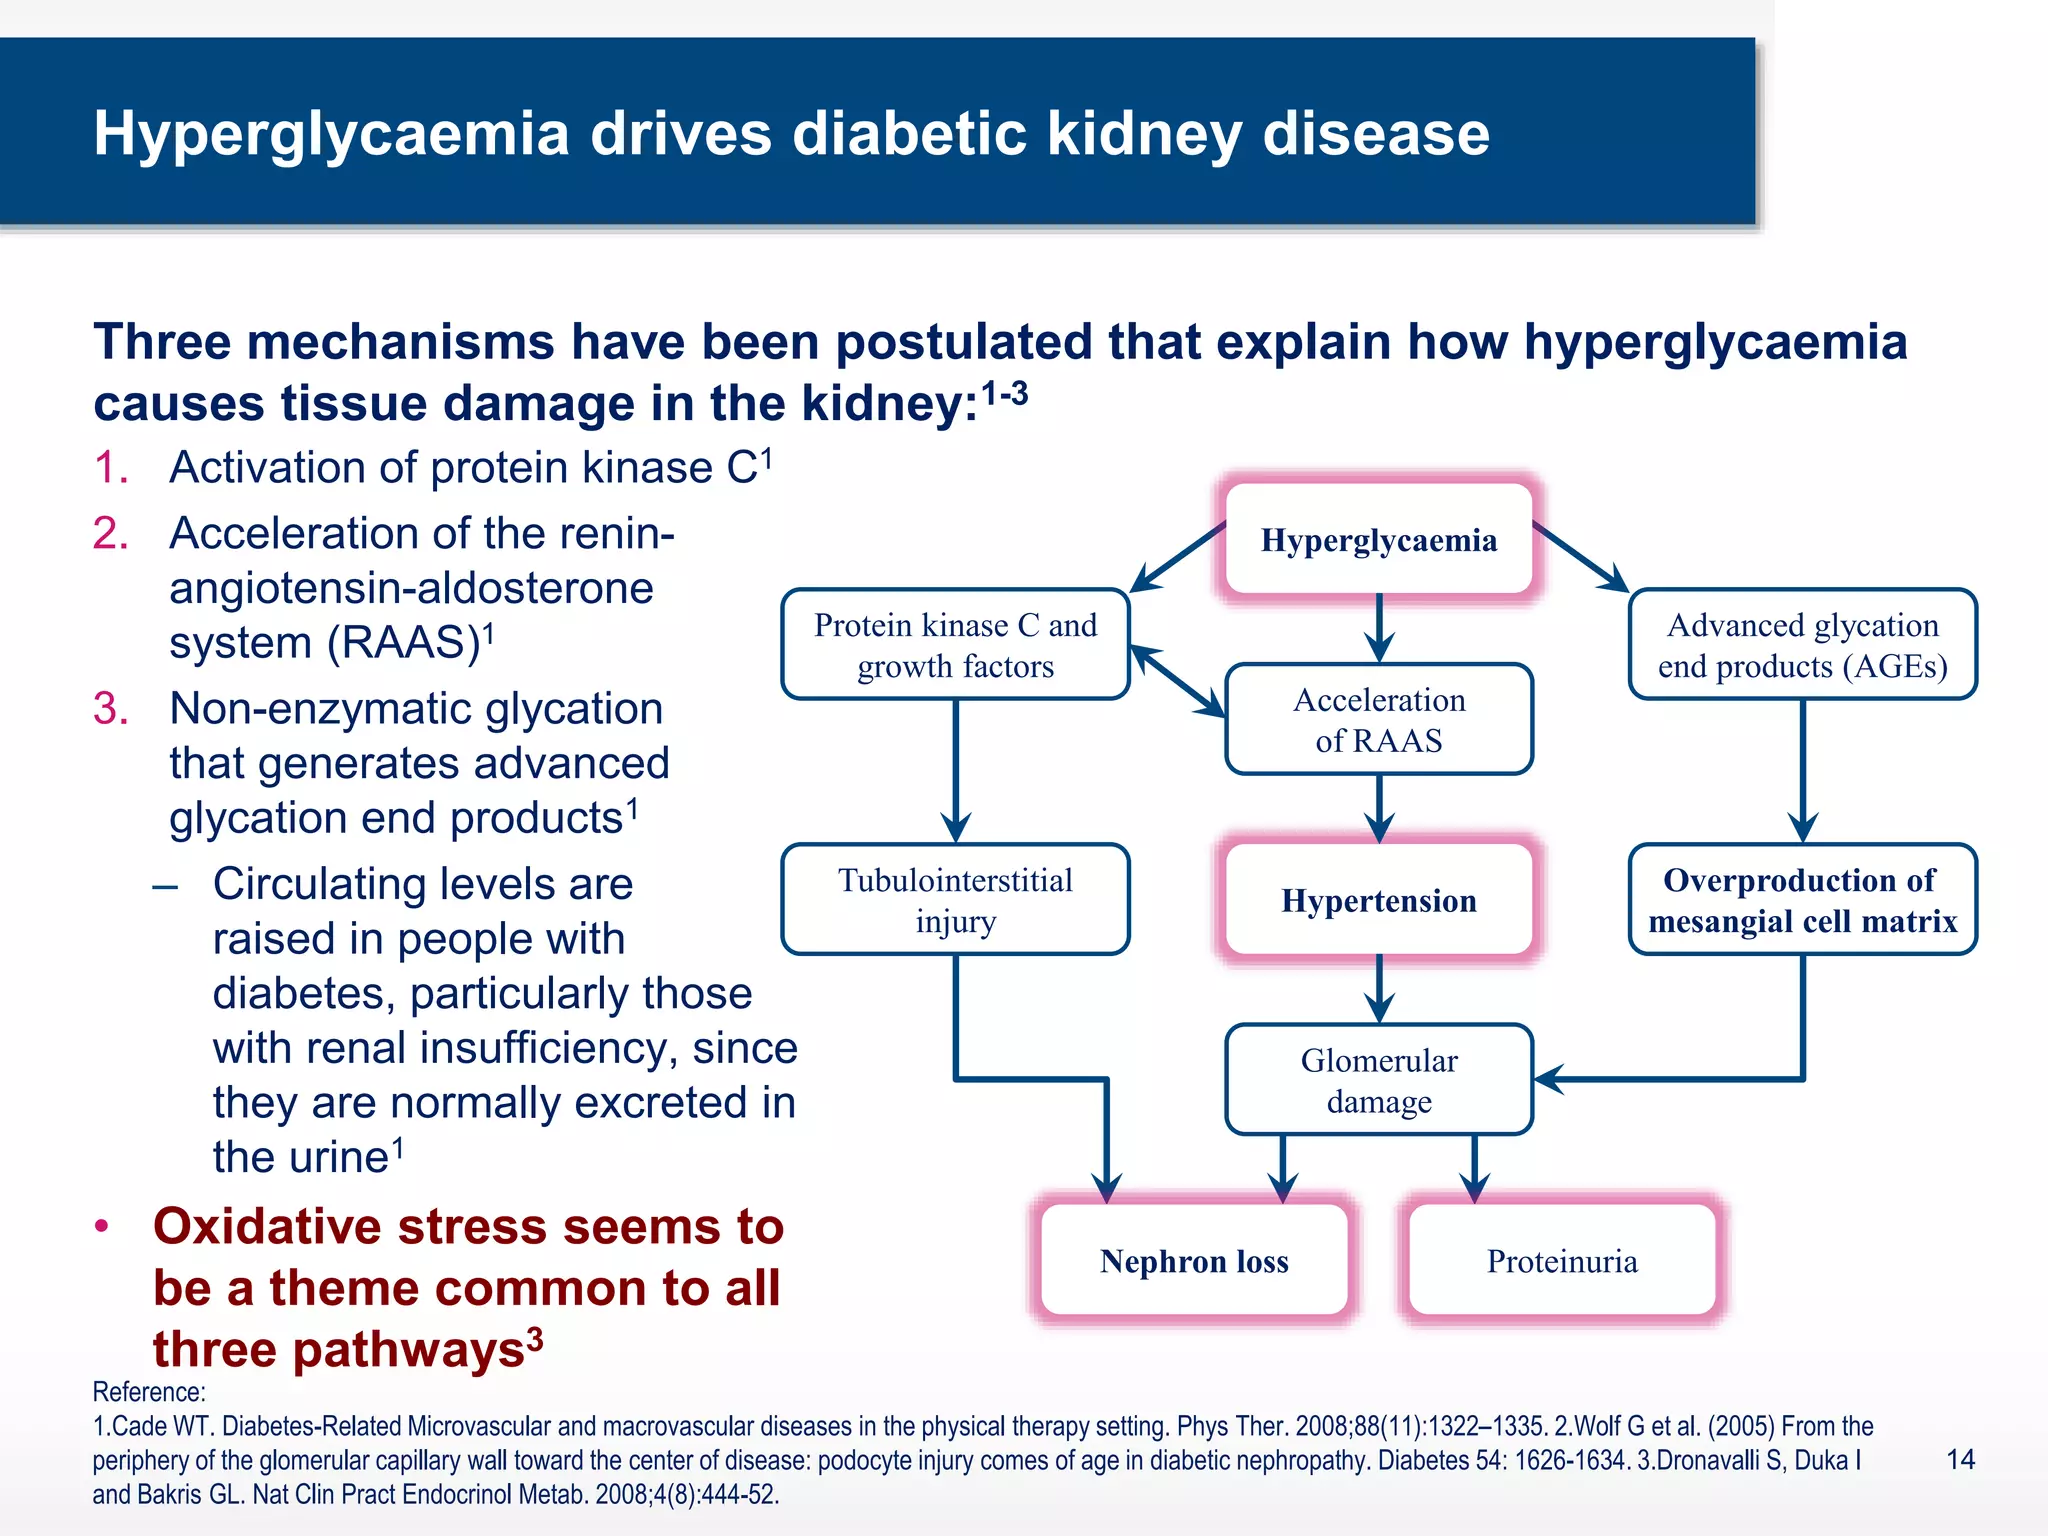
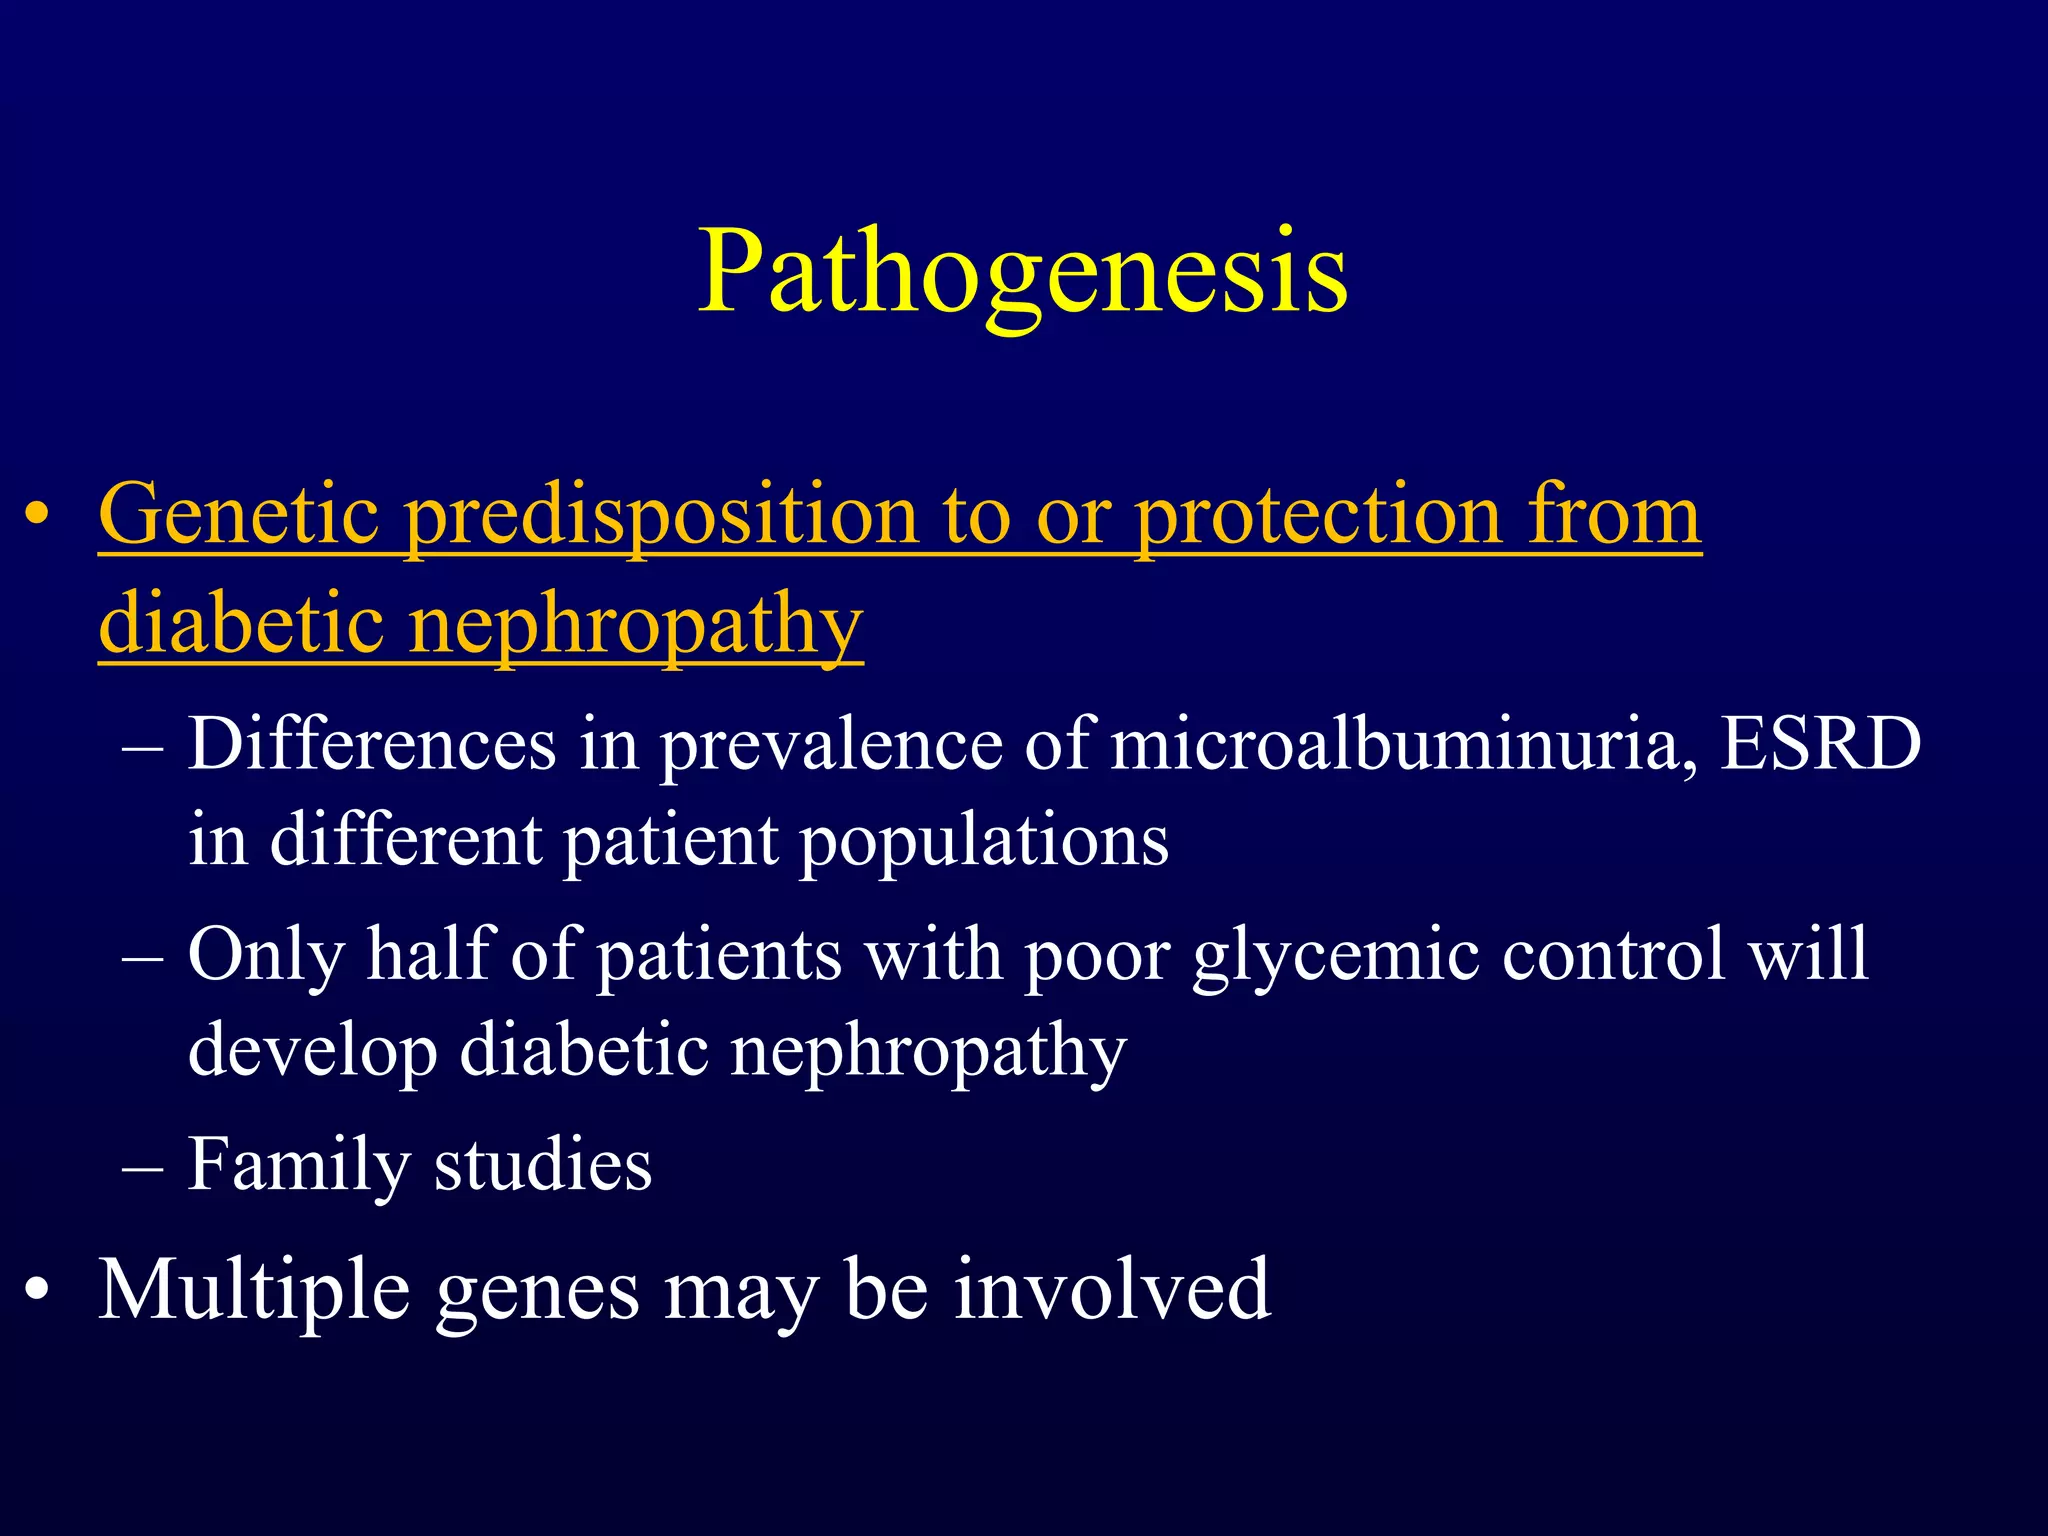
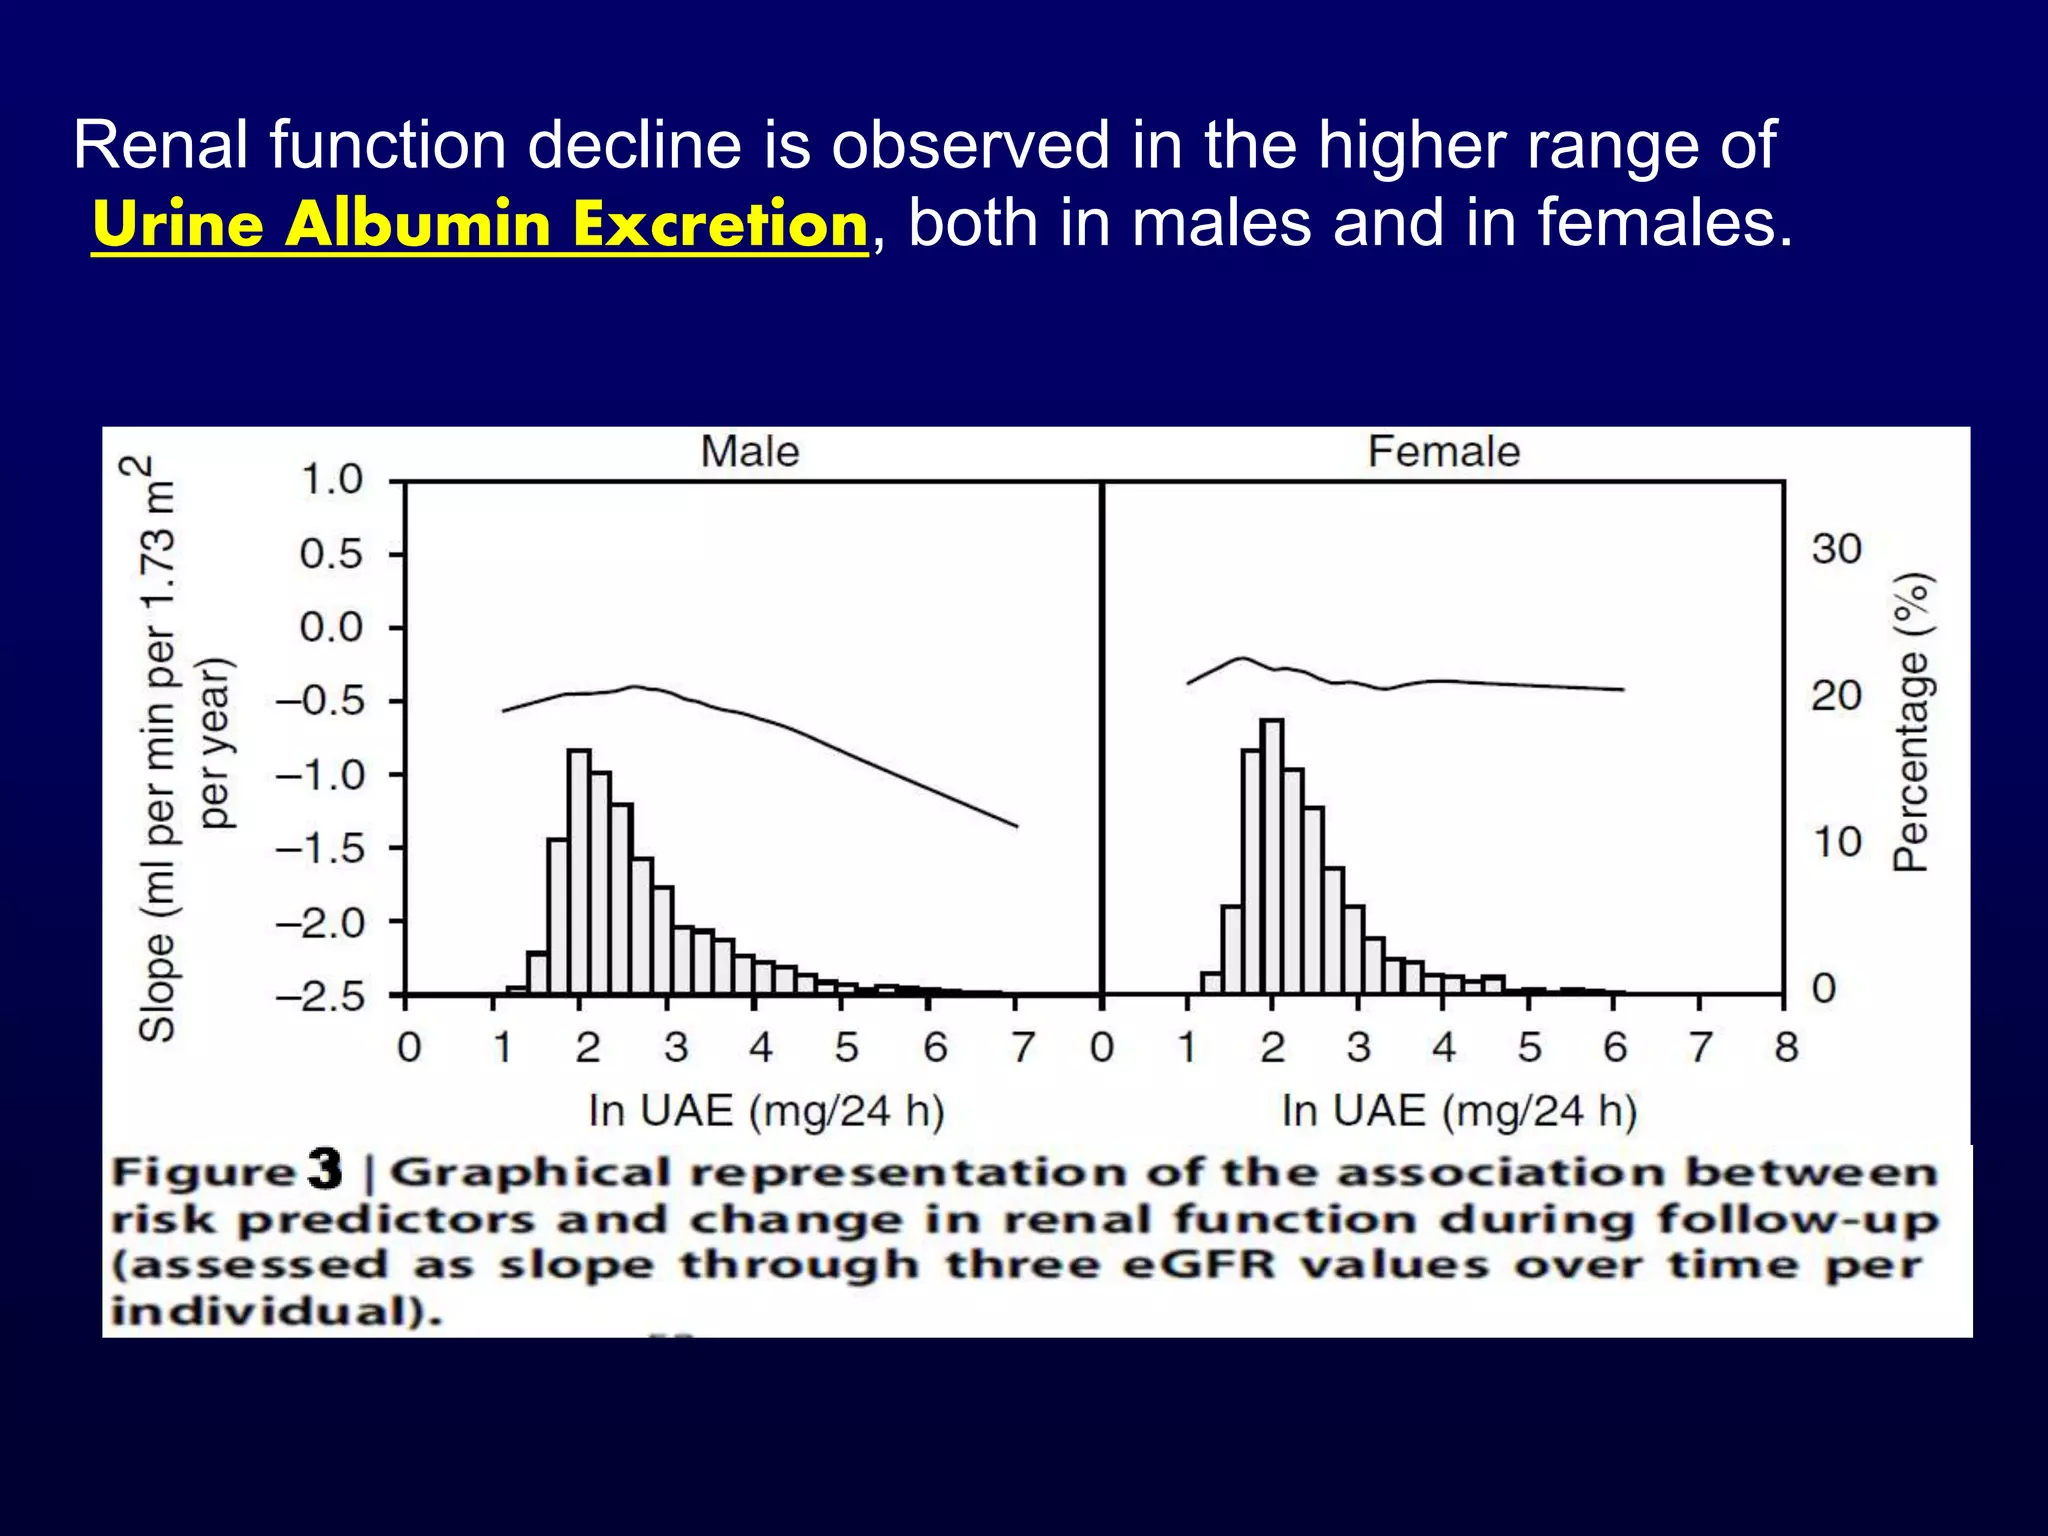
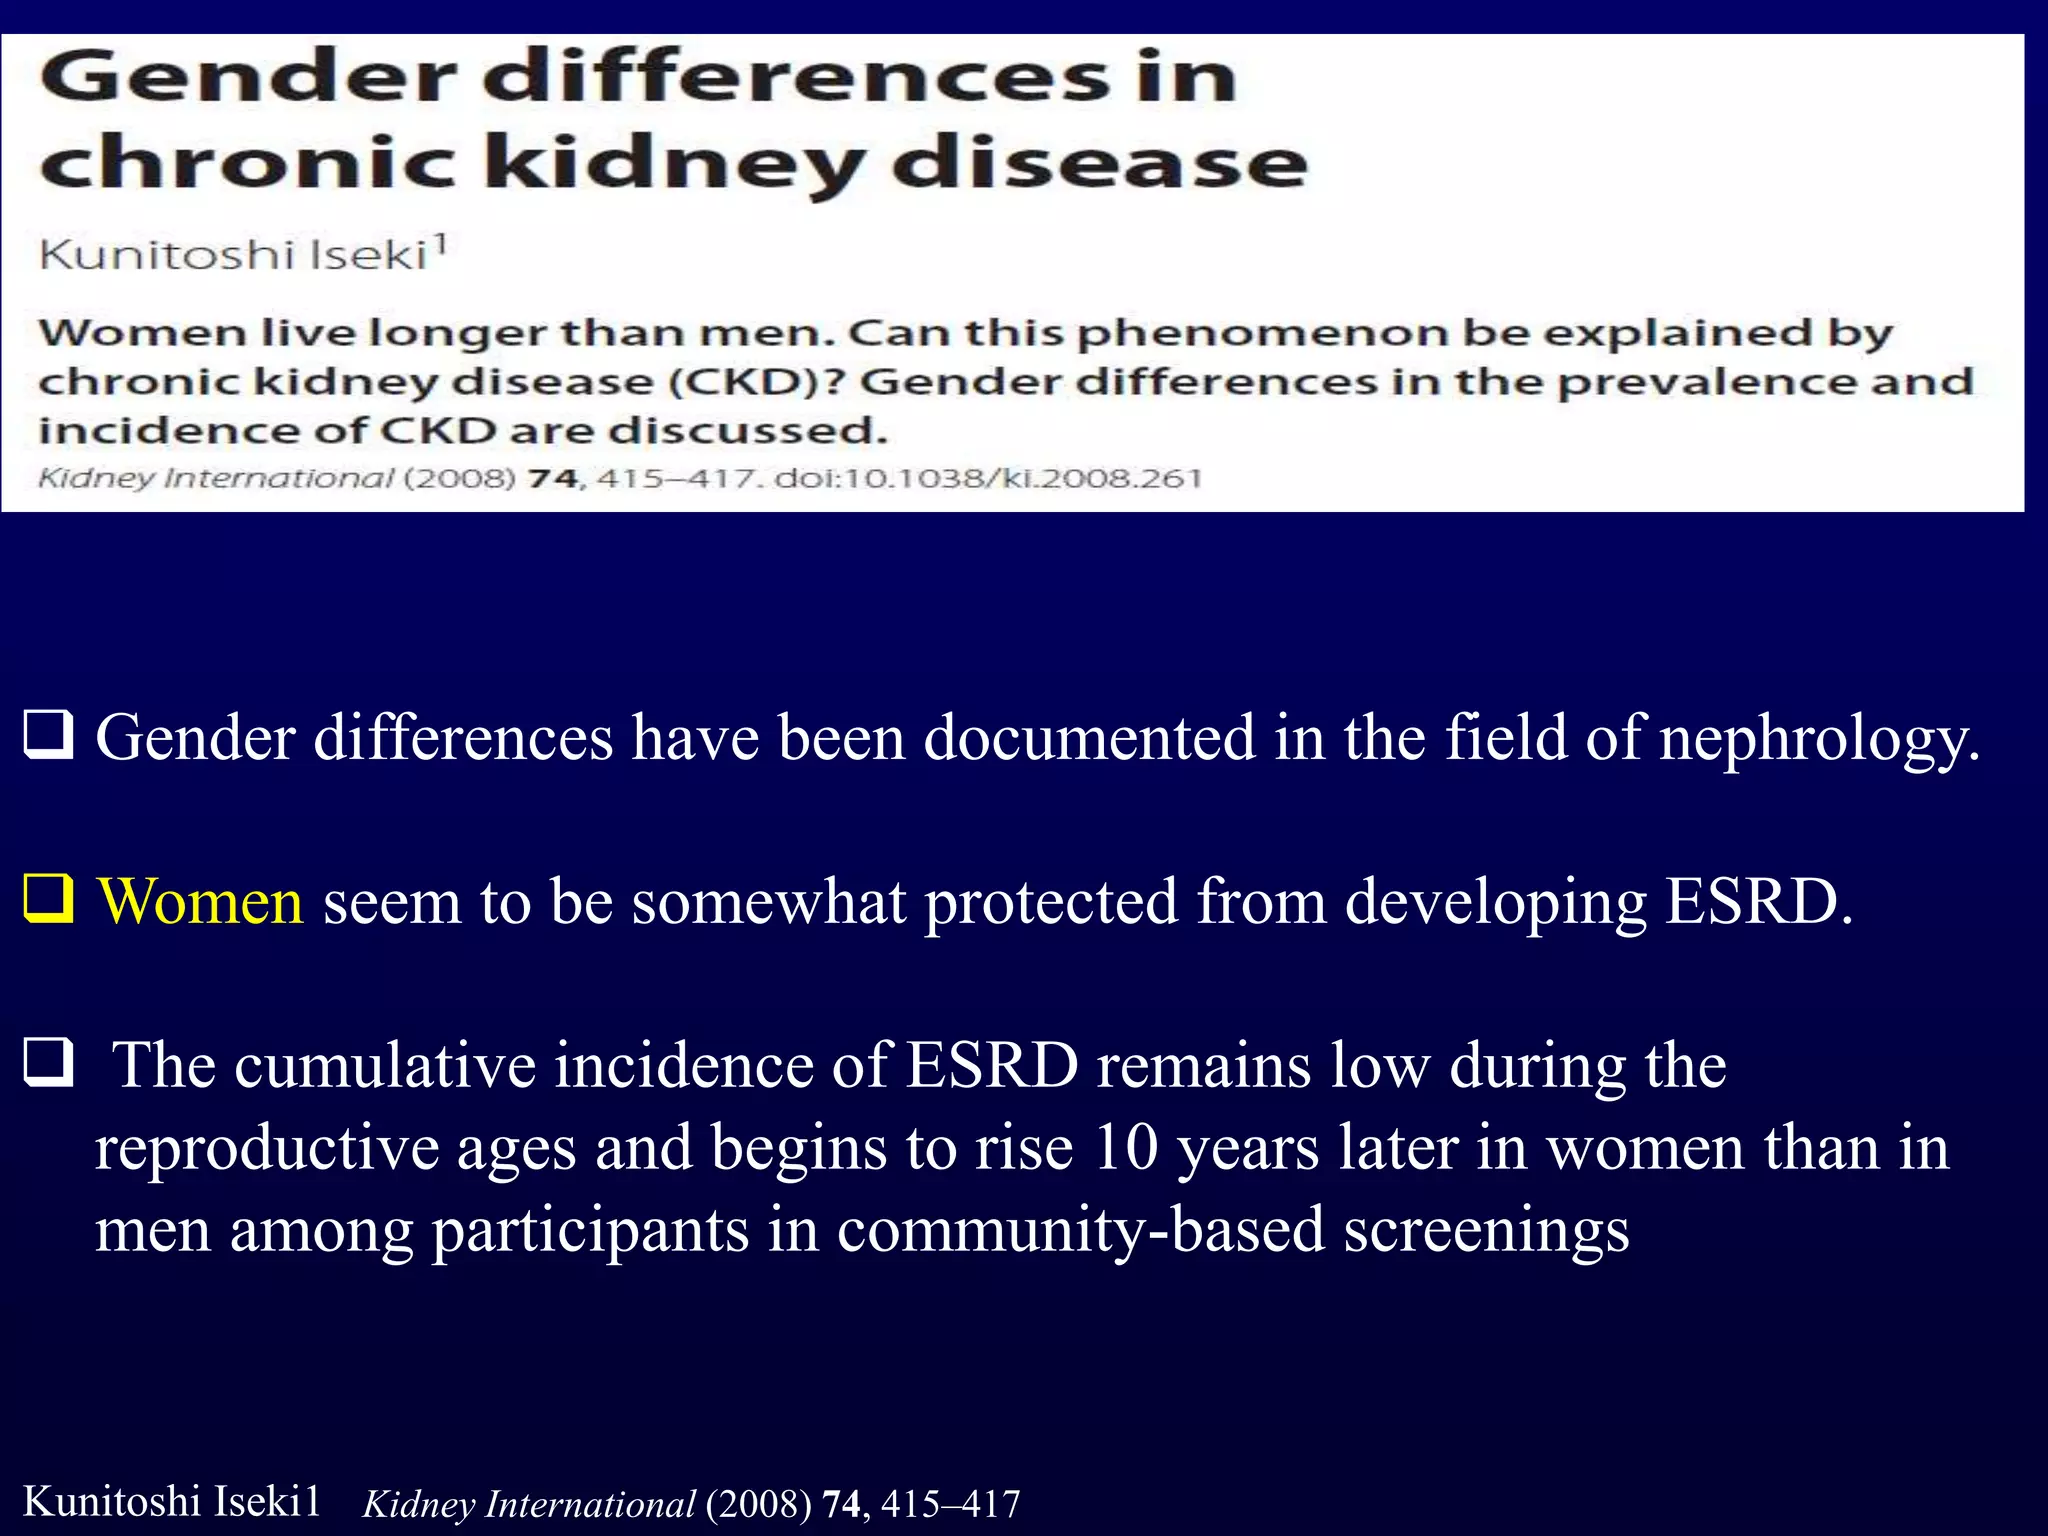
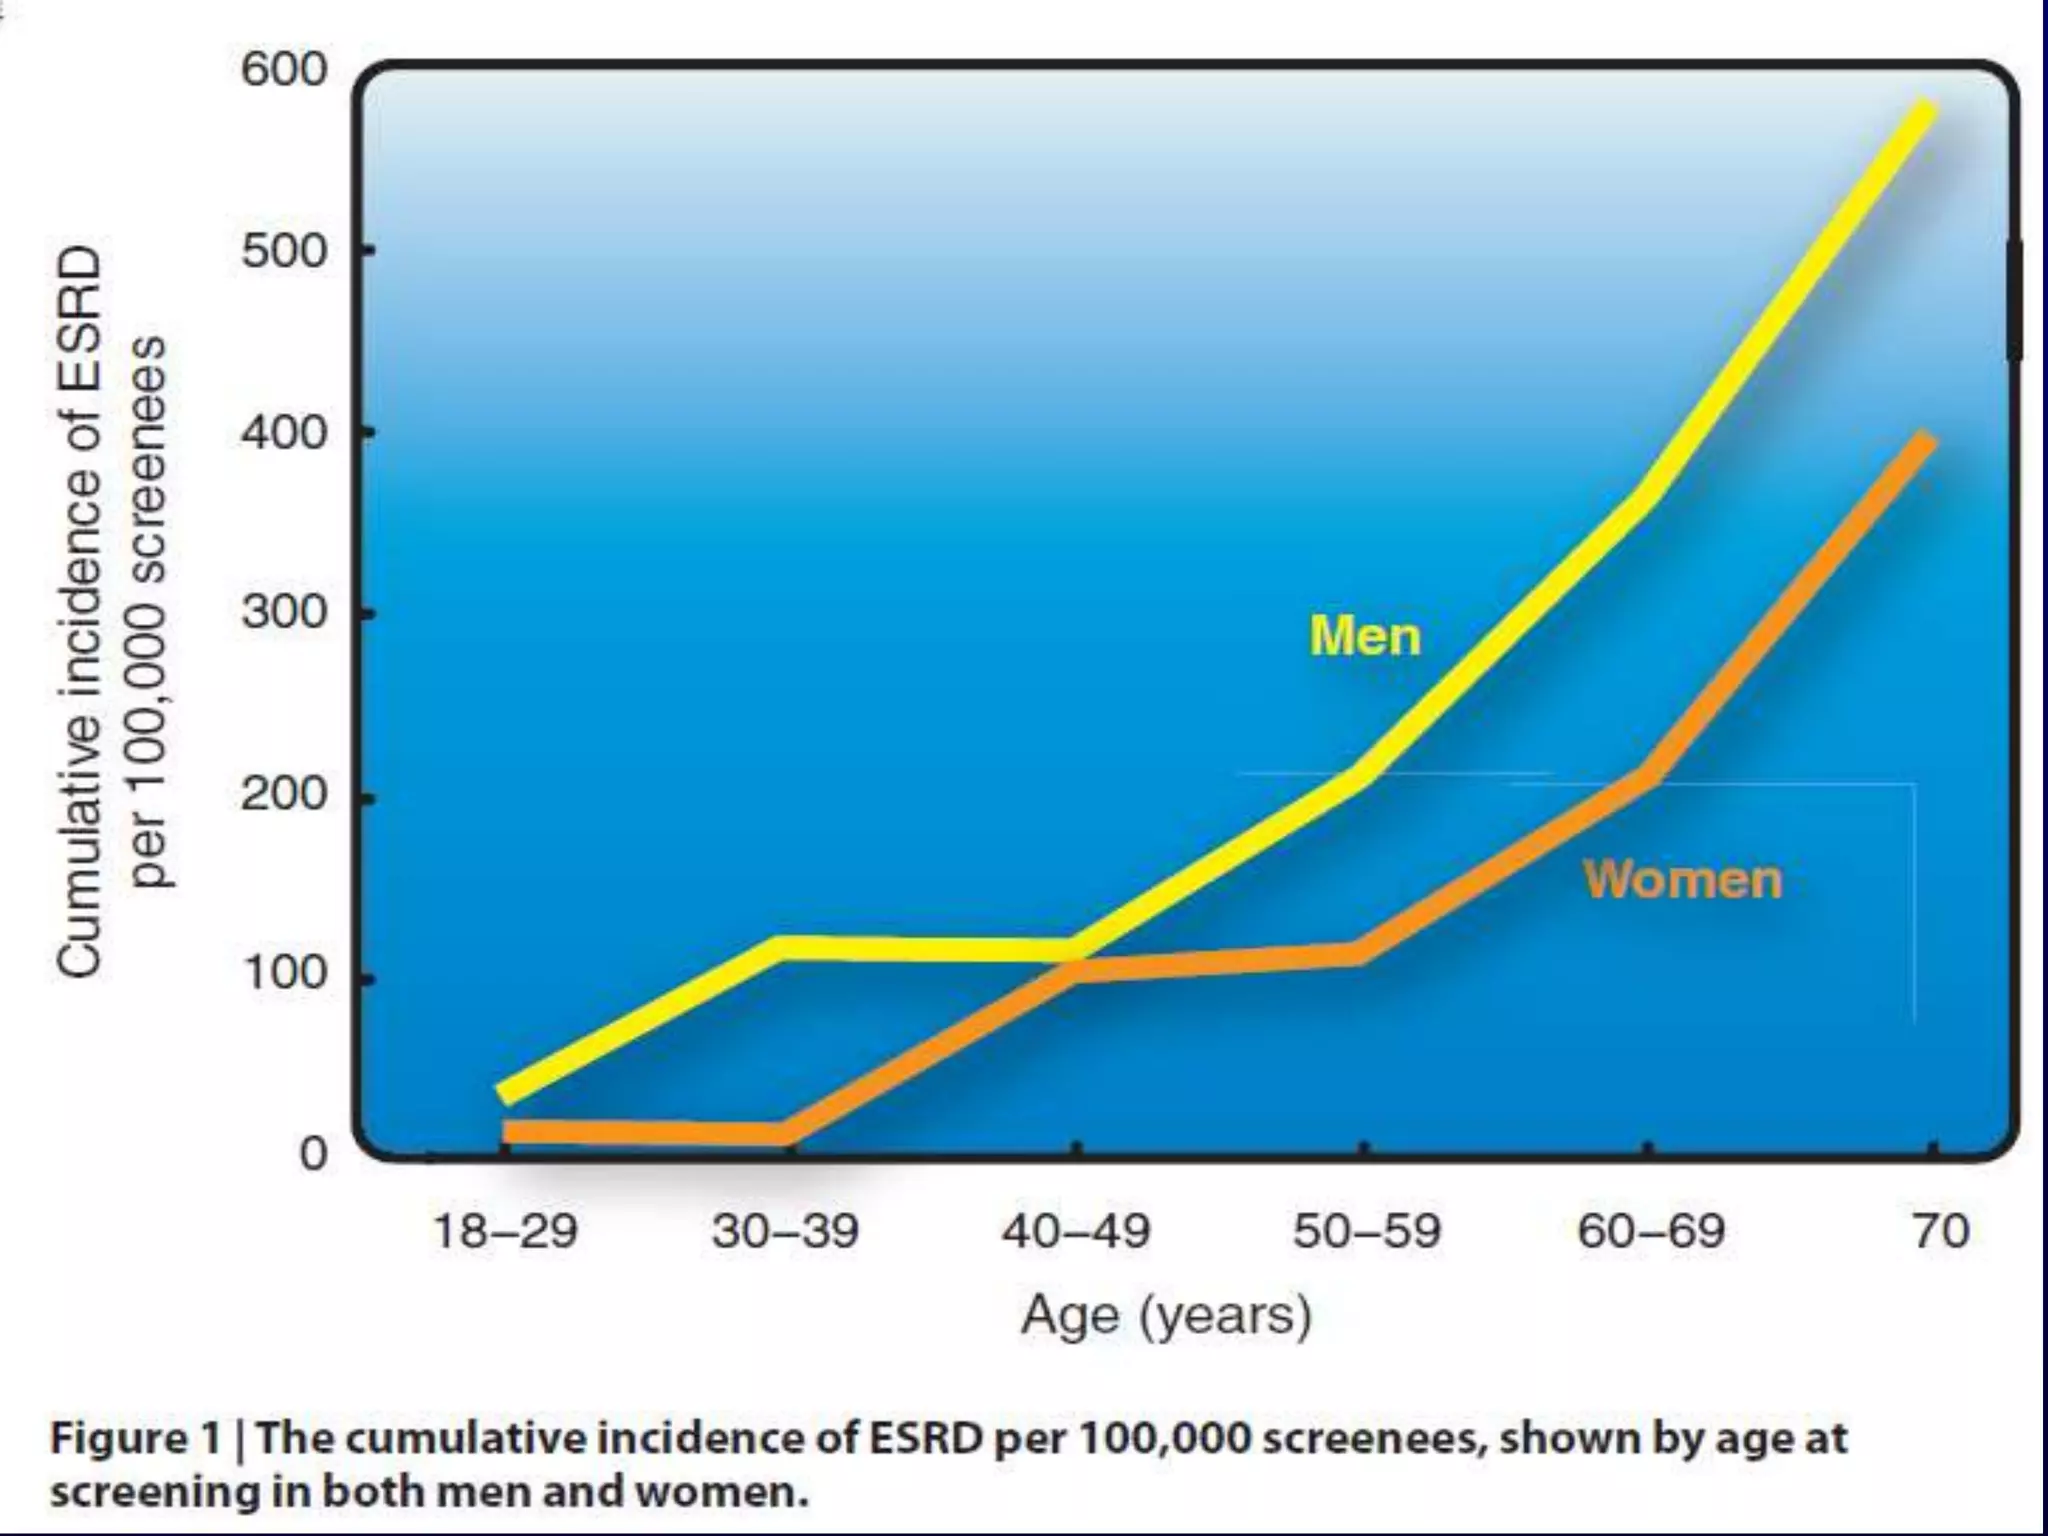
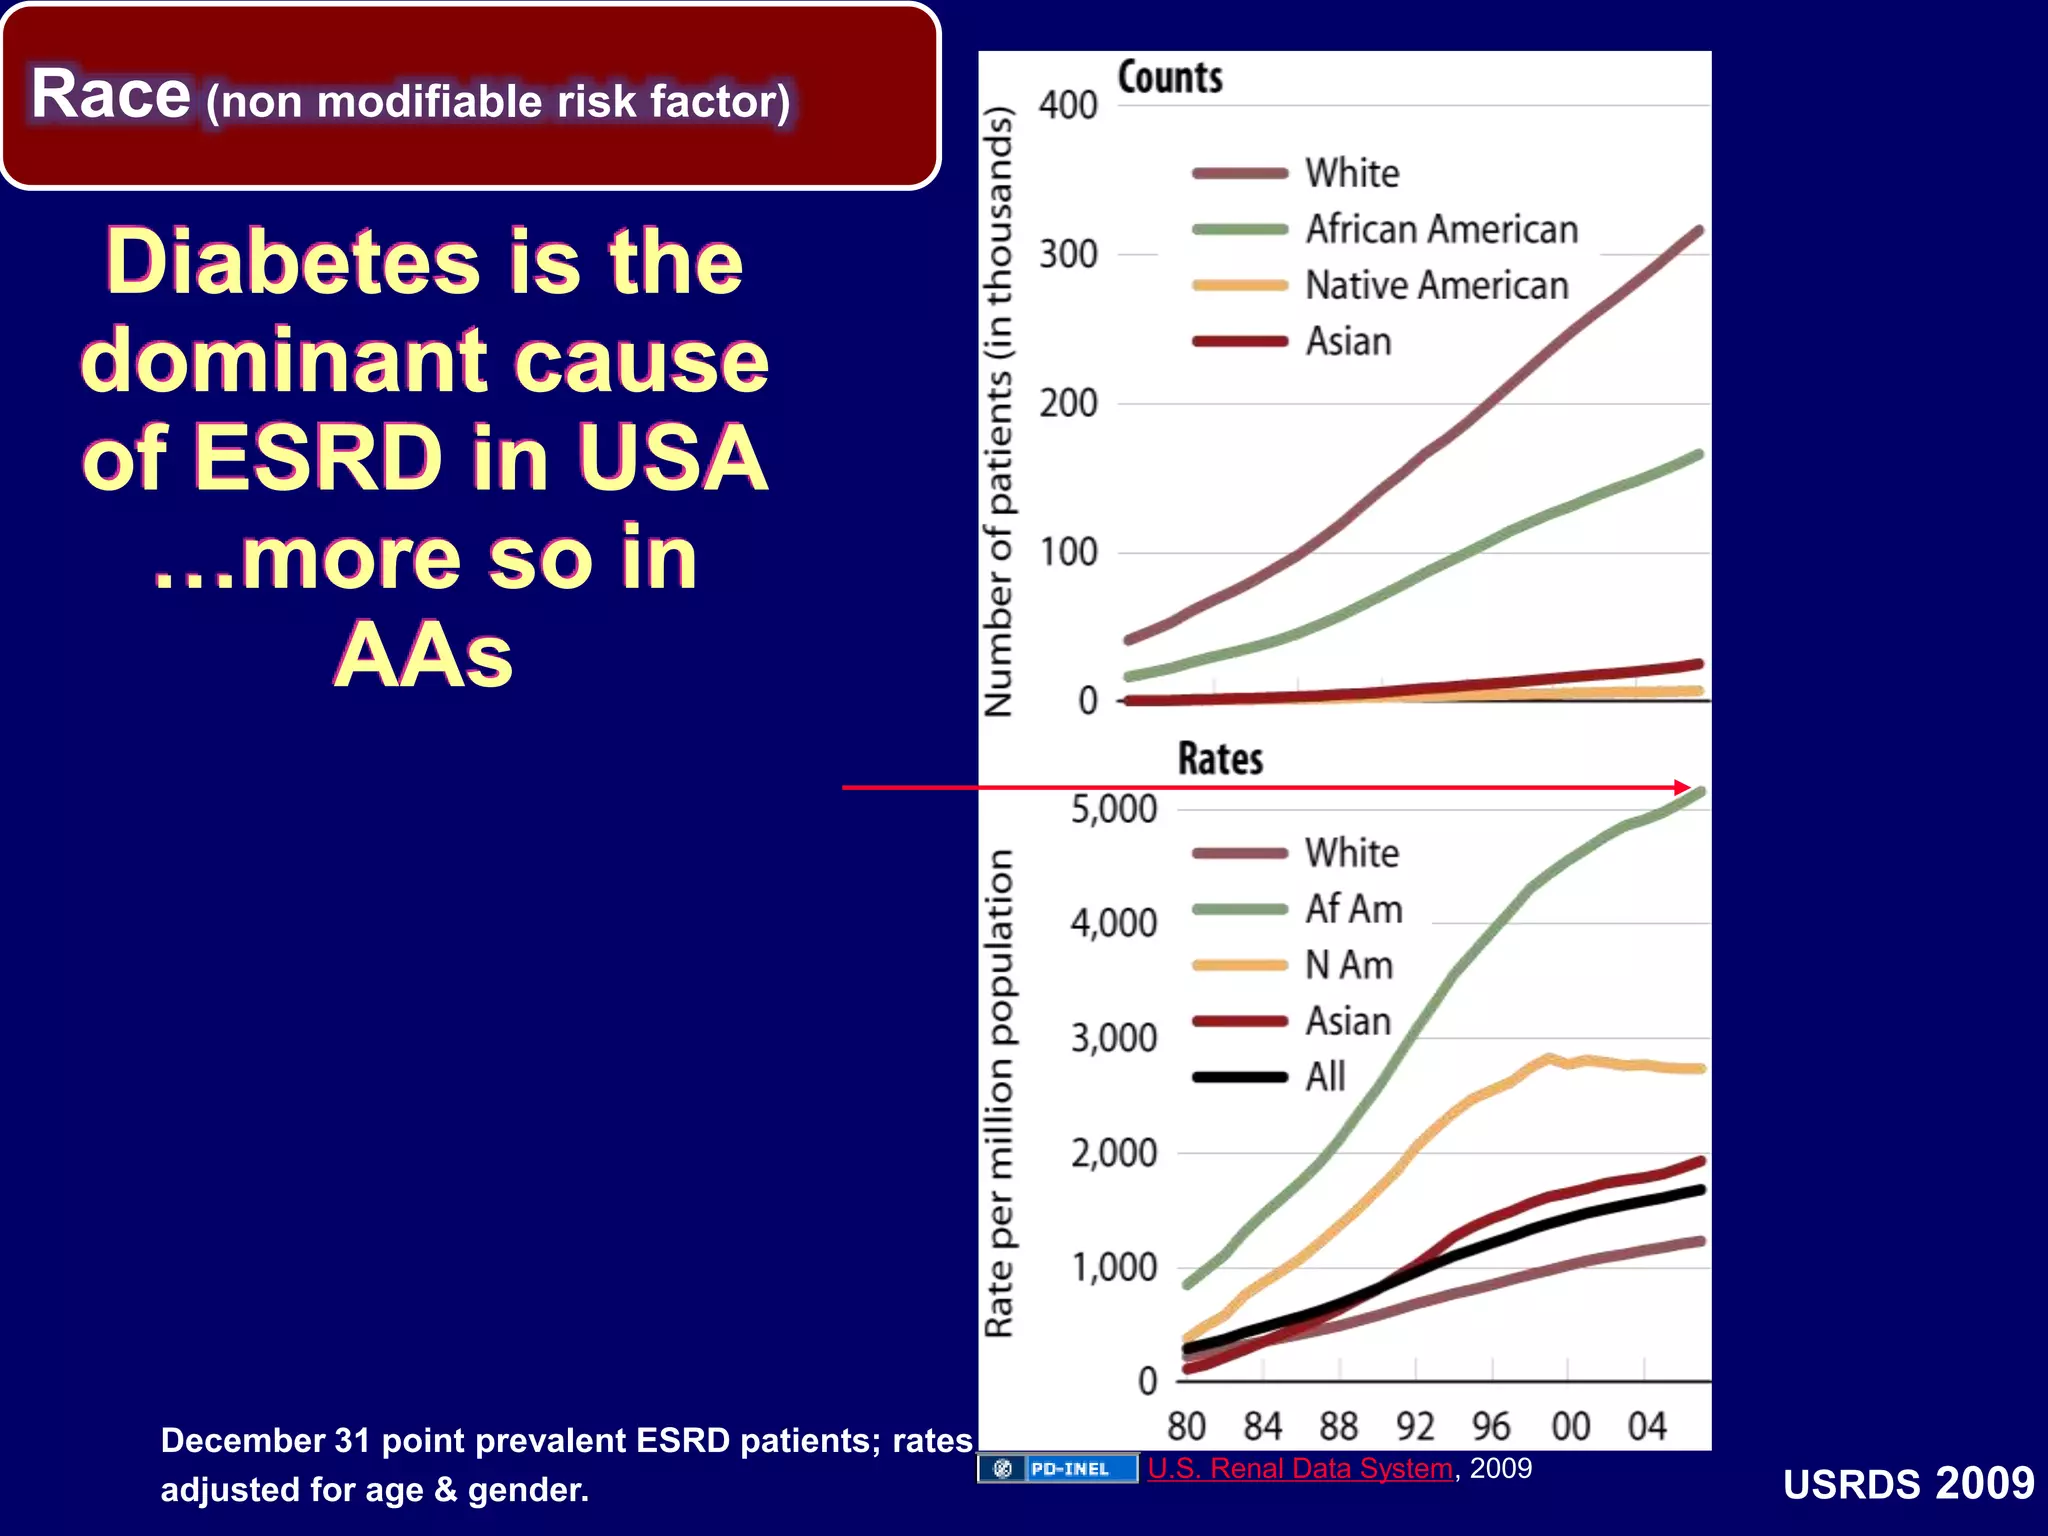
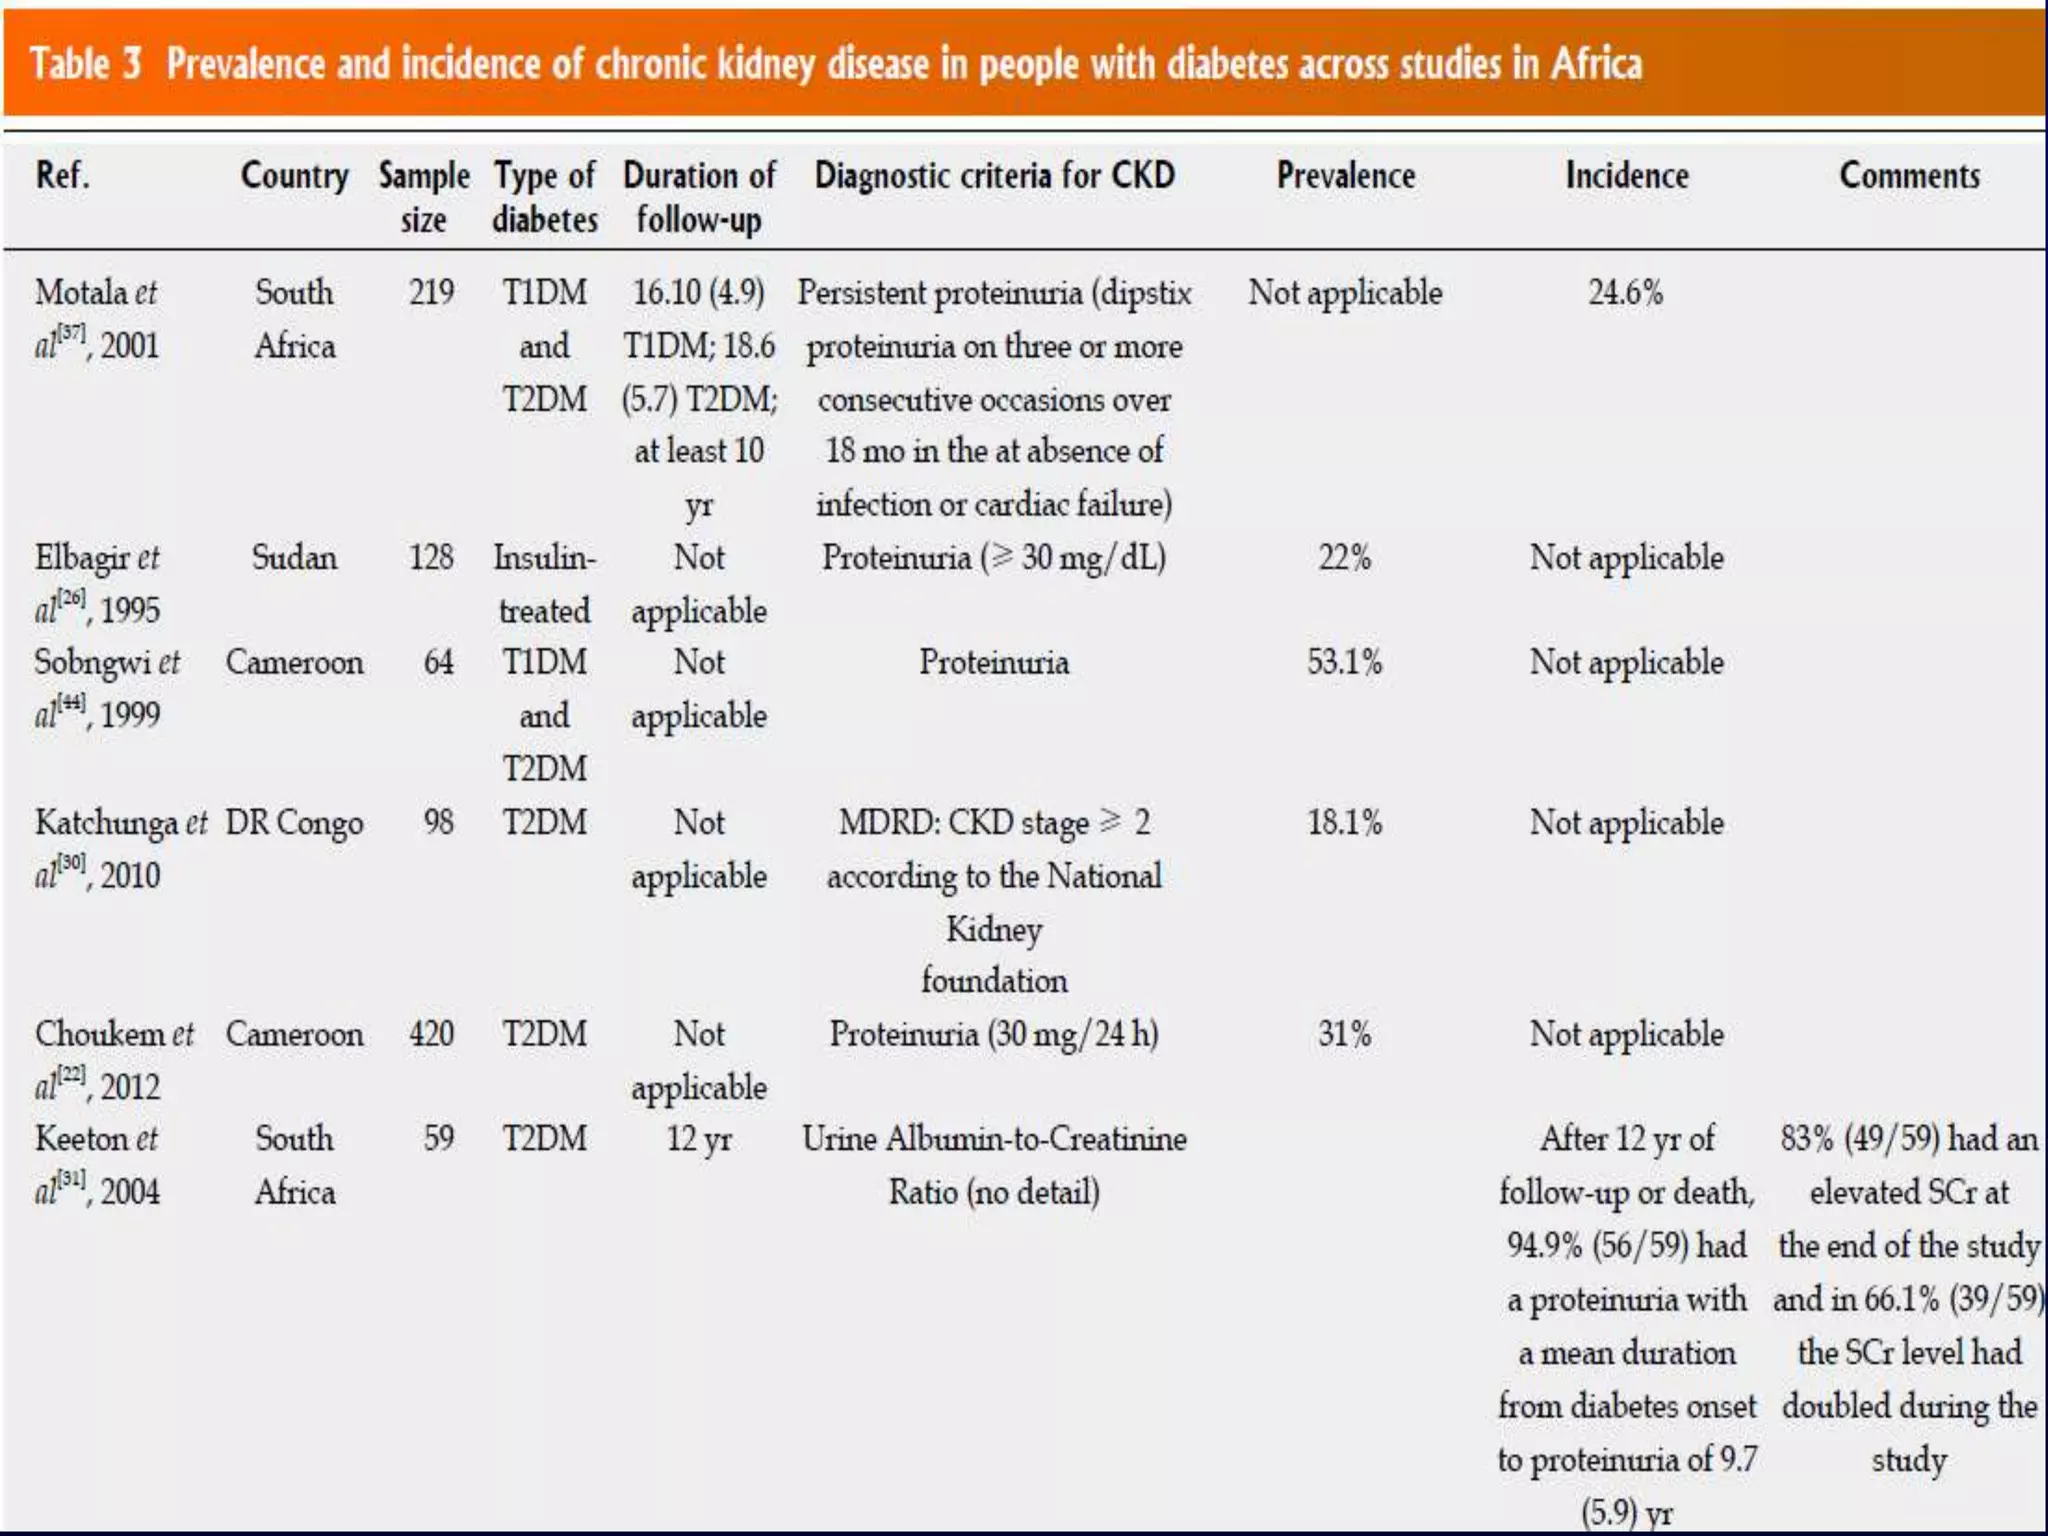
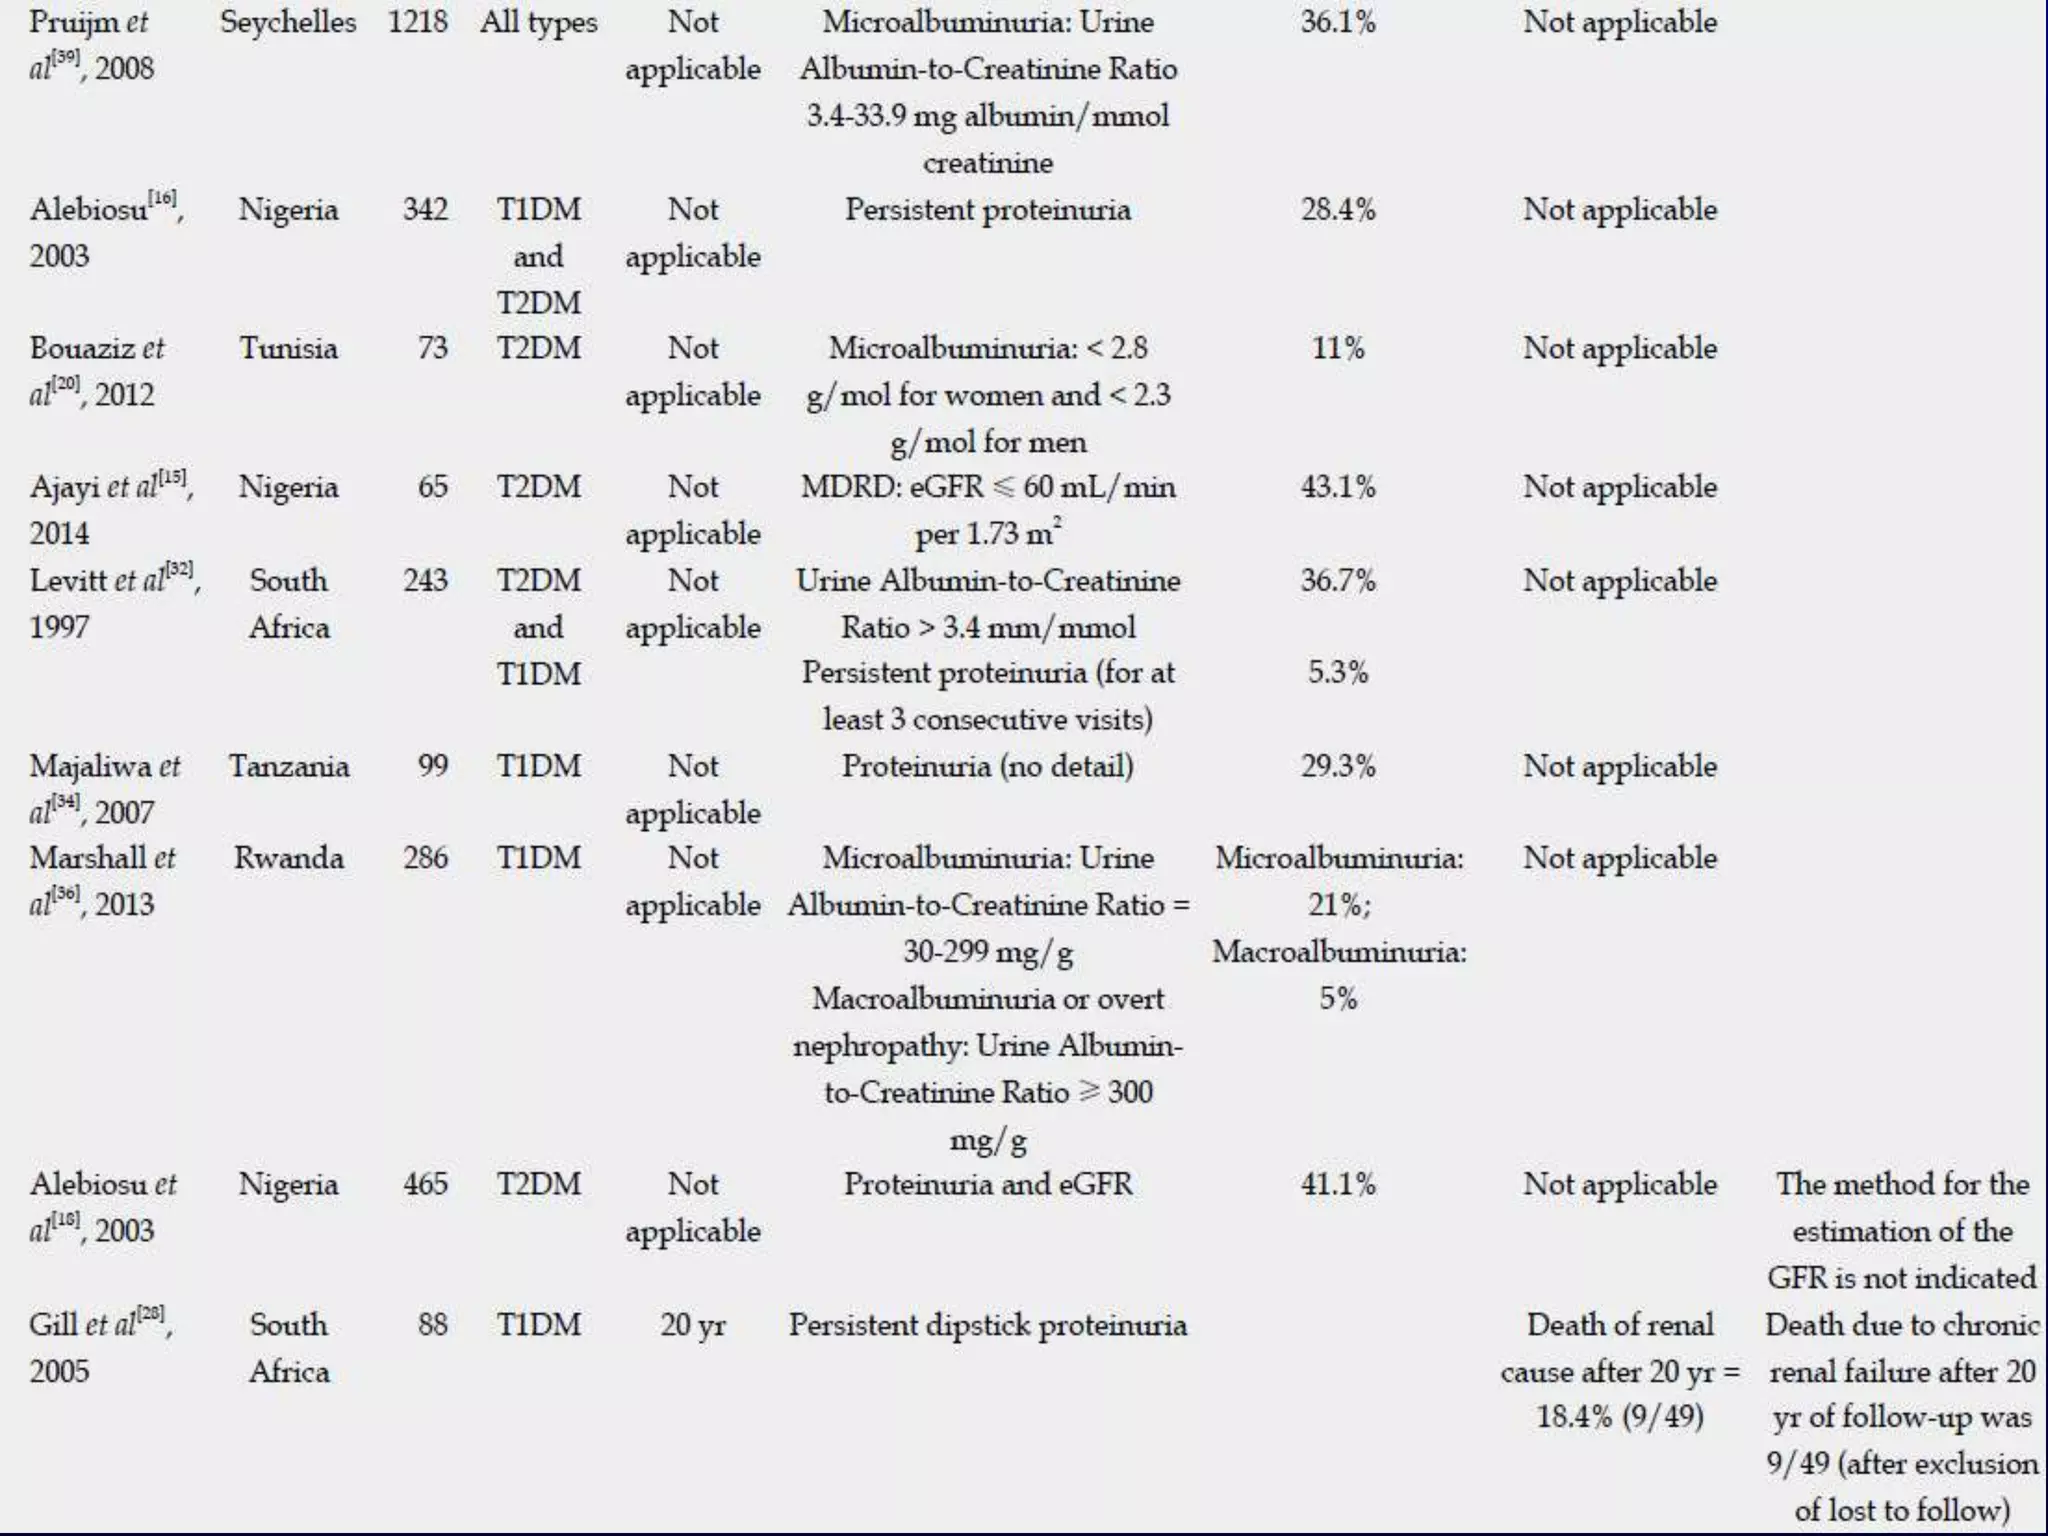
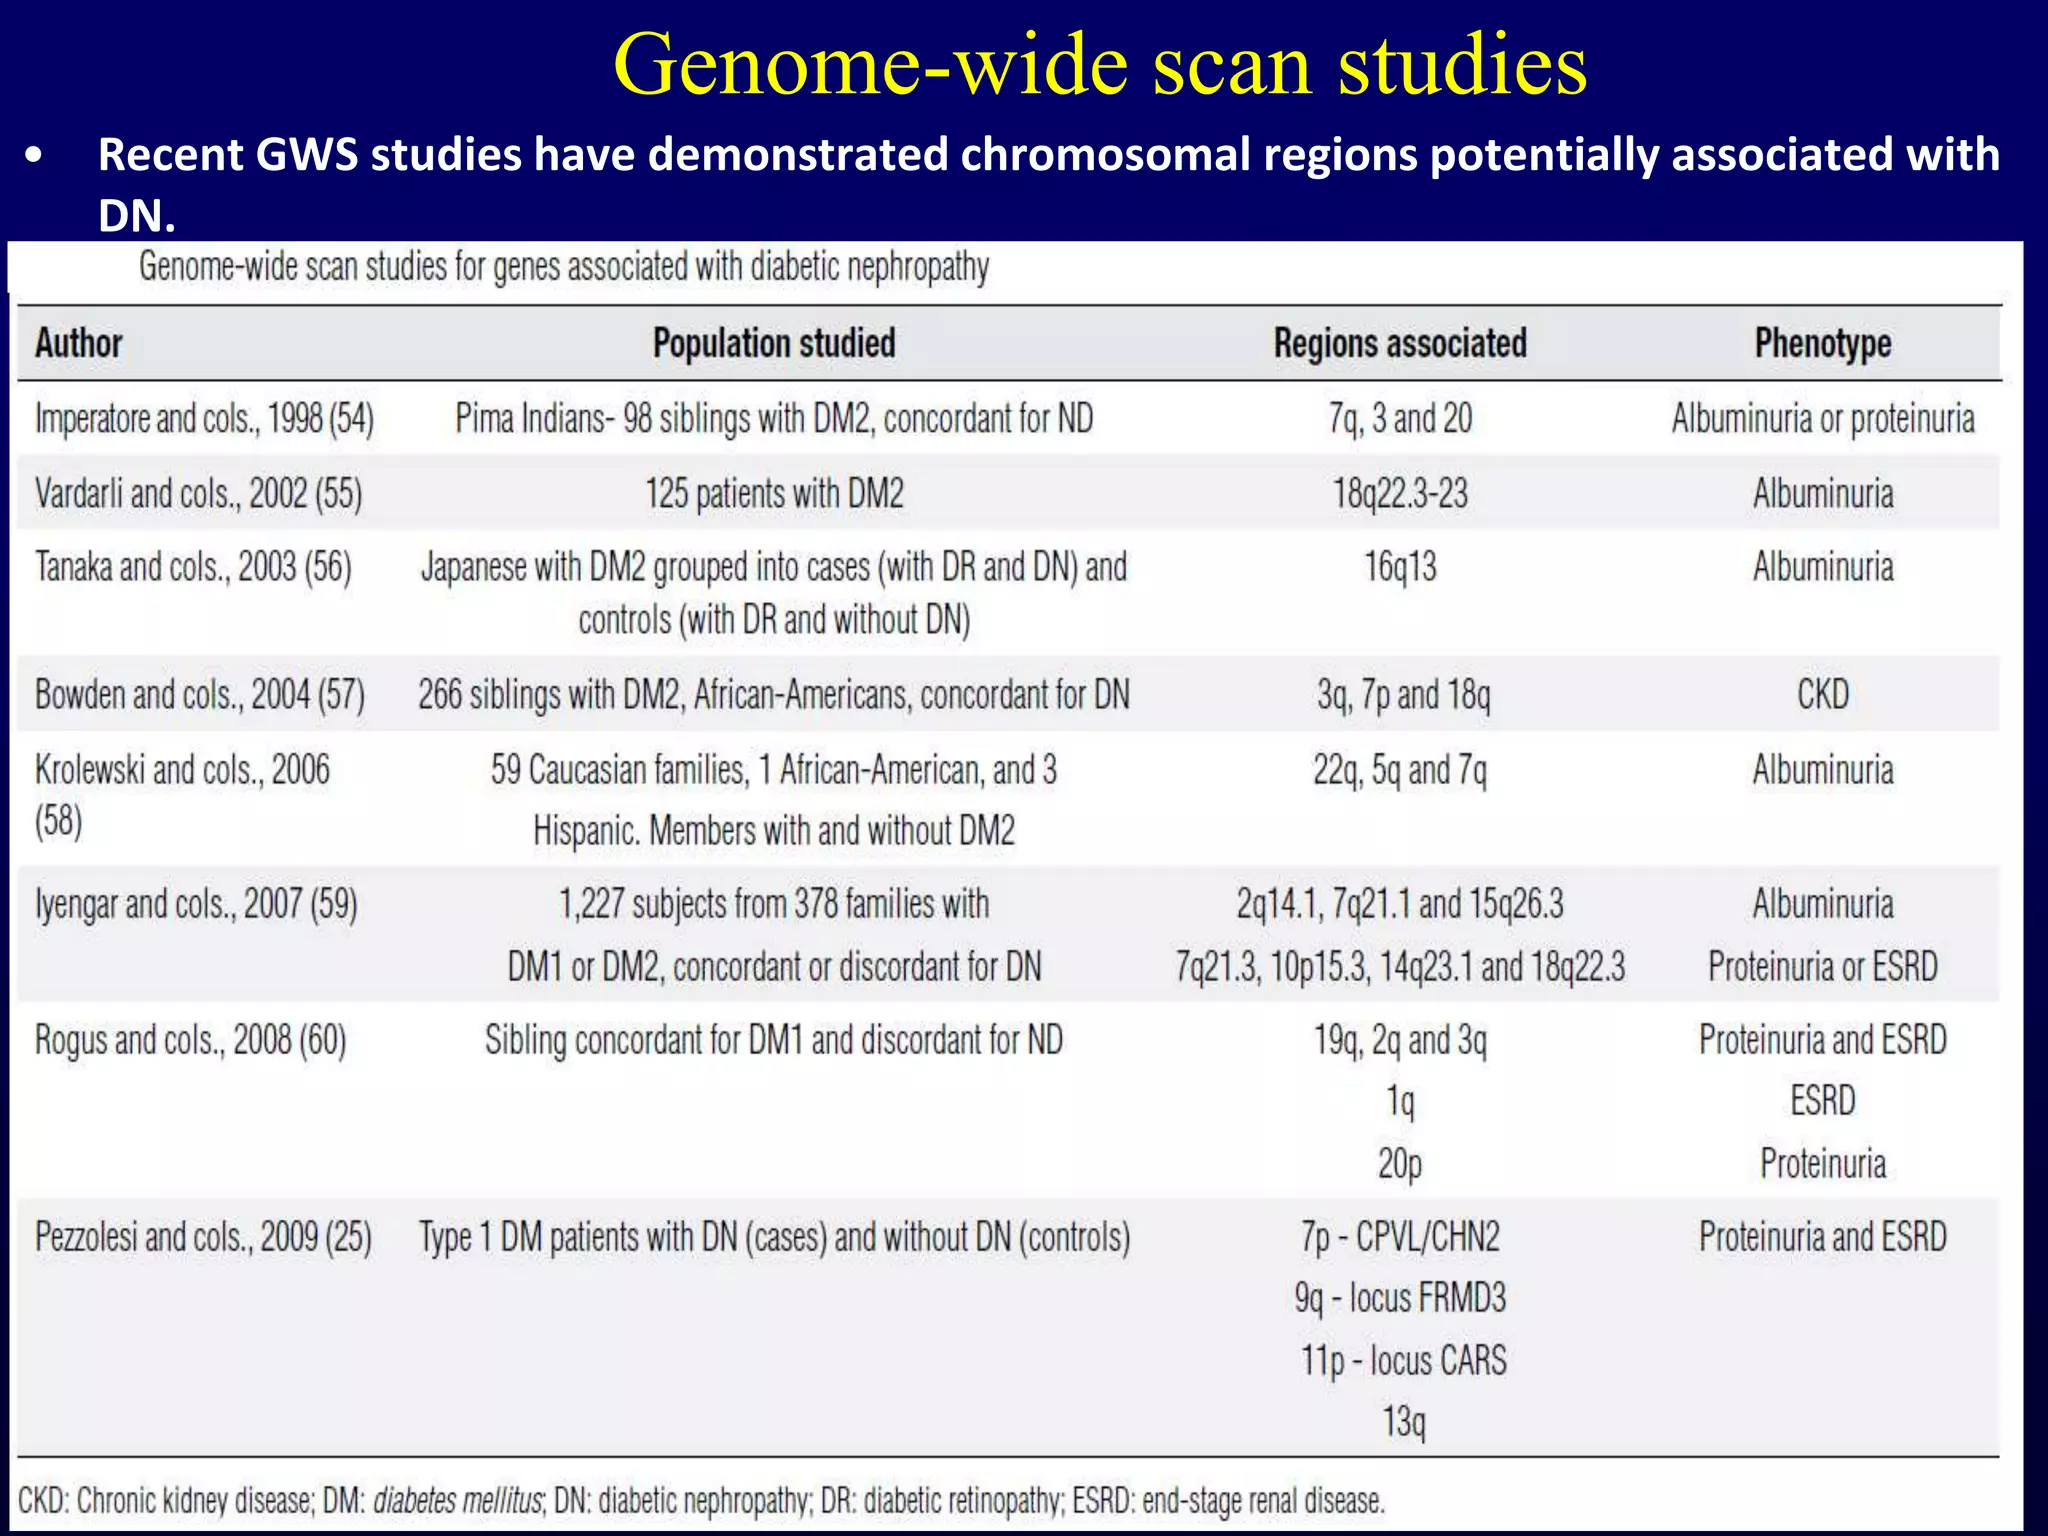
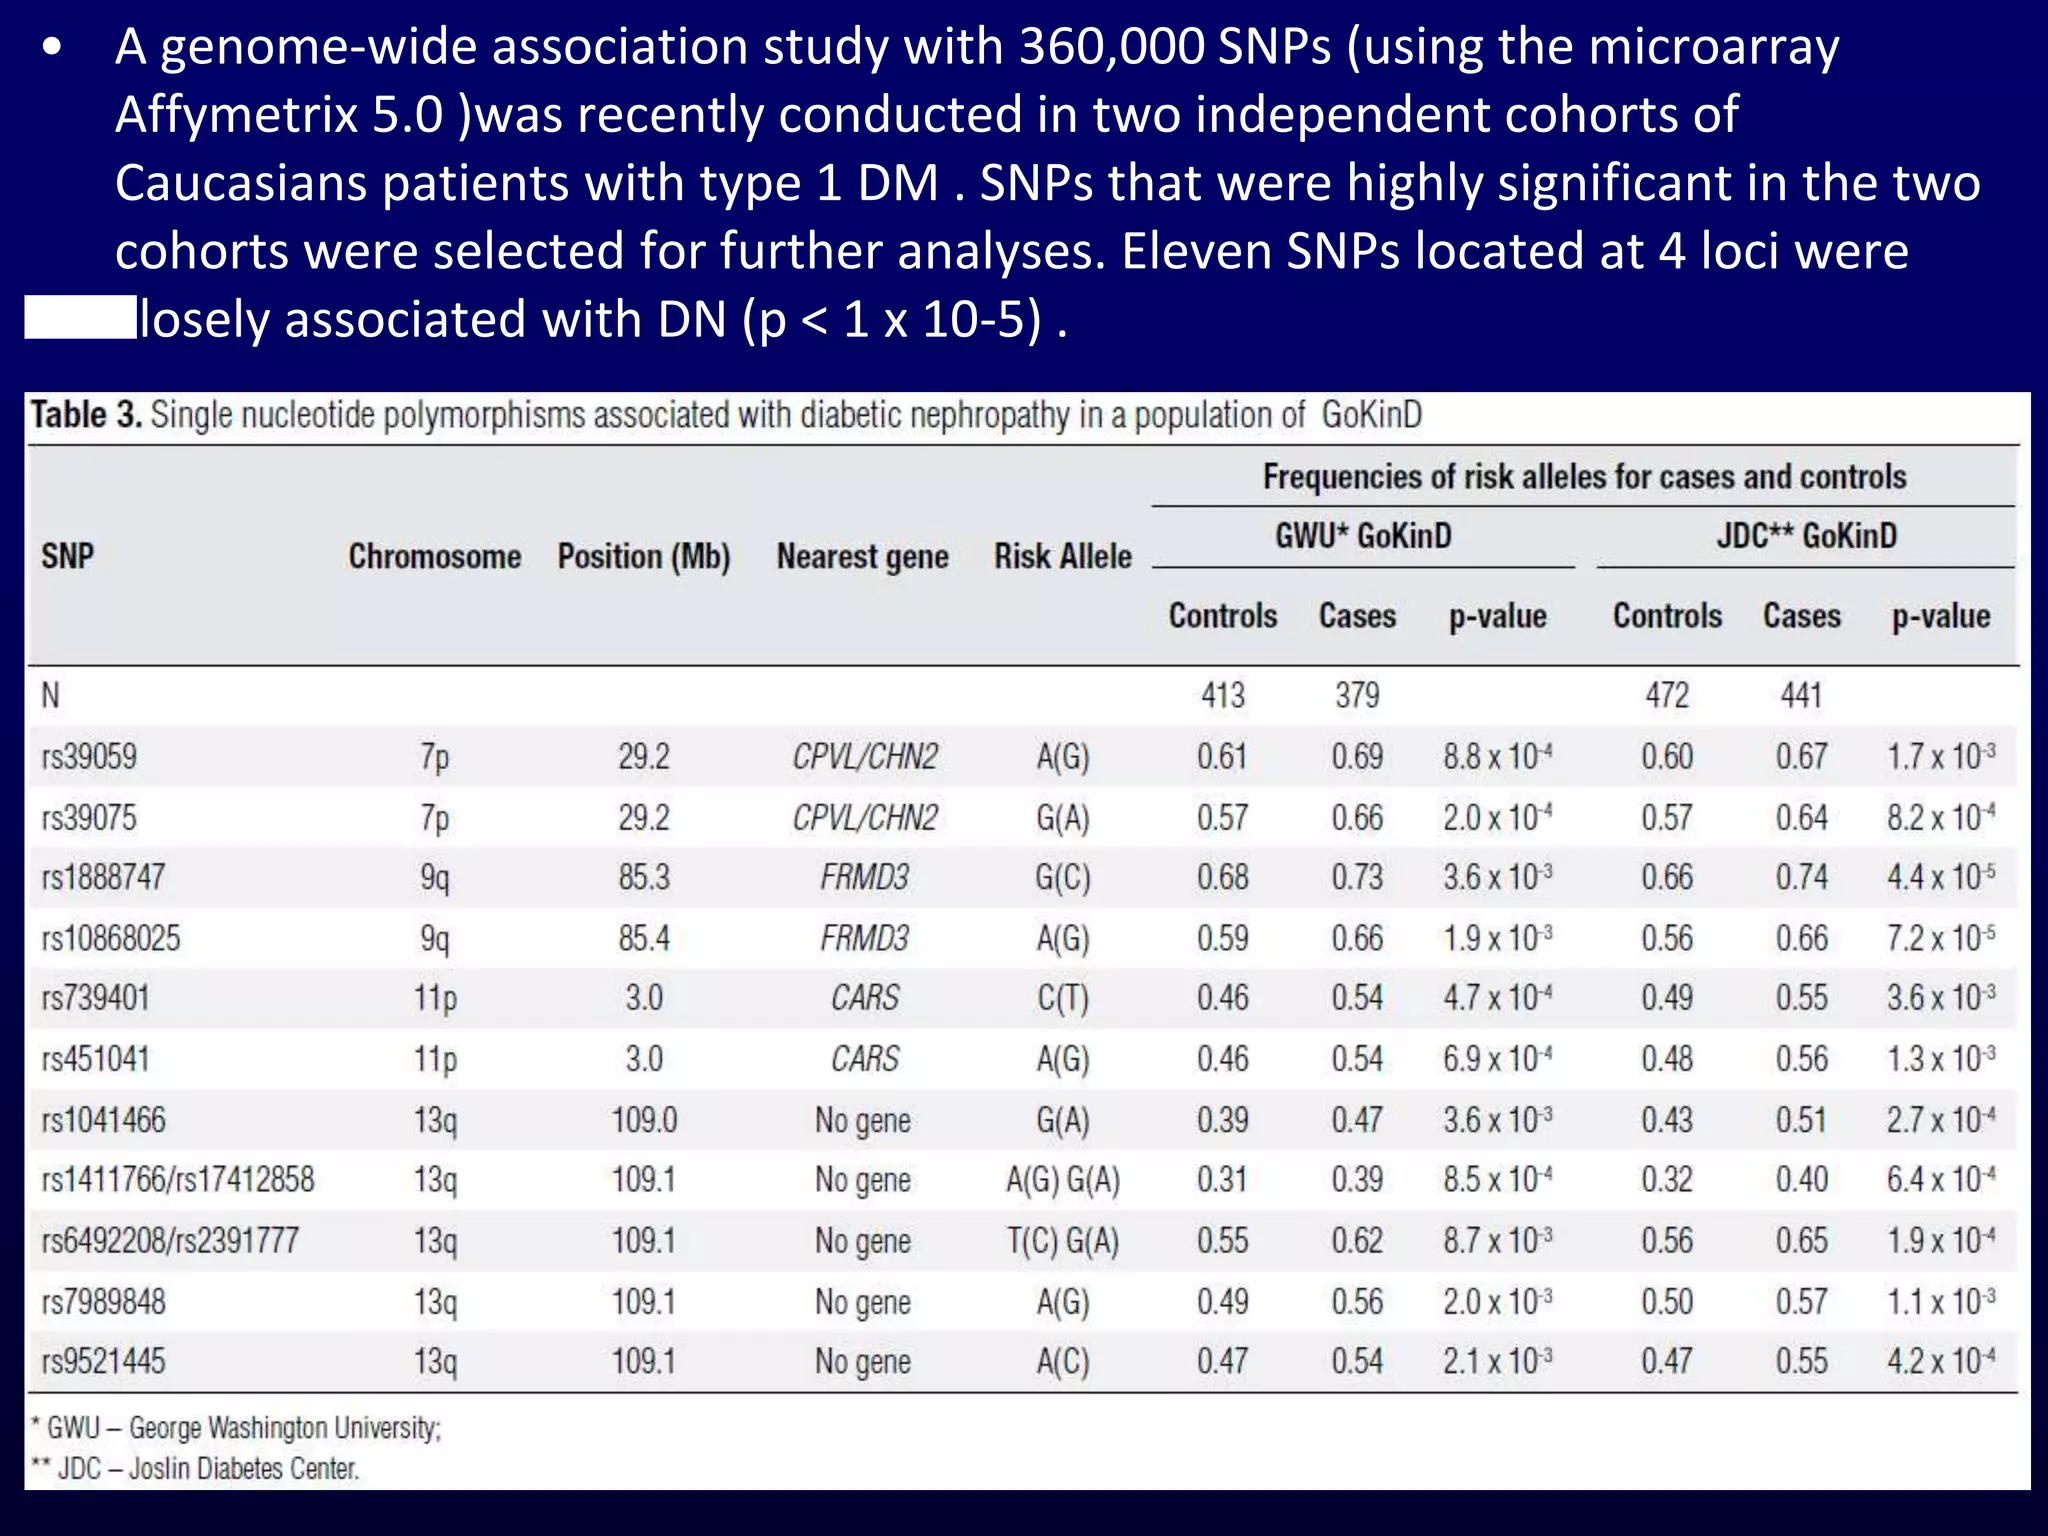
Diabetic Nephropathy
Why & why not ?
Alaa Wafa . MD
Associate Professor of Internal Medicine
Diabetes , Endocrine &Metabolic Disease Unit.
Mansoura University
Are Some Diabetics
Immune Against Diabetic
Nephropathy ??
Definition
• A microvascular complication of diabetes
marked by albuminuria and a deteriorating
course from normal renal function to ESRD.
Albuminuria 30 - 300 mg/day got called
“Microalbuminuria”
• it predicts the development of clinical nephropathy
• one “positive” is not enough in the low range
• detected by measuring the albumin/creatinine ratio on a spot urine
sample
Epidemiology
• Diabetic nephropathy is the leading cause of ESRD in the US.
• It accounts for 43% of all patients on dialysis
• Cost to Medicare > $ 2 billion per year
• About 20-30% of patients with type I DM develop
microalbuminuria, less than half progress to overt nephropathy
• Incidence of ESRD is 16% at 30 years.
• 5-60% of type II DM patients develop DN, depending on
ethnicity
• 63% of patients with diabetic nephropathy have type II DM
• The risk of developing diabetic nephropathy is not constant
over the duration of diabetes
Diabetes is the dominant
cause of ESRD in USA
Incident ESRD patients; Medical Evidence form data; rates
adjusted for age, gender, & race.
USRDS 2009
U.S. Renal Data System, 2009
Burden of diabetic nephropathy
• The rates of hospitalization for all causes are about three
times higher in patients with CKD than in those who do not
have the disease.
• patients with T2DM with DN and PAD are 1.2 to 1.3 times
more likely to be hospitalized.
• ESRD is associated with increased mortality, mainly due to
C.V. causes
• Reduced renal function is by itself an indicator of high
mortality.
• Other concomitant risk factors such as hypertension and
autonomic neuropathy can contribute to cardiovascular
diseases
• Even patients with DN initially characterized by
microalbuminuria already have an increased risk for CVD
and higher mortality
Natural History of DKD
Comprehensive textbook of Nephrology, 2010
Pathology
• Expansion of mesangial matrix with diffuse
and nodular glomerulosclerosis
(Kimmelstiel-Wilson nodules)
• Thickening of glomerular and tubular BM
• Arteriosclerosis and hyalinosis of afferent
and efferent arterioles
• Tubulointerstitial fibrosis
Nephron in DKD
Comprehensive textbook of Nephrology, 2010
Angiotensin 2
P Cap
ACE Inhibitors
Pathogenesis
• Hyperglycemia
– Induce mesangial expansion and injury
– Increased activity of growth factors
– Activation of cytokines
– Formation of ROS
– accumulation of advanced glycosylation endproducts in
tissues
• Accumulation of ECM components, such as
collagen
Hyperglycaemia drives diabetic kidney disease
1. Activation of protein kinase C1
2. Acceleration of the renin-
angiotensin-aldosterone
system (RAAS)1
3. Non-enzymatic glycation
that generates advanced
glycation end products1
– Circulating levels are
raised in people with
diabetes, particularly those
with renal insufficiency, since
they are normally excreted in
the urine1
• Oxidative stress seems to
be a theme common to all
three pathways3
14
Hypertension
Overproduction of
mesangial cell matrix
Tubulointerstitial
injury
Acceleration
of RAAS
Advanced glycation
end products (AGEs)
Protein kinase C and
growth factors
Glomerular
damage
ProteinuriaNephron loss
Hyperglycaemia
Reference:
1.Cade WT. Diabetes-Related Microvascular and macrovascular diseases in the physical therapy setting. Phys Ther. 2008;88(11):1322–1335. 2.Wolf G et al. (2005) From the
periphery of the glomerular capillary wall toward the center of disease: podocyte injury comes of age in diabetic nephropathy. Diabetes 54: 1626-1634. 3.Dronavalli S, Duka I
and Bakris GL. Nat Clin Pract Endocrinol Metab. 2008;4(8):444-52.
Three mechanisms have been postulated that explain how hyperglycaemia
causes tissue damage in the kidney:1-3
Urinary biomarkers of
glomerular damage
**Increased permeability to plasma proteins
(transferrin,albumin)
- Decreased glomerular charge selectivity
- Decreased glomerular size selectivity
- Increased intraglomerular pressure
** Increased excretion of extracellular matrix
proteins( Type 4 collagen, fibronectin)
Urinary biomarkers of tubular damage
• Inability of tubules to absorb filtered proteins:
*Proximal tubular:
-L-FAB
-Adiponectin (also glomerular markers)
-KIM-1
*Loop of Henle:
-Osteopontin
*Distal tubular:
-H-FABP
Pathogenesis
• Genetic predisposition to or protection from
diabetic nephropathy
– Differences in prevalence of microalbuminuria, ESRD
in different patient populations
– Only half of patients with poor glycemic control will
develop diabetic nephropathy
– Family studies
• Multiple genes may be involved
Why Incidence differ from
patient to another ?
• About 20% to 30% of patients with type 1 and type 2 DM
develop DN; however, a smaller proportion of patients
with type 2 DM will progress to end-stage renal disease
(ESRD).
• Due to its high prevalence, the majority of patients
requiring dialysis are type 2 DM .
• but not all diabetic individuals will develop this
complication ,Those who do not develop DN in the first
15 years after disease onset seem to be genetically
protected.
Cont.
• Many environmental factors have been established as
contributing to the development of DN while the role of
others has yet to be clearly understood .
• It is known that factors such as hyperglycemia,
arterial hypertension and/or dyslipidemia play a
role in the development of DN in genetically
predisposed individuals only.
Different Risk factors also affect
incidence rate
– Hypertension
– Hyperglycemia
– Microalbuminuria
– Ethnicity
– Male gender
– Family history
– Cigarette smoking
– Dyslipidemia
• The interest in identification of modifiable risk factors of
declining renal function is increasing.
• Such risk factors may be used to estimate a subject’s
risk of future declining renal function and may also
form the basis for preventive intervention
Different Risk factors also affect
incidence rate
– Hypertension
– Hyperglycemia
– Microalbuminuria
–Ethnicity
–Male gender
– Family history
– Cigarette smoking
– Dyslipidemia
5488 participants of the prospective, community-based cohort
study PREVEND who completed three visits during a mean
follow-up of 6.5 years.
The change in renal function was used as the outcome and this
was calculated as the linear regression of three estimated GFR
measurements obtained during follow-up.
Risk factors, known to influence renal outcome in patients with
primary renal diseases, were used as potential predictors in
multivariate regression analyses.
Renal function decline is observed in the higher range of
Blood glucose both in males and in females.
Renal function decline is observed in the higher range of
Systolic Blood Pressure both in males and in females.
Renal function decline is observed in the higher range of
Urine Albumin Excretion, both in males and in females.
Conclusion of Gender difference
High systolic blood pressure and plasma glucose were
found to be independent predictors for an accelerated
decline in function for both genders.
In males, albuminuria was the strongest independent
predictor for renal function decline, whereas in females
albuminuria was univariately associated only after
adjustment for age.
The direction of the association between
cholesterol/HDL ratio and decline of renal function
differed by gender.
Surprisingly,in males, waist circumference was an
independent predictor and positively associated with
renal function outcome.
These studies show that there are gender differences in
the standard predictors of the decline in renal function
 Gender differences have been documented in the field of nephrology.
 Women seem to be somewhat protected from developing ESRD.
 The cumulative incidence of ESRD remains low during the
reproductive ages and begins to rise 10 years later in women than in
men among participants in community-based screenings
Kunitoshi Iseki1 Kidney International (2008) 74, 415–417
December 31 point prevalent ESRD patients; rates
adjusted for age & gender. USRDS 2009
Diabetes is the
dominant cause
of ESRD in USA
…more so in
AAs
U.S. Renal Data System, 2009
Race (non modifiable risk factor)
• Methods:
Meta-Analysis and Systematic Reviews of Observational
Studies, between January 1994 and July 2014 ,of each of
the 54 African countries and African sub-regions to capture
the largest number of studies, reported on the prevalence,
incidence or determinants of chronic kidney disease (CKD)
in people with diabetes within African countries.
• Methods for assessing and classifying CKD varied widely.
Measurement of urine protein was the most common method of
assessing kidney damage (62.5% of studies).
Results:
 The overall prevalence of CKD varied from 11% to 83.7%.
 Incident event rates were
94.9% for proteinuria at 10 years of follow-up,
34.7% for endstage renal disease at 5 years of follow-up and
18.4% for mortality from nephropathy at 20 years of follow up.
 Duration of diabetes, blood pressure, advancing age, obesity
and glucose control were the common
determinants of kidney disease.
GENETIC TRANSMISSION MODELS
• The genetic transmission mode of DN is still controversial.
Theoretically, as in other diseases, it might occur in three
distinct forms, which would lead to the development of DN.
Monogenic form
mutations
in a gene
with a
dominant
role.
Oligogenic form
mutations/polymo
rphisms in a few
genes would
contribute in an
independent and
cumulative
manner to
increase
susceptibility.
Polygenic form
alterations in
many DNA
loci, and each
would have a
small and
cumulative
effect on DN
development.
Genetic differences in Nephropathy
EVIDENCE FOR GENETIC PREDISPOSITION TO
Diabetic Nephropathy
• Studies of familial aggregation have showed that some
families are predisposed to DN .
• Studies on siblings with type 1 or type 2 DM have reported
that DN in one of the siblings is associated with around a 3-
to 4-fold increase in the risk of DN in the other sibling .
• There appears to be a genetic inheritance contributing to
the development of CKD and showed that the heritability
(h2) of UAE rate is approximately 30% when analyzing non-
diabetic children of type 2 diabetic individuals
Familial aggregation of diabetic nephropathy
EVIDENCE FOR GENETIC PREDISPOSITION TO
Diabetic Nephropathy
• Another study, showed that adjustment for covariables
such as sex, age, obesity and DM, approximately 30% of
the variability of albumin/creatinine rate was due to
genetic factors
• The magnitude of the familial association cannot be
attributed only to exposure to similar risk factors,
suggesting there is a genetic component
Familial aggregation of diabetic nephropathy
Genes associated with diabetic nephropathy
and different phenotypes
• Although proteinuria and loss of renal function often
occur concomitantly, there is evidence of different
genetic, some patients may have persistent
proteinuria without progressing to loss of renal
function and other patients have loss of renal
function without proteinuria or microalbuminuria
Genome-wide scan studies
• Recent GWS studies have demonstrated chromosomal regions potentially associated with
DN.
• A genome-wide association study with 360,000 SNPs (using the microarray
Affymetrix 5.0 )was recently conducted in two independent cohorts of
Caucasians patients with type 1 DM . SNPs that were highly significant in the two
cohorts were selected for further analyses. Eleven SNPs located at 4 loci were
closely associated with DN (p < 1 x 10⁻⁵) .
• these associations found in the cross-sectional study were confirmed
in a prospective sample of the Diabetes Control and Complications
Trial/Epidemiology of Diabetes Interventions and Complications
(DCCT/EDIC).
• Three of the 11 initial SNPs had their association confirmed, two
were borderline and the remaining did not show a significant
association with the development of DN (proteinuria or CKD)
• the studies using a GWS approach, a potential association was seen
between chromosome 7q and phenotype of DN.
• Genes located in chromosomes 22q, 5q, and 7q might be involved in
the determination of UAE severity in patients with and without DM.
• In a genome wide association study, regions in chromosomes 19 and
2q were identified as associated with proteinuria and ESRD in
patients with type 1 DM .
• A locus in chromosome 1q was associated with ESRD only, while a
locus in chromosome 20p was associated with proteinuria only .
Angiotensin II
Apo E
eNOS
Glut 1 polymorphism...
Benefit of identification of genes
associated with DN
• Recognizing those individuals who are at high risk of
developing this complication.
• It will also allow a better understanding of the mechanisms
and progress of DN.
• Earlier and more aggressive therapies could be provided to
high-risk individuals and thus reduce the associated high
disease burden and mortality.
• Advances in pharmacogenetic research may help treatment
choices by selecting renoprotective drugs according to
individual susceptibility .
In conclusion
• Clinical and epidemiological studies have evidenced a genetic
component of DN.
• However, no specific gene has been able to explain most DN cases
• Most genetic studies have been performed in selected populations but
they are heterogeneous between them.
• Joint efforts are essential to achieve robust findings in the study of
genetics of DN.
• future patients at high risk for developing
DN could be identified and benefited with
earlier specific therapies.
• New pharmacogenomic developments will
contribute to better treatment choices for
DN and, more importantly, will help
preventing it based on an individual’s
genetic characteristics.
dralaawafa@hotmail.com
dralaa@mans.edu.eg
Thank
you

Diabetic nephropathy why and why not

  • 1.
    Diabetic Nephropathy Why &why not ? Alaa Wafa . MD Associate Professor of Internal Medicine Diabetes , Endocrine &Metabolic Disease Unit. Mansoura University
  • 2.
    Are Some Diabetics ImmuneAgainst Diabetic Nephropathy ??
  • 4.
    Definition • A microvascularcomplication of diabetes marked by albuminuria and a deteriorating course from normal renal function to ESRD. Albuminuria 30 - 300 mg/day got called “Microalbuminuria” • it predicts the development of clinical nephropathy • one “positive” is not enough in the low range • detected by measuring the albumin/creatinine ratio on a spot urine sample
  • 5.
    Epidemiology • Diabetic nephropathyis the leading cause of ESRD in the US. • It accounts for 43% of all patients on dialysis • Cost to Medicare > $ 2 billion per year • About 20-30% of patients with type I DM develop microalbuminuria, less than half progress to overt nephropathy • Incidence of ESRD is 16% at 30 years. • 5-60% of type II DM patients develop DN, depending on ethnicity • 63% of patients with diabetic nephropathy have type II DM • The risk of developing diabetic nephropathy is not constant over the duration of diabetes
  • 6.
    Diabetes is thedominant cause of ESRD in USA Incident ESRD patients; Medical Evidence form data; rates adjusted for age, gender, & race. USRDS 2009 U.S. Renal Data System, 2009
  • 8.
    Burden of diabeticnephropathy • The rates of hospitalization for all causes are about three times higher in patients with CKD than in those who do not have the disease. • patients with T2DM with DN and PAD are 1.2 to 1.3 times more likely to be hospitalized. • ESRD is associated with increased mortality, mainly due to C.V. causes • Reduced renal function is by itself an indicator of high mortality. • Other concomitant risk factors such as hypertension and autonomic neuropathy can contribute to cardiovascular diseases • Even patients with DN initially characterized by microalbuminuria already have an increased risk for CVD and higher mortality
  • 9.
    Natural History ofDKD Comprehensive textbook of Nephrology, 2010
  • 10.
    Pathology • Expansion ofmesangial matrix with diffuse and nodular glomerulosclerosis (Kimmelstiel-Wilson nodules) • Thickening of glomerular and tubular BM • Arteriosclerosis and hyalinosis of afferent and efferent arterioles • Tubulointerstitial fibrosis
  • 11.
    Nephron in DKD Comprehensivetextbook of Nephrology, 2010
  • 12.
  • 13.
    Pathogenesis • Hyperglycemia – Inducemesangial expansion and injury – Increased activity of growth factors – Activation of cytokines – Formation of ROS – accumulation of advanced glycosylation endproducts in tissues • Accumulation of ECM components, such as collagen
  • 14.
    Hyperglycaemia drives diabetickidney disease 1. Activation of protein kinase C1 2. Acceleration of the renin- angiotensin-aldosterone system (RAAS)1 3. Non-enzymatic glycation that generates advanced glycation end products1 – Circulating levels are raised in people with diabetes, particularly those with renal insufficiency, since they are normally excreted in the urine1 • Oxidative stress seems to be a theme common to all three pathways3 14 Hypertension Overproduction of mesangial cell matrix Tubulointerstitial injury Acceleration of RAAS Advanced glycation end products (AGEs) Protein kinase C and growth factors Glomerular damage ProteinuriaNephron loss Hyperglycaemia Reference: 1.Cade WT. Diabetes-Related Microvascular and macrovascular diseases in the physical therapy setting. Phys Ther. 2008;88(11):1322–1335. 2.Wolf G et al. (2005) From the periphery of the glomerular capillary wall toward the center of disease: podocyte injury comes of age in diabetic nephropathy. Diabetes 54: 1626-1634. 3.Dronavalli S, Duka I and Bakris GL. Nat Clin Pract Endocrinol Metab. 2008;4(8):444-52. Three mechanisms have been postulated that explain how hyperglycaemia causes tissue damage in the kidney:1-3
  • 15.
    Urinary biomarkers of glomerulardamage **Increased permeability to plasma proteins (transferrin,albumin) - Decreased glomerular charge selectivity - Decreased glomerular size selectivity - Increased intraglomerular pressure ** Increased excretion of extracellular matrix proteins( Type 4 collagen, fibronectin)
  • 16.
    Urinary biomarkers oftubular damage • Inability of tubules to absorb filtered proteins: *Proximal tubular: -L-FAB -Adiponectin (also glomerular markers) -KIM-1 *Loop of Henle: -Osteopontin *Distal tubular: -H-FABP
  • 17.
    Pathogenesis • Genetic predispositionto or protection from diabetic nephropathy – Differences in prevalence of microalbuminuria, ESRD in different patient populations – Only half of patients with poor glycemic control will develop diabetic nephropathy – Family studies • Multiple genes may be involved
  • 18.
    Why Incidence differfrom patient to another ? • About 20% to 30% of patients with type 1 and type 2 DM develop DN; however, a smaller proportion of patients with type 2 DM will progress to end-stage renal disease (ESRD). • Due to its high prevalence, the majority of patients requiring dialysis are type 2 DM . • but not all diabetic individuals will develop this complication ,Those who do not develop DN in the first 15 years after disease onset seem to be genetically protected.
  • 19.
    Cont. • Many environmentalfactors have been established as contributing to the development of DN while the role of others has yet to be clearly understood . • It is known that factors such as hyperglycemia, arterial hypertension and/or dyslipidemia play a role in the development of DN in genetically predisposed individuals only.
  • 20.
    Different Risk factorsalso affect incidence rate – Hypertension – Hyperglycemia – Microalbuminuria – Ethnicity – Male gender – Family history – Cigarette smoking – Dyslipidemia
  • 21.
    • The interestin identification of modifiable risk factors of declining renal function is increasing. • Such risk factors may be used to estimate a subject’s risk of future declining renal function and may also form the basis for preventive intervention
  • 22.
    Different Risk factorsalso affect incidence rate – Hypertension – Hyperglycemia – Microalbuminuria –Ethnicity –Male gender – Family history – Cigarette smoking – Dyslipidemia
  • 24.
    5488 participants ofthe prospective, community-based cohort study PREVEND who completed three visits during a mean follow-up of 6.5 years. The change in renal function was used as the outcome and this was calculated as the linear regression of three estimated GFR measurements obtained during follow-up. Risk factors, known to influence renal outcome in patients with primary renal diseases, were used as potential predictors in multivariate regression analyses.
  • 25.
    Renal function declineis observed in the higher range of Blood glucose both in males and in females.
  • 26.
    Renal function declineis observed in the higher range of Systolic Blood Pressure both in males and in females.
  • 27.
    Renal function declineis observed in the higher range of Urine Albumin Excretion, both in males and in females.
  • 28.
    Conclusion of Genderdifference High systolic blood pressure and plasma glucose were found to be independent predictors for an accelerated decline in function for both genders. In males, albuminuria was the strongest independent predictor for renal function decline, whereas in females albuminuria was univariately associated only after adjustment for age. The direction of the association between cholesterol/HDL ratio and decline of renal function differed by gender.
  • 29.
    Surprisingly,in males, waistcircumference was an independent predictor and positively associated with renal function outcome. These studies show that there are gender differences in the standard predictors of the decline in renal function
  • 30.
     Gender differenceshave been documented in the field of nephrology.  Women seem to be somewhat protected from developing ESRD.  The cumulative incidence of ESRD remains low during the reproductive ages and begins to rise 10 years later in women than in men among participants in community-based screenings Kunitoshi Iseki1 Kidney International (2008) 74, 415–417
  • 32.
    December 31 pointprevalent ESRD patients; rates adjusted for age & gender. USRDS 2009 Diabetes is the dominant cause of ESRD in USA …more so in AAs U.S. Renal Data System, 2009 Race (non modifiable risk factor)
  • 34.
    • Methods: Meta-Analysis andSystematic Reviews of Observational Studies, between January 1994 and July 2014 ,of each of the 54 African countries and African sub-regions to capture the largest number of studies, reported on the prevalence, incidence or determinants of chronic kidney disease (CKD) in people with diabetes within African countries. • Methods for assessing and classifying CKD varied widely. Measurement of urine protein was the most common method of assessing kidney damage (62.5% of studies).
  • 35.
    Results:  The overallprevalence of CKD varied from 11% to 83.7%.  Incident event rates were 94.9% for proteinuria at 10 years of follow-up, 34.7% for endstage renal disease at 5 years of follow-up and 18.4% for mortality from nephropathy at 20 years of follow up.  Duration of diabetes, blood pressure, advancing age, obesity and glucose control were the common determinants of kidney disease.
  • 39.
    GENETIC TRANSMISSION MODELS •The genetic transmission mode of DN is still controversial. Theoretically, as in other diseases, it might occur in three distinct forms, which would lead to the development of DN. Monogenic form mutations in a gene with a dominant role. Oligogenic form mutations/polymo rphisms in a few genes would contribute in an independent and cumulative manner to increase susceptibility. Polygenic form alterations in many DNA loci, and each would have a small and cumulative effect on DN development. Genetic differences in Nephropathy
  • 40.
    EVIDENCE FOR GENETICPREDISPOSITION TO Diabetic Nephropathy • Studies of familial aggregation have showed that some families are predisposed to DN . • Studies on siblings with type 1 or type 2 DM have reported that DN in one of the siblings is associated with around a 3- to 4-fold increase in the risk of DN in the other sibling . • There appears to be a genetic inheritance contributing to the development of CKD and showed that the heritability (h2) of UAE rate is approximately 30% when analyzing non- diabetic children of type 2 diabetic individuals Familial aggregation of diabetic nephropathy
  • 41.
    EVIDENCE FOR GENETICPREDISPOSITION TO Diabetic Nephropathy • Another study, showed that adjustment for covariables such as sex, age, obesity and DM, approximately 30% of the variability of albumin/creatinine rate was due to genetic factors • The magnitude of the familial association cannot be attributed only to exposure to similar risk factors, suggesting there is a genetic component Familial aggregation of diabetic nephropathy
  • 42.
    Genes associated withdiabetic nephropathy and different phenotypes • Although proteinuria and loss of renal function often occur concomitantly, there is evidence of different genetic, some patients may have persistent proteinuria without progressing to loss of renal function and other patients have loss of renal function without proteinuria or microalbuminuria
  • 43.
    Genome-wide scan studies •Recent GWS studies have demonstrated chromosomal regions potentially associated with DN.
  • 44.
    • A genome-wideassociation study with 360,000 SNPs (using the microarray Affymetrix 5.0 )was recently conducted in two independent cohorts of Caucasians patients with type 1 DM . SNPs that were highly significant in the two cohorts were selected for further analyses. Eleven SNPs located at 4 loci were closely associated with DN (p < 1 x 10⁻⁵) .
  • 45.
    • these associationsfound in the cross-sectional study were confirmed in a prospective sample of the Diabetes Control and Complications Trial/Epidemiology of Diabetes Interventions and Complications (DCCT/EDIC). • Three of the 11 initial SNPs had their association confirmed, two were borderline and the remaining did not show a significant association with the development of DN (proteinuria or CKD)
  • 46.
    • the studiesusing a GWS approach, a potential association was seen between chromosome 7q and phenotype of DN. • Genes located in chromosomes 22q, 5q, and 7q might be involved in the determination of UAE severity in patients with and without DM. • In a genome wide association study, regions in chromosomes 19 and 2q were identified as associated with proteinuria and ESRD in patients with type 1 DM . • A locus in chromosome 1q was associated with ESRD only, while a locus in chromosome 20p was associated with proteinuria only .
  • 47.
  • 48.
    Benefit of identificationof genes associated with DN • Recognizing those individuals who are at high risk of developing this complication. • It will also allow a better understanding of the mechanisms and progress of DN. • Earlier and more aggressive therapies could be provided to high-risk individuals and thus reduce the associated high disease burden and mortality. • Advances in pharmacogenetic research may help treatment choices by selecting renoprotective drugs according to individual susceptibility .
  • 49.
    In conclusion • Clinicaland epidemiological studies have evidenced a genetic component of DN. • However, no specific gene has been able to explain most DN cases • Most genetic studies have been performed in selected populations but they are heterogeneous between them. • Joint efforts are essential to achieve robust findings in the study of genetics of DN.
  • 50.
    • future patientsat high risk for developing DN could be identified and benefited with earlier specific therapies. • New pharmacogenomic developments will contribute to better treatment choices for DN and, more importantly, will help preventing it based on an individual’s genetic characteristics.
  • 51.