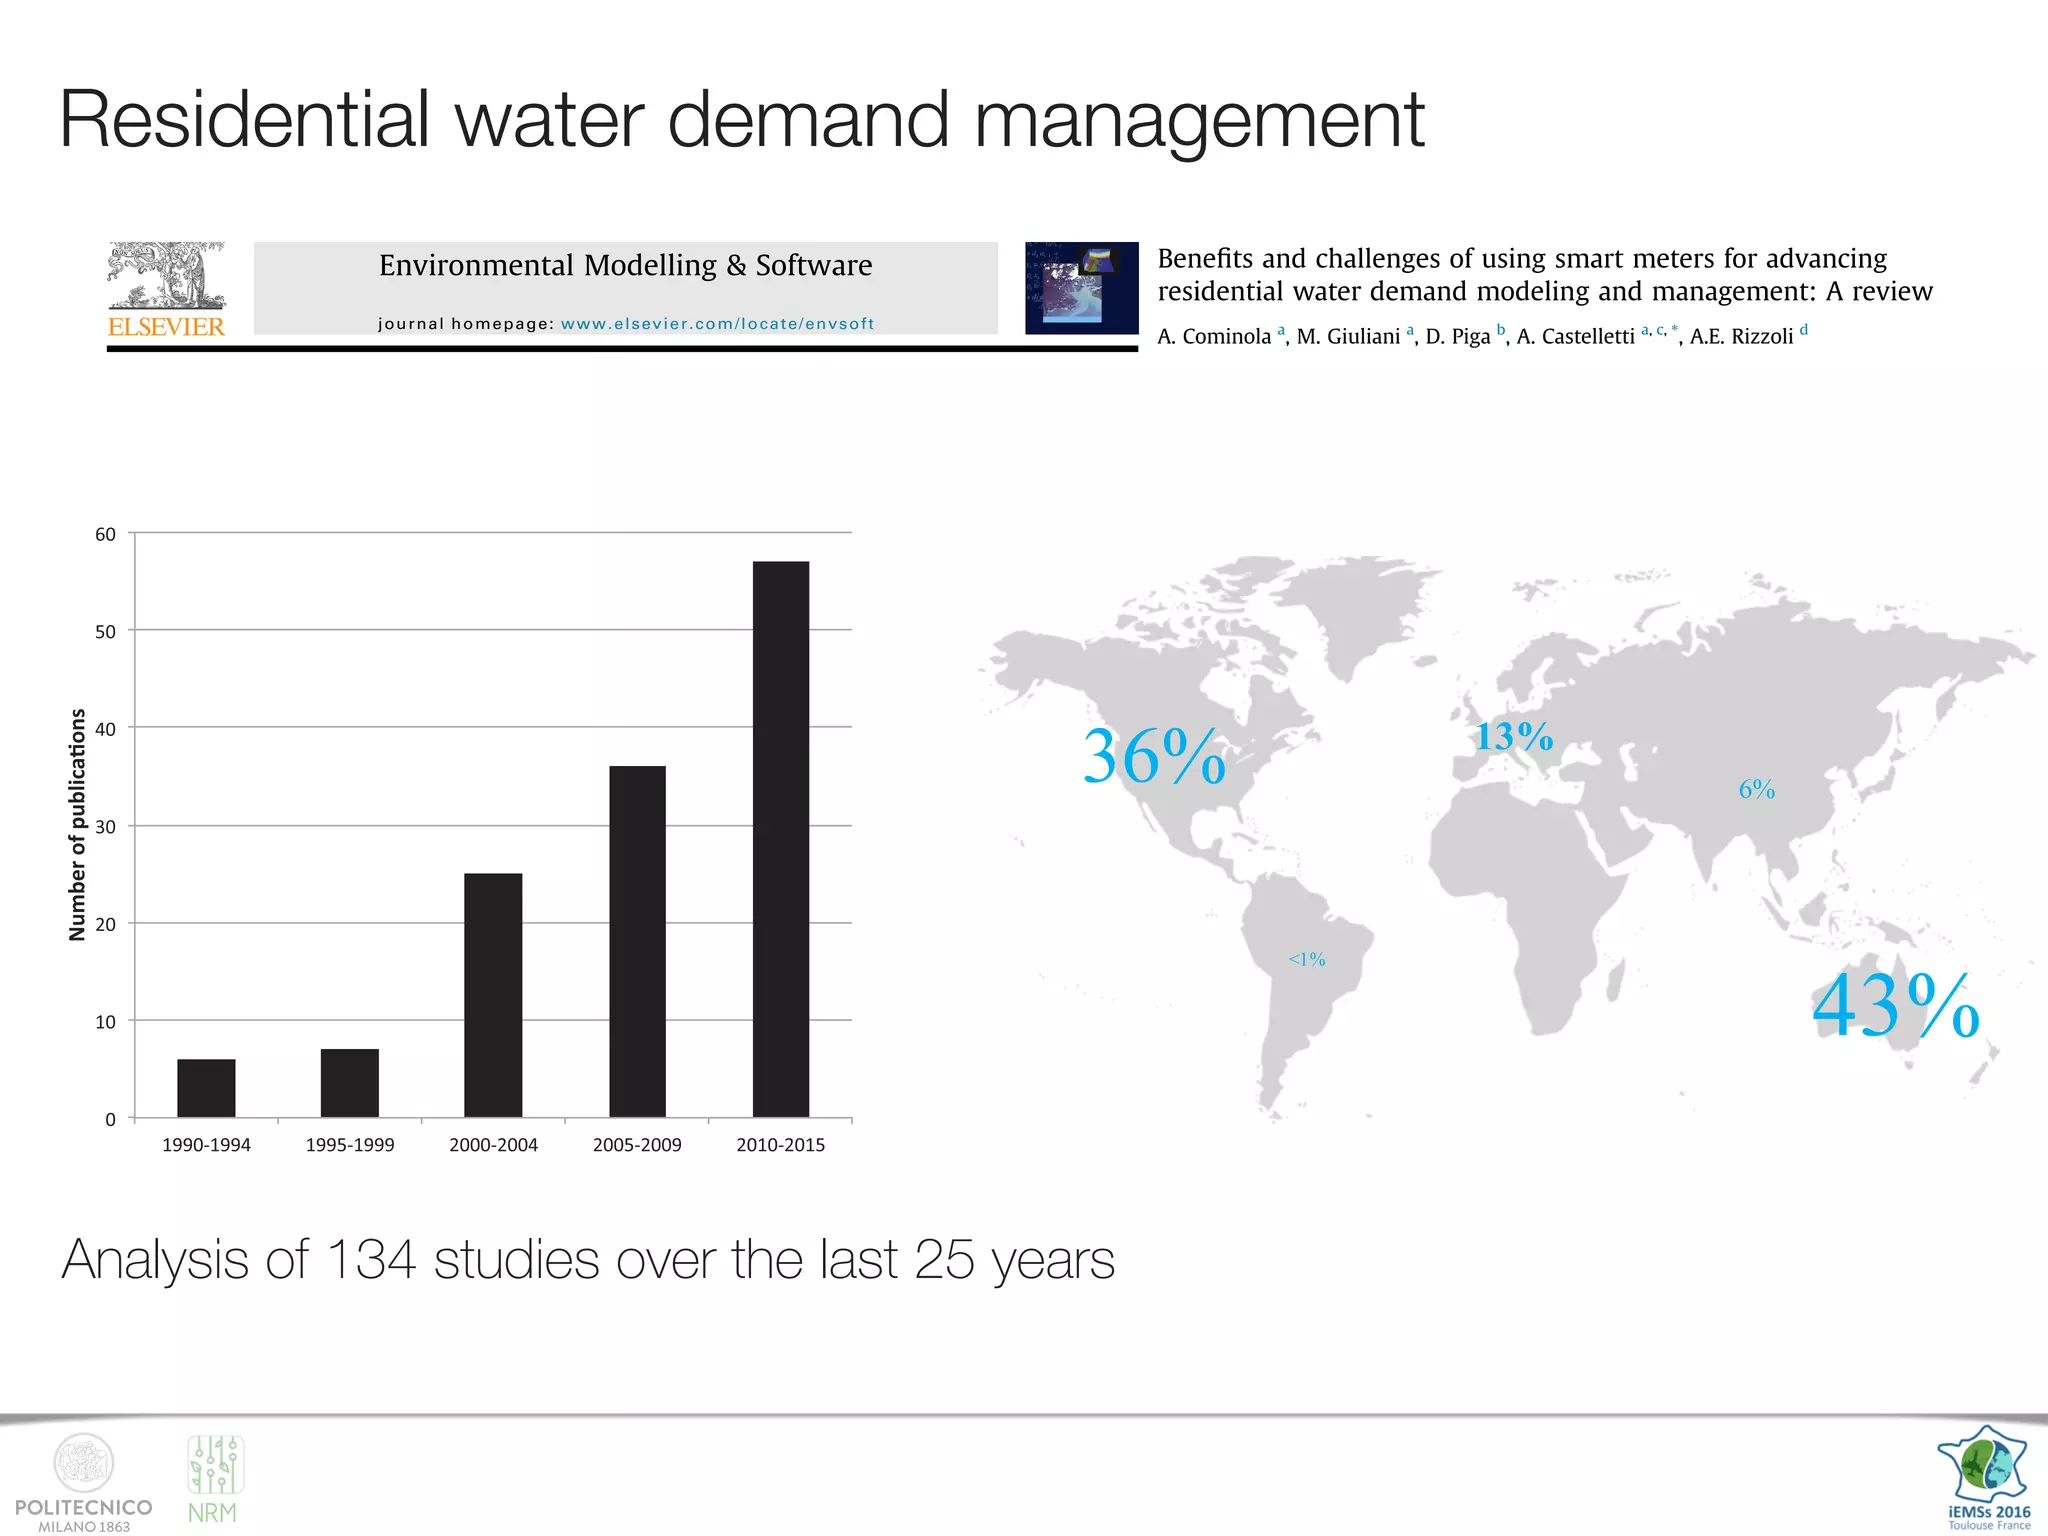
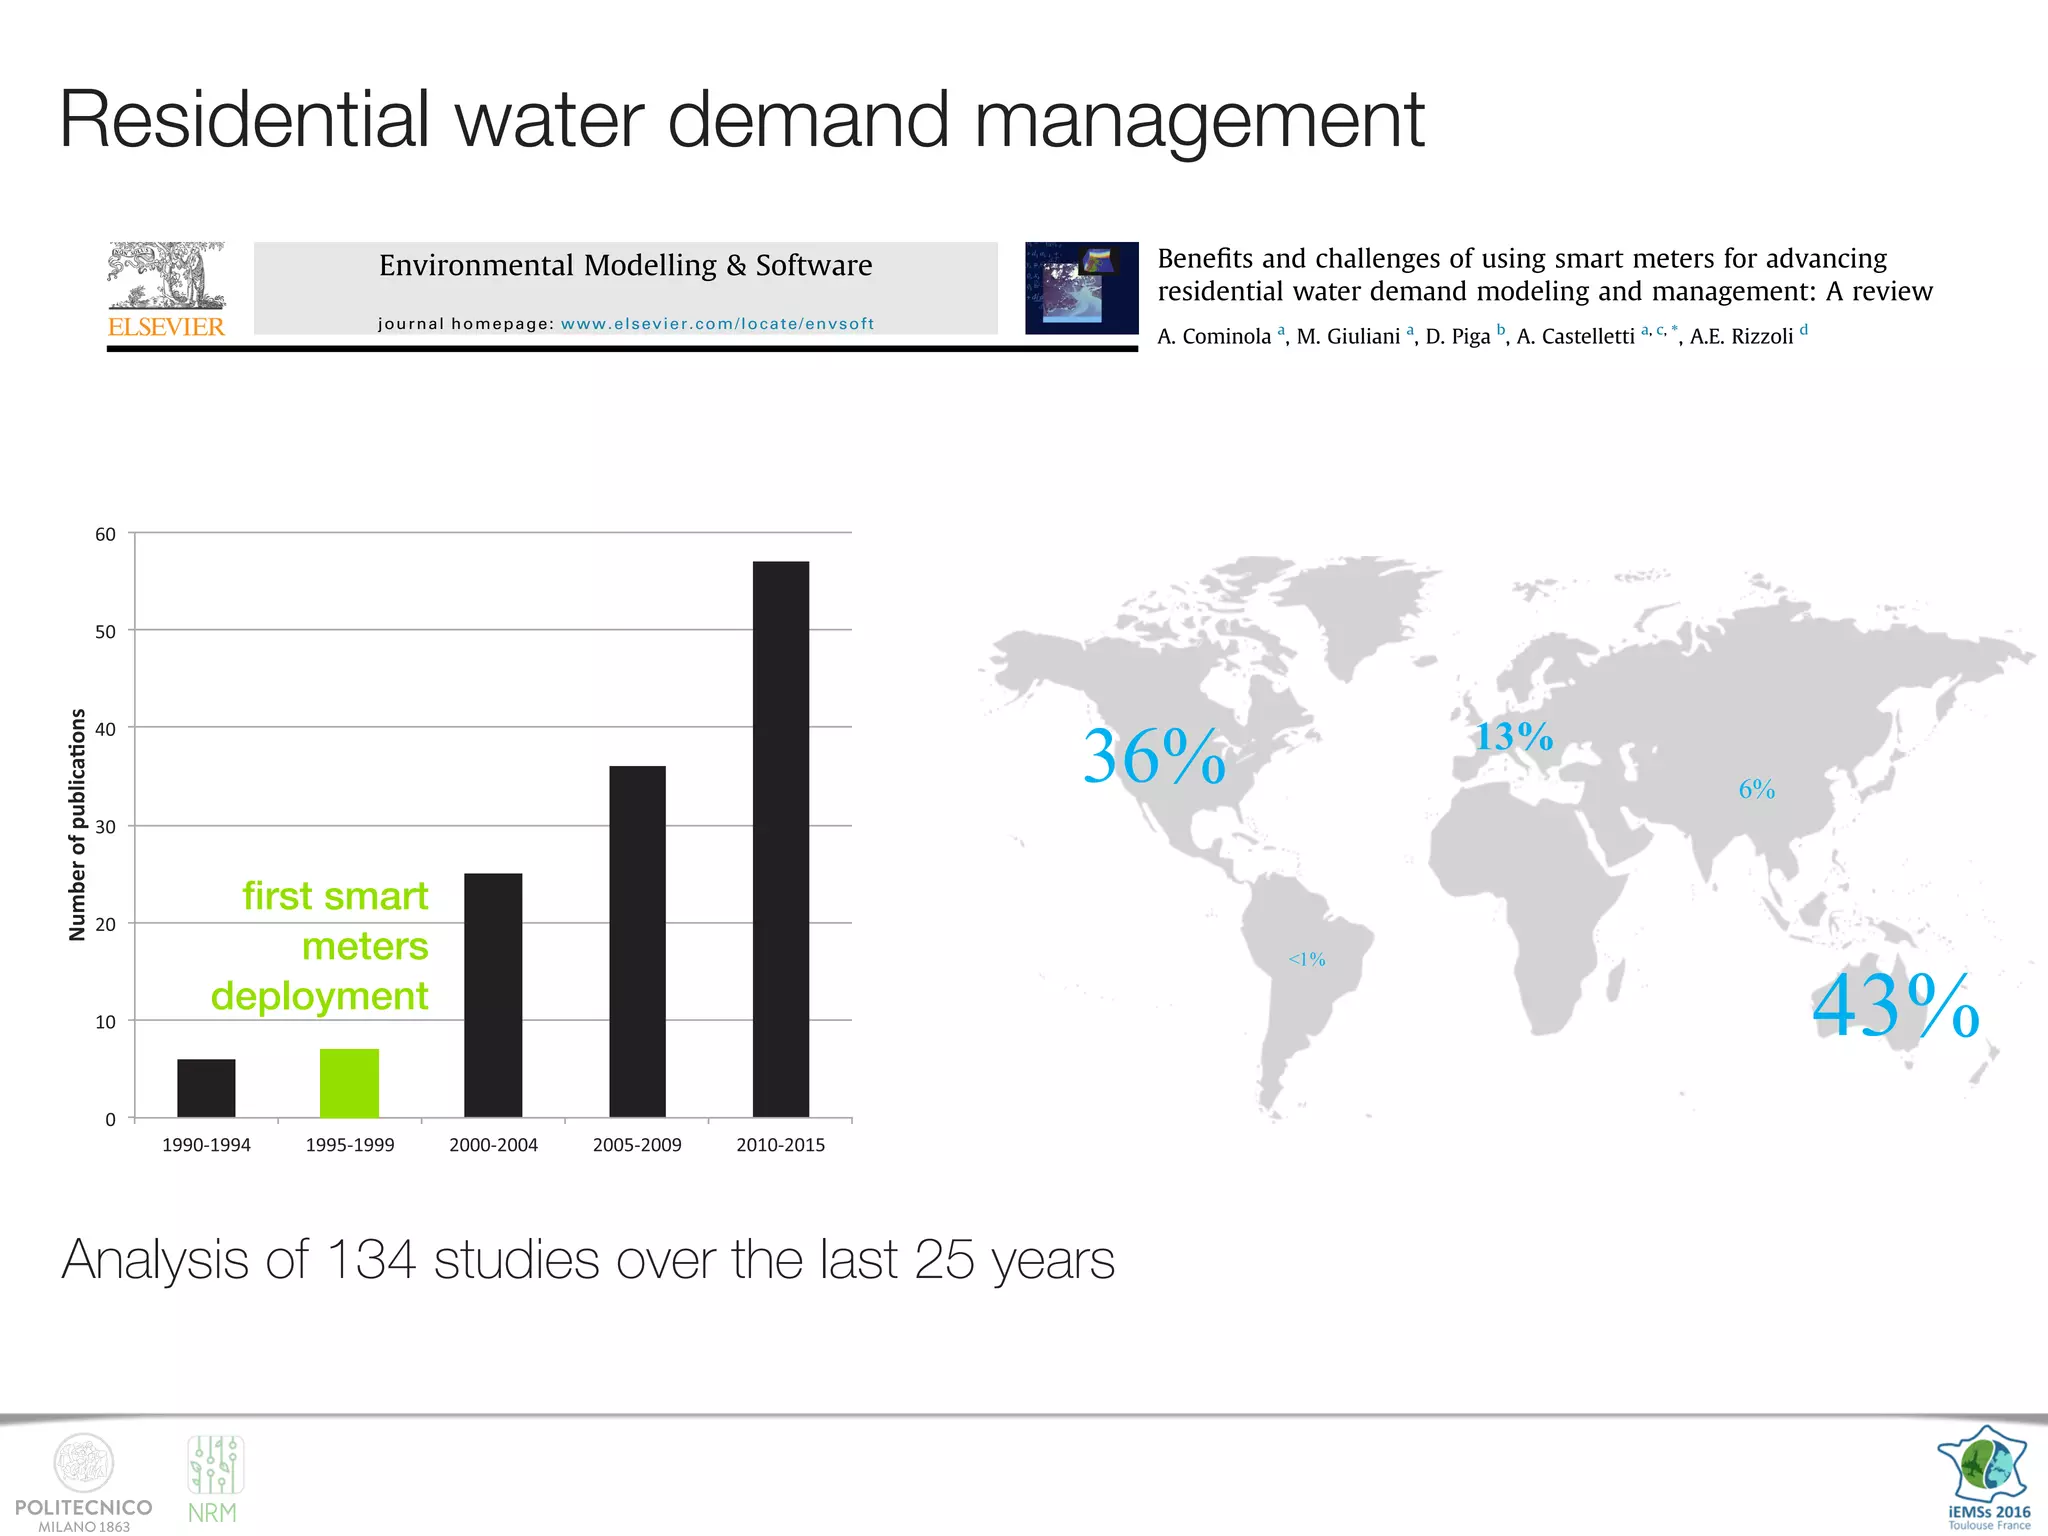
This document reviews literature on using smart water meters to model and manage residential water demand. It discusses how smart meter data collected at high temporal and spatial resolution has advanced the ability to characterize, model, and design water conservation strategies. However, research thus far has focused on these aspects separately without much integration. The review provides a framework to classify water demand modeling studies and identifies trends and future challenges, such as supporting more integrated modeling and management approaches to address growing populations, limited water resources, and climate change impacts across many countries.
![NRM
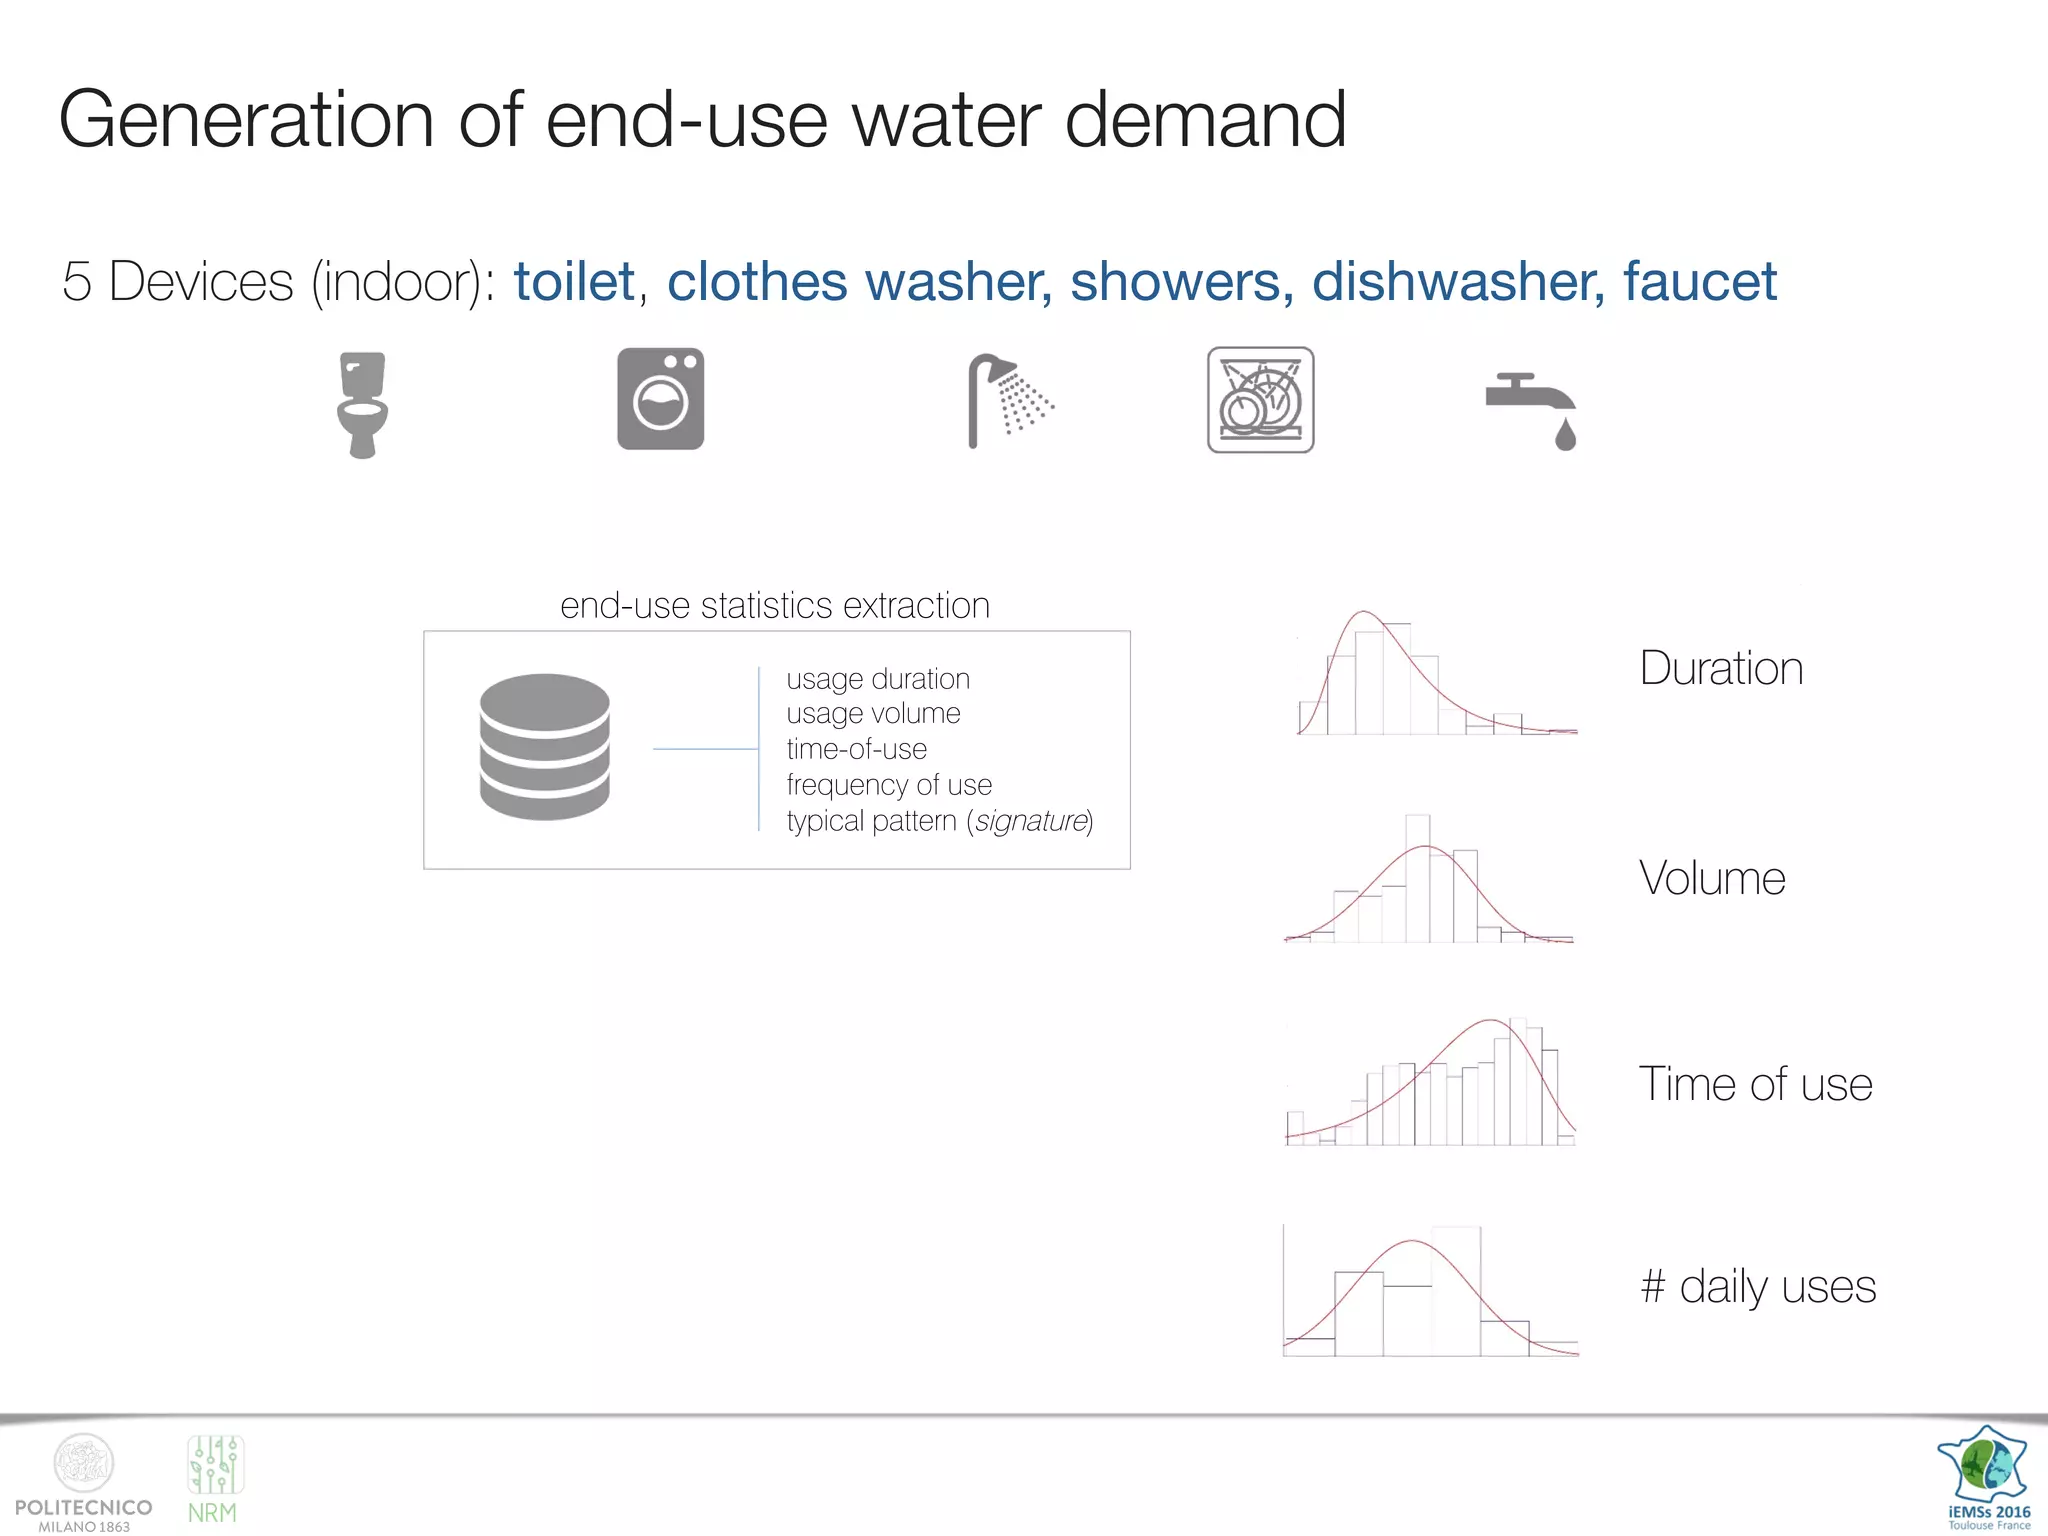
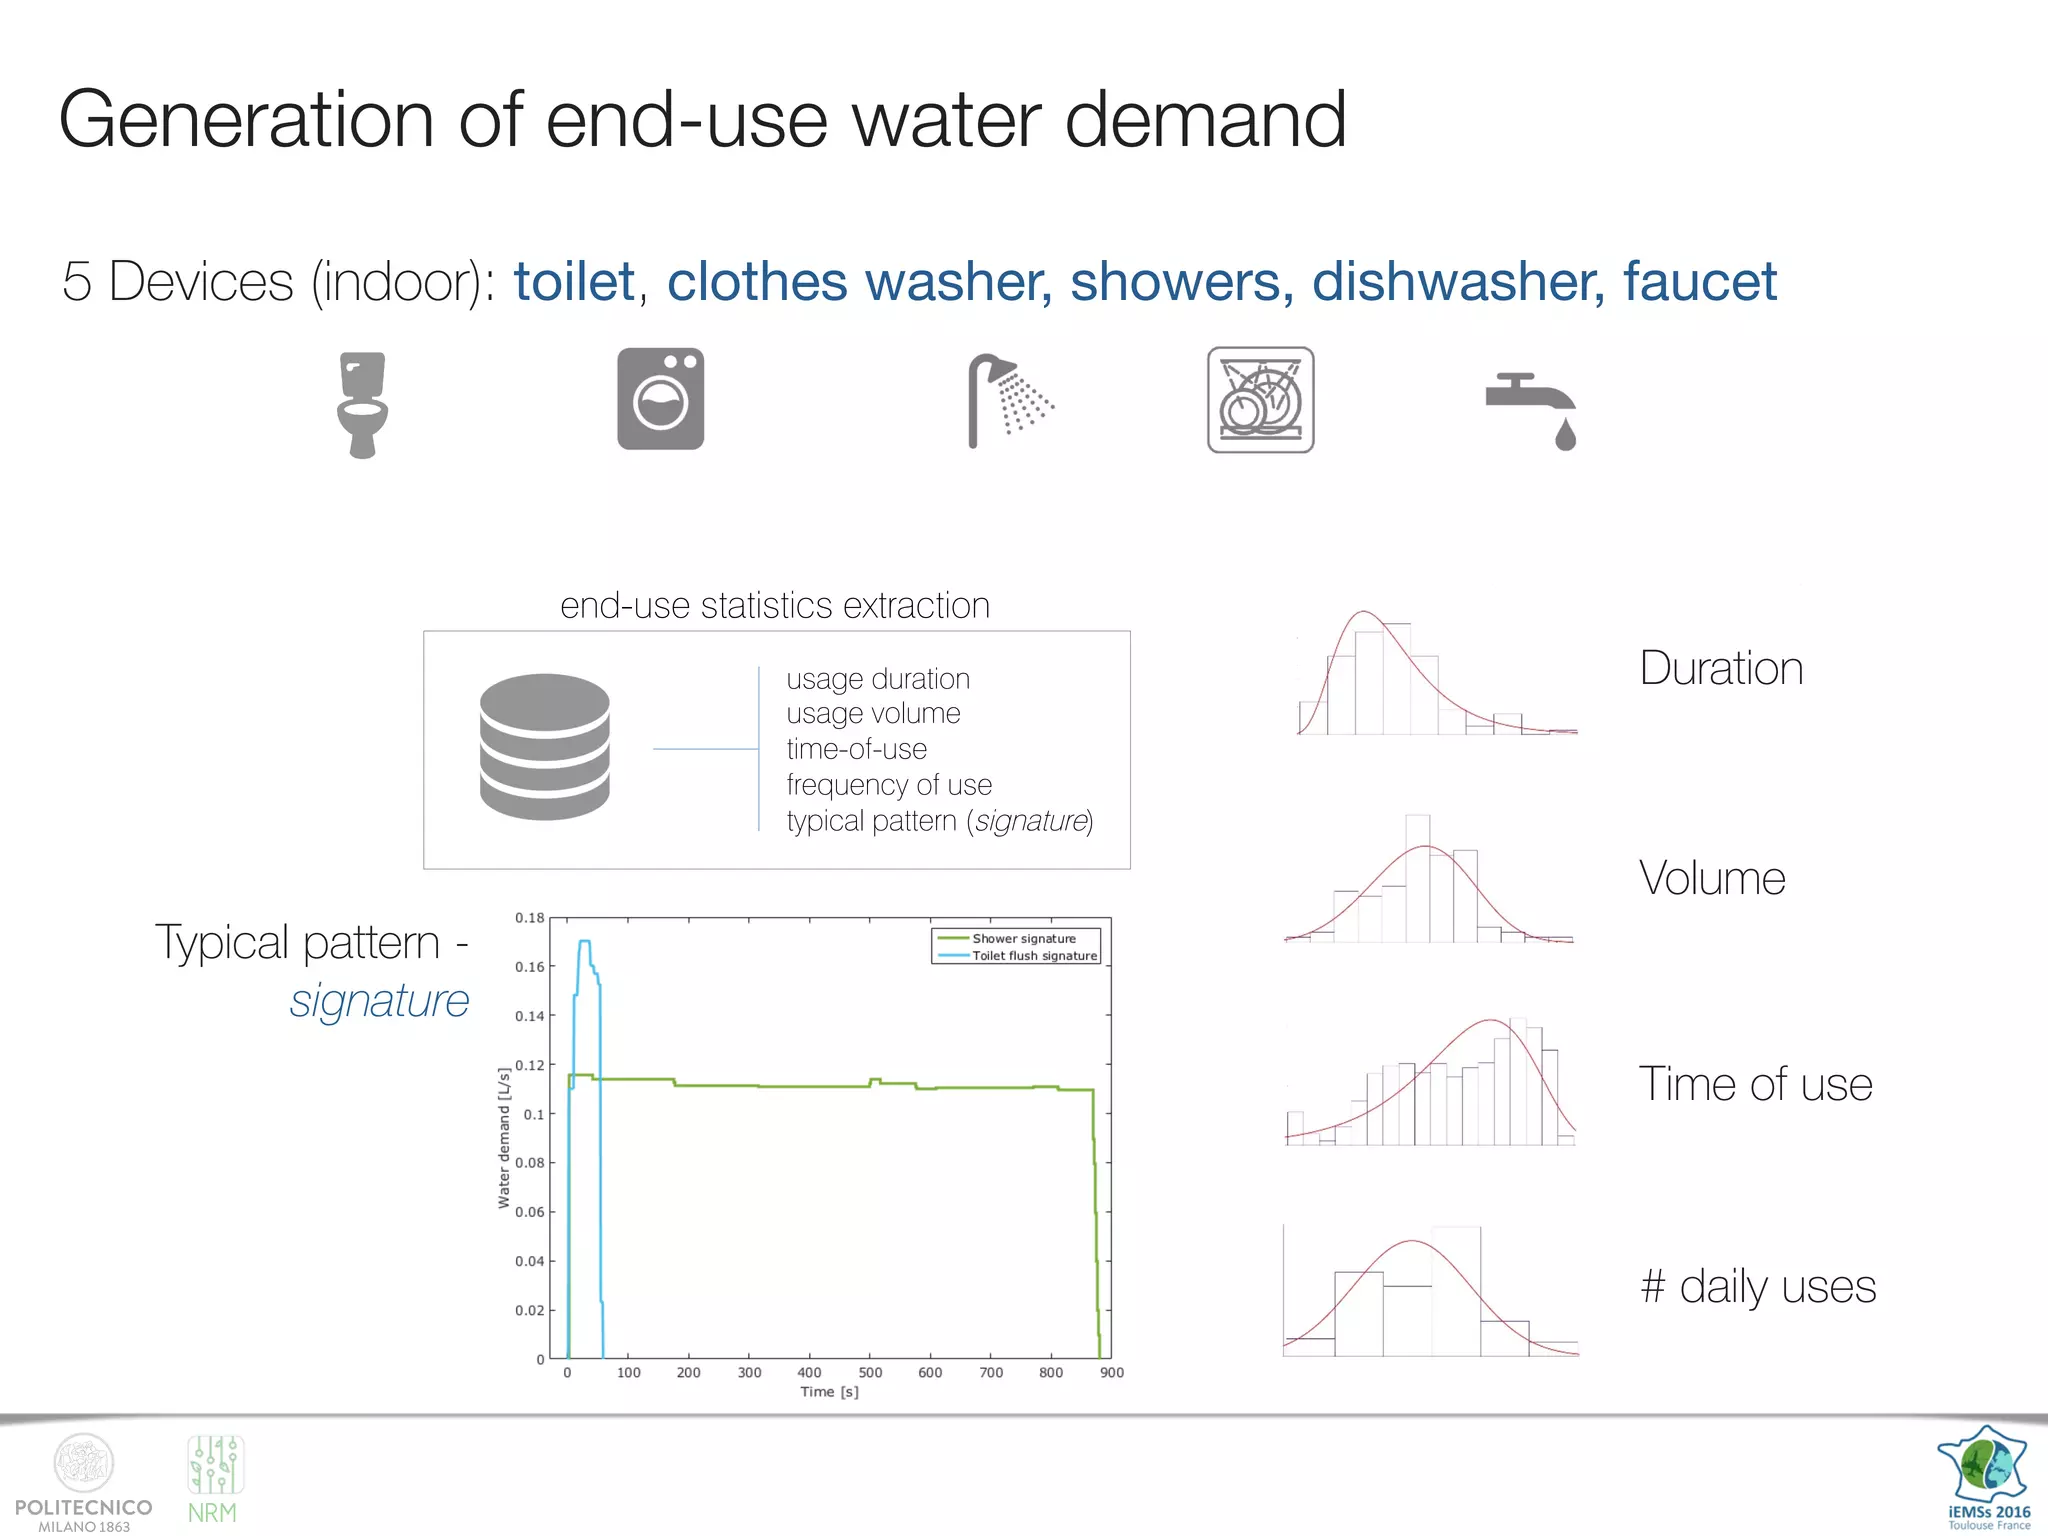
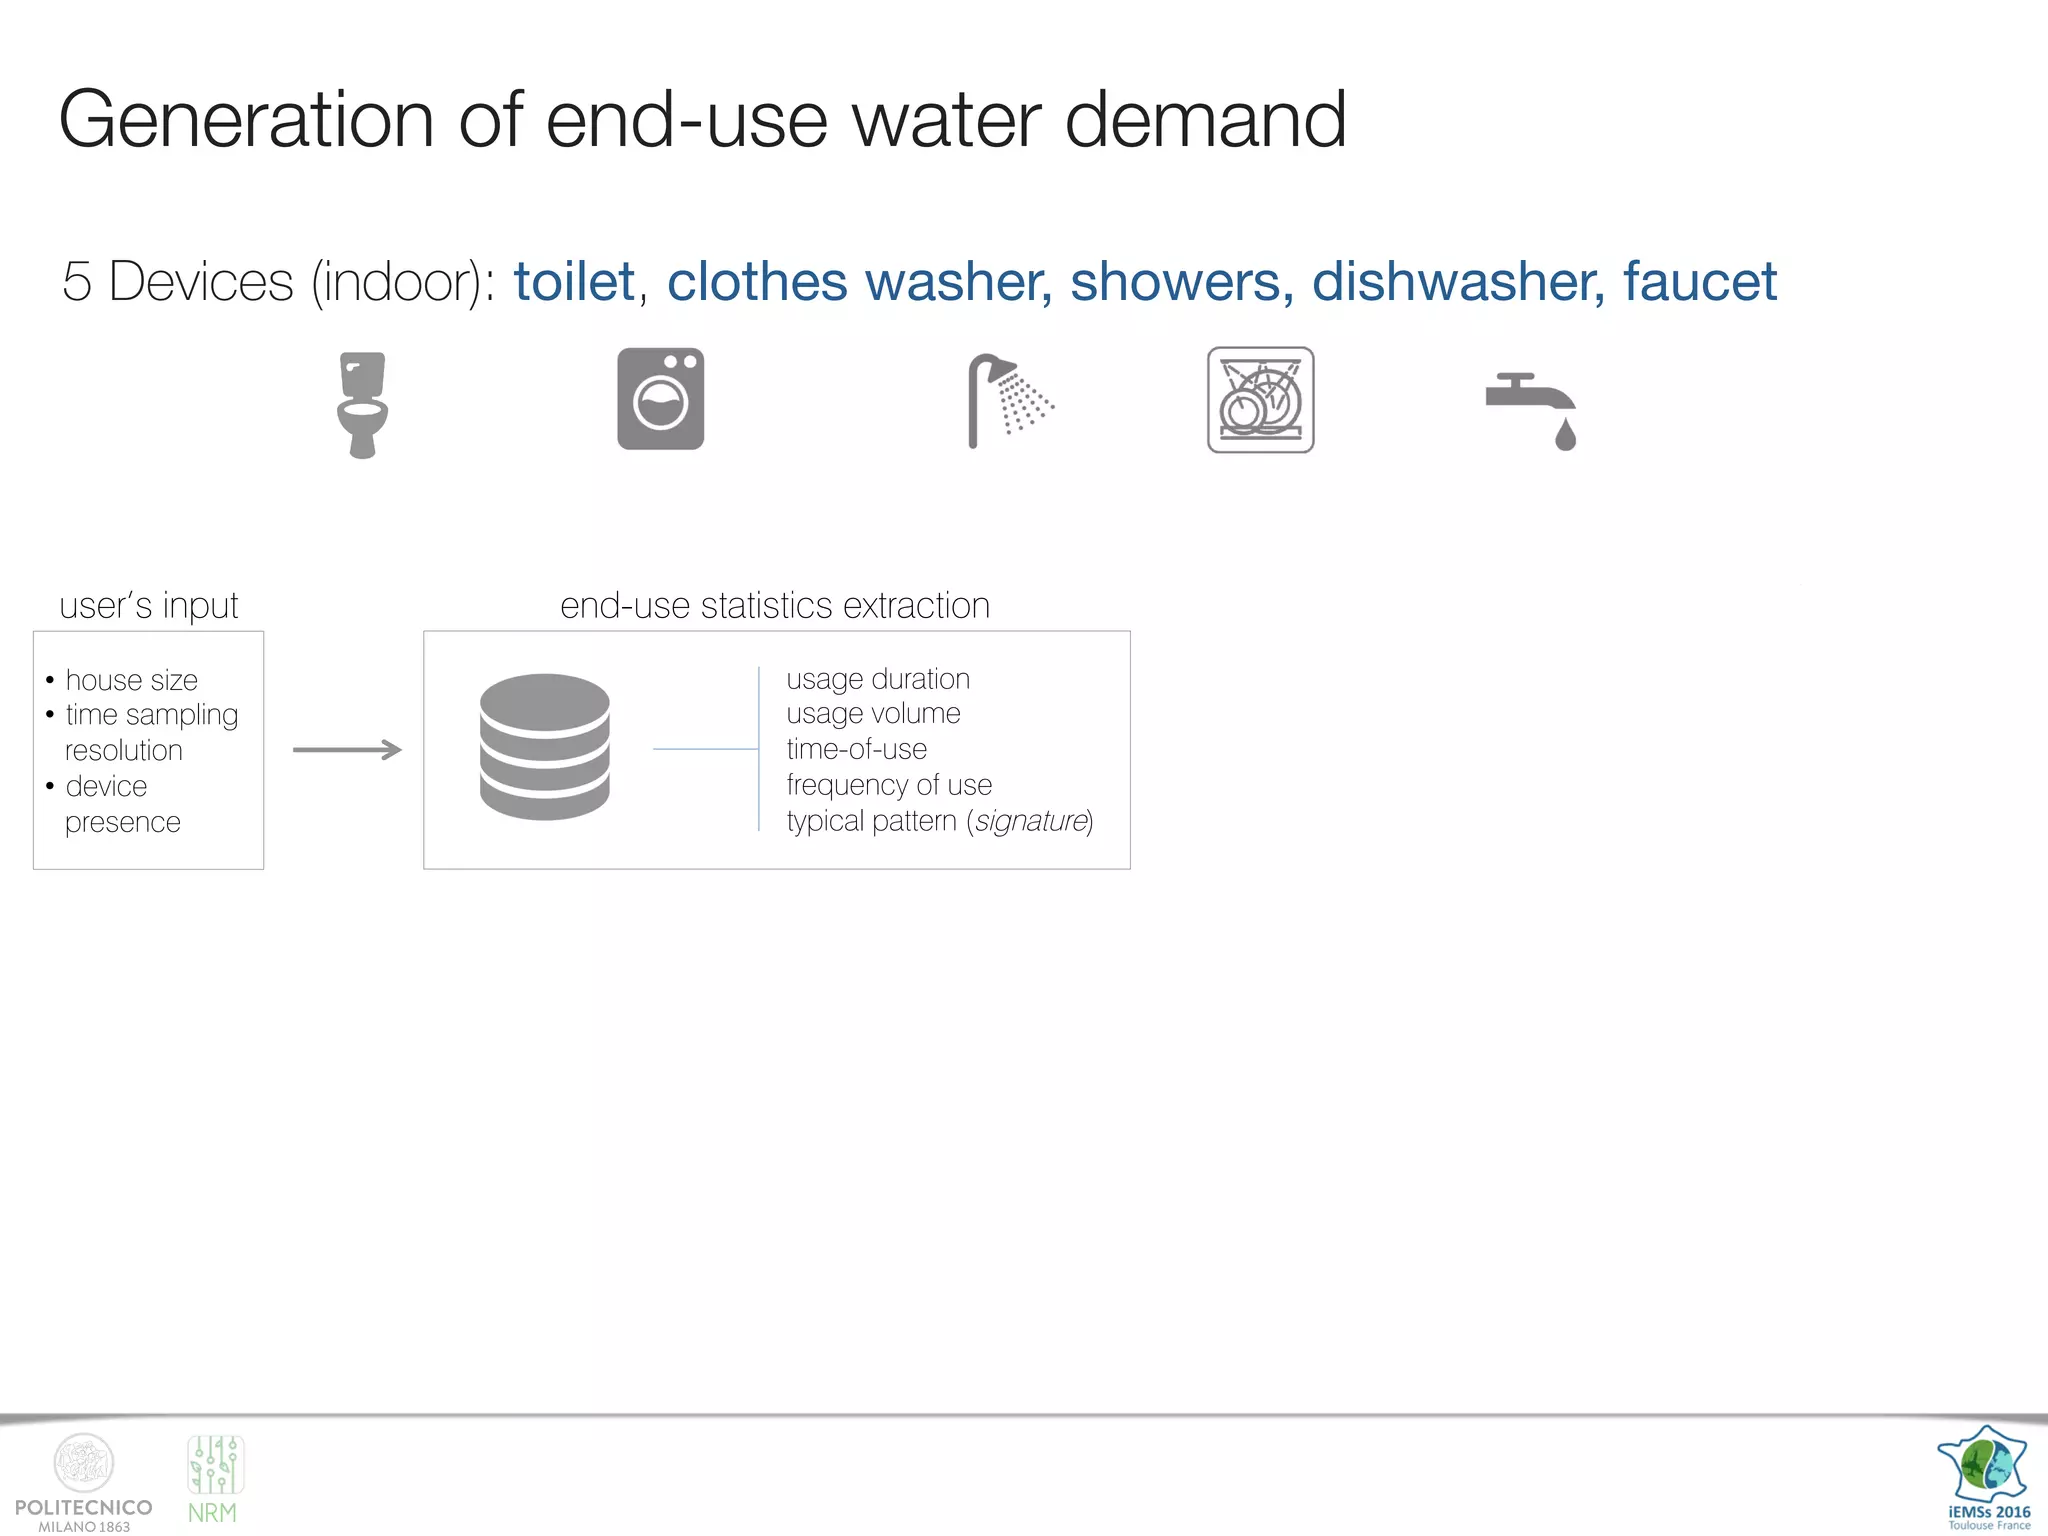
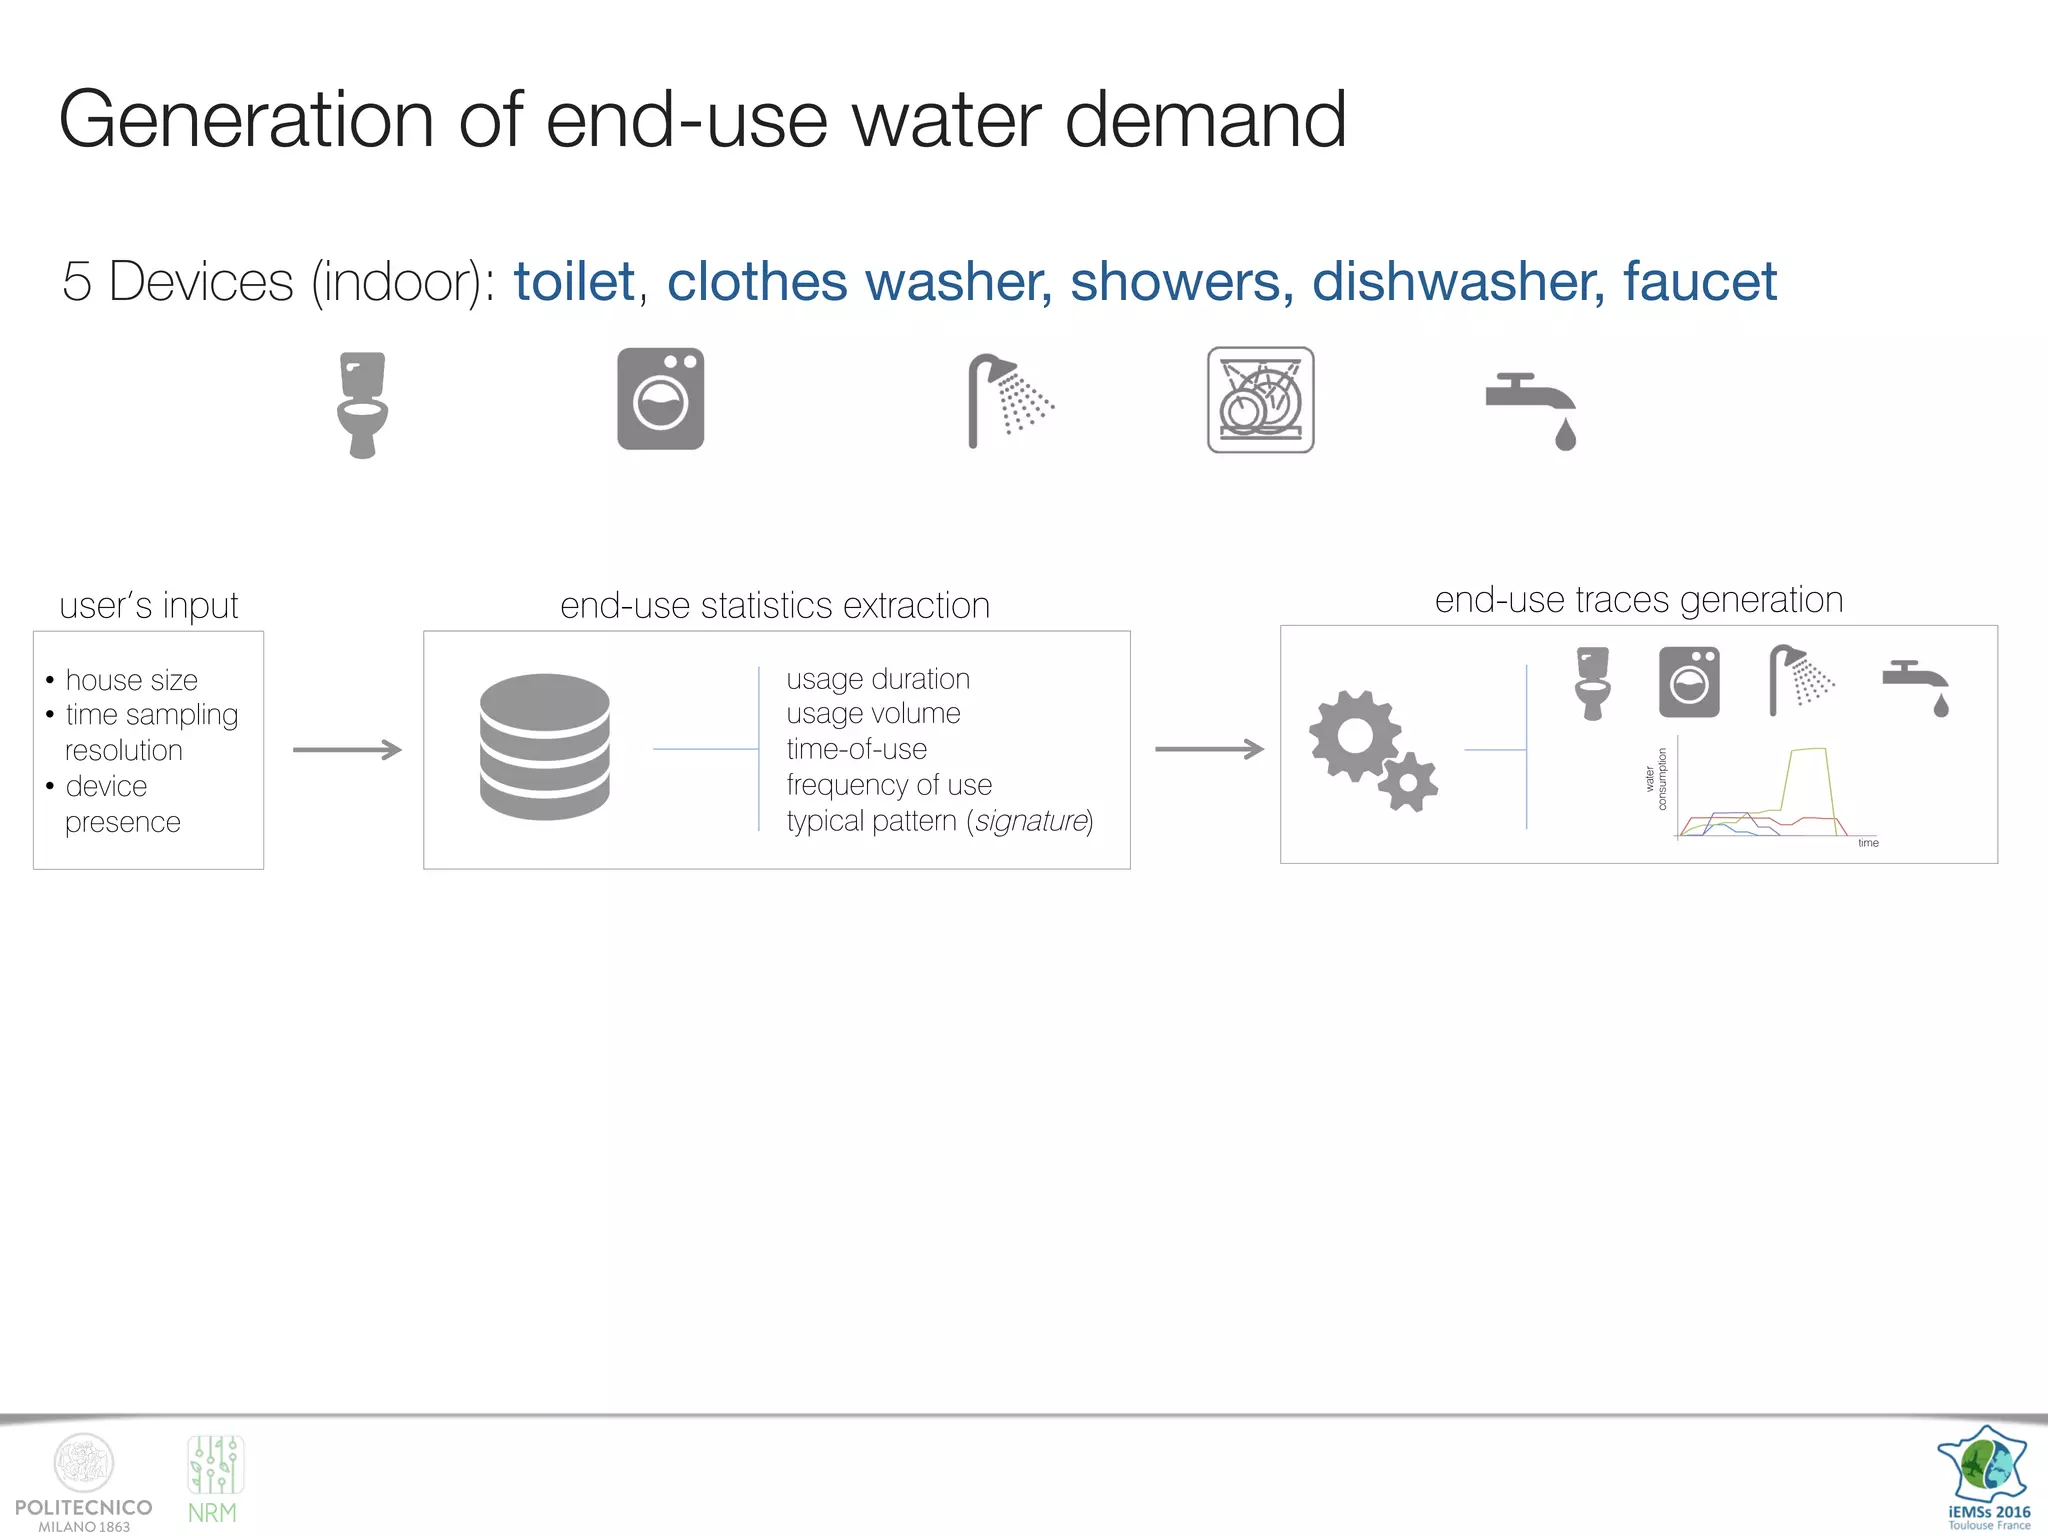
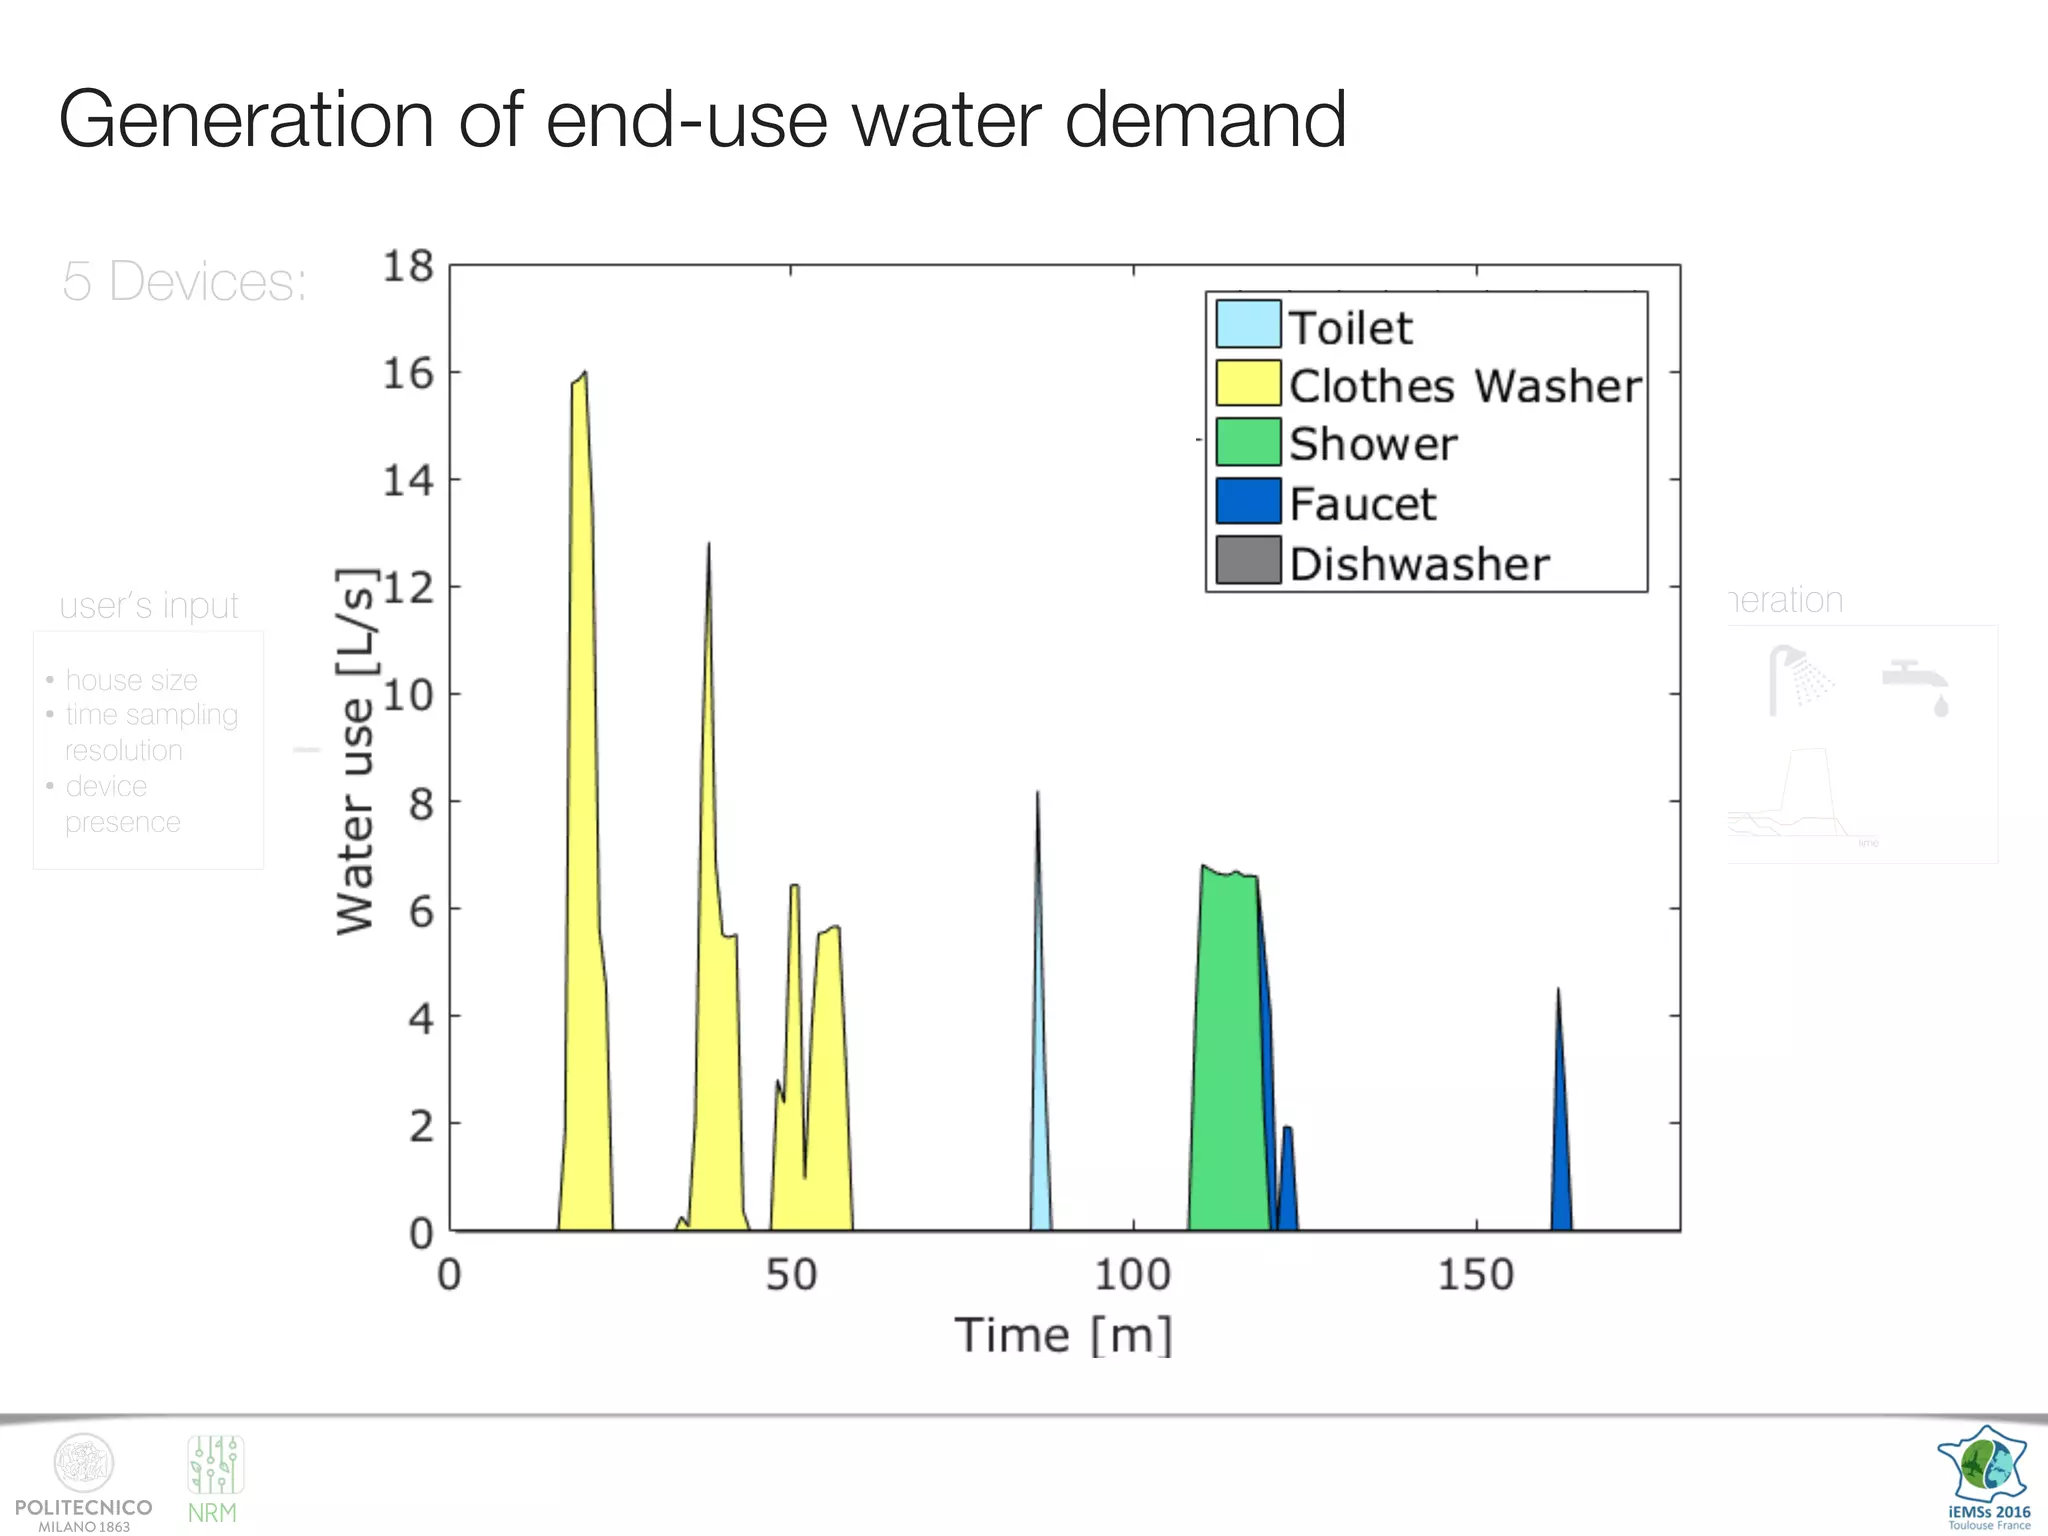
Generation of end-use water demand
5 Devices (indoor): toilet, clothes washer, showers, dishwasher, faucet
753,076 water-use events
over 4,036 monitoring days
across 9 US cities
Source: DeOreo [2011]](https://image.slidesharecdn.com/iemss2016generatorgiuliani-170306090711/75/Developing-a-stochastic-simulation-model-for-the-generation-of-residential-water-end-use-demand-time-series-9-2048.jpg)
![NRM
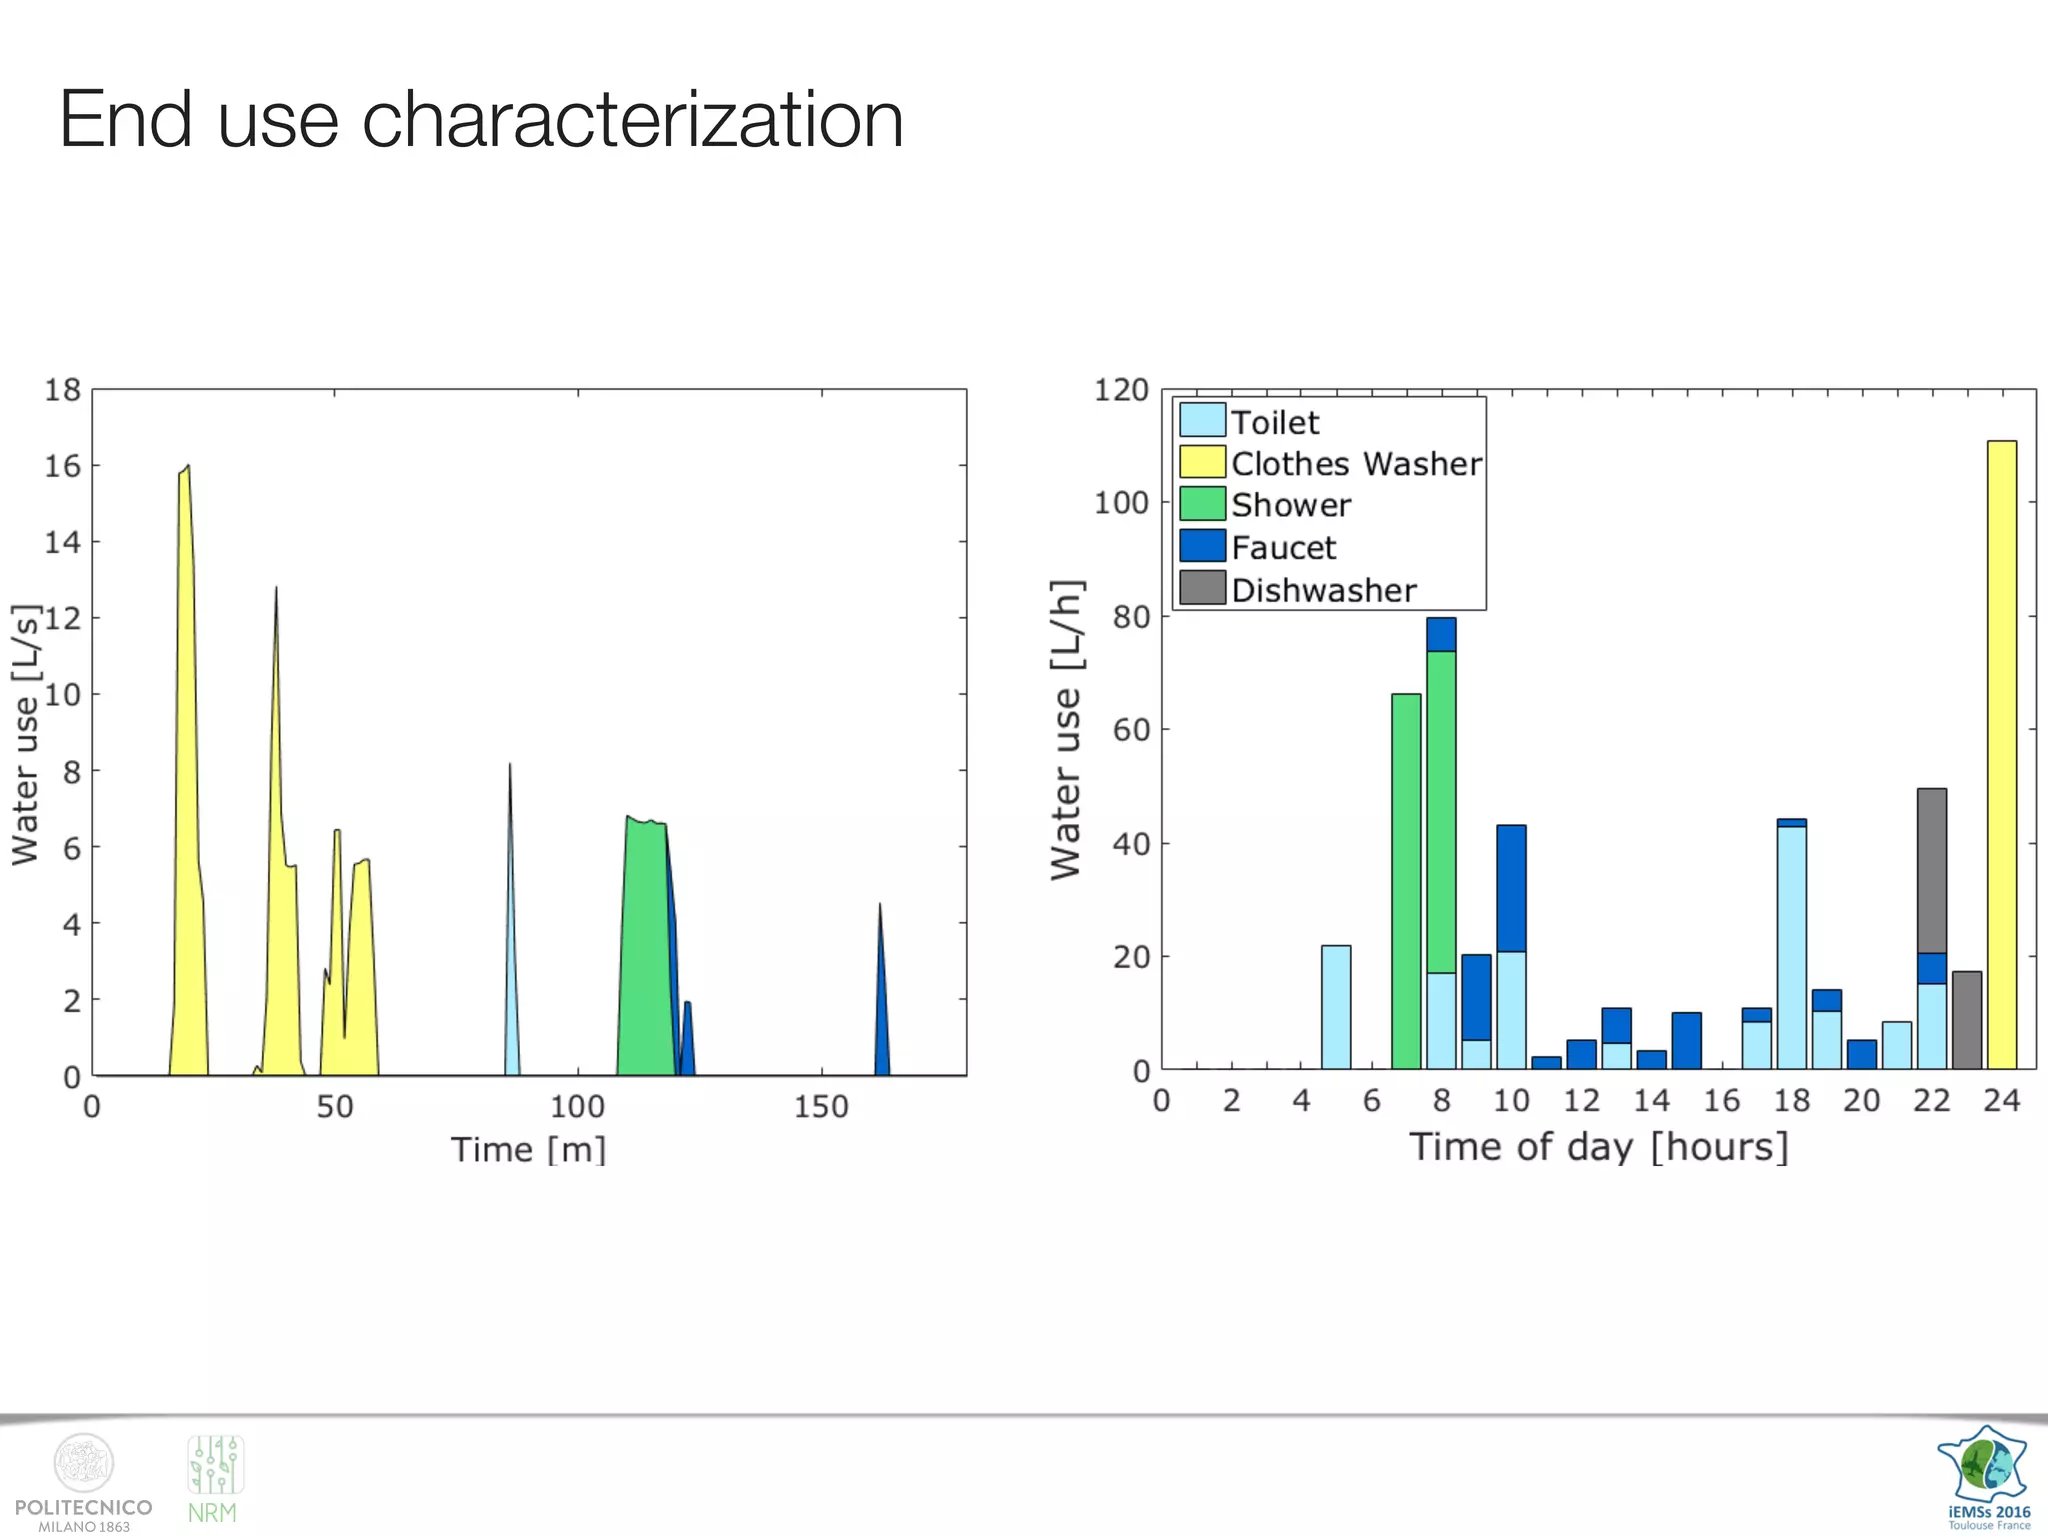
Generation of end-use water demand
DEVELOPMENT OF A SYNTHETIC WATER END-USE PATTERNS GENERATOR
An algorithm to generate synthetic water end-use patterns has been developed within the SmartH2O project, with the double pu
• building end-use water consumption datasets to feed disaggregation algorithms and to provide benchmark datasets for com
testing;
• allowing for the generation of end-use patterns under different demographic and technological scenarios.
DEVELOPMENT PLAN
• User-friendly interface
• Web portal to contribute with new
datasets from different case studies
CURRENT FEATURES
• Trained on high-resolutions (1 second) consumption data from 9 cities across USA
• Performance validated with a two-sample Kolmogorov-Smirnov test
• Flexible for synthetic generation at multi-scale resolutions.
user’s input end-use statistics extraction end-use traces generation
• house size
• time sampling
resolution
• device
presence
usage duration
usage volume
time-of-use
frequency of use
typical pattern (signature)
34 %
Andrea Cominol
andrea.cominola@polimi
@smartH2Oproje
#SmartH2
time
water
consumption
5 Devices (indoor): toilet, clothes washer, showers, dishwasher, faucet
753,076 water-use events
over 4,036 monitoring days
across 9 US cities
Source: DeOreo [2011]](https://image.slidesharecdn.com/iemss2016generatorgiuliani-170306090711/75/Developing-a-stochastic-simulation-model-for-the-generation-of-residential-water-end-use-demand-time-series-10-2048.jpg)