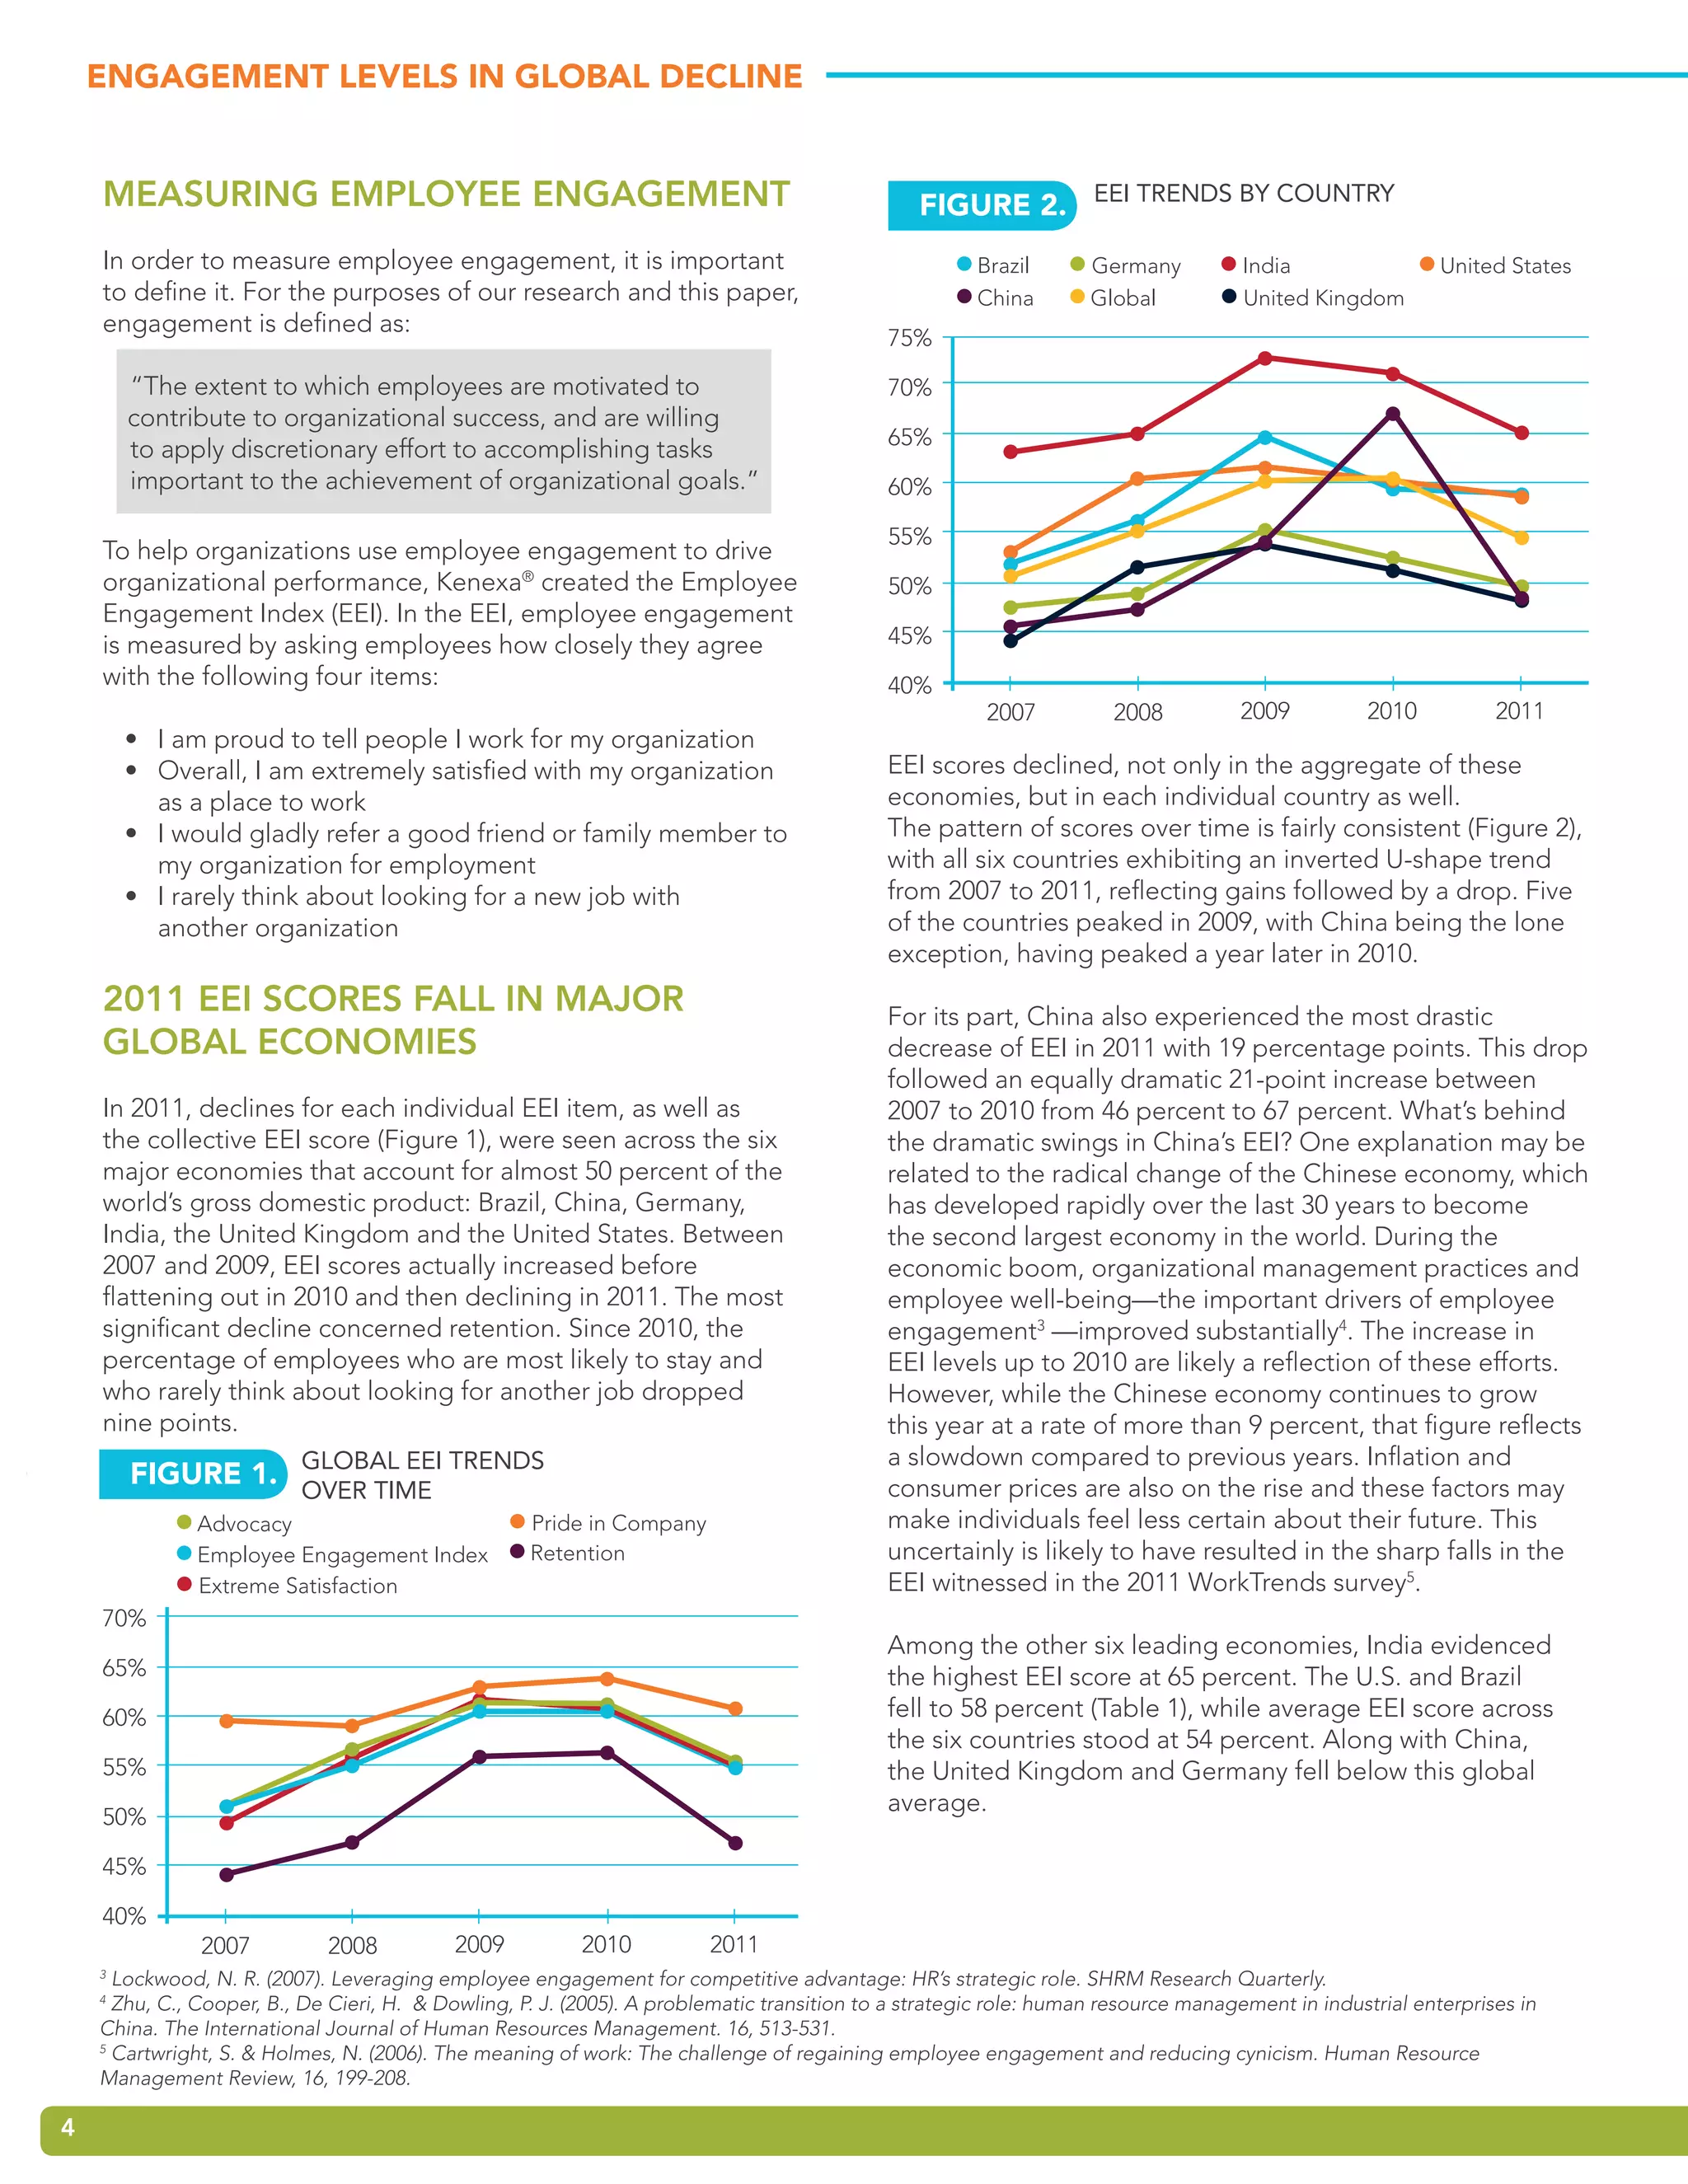
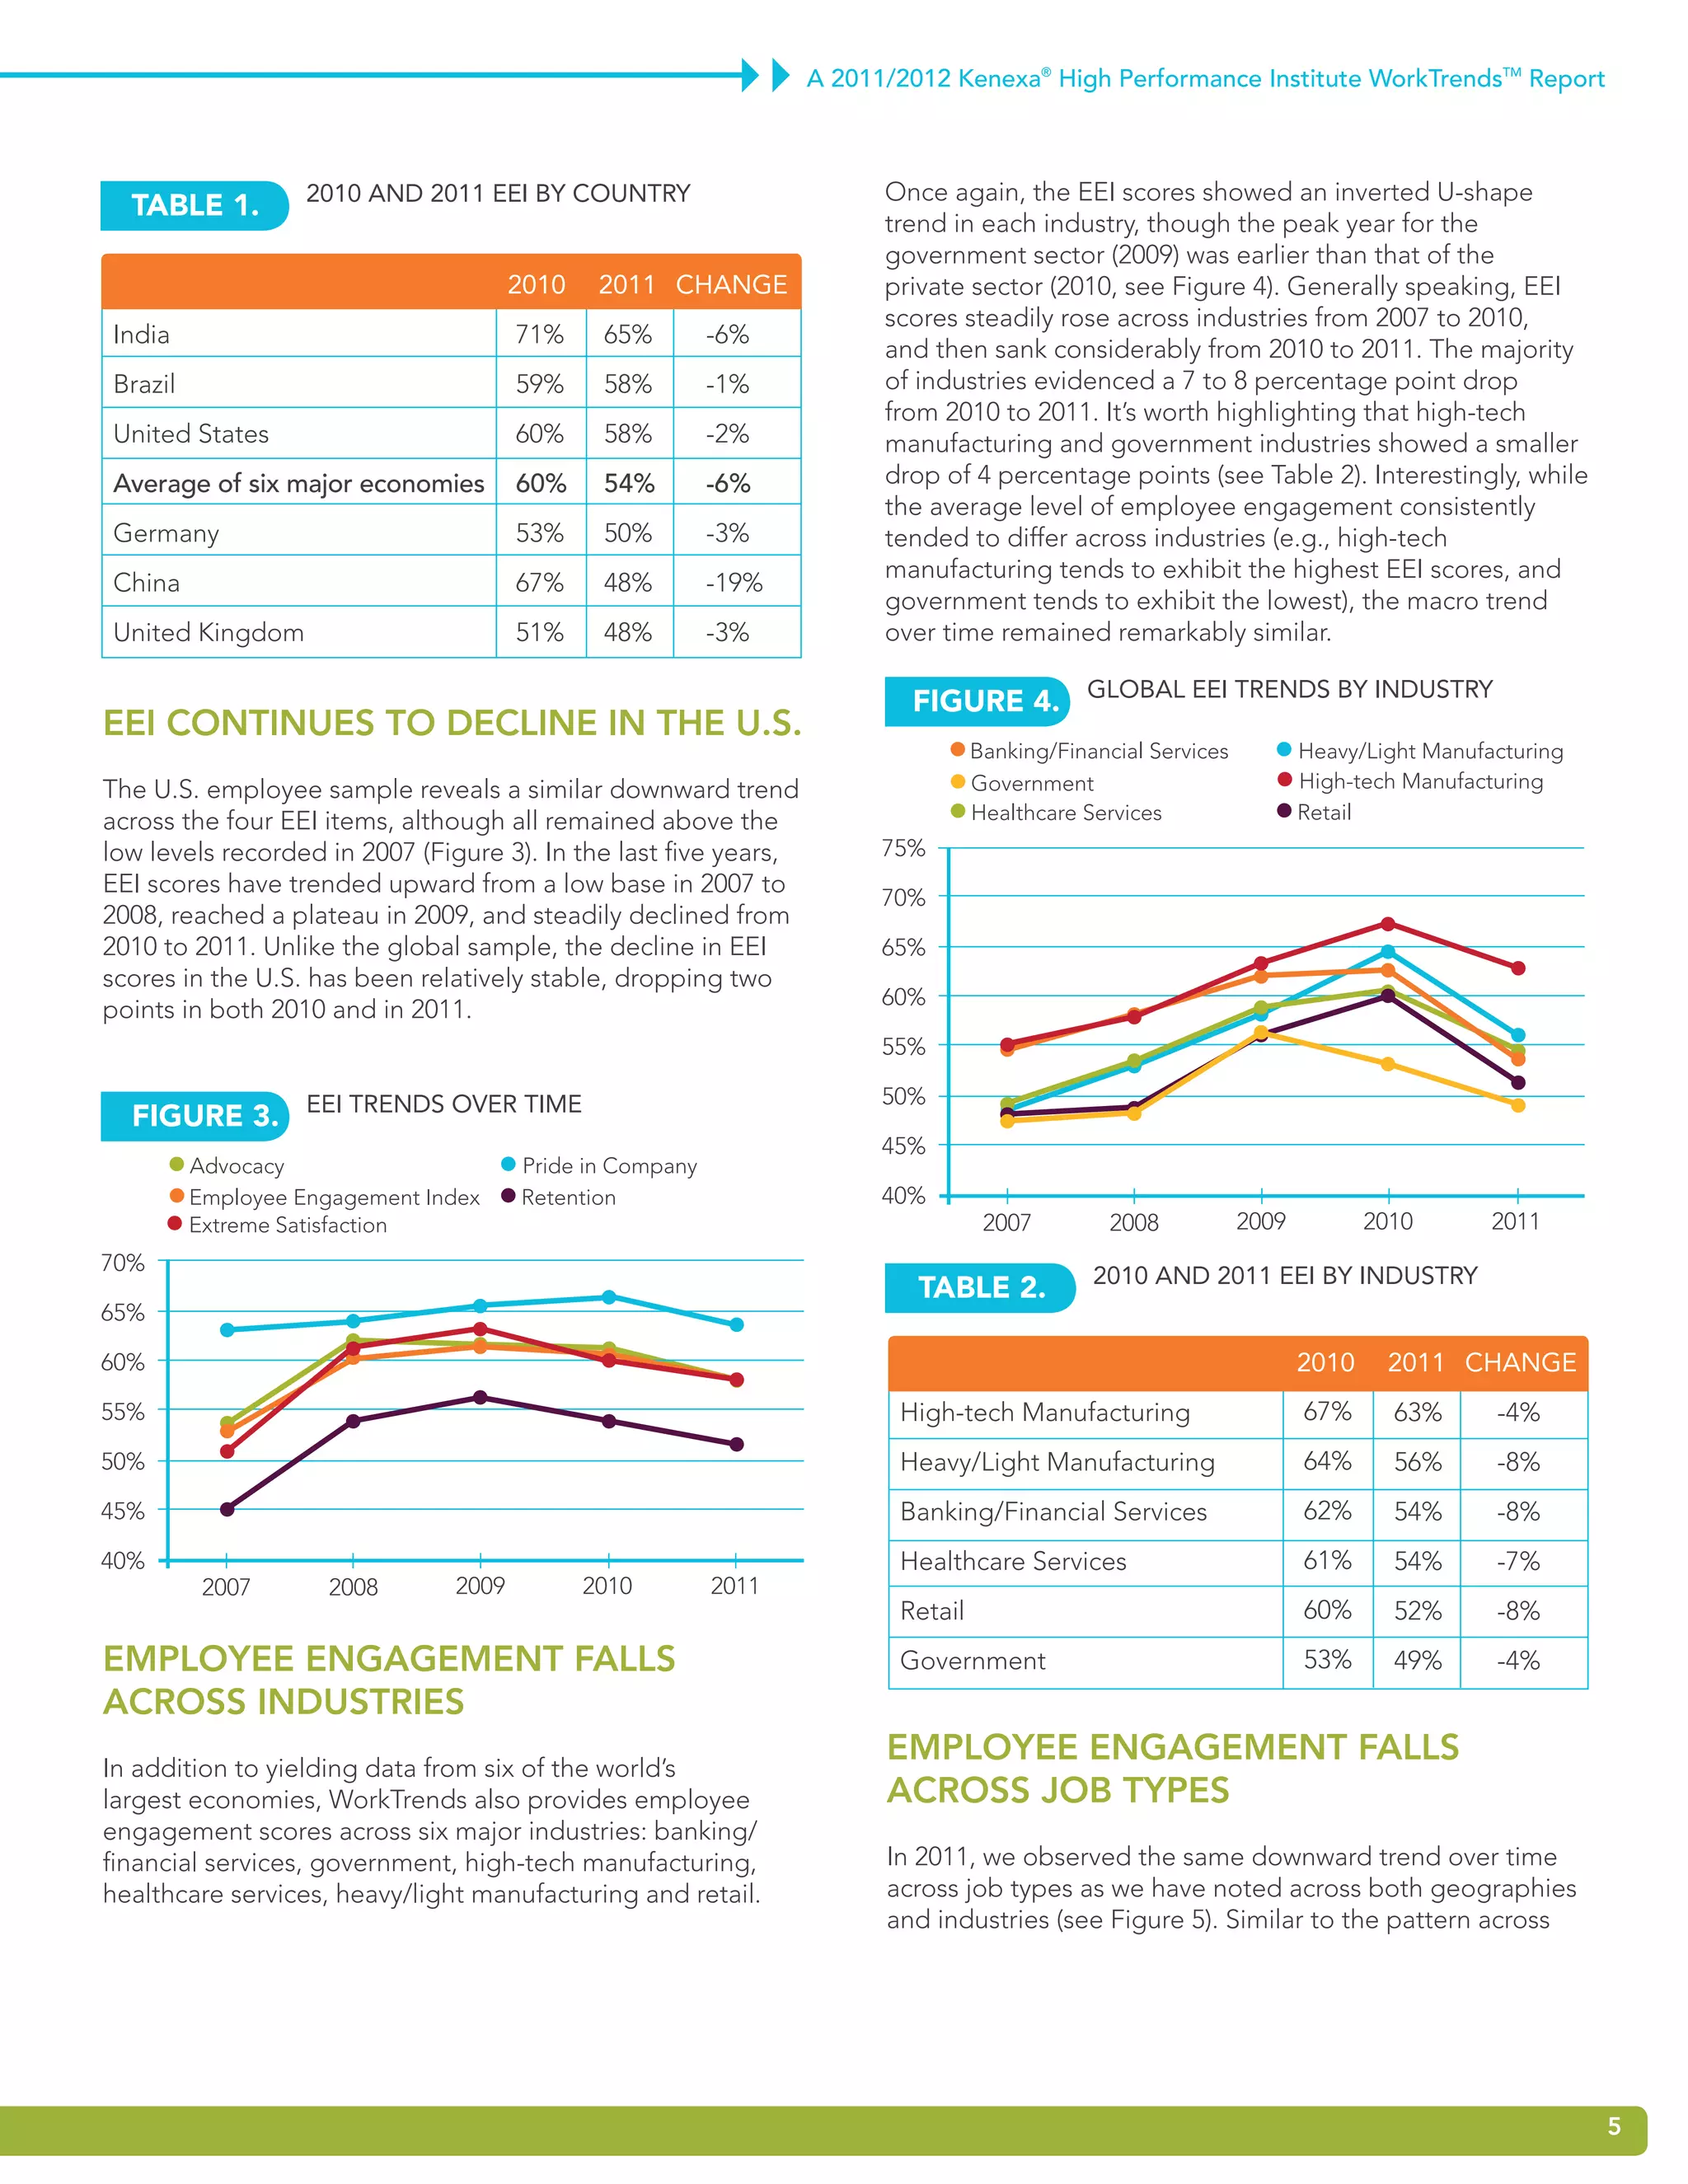
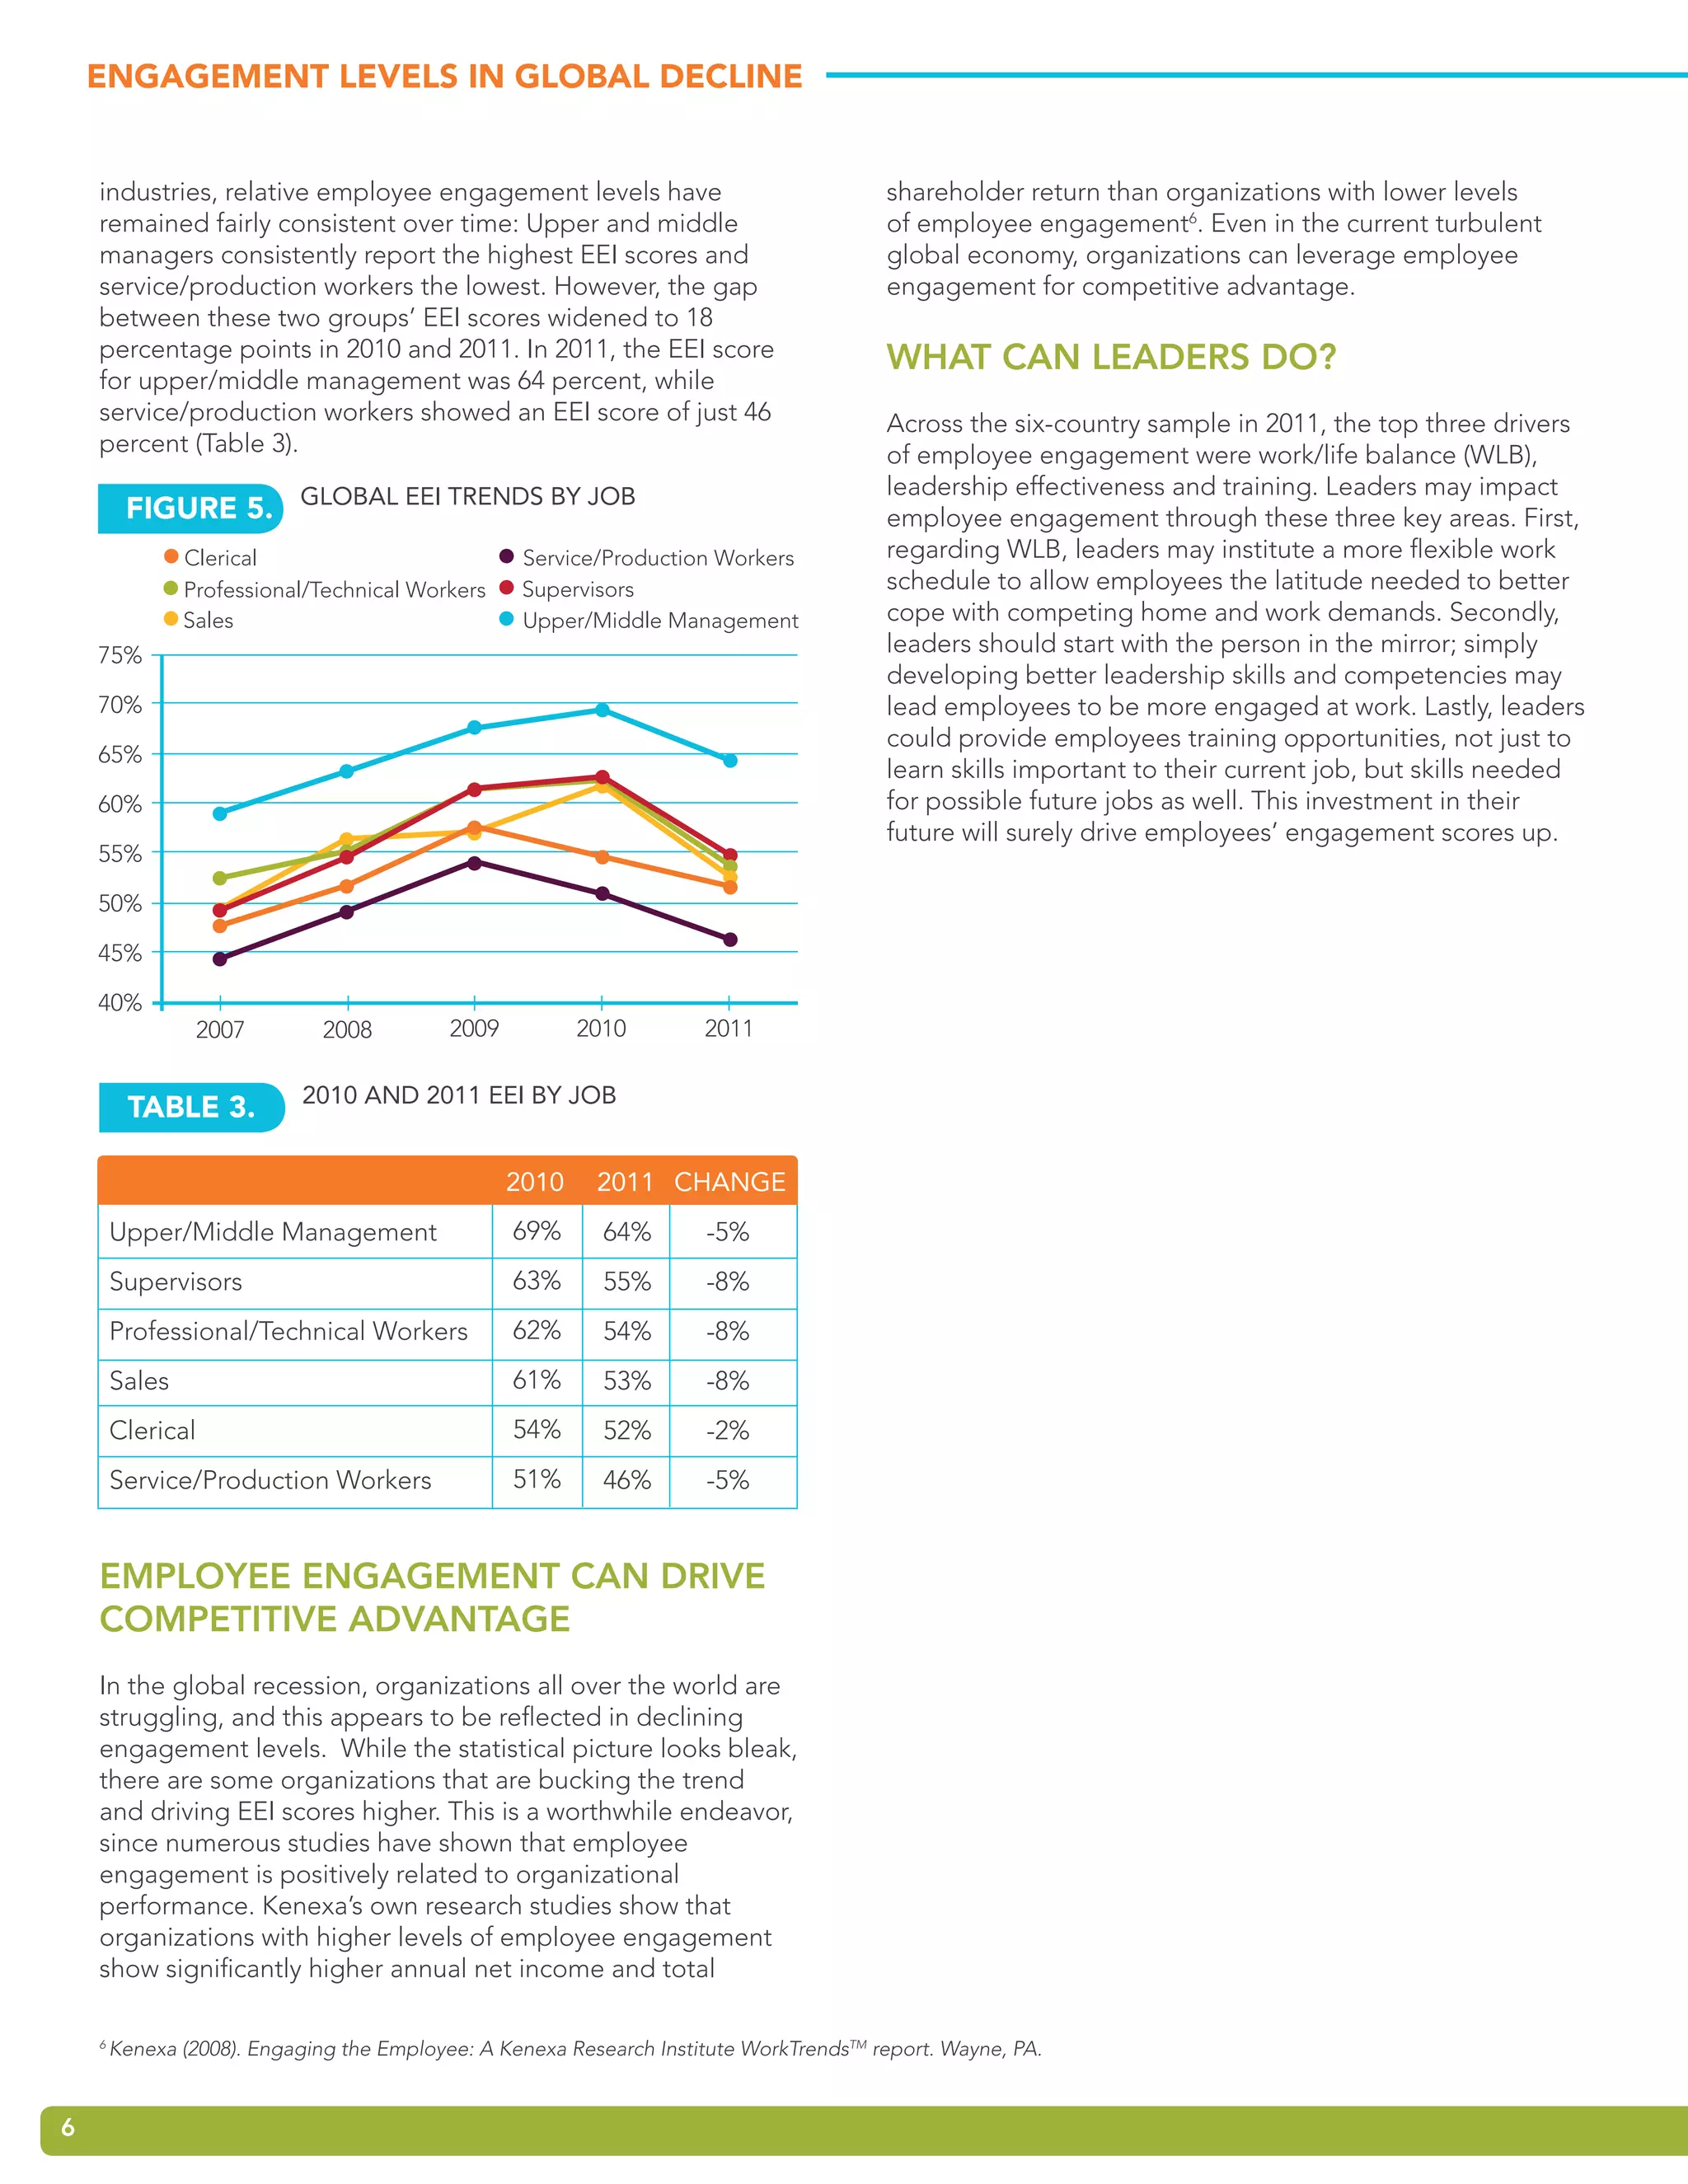
EngagEmEnt LEvELs
in gLobaL DEcLinE:
OrganizatiOns LOsing a COmpetitive advantage

           R FOR M
      PE
                 A
 H


                     NC
HIG


                          A 2011/2012 KENEXA® HIGH PERFORMANCE INSTITUTE WORKTRENDS™ REPORT
                     E


      IN
           STITUTE
ENGAGEMENT LEVELS IN GLOBAL DECLINE


          ExEcutivE Summary
     This report provides insight into 2011 employee engagement levels across
     countries, job types and industries, and examines trends in employee
     engagement over the last five years. Understanding employee engagement
     and motivation is critically important because it is clearly linked to a wide
     range of outcomes including job performance, customer satisfaction1 and,
     ultimately, organizational performance2.

     2011 was a year of declining levels of employee engagement. While some
     declines were noted in 2010, the pace and spread of decline heightened
     in 2011. The phenomenon of declining employee engagement was not
     limited in geographic scope, job type, or even industry. In 2011, employee
     engagement levels declined in all six major economies examined in this
     report. The most dramatic decline appeared in China, which in just one
     year moved from second to fifth place in country rankings.

     No industry was spared when it came to dropping engagement levels
     in 2011, although high-tech manufacturing and government workers
     showed relatively modest declines compared to retail, finance and
     manufacturing. Likewise, when it came to specific job types and
     employee engagement levels, every position from clerical to senior
     management reported declining levels.

     While engagement levels were generally declining, some individual
     companies saw their rates rise. These companies stand to gain
     considerable advantage as research strongly correlates high
     engagement with improved organizational performance. Specifically,
     organizations with high employee engagement levels outperform
     the low-engagement counterparts in several key areas including
     total shareholder return and higher annual net income.

     Finally, the report considers some actions that senior leaders can
     take to affect engagement levels and reap the rewards that come
     with it.
                                                                                                                                   R FOR M
                                                                                                                              PE
                                                                                                                                         A
                                                                                                                         H


                                                                                                                                             NC
                                                                                                                        HIG


                                                                                                                                             E


     1
       Salanova, M., Agut, S., & Peiró, J. M. (2005). Linking Organizational Resources and Work Engagement                    IN
                                                                                                                                   STITUTE
     to Employee Performance and Customer Loyalty: The Mediation of Service Climate. Journal of Applied
     Psychology, 90(6), 1217-1227.
                                                                                                                  Copyright Kenexa® High
     2
       Harter, J. K., Schmidt, F. L., & Hayes, T. L. (2002). Business-unit-level relationship between employee
                                                                                                                 Performance Institute, 2011
     satisfaction, employee engagement, and business outcomes: A meta-analysis. Journal of Applied
     Psychology, 87(2), 268-279.

2
A 2011/2012 Kenexa® High Performance Institute WorkTrendsTM Report


   about WorktrEndS™ data
The 2011 WorkTrends survey provided the insights used in this
report. More than 31,000 workers from 28 countries completed
online questionnaires about workplace issues such as managerial
and leadership effectiveness, senior management behavior, diversity
practices, turnover intentions and job satisfaction.

More detail about WorkTrends can be found at the end of this report.


                                                                                           3
ENGAGEMENT LEVELS IN GLOBAL DECLINE


    mEaSuring EmployEE EngagEmEnt                                                              FIGurE 2. EEI TrEnds by CounTry
    In order to measure employee engagement, it is important                                          Brazil       Germany          India                 United States
    to define it. For the purposes of our research and this paper,                                    China        Global           United Kingdom
    engagement is defined as:
                                                                                            75%

        “The extent to which employees are motivated to                                     70%
        contribute to organizational success, and are willing
                                                                                            65%
        to apply discretionary effort to accomplishing tasks
        important to the achievement of organizational goals.”                              60%

                                                                                            55%
    To help organizations use employee engagement to drive
    organizational performance, Kenexa® created the Employee                                50%
    Engagement Index (EEI). In the EEI, employee engagement
    is measured by asking employees how closely they agree                                  45%
    with the following four items:                                                          40%
                                                                                                       2007          2008          2009           2010          2011
        • I am proud to tell people I work for my organization
        • Overall, I am extremely satisfied with my organization                            EEI scores declined, not only in the aggregate of these
          as a place to work                                                                economies, but in each individual country as well.
        • I would gladly refer a good friend or family member to                            The pattern of scores over time is fairly consistent (Figure 2),
          my organization for employment                                                    with all six countries exhibiting an inverted U-shape trend
        • I rarely think about looking for a new job with                                   from 2007 to 2011, reflecting gains followed by a drop. Five
          another organization                                                              of the countries peaked in 2009, with China being the lone
                                                                                            exception, having peaked a year later in 2010.
    2011 EEi ScorES Fall in major                                                           For its part, China also experienced the most drastic
    global EconomiES                                                                        decrease of EEI in 2011 with 19 percentage points. This drop
                                                                                            followed an equally dramatic 21-point increase between
    In 2011, declines for each individual EEI item, as well as                              2007 to 2010 from 46 percent to 67 percent. What’s behind
    the collective EEI score (Figure 1), were seen across the six                           the dramatic swings in China’s EEI? One explanation may be
    major economies that account for almost 50 percent of the                               related to the radical change of the Chinese economy, which
    world’s gross domestic product: Brazil, China, Germany,                                 has developed rapidly over the last 30 years to become
    India, the United Kingdom and the United States. Between                                the second largest economy in the world. During the
    2007 and 2009, EEI scores actually increased before                                     economic boom, organizational management practices and
    flattening out in 2010 and then declining in 2011. The most                             employee well-being—the important drivers of employee
    significant decline concerned retention. Since 2010, the                                engagement3 —improved substantially4. The increase in
    percentage of employees who are most likely to stay and                                 EEI levels up to 2010 are likely a reflection of these efforts.
    who rarely think about looking for another job dropped                                  However, while the Chinese economy continues to grow
    nine points.                                                                            this year at a rate of more than 9 percent, that figure reflects
                                                                                            a slowdown compared to previous years. Inflation and
        FIGurE 1. Global EEI TrEnds
                  ovEr TImE                                                                 consumer prices are also on the rise and these factors may
              Advocacy                              Pride in Company                        make individuals feel less certain about their future. This
              Employee Engagement Index             Retention                               uncertainly is likely to have resulted in the sharp falls in the
              Extreme Satisfaction                                                          EEI witnessed in the 2011 WorkTrends survey5.
    70%
                                                                                            Among the other six leading economies, India evidenced
    65%                                                                                     the highest EEI score at 65 percent. The U.S. and Brazil
    60%                                                                                     fell to 58 percent (Table 1), while average EEI score across
                                                                                            the six countries stood at 54 percent. Along with China,
    55%                                                                                     the United Kingdom and Germany fell below this global
                                                                                            average.
    50%

    45%

    40%
               2007          2008          2009           2010          2011
    3
      Lockwood, N. R. (2007). Leveraging employee engagement for competitive advantage: HR’s strategic role. SHRM Research Quarterly.
    4
      Zhu, C., Cooper, B., De Cieri, H. & Dowling, P. J. (2005). A problematic transition to a strategic role: human resource management in industrial enterprises in
    China. The International Journal of Human Resources Management. 16, 513-531.
    5
      Cartwright, S. & Holmes, N. (2006). The meaning of work: The challenge of regaining employee engagement and reducing cynicism. Human Resource
    Management Review, 16, 199-208.

4
A 2011/2012 Kenexa® High Performance Institute WorkTrendsTM Report


                   2010 and 2011 EEI by CounTry                         Once again, the EEI scores showed an inverted U-shape
  TABLE 1.
                                                                        trend in each industry, though the peak year for the
                                                                        government sector (2009) was earlier than that of the
                                      2010    2011 ChanGE               private sector (2010, see Figure 4). Generally speaking, EEI
                                                                        scores steadily rose across industries from 2007 to 2010,
India                                 71%     65%        -6%
                                                                        and then sank considerably from 2010 to 2011. The majority
Brazil                                59%     58%        -1%            of industries evidenced a 7 to 8 percentage point drop
                                                                        from 2010 to 2011. It’s worth highlighting that high-tech
United States                         60%     58%        -2%            manufacturing and government industries showed a smaller
Average of six major economies        60%     54%        -6%            drop of 4 percentage points (see Table 2). Interestingly, while
                                                                        the average level of employee engagement consistently
Germany                               53%     50%        -3%            tended to differ across industries (e.g., high-tech
                                                                        manufacturing tends to exhibit the highest EEI scores, and
China                                 67%     48%        -19%
                                                                        government tends to exhibit the lowest), the macro trend
United Kingdom                        51%     48%        -3%            over time remained remarkably similar.

                                                                          FIGurE 4. Global EEI TrEnds by IndusTry
EEi continuES to dEclinE in thE u.S.
                                                                                  Banking/Financial Services          Heavy/Light Manufacturing
The U.S. employee sample reveals a similar downward trend                         Government                          High-tech Manufacturing
across the four EEI items, although all remained above the                        Healthcare Services                 Retail
low levels recorded in 2007 (Figure 3). In the last five years,         75%
EEI scores have trended upward from a low base in 2007 to
                                                                        70%
2008, reached a plateau in 2009, and steadily declined from
2010 to 2011. Unlike the global sample, the decline in EEI              65%
scores in the U.S. has been relatively stable, dropping two
                                                                        60%
points in both 2010 and in 2011.
                                                                        55%

                                                                        50%
  FIGurE 3. EEI TrEnds ovEr TImE
                                                                        45%
         Advocacy                     Pride in Company
         Employee Engagement Index    Retention                         40%
         Extreme Satisfaction                                                      2007         2008           2009          2010       2011
70%
                                                                                              2010 and 2011 EEI by IndusTry
                                                                           TABLE 2.
65%

60%                                                                                                                   2010    2011 ChanGE
55%                                                                      High-tech Manufacturing                      67%      63%      -4%
50%                                                                      Heavy/Light Manufacturing                    64%      56%      -8%
45%                                                                      Banking/Financial Services                   62%      54%      -8%
40%                                                                      Healthcare Services                          61%      54%      -7%
          2007       2008      2009          2010        2011
                                                                         Retail                                       60%      52%      -8%
EmployEE EngagEmEnt FallS                                                Government                                   53%      49%      -4%
acroSS induStriES
In addition to yielding data from six of the world’s
                                                                        EmployEE EngagEmEnt FallS
largest economies, WorkTrends also provides employee                    acroSS job typES
engagement scores across six major industries: banking/
financial services, government, high-tech manufacturing,                In 2011, we observed the same downward trend over time
healthcare services, heavy/light manufacturing and retail.              across job types as we have noted across both geographies
                                                                        and industries (see Figure 5). Similar to the pattern across


                                                                                                                                                  5
ENGAGEMENT LEVELS IN GLOBAL DECLINE


    industries, relative employee engagement levels have                                shareholder return than organizations with lower levels
    remained fairly consistent over time: Upper and middle                              of employee engagement6. Even in the current turbulent
    managers consistently report the highest EEI scores and                             global economy, organizations can leverage employee
    service/production workers the lowest. However, the gap                             engagement for competitive advantage.
    between these two groups’ EEI scores widened to 18
    percentage points in 2010 and 2011. In 2011, the EEI score                          What can lEadErS do?
    for upper/middle management was 64 percent, while
    service/production workers showed an EEI score of just 46                           Across the six-country sample in 2011, the top three drivers
    percent (Table 3).                                                                  of employee engagement were work/life balance (WLB),
                                                                                        leadership effectiveness and training. Leaders may impact
         FIGurE 5. Global EEI TrEnds by job                                             employee engagement through these three key areas. First,
                Clerical                           Service/Production Workers           regarding WLB, leaders may institute a more flexible work
                Professional/Technical Workers     Supervisors                          schedule to allow employees the latitude needed to better
                Sales                              Upper/Middle Management              cope with competing home and work demands. Secondly,
    75%                                                                                 leaders should start with the person in the mirror; simply
                                                                                        developing better leadership skills and competencies may
    70%                                                                                 lead employees to be more engaged at work. Lastly, leaders
                                                                                        could provide employees training opportunities, not just to
    65%
                                                                                        learn skills important to their current job, but skills needed
    60%                                                                                 for possible future jobs as well. This investment in their
                                                                                        future will surely drive employees’ engagement scores up.
    55%

    50%

    45%

    40%
                 2007         2008         2009          2010        2011

                            2010 and 2011 EEI by job
         TABLE 3.

                                                  2010    2011 ChanGE
        Upper/Middle Management                   69%      64%        -5%
        Supervisors                               63%      55%        -8%
        Professional/Technical Workers            62%      54%        -8%
        Sales                                     61%      53%        -8%
        Clerical                                  54%      52%        -2%
        Service/Production Workers                51%      46%        -5%


    EmployEE EngagEmEnt can drivE
    compEtitivE advantagE
    In the global recession, organizations all over the world are
    struggling, and this appears to be reflected in declining
    engagement levels. While the statistical picture looks bleak,
    there are some organizations that are bucking the trend
    and driving EEI scores higher. This is a worthwhile endeavor,
    since numerous studies have shown that employee
    engagement is positively related to organizational
    performance. Kenexa’s own research studies show that
    organizations with higher levels of employee engagement
    show significantly higher annual net income and total

    6
        Kenexa (2008). Engaging the Employee: A Kenexa Research Institute WorkTrendsTM report. Wayne, PA.


6
A 2011/2012 Kenexa® High Performance Institute WorkTrendsTM Report


about thE WorktrEndS SurvEy

The WorkTrends survey, administered annually or bi-annually since 1985, is the data collection machine that serves
two purposes: To fuel research efforts within the Kenexa High Performance Institute (KHPI) and to populate one
of the normative databases for Kenexa’s client use.

In 2011, the WorkTrends survey was taken online by approximately 10,000 individuals in the U.S., and about
1,000 individuals in each of the following countries: Argentina, Australia, Brazil, Canada, China, Denmark,
Finland, France, Germany, India, Italy, Japan, Mexico, The Netherlands, Russia, South Africa, Spain, Sweden,
Switzerland, Turkey and the United Kingdom. Samples of around 400 employees were collected from
Indonesia and Korea. For these countries, and as the general rule, employees who work full-time at an
organization larger than 100 staff members were allowed to take the survey. Three countries from the
Gulf Co-op Council (GCC) countries of the Middle East were also surveyed, though to a lesser extent
due to surveying limitations in that region of the world. The GCC countries include the Kingdom
of Saudi Arabia (KSA), United Arab Emirates (UAE) and Qatar. In the GCC Region, the criterion for
inclusion was dropped to full time workers in organizations that employ more than 25 employees to
maximize sample size.

The survey has 141 items that ask employees about workplace issues, such as managerial
effectiveness, senior management behavior, diversity practices, turnover intention and
job satisfaction. Of the questions asked, 21 are about organizational and job structures,
and organizational phenomena, such as the incidence of lay-offs or off-shoring. Thirty
demographic questions are also asked, including questions about gender, age, job type,
industry and organizational size.

The WorkTrends items allow Kenexa clients to compare their own survey responses
to those of a larger, representative population. WorkTrends norms are unique in the
survey industry in that they are truly normative data—they are not derived from other
clients, but from a random sample of the working population. In addition, questions
identifying high performing organizations have been embedded, allowing clients
to compare themselves to those who excel. Clients can also choose to compare
themselves with others in their same industry.

Using the WorkTrends database, the Kenexa High Performance Institute is able
to provide customized research reports on the issue of trust and many other
employee-related matters for selected geographies, job types, industries,
demographics and much more.

For more information about WorkTrends and the Kenexa High Performance
Institute, please visit www.khpi.com.

To find out more about Kenexa’s products and services, please email
contactus@kenexa.com or visit www.kenexa.com.


                                                                                                                             7
Engagement Levels in Global Decline - A Report by Kenexa

Engagement Levels in Global Decline - A Report by Kenexa

  • 1.
    EngagEmEnt LEvELs in gLobaLDEcLinE: OrganizatiOns LOsing a COmpetitive advantage R FOR M PE A H NC HIG A 2011/2012 KENEXA® HIGH PERFORMANCE INSTITUTE WORKTRENDS™ REPORT E IN STITUTE
  • 2.
    ENGAGEMENT LEVELS INGLOBAL DECLINE ExEcutivE Summary This report provides insight into 2011 employee engagement levels across countries, job types and industries, and examines trends in employee engagement over the last five years. Understanding employee engagement and motivation is critically important because it is clearly linked to a wide range of outcomes including job performance, customer satisfaction1 and, ultimately, organizational performance2. 2011 was a year of declining levels of employee engagement. While some declines were noted in 2010, the pace and spread of decline heightened in 2011. The phenomenon of declining employee engagement was not limited in geographic scope, job type, or even industry. In 2011, employee engagement levels declined in all six major economies examined in this report. The most dramatic decline appeared in China, which in just one year moved from second to fifth place in country rankings. No industry was spared when it came to dropping engagement levels in 2011, although high-tech manufacturing and government workers showed relatively modest declines compared to retail, finance and manufacturing. Likewise, when it came to specific job types and employee engagement levels, every position from clerical to senior management reported declining levels. While engagement levels were generally declining, some individual companies saw their rates rise. These companies stand to gain considerable advantage as research strongly correlates high engagement with improved organizational performance. Specifically, organizations with high employee engagement levels outperform the low-engagement counterparts in several key areas including total shareholder return and higher annual net income. Finally, the report considers some actions that senior leaders can take to affect engagement levels and reap the rewards that come with it. R FOR M PE A H NC HIG E 1 Salanova, M., Agut, S., & Peiró, J. M. (2005). Linking Organizational Resources and Work Engagement IN STITUTE to Employee Performance and Customer Loyalty: The Mediation of Service Climate. Journal of Applied Psychology, 90(6), 1217-1227. Copyright Kenexa® High 2 Harter, J. K., Schmidt, F. L., & Hayes, T. L. (2002). Business-unit-level relationship between employee Performance Institute, 2011 satisfaction, employee engagement, and business outcomes: A meta-analysis. Journal of Applied Psychology, 87(2), 268-279. 2
  • 3.
    A 2011/2012 Kenexa®High Performance Institute WorkTrendsTM Report about WorktrEndS™ data The 2011 WorkTrends survey provided the insights used in this report. More than 31,000 workers from 28 countries completed online questionnaires about workplace issues such as managerial and leadership effectiveness, senior management behavior, diversity practices, turnover intentions and job satisfaction. More detail about WorkTrends can be found at the end of this report. 3
  • 4.
    ENGAGEMENT LEVELS INGLOBAL DECLINE mEaSuring EmployEE EngagEmEnt FIGurE 2. EEI TrEnds by CounTry In order to measure employee engagement, it is important Brazil Germany India United States to define it. For the purposes of our research and this paper, China Global United Kingdom engagement is defined as: 75% “The extent to which employees are motivated to 70% contribute to organizational success, and are willing 65% to apply discretionary effort to accomplishing tasks important to the achievement of organizational goals.” 60% 55% To help organizations use employee engagement to drive organizational performance, Kenexa® created the Employee 50% Engagement Index (EEI). In the EEI, employee engagement is measured by asking employees how closely they agree 45% with the following four items: 40% 2007 2008 2009 2010 2011 • I am proud to tell people I work for my organization • Overall, I am extremely satisfied with my organization EEI scores declined, not only in the aggregate of these as a place to work economies, but in each individual country as well. • I would gladly refer a good friend or family member to The pattern of scores over time is fairly consistent (Figure 2), my organization for employment with all six countries exhibiting an inverted U-shape trend • I rarely think about looking for a new job with from 2007 to 2011, reflecting gains followed by a drop. Five another organization of the countries peaked in 2009, with China being the lone exception, having peaked a year later in 2010. 2011 EEi ScorES Fall in major For its part, China also experienced the most drastic global EconomiES decrease of EEI in 2011 with 19 percentage points. This drop followed an equally dramatic 21-point increase between In 2011, declines for each individual EEI item, as well as 2007 to 2010 from 46 percent to 67 percent. What’s behind the collective EEI score (Figure 1), were seen across the six the dramatic swings in China’s EEI? One explanation may be major economies that account for almost 50 percent of the related to the radical change of the Chinese economy, which world’s gross domestic product: Brazil, China, Germany, has developed rapidly over the last 30 years to become India, the United Kingdom and the United States. Between the second largest economy in the world. During the 2007 and 2009, EEI scores actually increased before economic boom, organizational management practices and flattening out in 2010 and then declining in 2011. The most employee well-being—the important drivers of employee significant decline concerned retention. Since 2010, the engagement3 —improved substantially4. The increase in percentage of employees who are most likely to stay and EEI levels up to 2010 are likely a reflection of these efforts. who rarely think about looking for another job dropped However, while the Chinese economy continues to grow nine points. this year at a rate of more than 9 percent, that figure reflects a slowdown compared to previous years. Inflation and FIGurE 1. Global EEI TrEnds ovEr TImE consumer prices are also on the rise and these factors may Advocacy Pride in Company make individuals feel less certain about their future. This Employee Engagement Index Retention uncertainly is likely to have resulted in the sharp falls in the Extreme Satisfaction EEI witnessed in the 2011 WorkTrends survey5. 70% Among the other six leading economies, India evidenced 65% the highest EEI score at 65 percent. The U.S. and Brazil 60% fell to 58 percent (Table 1), while average EEI score across the six countries stood at 54 percent. Along with China, 55% the United Kingdom and Germany fell below this global average. 50% 45% 40% 2007 2008 2009 2010 2011 3 Lockwood, N. R. (2007). Leveraging employee engagement for competitive advantage: HR’s strategic role. SHRM Research Quarterly. 4 Zhu, C., Cooper, B., De Cieri, H. & Dowling, P. J. (2005). A problematic transition to a strategic role: human resource management in industrial enterprises in China. The International Journal of Human Resources Management. 16, 513-531. 5 Cartwright, S. & Holmes, N. (2006). The meaning of work: The challenge of regaining employee engagement and reducing cynicism. Human Resource Management Review, 16, 199-208. 4
  • 5.
    A 2011/2012 Kenexa®High Performance Institute WorkTrendsTM Report 2010 and 2011 EEI by CounTry Once again, the EEI scores showed an inverted U-shape TABLE 1. trend in each industry, though the peak year for the government sector (2009) was earlier than that of the 2010 2011 ChanGE private sector (2010, see Figure 4). Generally speaking, EEI scores steadily rose across industries from 2007 to 2010, India 71% 65% -6% and then sank considerably from 2010 to 2011. The majority Brazil 59% 58% -1% of industries evidenced a 7 to 8 percentage point drop from 2010 to 2011. It’s worth highlighting that high-tech United States 60% 58% -2% manufacturing and government industries showed a smaller Average of six major economies 60% 54% -6% drop of 4 percentage points (see Table 2). Interestingly, while the average level of employee engagement consistently Germany 53% 50% -3% tended to differ across industries (e.g., high-tech manufacturing tends to exhibit the highest EEI scores, and China 67% 48% -19% government tends to exhibit the lowest), the macro trend United Kingdom 51% 48% -3% over time remained remarkably similar. FIGurE 4. Global EEI TrEnds by IndusTry EEi continuES to dEclinE in thE u.S. Banking/Financial Services Heavy/Light Manufacturing The U.S. employee sample reveals a similar downward trend Government High-tech Manufacturing across the four EEI items, although all remained above the Healthcare Services Retail low levels recorded in 2007 (Figure 3). In the last five years, 75% EEI scores have trended upward from a low base in 2007 to 70% 2008, reached a plateau in 2009, and steadily declined from 2010 to 2011. Unlike the global sample, the decline in EEI 65% scores in the U.S. has been relatively stable, dropping two 60% points in both 2010 and in 2011. 55% 50% FIGurE 3. EEI TrEnds ovEr TImE 45% Advocacy Pride in Company Employee Engagement Index Retention 40% Extreme Satisfaction 2007 2008 2009 2010 2011 70% 2010 and 2011 EEI by IndusTry TABLE 2. 65% 60% 2010 2011 ChanGE 55% High-tech Manufacturing 67% 63% -4% 50% Heavy/Light Manufacturing 64% 56% -8% 45% Banking/Financial Services 62% 54% -8% 40% Healthcare Services 61% 54% -7% 2007 2008 2009 2010 2011 Retail 60% 52% -8% EmployEE EngagEmEnt FallS Government 53% 49% -4% acroSS induStriES In addition to yielding data from six of the world’s EmployEE EngagEmEnt FallS largest economies, WorkTrends also provides employee acroSS job typES engagement scores across six major industries: banking/ financial services, government, high-tech manufacturing, In 2011, we observed the same downward trend over time healthcare services, heavy/light manufacturing and retail. across job types as we have noted across both geographies and industries (see Figure 5). Similar to the pattern across 5
  • 6.
    ENGAGEMENT LEVELS INGLOBAL DECLINE industries, relative employee engagement levels have shareholder return than organizations with lower levels remained fairly consistent over time: Upper and middle of employee engagement6. Even in the current turbulent managers consistently report the highest EEI scores and global economy, organizations can leverage employee service/production workers the lowest. However, the gap engagement for competitive advantage. between these two groups’ EEI scores widened to 18 percentage points in 2010 and 2011. In 2011, the EEI score What can lEadErS do? for upper/middle management was 64 percent, while service/production workers showed an EEI score of just 46 Across the six-country sample in 2011, the top three drivers percent (Table 3). of employee engagement were work/life balance (WLB), leadership effectiveness and training. Leaders may impact FIGurE 5. Global EEI TrEnds by job employee engagement through these three key areas. First, Clerical Service/Production Workers regarding WLB, leaders may institute a more flexible work Professional/Technical Workers Supervisors schedule to allow employees the latitude needed to better Sales Upper/Middle Management cope with competing home and work demands. Secondly, 75% leaders should start with the person in the mirror; simply developing better leadership skills and competencies may 70% lead employees to be more engaged at work. Lastly, leaders could provide employees training opportunities, not just to 65% learn skills important to their current job, but skills needed 60% for possible future jobs as well. This investment in their future will surely drive employees’ engagement scores up. 55% 50% 45% 40% 2007 2008 2009 2010 2011 2010 and 2011 EEI by job TABLE 3. 2010 2011 ChanGE Upper/Middle Management 69% 64% -5% Supervisors 63% 55% -8% Professional/Technical Workers 62% 54% -8% Sales 61% 53% -8% Clerical 54% 52% -2% Service/Production Workers 51% 46% -5% EmployEE EngagEmEnt can drivE compEtitivE advantagE In the global recession, organizations all over the world are struggling, and this appears to be reflected in declining engagement levels. While the statistical picture looks bleak, there are some organizations that are bucking the trend and driving EEI scores higher. This is a worthwhile endeavor, since numerous studies have shown that employee engagement is positively related to organizational performance. Kenexa’s own research studies show that organizations with higher levels of employee engagement show significantly higher annual net income and total 6 Kenexa (2008). Engaging the Employee: A Kenexa Research Institute WorkTrendsTM report. Wayne, PA. 6
  • 7.
    A 2011/2012 Kenexa®High Performance Institute WorkTrendsTM Report about thE WorktrEndS SurvEy The WorkTrends survey, administered annually or bi-annually since 1985, is the data collection machine that serves two purposes: To fuel research efforts within the Kenexa High Performance Institute (KHPI) and to populate one of the normative databases for Kenexa’s client use. In 2011, the WorkTrends survey was taken online by approximately 10,000 individuals in the U.S., and about 1,000 individuals in each of the following countries: Argentina, Australia, Brazil, Canada, China, Denmark, Finland, France, Germany, India, Italy, Japan, Mexico, The Netherlands, Russia, South Africa, Spain, Sweden, Switzerland, Turkey and the United Kingdom. Samples of around 400 employees were collected from Indonesia and Korea. For these countries, and as the general rule, employees who work full-time at an organization larger than 100 staff members were allowed to take the survey. Three countries from the Gulf Co-op Council (GCC) countries of the Middle East were also surveyed, though to a lesser extent due to surveying limitations in that region of the world. The GCC countries include the Kingdom of Saudi Arabia (KSA), United Arab Emirates (UAE) and Qatar. In the GCC Region, the criterion for inclusion was dropped to full time workers in organizations that employ more than 25 employees to maximize sample size. The survey has 141 items that ask employees about workplace issues, such as managerial effectiveness, senior management behavior, diversity practices, turnover intention and job satisfaction. Of the questions asked, 21 are about organizational and job structures, and organizational phenomena, such as the incidence of lay-offs or off-shoring. Thirty demographic questions are also asked, including questions about gender, age, job type, industry and organizational size. The WorkTrends items allow Kenexa clients to compare their own survey responses to those of a larger, representative population. WorkTrends norms are unique in the survey industry in that they are truly normative data—they are not derived from other clients, but from a random sample of the working population. In addition, questions identifying high performing organizations have been embedded, allowing clients to compare themselves to those who excel. Clients can also choose to compare themselves with others in their same industry. Using the WorkTrends database, the Kenexa High Performance Institute is able to provide customized research reports on the issue of trust and many other employee-related matters for selected geographies, job types, industries, demographics and much more. For more information about WorkTrends and the Kenexa High Performance Institute, please visit www.khpi.com. To find out more about Kenexa’s products and services, please email contactus@kenexa.com or visit www.kenexa.com. 7