Workshop - Best of Both Worlds_ Combine KG and Vector search for enhanced R...
8078
1. September 13, 2011
ACTION
Buy
Compal Communications (8078.TW)
Return Potential: 89% Equity Research
Increasing conviction in Nokia product cycle ramp; reiterate CL-Buy
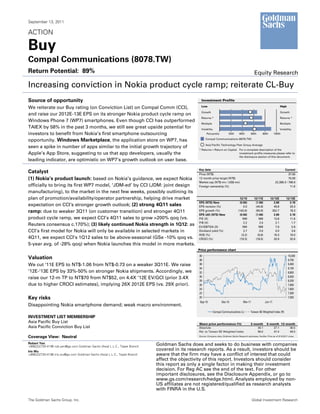
Source of opportunity Investment Profile
Low High
We reiterate our Buy rating (on Conviction List) on Compal Comm (CCI),
Growth Growth
and raise our 2012E-13E EPS on its stronger Nokia product cycle ramp on
Returns * Returns *
Windows Phone 7 (WP7) smartphones. Even though CCI has outperformed
Multiple Multiple
TAIEX by 58% in the past 3 months, we still see great upside potential for Volatility Volatility
investors to benefit from Nokia’s first smartphone outsourcing Percentile 20th 40th 60th 80th 100th
opportunity. Windows Marketplace, the application store on WP7, has Compal Communications (8078.TW)
Asia Pacific Technology Peer Group Average
seen a spike in number of apps similar to the initial growth trajectory of
* Returns = Return on Capital For a complete description of the
Apple’s App Store, suggesting to us that app developers, usually the investment profile measures please refer to
the disclosure section of this document.
leading indicator, are optimistic on WP7’s growth outlook on user base.
Key data Current
Catalyst Price (NT$) 37.00
(1) Nokia’s product launch: based on Nokia’s guidance, we expect Nokia 12 month price target (NT$) 70.00
Market cap (NT$ mn / US$ mn) 22,399.3 / 766.9
officially to bring its first WP7 model, ‘JDM-ed’ by CCI (JDM: joint design Foreign ownership (%) 11.6
manufacturing), to the market in the next few weeks, possibly outlining its
plan of promotion/availability/operator partnership, helping drive market 12/10 12/11E 12/12E 12/13E
EPS (NT$) New (0.56) (1.06) 2.69 3.18
expectation on CCI‘s stronger growth outlook; (2) strong 4Q11 sales EPS revision (%) 0.0 (44.8) 49.8 33.3
ramp: due to weaker 3Q11 (on customer transition) and stronger 4Q11 EPS growth (%) (142.6) (90.6) 352.7 18.3
EPS (dil) (NT$) New (0.56) (1.06) 2.69 3.18
product cycle ramp, we expect CCI’s 4Q11 sales to grow >200% qoq (vs. P/E (X) NM NM 13.8 11.6
P/B (X) 2.2 2.5 2.1 1.7
Reuters consensus c.170%); (3) likely continued Nokia strength in 1Q12: as EV/EBITDA (X) NM NM 7.9 5.9
CCI’s first model for Nokia will only be available in selected markets in Dividend yield (%) 2.7 0.0 0.0 3.6
ROE (%) (3.2) (6.8) 16.3 16.0
4Q11, we expect CCI’s 1Q12 sales to be above-seasonal (GSe -10% qoq vs. CROCI (%) (19.3) (18.5) 33.9 32.6
5-year avg. of -28% qoq) when Nokia launches this model in more markets.
Price performance chart
40 10,000
Valuation 38 9,700
We cut ‘11E EPS to NT$-1.06 from NT$-0.73 on a weaker 3Q11E. We raise 36 9,400
34 9,100
‘12E-‘13E EPS by 33%-50% on stronger Nokia shipments. Accordingly, we 32 8,800
raise our 12-m TP to NT$70 from NT$52, on 4.4X ‘12E EV/GCI (prior 3.4X 30 8,500
28 8,200
due to higher CROCI estimates), implying 26X 2012E EPS (vs. 29X prior). 26 7,900
24 7,600
22 7,300
Key risks 20 7,000
Sep-10 Dec-10 Mar-11 Jun-11
Disappointing Nokia smartphone demand; weak macro environment.
Compal Communications (L) Taiwan SE Weighted Index (R)
INVESTMENT LIST MEMBERSHIP
Asia Pacific Buy List Share price performance (%) 3 month 6 month 12 month
Asia Pacific Conviction Buy List Absolute 34.1 27.1 36.5
Rel. to Taiwan SE Weighted Index 58.0 47.4 49.5
Coverage View: Neutral Source: Company data, Goldman Sachs Research estimates, FactSet. Price as of 9/13/2011 close.
Robert Yen Goldman Sachs does and seeks to do business with companies
+886(2)2730-4196 rob.yen@gs.com Goldman Sachs (Asia) L.L.C., Taipei Branch
Iris Wu
covered in its research reports. As a result, investors should be
+886(2)2730-4186 iris.wu@gs.com Goldman Sachs (Asia) L.L.C., Taipei Branch aware that the firm may have a conflict of interest that could
affect the objectivity of this report. Investors should consider
this report as only a single factor in making their investment
decision. For Reg AC see the end of the text. For other
important disclosures, see the Disclosure Appendix, or go to
www.gs.com/research/hedge.html. Analysts employed by non-
US affiliates are not registered/qualified as research analysts
with FINRA in the U.S.
The Goldman Sachs Group, Inc. Global Investment Research
3. September 13, 2011 Compal Communications (8078.TW)
Exhibit 1: We see a similar growth pattern in number of apps on Microsoft’s Windows
Marketplace to Apple’s App Store, suggesting WP7’s strong growth potential
Number of apps - Apple’s App Store, Android Market, & Windows Phone Marketplace
Number of applications (k) Windows Phone Marketplace
60 iOS App Store
Android Market
55
50
40
35
Marketplace: Nokia announced
30 its partnership with Microsoft on 30
Windows Phone in Feb 2011
20 20 20
15
9 12
10
8
3
2
0
0 3 6 9 12
Launched date: Months after launch
*iOS App Store: 2007 July
*Android Market: 2008 Oct
*Windows Phone Marketplace: 2010 Nov
Source: Company data, Goldman Sachs Research.
Exhibit 2: We expect CCI’s share price to be driven by its Exhibit 3: Earnings turnaround could be a driver for share
sales momentum in 4Q11 price, in our view
CCI’s market cap vs. monthly sales CCI’s market cap vs. its quarterly EPS
US$mn
Compal Comm - share price vs monthly sales NT$mn
Compal Comm - share price vs quarterly EPS
US$mn Market cap (L) Quarterly EPS (R) NT$
Market cap (L) Monthly sales (R)
3,500 E 9,000 3,500 3.0
E
8,000 2.5
3,000 3,000
7,000
2.0
2,500 2,500
6,000
1.5
2,000 2,000
5,000
? ? 1.0
1,500 4,000 1,500
0.5
3,000
1,000 1,000
0.0
2,000
500 500 (0.5)
1,000
0 0 0 (1.0)
Jun-04 Jun-05 Jun-06 Jun-07 Jun-08 Jun-09 Jun-10 Jun-11 Jun-12 Jun-04 Jun-05 Jun-06 Jun-07 Jun-08 Jun-09 Jun-10 Jun-11 Jun-12
Source: Company data, Datastream, Goldman Sachs Research estimates. Source: Company data, Datastream, Goldman Sachs Research estimates.
Goldman Sachs Global Investment Research 3
4. September 13, 2011 Compal Communications (8078.TW)
Exhibit 4: We raise our 2012-13E EPS on higher shipment and ASP assumptions
Compal Communications (8078.TW)
P&L (GAAP, NT$mn) 2011E New 2011E Old Diff. 2012E New 2012E Old Diff. 2013E New 2013E Old Diff.
Revenues 13,737 13,547 1% 40,218 34,408 17% 49,011 42,886 14%
Gross profits 1,481 1,520 -3% 3,970 3,482 14% 4,542 4,013 13%
Operating profits (679) (635) NM 1,540 926 66% 1,854 1,295 43%
Non-operating income 36 191 -81% 223 251 -11% 266 296 -10%
Pretax earnings (643) (444) NM 1,763 1,177 50% 2,120 1,591 33%
Net earnings (643) (444) NM 1,626 1,085 50% 1,924 1,444 33%
EPS (fully diluted, NT$) (1.06) (0.73) NM 2.69 1.79 50% 3.18 2.38 33%
Ratio analysis
Gross margin (%) 10.8% 11.2% 9.9% 10.1% 9.3% 9.4%
EBIT margin (%) (4.9%) (4.7%) 3.8% 2.7% 3.8% 3.0%
Tax & minority (as % of EBT) (0.1%) (0.1%) 7.8% 7.8% 9.2% 9.2%
Net margin (%) (4.7%) (3.3%) 4.0% 3.2% 3.9% 3.4%
Return analysis
ROA (%, annualized) (4.2%) (2.9%) 8.2% 5.8% 7.7% 6.3%
ROE (%, annualized) (6.8%) (4.6%) 16.3% 11.0% 16.0% 12.8%
Key assumption 2011E New 2011E Old Diff. 2012E New 2012E Old Diff. 2013E New 2013E Old Diff.
Shipment (k units) 3,412 3,459 -1% 10,152 9,068 12% 15,855 14,767 7%
ASP (US$) 138 134 3% 137 131 4% 107 100 6%
Source: Company data, Goldman Sachs Research estimates.
Exhibit 5: We see potential upside to CCI’s share price on Exhibit 6: An upward trending ROE implies potential
significant improvement of its cash generation (CROCI) share price upside from the current level, in our view
EV/GCI (X) Compal Comm (8078.TW) EV/GCI vs. CROCI CROCI P/B (X) Compal Comm (8078.TW) P/B vs. ROE
EV/GCI (L) Median EV/GCI (L) CROCI (R) Median CROCI (R) 10.0 Fwd P/B (L) Median P/B (L) ROE (R) Median ROE (R) 60%
70.0 600%
9.0
50%
60.0 500%
8.0
40%
50.0 400% 7.0
30%
6.0
40.0 300%
5.0 20%
30.0 200% 4.0
Median ROE: 14% 10%
3.0
20.0 Median: 71% 100% Median. P/B: 2.8X 0%
2.0
Current: 2.1X
Median: 9.1X -10%
10.0 0% 1.0
Current: 1.9X
0.0 -20%
0.0 -100%
Dec-03 Nov-04 Nov-05 Nov-06 Nov-07 Nov-08 Nov-09 Nov-10 Nov-11
Dec-03 Nov-04 Nov-05 Nov-06 Nov-07 Nov-08 Nov-09 Nov-10 Nov-11
Source: Company data, Datastream, Goldman Sachs Research estimates. Source: Company data, Datastream, Goldman Sachs Research estimates.
Goldman Sachs Global Investment Research 4
6. September 13, 2011 Compal Communications (8078.TW)
Reg AC
I, Robert Yen, hereby certify that all of the views expressed in this report accurately reflect my personal views about the subject company or
companies and its or their securities. I also certify that no part of my compensation was, is or will be, directly or indirectly, related to the specific
recommendations or views expressed in this report.
Investment Profile
The Goldman Sachs Investment Profile provides investment context for a security by comparing key attributes of that security to its peer group and
market. The four key attributes depicted are: growth, returns, multiple and volatility. Growth, returns and multiple are indexed based on composites
of several methodologies to determine the stocks percentile ranking within the region's coverage universe.
The precise calculation of each metric may vary depending on the fiscal year, industry and region but the standard approach is as follows:
Growth is a composite of next year's estimate over current year's estimate, e.g. EPS, EBITDA, Revenue. Return is a year one prospective aggregate
of various return on capital measures, e.g. CROCI, ROACE, and ROE. Multiple is a composite of one-year forward valuation ratios, e.g. P/E, dividend
yield, EV/FCF, EV/EBITDA, EV/DACF, Price/Book. Volatility is measured as trailing twelve-month volatility adjusted for dividends.
Quantum
Quantum is Goldman Sachs' proprietary database providing access to detailed financial statement histories, forecasts and ratios. It can be used for
in-depth analysis of a single company, or to make comparisons between companies in different sectors and markets.
GS SUSTAIN
GS SUSTAIN is a global investment strategy aimed at long-term, long-only performance with a low turnover of ideas. The GS SUSTAIN focus list
includes leaders our analysis shows to be well positioned to deliver long term outperformance through sustained competitive advantage and
superior returns on capital relative to their global industry peers. Leaders are identified based on quantifiable analysis of three aspects of corporate
performance: cash return on cash invested, industry positioning and management quality (the effectiveness of companies' management of the
environmental, social and governance issues facing their industry).
Disclosure Appendix
Coverage group(s) of stocks by primary analyst(s)
Robert Yen: Asia Pacific Technology.
Asia Pacific Technology: AAC Technologies, Acer, Advanced Semiconductor, Advanced Semiconductor (ADR), Airtac International, ASUSTeK
Computer, AU Optronics, BYD Electronic, Catcher Technology, Cheng Uei Precision (Foxlink), Chimei Innolux, China Wireless Technologies,
Chipbond Technology Corp., Chroma ATE, Compal Communications, Compal Electronics, Coretronic, Delta Electronics, E Ink Holdings Inc, Epistar,
Everlight Electronics, Foxconn Int'l Holdings, Foxconn Technology, Hiwin Technologies, Hon Hai Precision, HTC Corp., Kinsus Interconnect
Technology, Largan Precision, Lenovo Group, Lite-On Technology, Nan Ya PCB, Novatek Microelectronics, Pegatron, Powertech Technology,
Quanta Computer, Radiant Opto-Electronics, Siliconware Precision, Siliconware Precision (ADR), Silitech Technology, SK C&C, TCL Communication,
TPK Holding, TPV Technology, Tripod Technology, Unimicron, Wintek, Wistron, Young Fast Optoelectronics.
Company-specific regulatory disclosures
The following disclosures relate to relationships between The Goldman Sachs Group, Inc. (with its affiliates, "Goldman Sachs") and companies
covered by the Global Investment Research Division of Goldman Sachs and referred to in this research.
There are no company-specific disclosures for: Compal Communications (NT$37.00)
Distribution of ratings/investment banking relationships
Goldman Sachs Investment Research global coverage universe
Rating Distribution Investment Banking Relationships
Buy Hold Sell Buy Hold Sell
Global 32% 54% 14% 52% 41% 37%
As of July 1, 2011, Goldman Sachs Global Investment Research had investment ratings on 3,167 equity securities. Goldman Sachs assigns stocks as
Buys and Sells on various regional Investment Lists; stocks not so assigned are deemed Neutral. Such assignments equate to Buy, Hold and Sell for
the purposes of the above disclosure required by NASD/NYSE rules. See 'Ratings, Coverage groups and views and related definitions' below.
Goldman Sachs Global Investment Research 6
7. September 13, 2011 Compal Communications (8078.TW)
Price target and rating history chart(s)
Com pal Com m unications (8078.TW) Stock Price Currency : Taiw an Dollar
Goldman Sachs rating and stock price target history
60 10,000
50
44
50 23 45 31 23 20 9,000
27
8,000
40 33 18 34
26 7,000
30
57 6,000
53
20 5,000
10 4,000
Nov 9 Jan 6
Stock Price
Index Price
NA B S
A S O N D J F MA M J J A S O N D J F MA M J J A S O N D J F MA M J
2008 2009 2010 2011
Source: Goldman Sachs Investment Research for ratings and price targets; FactSet closing prices as of 6/30/2011.
Rating Covered by Robert Yen,
Apr 28, 2009 to S from B
Jul 9, 2009 to N from S Price target as of Nov 9, 2008
Sep 6, 2009 to B f rom N
Price target at removal Not covered by current analyst
Nov 17, 2009 to N from B
Jun 26, 2011 to B f rom S Taiw an SE Weighted
Index
The price targets show n should be considered in the context of all prior published Goldman Sachs research, w hich may or
may not have included price targets, as w ell as developments relating to the company, its industry and f inancial markets.
Regulatory disclosures
Disclosures required by United States laws and regulations
See company-specific regulatory disclosures above for any of the following disclosures required as to companies referred to in this report: manager
or co-manager in a pending transaction; 1% or other ownership; compensation for certain services; types of client relationships; managed/co-
managed public offerings in prior periods; directorships; for equity securities, market making and/or specialist role. Goldman Sachs usually makes a
market in fixed income securities of issuers discussed in this report and usually deals as a principal in these securities.
The following are additional required disclosures: Ownership and material conflicts of interest: Goldman Sachs policy prohibits its analysts,
professionals reporting to analysts and members of their households from owning securities of any company in the analyst's area of coverage.
Analyst compensation: Analysts are paid in part based on the profitability of Goldman Sachs, which includes investment banking revenues.
Analyst as officer or director: Goldman Sachs policy prohibits its analysts, persons reporting to analysts or members of their households from
serving as an officer, director, advisory board member or employee of any company in the analyst's area of coverage. Non-U.S. Analysts: Non-U.S.
analysts may not be associated persons of Goldman Sachs & Co. and therefore may not be subject to NASD Rule 2711/NYSE Rules 472 restrictions
on communications with subject company, public appearances and trading securities held by the analysts.
Distribution of ratings: See the distribution of ratings disclosure above. Price chart: See the price chart, with changes of ratings and price targets
in prior periods, above, or, if electronic format or if with respect to multiple companies which are the subject of this report, on the Goldman Sachs
website at http://www.gs.com/research/hedge.html.
Additional disclosures required under the laws and regulations of jurisdictions other than the United
States
The following disclosures are those required by the jurisdiction indicated, except to the extent already made above pursuant to United States laws
and regulations. Australia: This research, and any access to it, is intended only for "wholesale clients" within the meaning of the Australian
Corporations Act. Brazil: Disclosure information in relation to CVM Instruction 483 is available at http://www.gs.com/worldwide/brazil/gir/index.html.
Where applicable, the Brazil-registered analyst primarily responsible for the content of this research report, as defined in Article 16 of CVM
Instruction 483, is the first author named at the beginning of this report, unless indicated otherwise at the end of the text. Canada: Goldman Sachs
& Co. has approved of, and agreed to take responsibility for, this research in Canada if and to the extent it relates to equity securities of Canadian
issuers. Analysts may conduct site visits but are prohibited from accepting payment or reimbursement by the company of travel expenses for such
visits. Hong Kong: Further information on the securities of covered companies referred to in this research may be obtained on request from
Goldman Sachs (Asia) L.L.C. India: Further information on the subject company or companies referred to in this research may be obtained from
Goldman Sachs (India) Securities Private Limited; Japan: See below. Korea: Further information on the subject company or companies referred to
in this research may be obtained from Goldman Sachs (Asia) L.L.C., Seoul Branch. Russia: Research reports distributed in the Russian Federation
are not advertising as defined in the Russian legislation, but are information and analysis not having product promotion as their main purpose and
do not provide appraisal within the meaning of the Russian legislation on appraisal activity. Singapore: Further information on the covered
companies referred to in this research may be obtained from Goldman Sachs (Singapore) Pte. (Company Number: 198602165W). Taiwan: This
material is for reference only and must not be reprinted without permission. Investors should carefully consider their own investment risk.
Investment results are the responsibility of the individual investor. United Kingdom: Persons who would be categorized as retail clients in the
United Kingdom, as such term is defined in the rules of the Financial Services Authority, should read this research in conjunction with prior
Goldman Sachs research on the covered companies referred to herein and should refer to the risk warnings that have been sent to them by
Goldman Sachs International. A copy of these risks warnings, and a glossary of certain financial terms used in this report, are available from
Goldman Sachs International on request.
European Union: Disclosure information in relation to Article 4 (1) (d) and Article 6 (2) of the European Commission Directive 2003/126/EC is
available at http://www.gs.com/client_services/global_investment_research/europeanpolicy.html which states the European Policy for Managing
Conflicts of Interest in Connection with Investment Research.
Japan: Goldman Sachs Japan Co., Ltd. is a Financial Instrument Dealer under the Financial Instrument and Exchange Law, registered with the
Kanto Financial Bureau (Registration No. 69), and is a member of Japan Securities Dealers Association (JSDA) and Financial Futures Association of
Japan (FFAJ). Sales and purchase of equities are subject to commission pre-determined with clients plus consumption tax. See company-specific
disclosures as to any applicable disclosures required by Japanese stock exchanges, the Japanese Securities Dealers Association or the Japanese
Securities Finance Company.
Ratings, coverage groups and views and related definitions
Buy (B), Neutral (N), Sell (S) -Analysts recommend stocks as Buys or Sells for inclusion on various regional Investment Lists. Being assigned a Buy
or Sell on an Investment List is determined by a stock's return potential relative to its coverage group as described below. Any stock not assigned
as a Buy or a Sell on an Investment List is deemed Neutral. Each regional Investment Review Committee manages various regional Investment
Lists to a global guideline of 25%-35% of stocks as Buy and 10%-15% of stocks as Sell; however, the distribution of Buys and Sells in any particular
Goldman Sachs Global Investment Research 7
8. September 13, 2011 Compal Communications (8078.TW)
coverage group may vary as determined by the regional Investment Review Committee. Regional Conviction Buy and Sell lists represent
investment recommendations focused on either the size of the potential return or the likelihood of the realization of the return.
Return potential represents the price differential between the current share price and the price target expected during the time horizon associated
with the price target. Price targets are required for all covered stocks. The return potential, price target and associated time horizon are stated in
each report adding or reiterating an Investment List membership.
Coverage groups and views: A list of all stocks in each coverage group is available by primary analyst, stock and coverage group at
http://www.gs.com/research/hedge.html. The analyst assigns one of the following coverage views which represents the analyst's investment
outlook on the coverage group relative to the group's historical fundamentals and/or valuation. Attractive (A). The investment outlook over the
following 12 months is favorable relative to the coverage group's historical fundamentals and/or valuation. Neutral (N). The investment outlook
over the following 12 months is neutral relative to the coverage group's historical fundamentals and/or valuation. Cautious (C). The investment
outlook over the following 12 months is unfavorable relative to the coverage group's historical fundamentals and/or valuation.
Not Rated (NR). The investment rating and target price have been removed pursuant to Goldman Sachs policy when Goldman Sachs is acting in
an advisory capacity in a merger or strategic transaction involving this company and in certain other circumstances. Rating Suspended (RS).
Goldman Sachs Research has suspended the investment rating and price target for this stock, because there is not a sufficient fundamental basis
for determining, or there are legal, regulatory or policy constraints around publishing, an investment rating or target. The previous investment
rating and price target, if any, are no longer in effect for this stock and should not be relied upon. Coverage Suspended (CS). Goldman Sachs has
suspended coverage of this company. Not Covered (NC). Goldman Sachs does not cover this company. Not Available or Not Applicable (NA).
The information is not available for display or is not applicable. Not Meaningful (NM). The information is not meaningful and is therefore excluded.
Global product; distributing entities
The Global Investment Research Division of Goldman Sachs produces and distributes research products for clients of Goldman Sachs, and
pursuant to certain contractual arrangements, on a global basis. Analysts based in Goldman Sachs offices around the world produce equity
research on industries and companies, and research on macroeconomics, currencies, commodities and portfolio strategy. This research is
disseminated in Australia by Goldman Sachs & Partners Australia Pty Ltd (ABN 21 006 797 897) on behalf of Goldman Sachs; in Brazil by Goldman
Sachs do Brasil Banco Múltiplo S.A.; in Canada by Goldman Sachs & Co. regarding Canadian equities and by Goldman Sachs & Co. (all other
research); in Hong Kong by Goldman Sachs (Asia) L.L.C.; in India by Goldman Sachs (India) Securities Private Ltd.; in Japan by Goldman Sachs
Japan Co., Ltd.; in the Republic of Korea by Goldman Sachs (Asia) L.L.C., Seoul Branch; in New Zealand by Goldman Sachs & Partners New
Zealand Limited on behalf of Goldman Sachs; in Russia by OOO Goldman Sachs; in Singapore by Goldman Sachs (Singapore) Pte. (Company
Number: 198602165W); and in the United States of America by Goldman Sachs & Co. Goldman Sachs International has approved this research in
connection with its distribution in the United Kingdom and European Union.
European Union: Goldman Sachs International, authorized and regulated by the Financial Services Authority, has approved this research in
connection with its distribution in the European Union and United Kingdom; Goldman Sachs AG, regulated by the Bundesanstalt für
Finanzdienstleistungsaufsicht, may also distribute research in Germany.
General disclosures
This research is for our clients only. Other than disclosures relating to Goldman Sachs, this research is based on current public information that we
consider reliable, but we do not represent it is accurate or complete, and it should not be relied on as such. We seek to update our research as
appropriate, but various regulations may prevent us from doing so. Other than certain industry reports published on a periodic basis, the large
majority of reports are published at irregular intervals as appropriate in the analyst's judgment.
Goldman Sachs conducts a global full-service, integrated investment banking, investment management, and brokerage business. We have
investment banking and other business relationships with a substantial percentage of the companies covered by our Global Investment Research
Division. Goldman Sachs & Co., the United States broker dealer, is a member of SIPC (http://www.sipc.org).
Our salespeople, traders, and other professionals may provide oral or written market commentary or trading strategies to our clients and our
proprietary trading desks that reflect opinions that are contrary to the opinions expressed in this research. Our asset management area, our
proprietary trading desks and investing businesses may make investment decisions that are inconsistent with the recommendations or views
expressed in this research.
The analysts named in this report may have from time to time discussed with our clients, including Goldman Sachs salespersons and traders, or
may discuss in this report, trading strategies that reference catalysts or events that may have a near-term impact on the market price of the equity
securities discussed in this report, which impact may be directionally counter to the analysts' published price target expectations for such stocks.
Any such trading strategies are distinct from and do not affect the analysts' fundamental equity rating for such stocks, which rating reflects a stock's
return potential relative to its coverage group as described herein.
We and our affiliates, officers, directors, and employees, excluding equity and credit analysts, will from time to time have long or short positions in,
act as principal in, and buy or sell, the securities or derivatives, if any, referred to in this research.
This research is not an offer to sell or the solicitation of an offer to buy any security in any jurisdiction where such an offer or solicitation would be
illegal. It does not constitute a personal recommendation or take into account the particular investment objectives, financial situations, or needs of
individual clients. Clients should consider whether any advice or recommendation in this research is suitable for their particular circumstances and,
if appropriate, seek professional advice, including tax advice. The price and value of investments referred to in this research and the income from
them may fluctuate. Past performance is not a guide to future performance, future returns are not guaranteed, and a loss of original capital may
occur. Fluctuations in exchange rates could have adverse effects on the value or price of, or income derived from, certain investments.
Certain transactions, including those involving futures, options, and other derivatives, give rise to substantial risk and are not suitable for all
investors. Investors should review current options disclosure documents which are available from Goldman Sachs sales representatives or at
http://www.theocc.com/about/publications/character-risks.jsp. Transactions cost may be significant in option strategies calling for multiple purchase
and sales of options such as spreads. Supporting documentation will be supplied upon request.
All research reports are disseminated and available to all clients simultaneously through electronic publication to our internal client websites. Not
all research content is redistributed to our clients or available to third-party aggregators, nor is Goldman Sachs responsible for the redistribution of
our research by third party aggregators. For all research available on a particular stock, please contact your sales representative or go to
http://360.gs.com.
Disclosure information is also available at http://www.gs.com/research/hedge.html or from Research Compliance, 200 West Street, New York, NY
10282.
Copyright 2011 Goldman Sachs.
Goldman Sachs Global Investment Research 8
9. September 13, 2011 Compal Communications (8078.TW)
No part of this material may be (i) copied, photocopied or duplicated in any form by any means or (ii) redistributed without the
prior written consent of The Goldman Sachs Group, Inc.
Goldman Sachs Global Investment Research 9