Background
Dr. Nathan Yau is a statistician who loves to create ways people can easily understand big data. In his blog,
Flowing Data
(Links to an external site.)
, he posts interactive charts that illustrate pieces of the world around us. He has created several in recent years that are useful for exploring cultures within the US.
Take a moment to view the following websites which will be resources for your assignment this week. As you look at the charts provided at each site, be sure to consider the regional cultures around you as these are the cultures you encounter both at home and in the workplace.
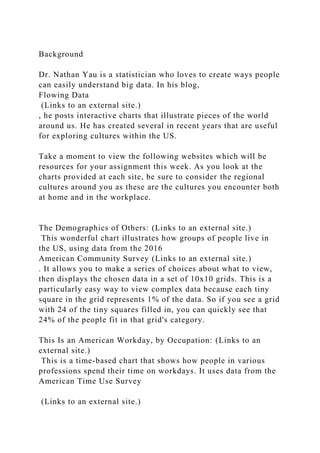
The Demographics of Others: (Links to an external site.)
This wonderful chart illustrates how groups of people live in the US, using data from the 2016
American Community Survey (Links to an external site.)
. It allows you to make a series of choices about what to view, then displays the chosen data in a set of 10x10 grids. This is a particularly easy way to view complex data because each tiny square in the grid represents 1% of the data. So if you see a grid with 24 of the tiny squares filled in, you can quickly see that 24% of the people fit in that grid's category.
This Is an American Workday, by Occupation: (Links to an external site.)
This is a time-based chart that shows how people in various professions spend their time on workdays. It uses data from the
American Time Use Survey
(Links to an external site.)
, which is conducted by the
Bureau of Labor Statistics (Links to an external site.)
. By observing people's activities you can deduce their cultural values.
Most Common Family Types in America (Links to an external site.)
: Also based on data from the American Community Survey, this (non-interactive) chart lists the many types of families in the US and how many Americans are into each category.
Mapping the Most Common Races (Links to an external site.)
: This interactive map of the US is color-coded to show the most prevalent race in each county. Mouse over any county to see a more detailed breakdown of the percentages. You can also select each race to see the per-county averages for each category. Use the plus and minus signs in the upper-left corner of the map to zoom in and out, which makes it much easier to select your own county.
These charts above are examples of the dimensions of culture. For example, race is a characteristic of culture. As we know, there are various races. The characteristics of races can be observed from the chat on Most Common Types of Race. Zimmerman (2017) defines culture as "the characteristics and knowledge of a particular group of people, encompassing language, religion, cuisine, social habits, music, and arts." Cristina De Rossi, an anthropologist at Barnet and Southgate College in London, takes the definition further in "culture encompasses religion, food, what we wear, how we wear it, our language, marriage, music, what we believe is right or wrong, how we sit at the table, how w.
BackgroundDr. Nathan Yau is a statistician who loves to create w.docx
1. Background
Dr. Nathan Yau is a statistician who loves to create ways people
can easily understand big data. In his blog,
Flowing Data
(Links to an external site.)
, he posts interactive charts that illustrate pieces of the world
around us. He has created several in recent years that are useful
for exploring cultures within the US.
Take a moment to view the following websites which will be
resources for your assignment this week. As you look at the
charts provided at each site, be sure to consider the regional
cultures around you as these are the cultures you encounter both
at home and in the workplace.
The Demographics of Others: (Links to an external site.)
This wonderful chart illustrates how groups of people live in
the US, using data from the 2016
American Community Survey (Links to an external site.)
. It allows you to make a series of choices about what to view,
then displays the chosen data in a set of 10x10 grids. This is a
particularly easy way to view complex data because each tiny
square in the grid represents 1% of the data. So if you see a grid
with 24 of the tiny squares filled in, you can quickly see that
24% of the people fit in that grid's category.
This Is an American Workday, by Occupation: (Links to an
external site.)
This is a time-based chart that shows how people in various
professions spend their time on workdays. It uses data from the
American Time Use Survey
(Links to an external site.)
2. , which is conducted by the
Bureau of Labor Statistics (Links to an external site.)
. By observing people's activities you can deduce their cultural
values.
Most Common Family Types in America (Links to an external
site.)
: Also based on data from the American Community Survey,
this (non-interactive) chart lists the many types of families in
the US and how many Americans are into each category.
Mapping the Most Common Races (Links to an external site.)
: This interactive map of the US is color-coded to show the
most prevalent race in each county. Mouse over any county to
see a more detailed breakdown of the percentages. You can also
select each race to see the per-county averages for each
category. Use the plus and minus signs in the upper-left corner
of the map to zoom in and out, which makes it much easier to
select your own county.
These charts above are examples of the dimensions of culture.
For example, race is a characteristic of culture. As we know,
there are various races. The characteristics of races can be
observed from the chat on Most Common Types of Race.
Zimmerman (2017) defines culture as "the characteristics and
knowledge of a particular group of people, encompassing
language, religion, cuisine, social habits, music, and
arts." Cristina De Rossi, an anthropologist at Barnet and
Southgate College in London, takes the definition further in
"culture encompasses religion, food, what we wear, how we
wear it, our language, marriage, music, what we believe is right
or wrong, how we sit at the table, how we greet visitors, how
we behave with loved ones, and a million other things"
(Zimmerman, 2017). Of course, in your workplace, you will see
various ways that cultures use their time at work. It is often
3. beneficial to think of culture on various levels such as national,
regional, organizational, and personal. An example of how
culture is different for people on various levels would be the
matter of punctuality. For instance, an American who is doing
business in Germany may find that meetings begin at exactly the
designated time. However, the same American may find that
meetings are routinely started five to ten minutes late.
Reference
Zimmermann, K. A. (2017, July 12). What Is Culture? |
Definition of Culture. Retrieved April 08, 2018, from
https://www.livescience.com/21478-what-is-culture-definition-
of-culture.html (Links to an external site.)
Prompt
For this assignment, explore each of the charts above to
determine the cultures in your community. You will organize
your writing into four parts.
Part 1:
Describe what different characteristics and dimensions of
culture you learned from each chart. The four charts are your
sources, so make sure you cite them. Then, take a moment to
review what you wrote about your own culture from last week's
assignment.
Part 2:
Write about how your own culture is similar to the cultures
around you.
Part 3:
Write about how your own culture differs from those around
you.
4. Part 4:
Reflect on how you might apply this information in the
workplace.
Assignment requirements:
Length: At least 500 words
1” margins
Size 12 font, Times New Roman or similar preferred
Name
Title of the paper
Course
Date
Citations for all sources used