Downloaded 2,250 times


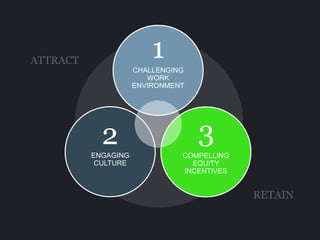
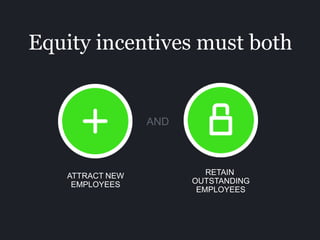

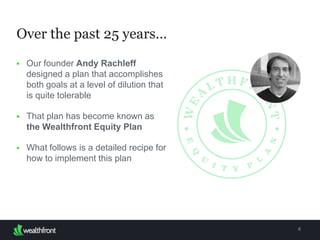
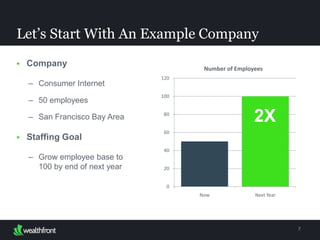
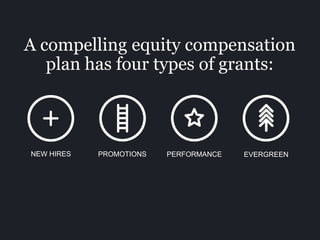

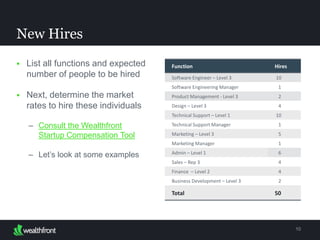
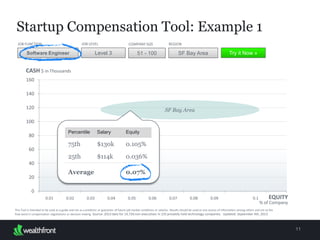
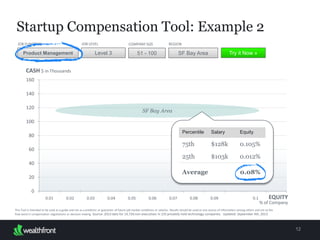
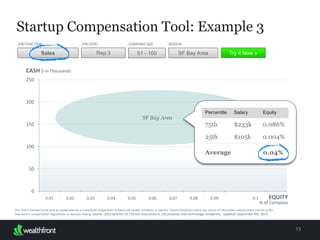
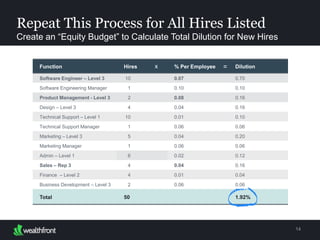

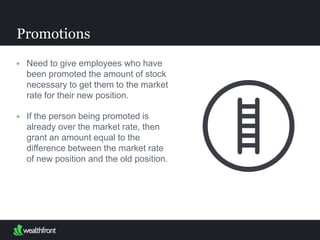
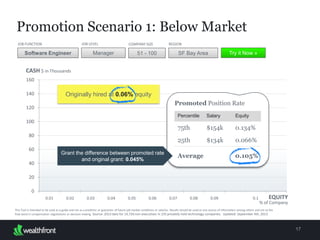

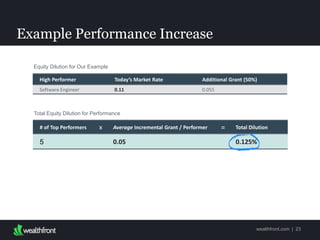

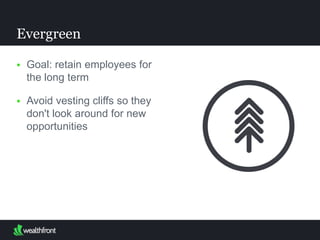
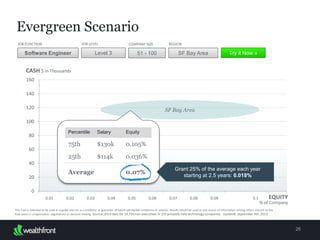
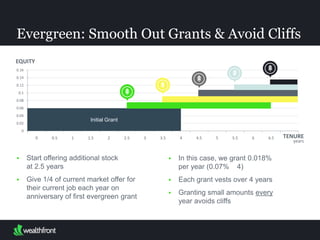
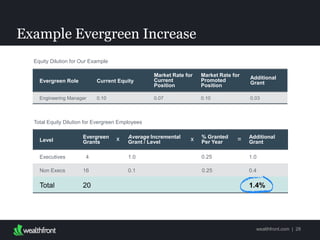
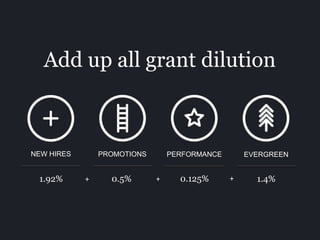
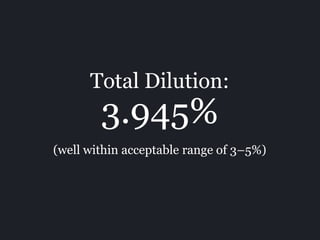


The document provides a detailed recipe for implementing the Wealthfront Equity Plan to attract and retain employees. It outlines granting equity for new hires, promotions, top performers, and evergreen grants to existing employees. For new hires, it determines market rates and calculates an "equity budget" totaling 1.92% dilution. Promotions are granted the difference to the market rate. Top performers receive 50% of current market rates, totaling 0.5% dilution. Evergreen grants of 25% of market rates each year total 1.4% dilution. The total dilution of 3.945% is within an acceptable range of 3-5%.


![Retaining Technology Talent [WHITE PAPER]](https://cdn.slidesharecdn.com/ss_thumbnails/retainingtechtalentwhitepapervmr-180214171518-thumbnail.jpg?width=640&height=640&fit=bounds)


