Download as PDF, PPTX
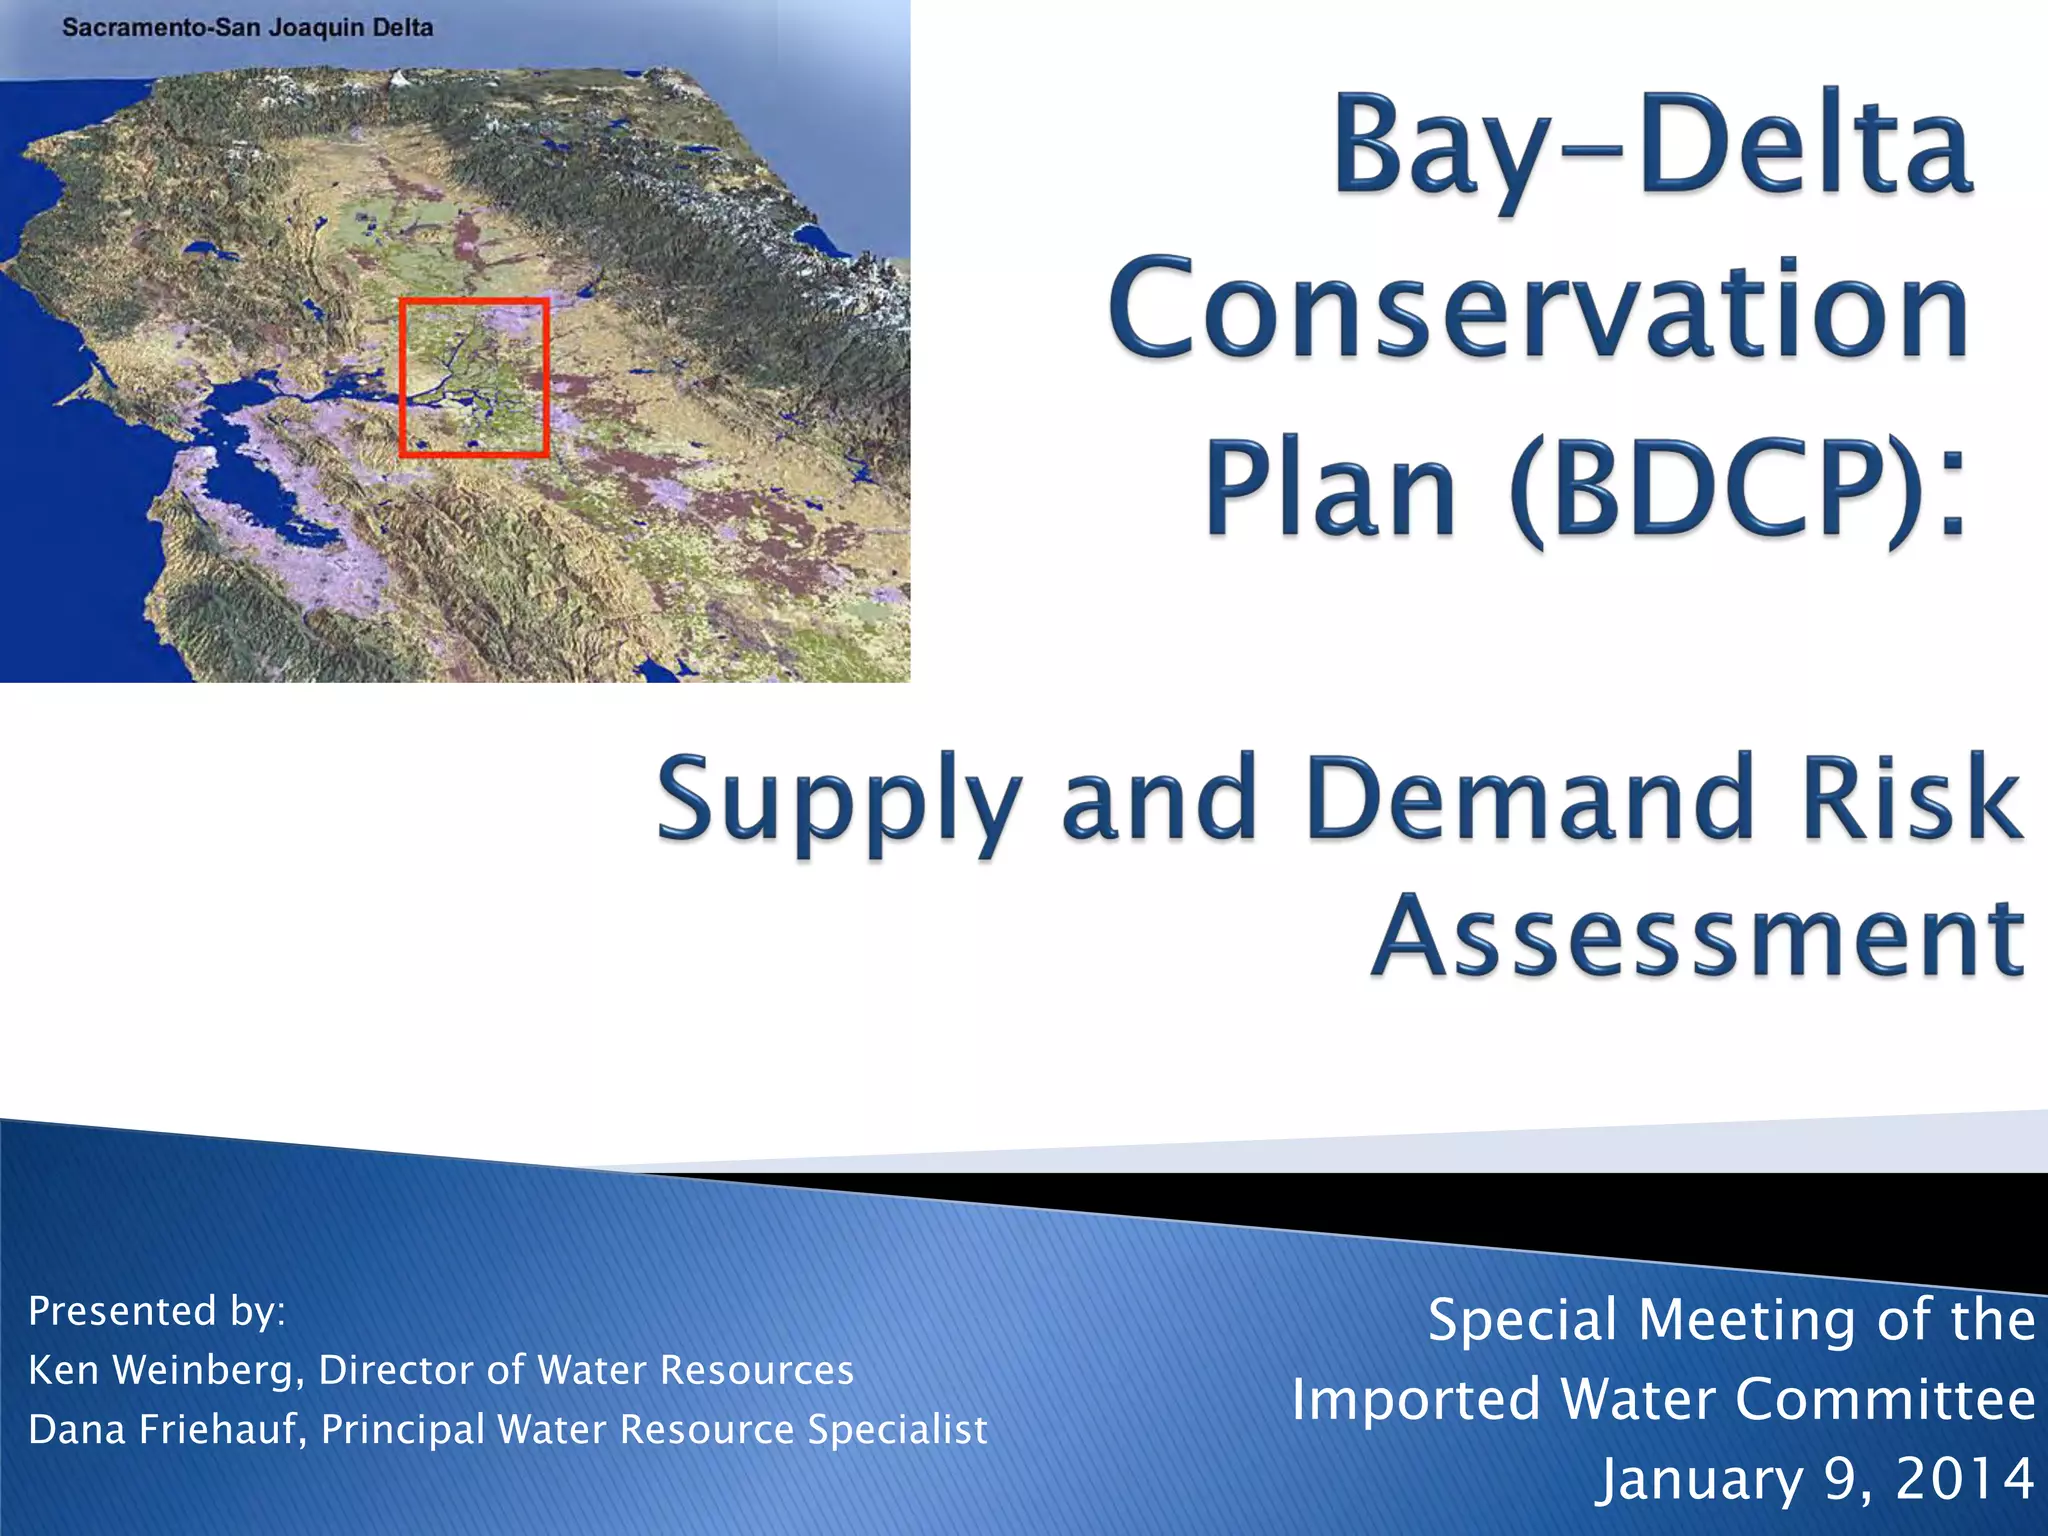
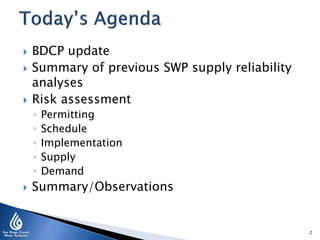
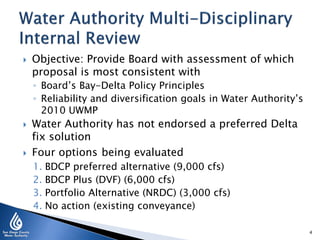
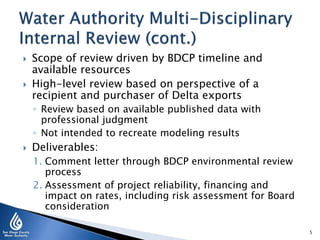
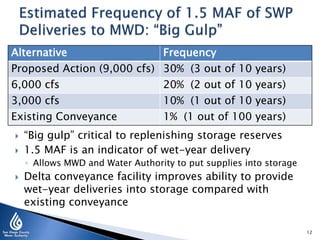
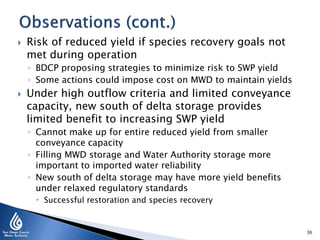
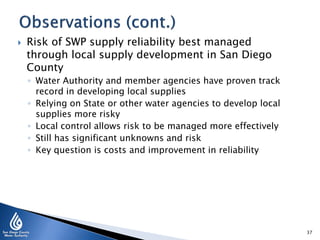
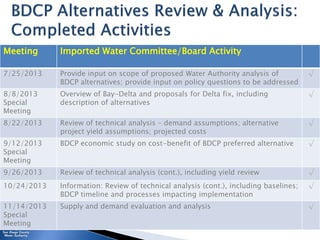
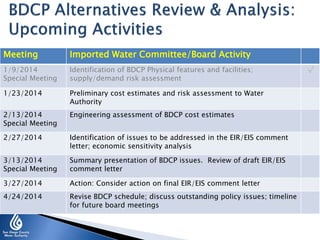

The document presents an update on the Bay Delta Conservation Plan (BDCP) and its analysis regarding water supply reliability, with a focus on evaluations of different conveyance options and their implications for San Diego County's water supply. Four alternatives are under consideration, with the objective of aligning with the board's policy principles and enhancing reliability and diversification of water sources. A public draft for review has been released, and further discussions on the evaluation and potential changes will take place in February 2014.


