Dealing with heteroscedasticity additional material 2
•Download as DOCX, PDF•
0 likes•398 views

Workshop on Introduction to Eviews

Recommended
More Related Content
Viewers also liked
Viewers also liked (15)
Similar to Dealing with heteroscedasticity additional material 2
Similar to Dealing with heteroscedasticity additional material 2 (16)
More from Dr. Vignes Gopal
More from Dr. Vignes Gopal (20)
Recently uploaded
Recently uploaded (20)
Dealing with heteroscedasticity additional material 2
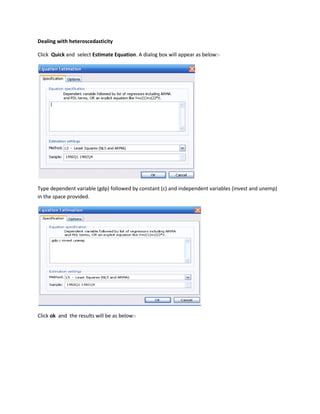
- 1. Dealing with heteroscedasticity Click Quick and select Estimate Equation. A dialog box will appear as below:- Type dependent variable (gdp) followed by constant (c) and independent variables (invest and unemp) in the space provided. Click ok and the results will be as below:-
- 2. Click View and select Actual, Fitted Residual and direct to Residual Graph The illustration of residual graph will be as below:-(Actual GDP-Predicted GDP)
- 3. Create a new series, residual3 that can capture the values of residuals Genr residual3=resid Click Quick and select Graph. A dialog box will appear as below: Type gdp followed by residuals3 in the provided space Click ok .A dialog box will appear as below: Select Scatter in the specific box and choose Regression Line as a type of Fit Line, and then click ok.
- 4. The illustration of scatter plot will be shown as below:- Click View and select Residual Tests, and then direct to Heteroskedasticity Tests. A dialog box on Heteroskedasticity Tests will appear as below:-
- 5. Select Breusch-Pagan Godfrey.Click ok and the results will be as below:- Null hypothesis : There is no heteroscedasticity (Homoscedasticity) Alternative hypothesis: There is a heteroscedasticity p-value=0.0020, p-value<0.05, Existence of heteroscedasticity Click View and select Residual Tests, and then direct to Heteroskedasticity Tests. A dialog box on Heteroskedasticity Tests will appear
- 6. Select White. Click Ok and the results will be as below:- Null hypothesis : There is no heteroscedasticity (Homoscedasticity) Alternative hypothesis: There is a heteroscedasticity p-value=0.00, p-value<0.05, Existence of heteroscedasticity