SlideShare a Scribd company logo
1 of 1
Download to read offline
Differentiating Commuters on Perceived Bike Safety & Transportation Attributes
Tian Guo, M.S., Arielle Courtney, Graduate Research Assistant, & Ingrid Schneider, Ph.D.
Introduction & Purpose
Discussion
A special thank you to the Minnesota Department of Transportation for
project support. Photos courtesy of: Explore Minnesota, Minneapolis St.
Paul Business Journal, and The Star Tribune, Bike Walk Move, and
University of Minnesota.
Overall summary
• Perceived bike safety & most transportation attributes did
not significantly differ among groups, despite contrary
findings in past literature
• Twin Cities bike culture may provide a higher sense of
safety due to existing infrastructure
• The overall perception of commuting by bike might be a
more important factor than perceived bike safety
• Changing people’s perception of biking as not only a
recreational activity, but also a commute mode, may be a
useful strategy to promote active transport
Future Research
• Differentiate between biking purposes
• Experiments with controlled perceived bike safety
Active transportation is beneficial for both human health & the
environment. Biking is positioned to become a major form of
active transportation given existing recreational use. Biking for
outdoor recreation increased 63% from 1983 to 2009. Still, fewer
than 1% of workers bike commuted (U.S. American Community
Survey, 2009).
Toward understanding & potentially moving recreational bikers to
commuting, differences among 3 groups of commuters were
assessed regarding
- perceived bike safety,
- transportation attributes, &
- demographics.
These areas were chosen based on past research & the
opportunity to overcome differences in satisfaction & safety
perceptions.
Data collection
• Mail survey to a random, representative sample of
Minnesotans in 2011 using Dillman et al. (2009) technique
• 1750 returns from the Twin Cities metropolitan area with
regional response rate of 43%
Measurement
• Transportation mode & outdoor biking within last 12 months
• Perceived bike safety & satisfaction with transportation
attributes on 7-point Likert scales (See below for example)
Analysis
• Descriptive statistics & comparison using ANOVA &
ANCOVA, controlling for commute distance
Controlling commute distance & perceptions
• No differences in safety perceptions
• No controls, cycling commuters > satisfied with
commuting time (F-value=4.63, p-value=0.01) & > aware
of air pollution issues in their community (F-value=3.46, p-
value=0.03)
• Controlling for commute distance: commute time & air
pollution no longer significant, bike commuters < satisfied
with clearing sidewalks of snow & ice (F-value=3.31, p-
value=.05)
Bike frequency, commute distance, & demographics
• Bike frequency: cycling commuters >recreation-only
cyclists
• Commute distance: cycling commuters < recreation-only
cyclists or no-cycle commuters
• Age: cycling commuters < no-cycling commuters
• Recreation-only commuters > male & > income than other
groups
Of the 1750 responses from metro area residents, 57% commuted to work.
Among commuters:
• Majority male (67%), non-Hispanic (98%), & white (100%); average age 51
• Driving alone dominant transport option for work, shopping, &
recreational trips, 5% of commuters commuted to work by bike 78% also
drove alone to work.
Acknowledgments
Results: Comparing commuters
Figure 4. Average perceived bike safety, Twin Cities, Minnesota, 2011
Figure 5. Average satisfaction with transportation attributes, Twin Cities, Minnesota, 2011. *Note: For air
pollution, 7=it is an issue in the community; striped bars indicated statistically significant difference
Figure 3. Travel mode for recreation among
Twin Cities sample, Minnesota, 2011 (%)
80%
5%
6%
1% 4%
3% 1%
Drive	alone
Car‐pool
Bus	(public)
Metro	trains
Bike
Walk
Taxi/shuttle
53%
24%
2%
3%
7%
10%
1%
Results: Commute choices
Methods
Results: Perceived safety & satisfaction with transportation attributes
Figure 2. Travel mode for work among Twin
Cities sample, Minnesota, 2011 (%)
Whether commute to work
Yes
Whether biked in the past 12 months
Whether bike to/from work
Excluded from analysis
No
Whether bike for
recreationNo
No-cycle commuters
n=456
Yes
Cycling commuters
n=48
Recreation commuters
n=86
Yes
Excluded from
analysis
Figure 1. Sample segmentation by cycling participation:
commuting, recreation or none
Safetyperception,7=verysafe
Attributessatisfaction,7=very
satisfied*
0
1
2
3
4
5
6
7
Road safety with
other drivers
Road safety
excluding other
drivers
Community
safety for
bicyclists
Too much traffic
to bike
Bike safety with
roadway design
Bike safety with
traffic and speeds
No-cycle Recreation-only Cycling commuters
0
1
2
3
4
5
6
7
On road bike
lanes
Commute time
to & from
work*
Access to
sidewalks
Clearing roads
of snow and
ice
Clearing
sidewalks of
snow and ice
Noise
pollution from
traffic
Air pollution*
No-cycle Recreation-only Cycling commuters
A collaboration of the University of Minnesota Extension & 
College of Food, Agricultural & Natural Resource Sciences

More Related Content

What's hot

Awareness on Road Signs and Markings of Drivers and Passengers along Maharlik...
Awareness on Road Signs and Markings of Drivers and Passengers along Maharlik...Awareness on Road Signs and Markings of Drivers and Passengers along Maharlik...
Awareness on Road Signs and Markings of Drivers and Passengers along Maharlik...IJAEMSJORNAL
 
Cycling safety in number
Cycling safety in numberCycling safety in number
Cycling safety in numberJumpingJaq
 
Linking livelihoods and spatial practices through mobility. The case of a res...
Linking livelihoods and spatial practices through mobility. The case of a res...Linking livelihoods and spatial practices through mobility. The case of a res...
Linking livelihoods and spatial practices through mobility. The case of a res...Institute for Transport Studies (ITS)
 
BillWalshCommunity.com_AAA Traffic Safety Index
BillWalshCommunity.com_AAA Traffic Safety IndexBillWalshCommunity.com_AAA Traffic Safety Index
BillWalshCommunity.com_AAA Traffic Safety IndexBillWalsh ToyotaScion
 
Lakewoodtoyota.com 2009 aaa traffic safety index
Lakewoodtoyota.com 2009 aaa traffic safety indexLakewoodtoyota.com 2009 aaa traffic safety index
Lakewoodtoyota.com 2009 aaa traffic safety indexToyota World Lakewood
 
US Public Transportation Ridership
US Public Transportation RidershipUS Public Transportation Ridership
US Public Transportation RidershipSean Christofferson
 
CircleAudi.net_AAA Traffic Safety Index
CircleAudi.net_AAA Traffic Safety IndexCircleAudi.net_AAA Traffic Safety Index
CircleAudi.net_AAA Traffic Safety IndexCircle Audi
 
SuntrupAutomotiveFamily.com_AAA Traffic Safety Index
SuntrupAutomotiveFamily.com_AAA Traffic Safety IndexSuntrupAutomotiveFamily.com_AAA Traffic Safety Index
SuntrupAutomotiveFamily.com_AAA Traffic Safety IndexSuntrup Kia
 
BMWGalleryNorwood.com 2009 AAA Traffic Safety Index
BMWGalleryNorwood.com 2009 AAA Traffic Safety IndexBMWGalleryNorwood.com 2009 AAA Traffic Safety Index
BMWGalleryNorwood.com 2009 AAA Traffic Safety IndexGallery Group of Norwood
 
BillSmithAutomotive.org 2009 AAA Traffic Safety Index
BillSmithAutomotive.org 2009 AAA Traffic Safety IndexBillSmithAutomotive.org 2009 AAA Traffic Safety Index
BillSmithAutomotive.org 2009 AAA Traffic Safety IndexBill Smith Buick GMC
 
BillWalshCommunity.com_AAA Traffic Safety Index
BillWalshCommunity.com_AAA Traffic Safety IndexBillWalshCommunity.com_AAA Traffic Safety Index
BillWalshCommunity.com_AAA Traffic Safety IndexSierra MotorMall
 
InlandEmpireNissan.com_AAA Traffic Safety Index
InlandEmpireNissan.com_AAA Traffic Safety IndexInlandEmpireNissan.com_AAA Traffic Safety Index
InlandEmpireNissan.com_AAA Traffic Safety IndexNissanof San Bernardino
 
East coast automall 2009 aaa traffic safety index
East coast automall 2009 aaa traffic safety indexEast coast automall 2009 aaa traffic safety index
East coast automall 2009 aaa traffic safety indexEastCoastAutomall
 
Volvo-OC.org_AAA Traffic Safety Index
Volvo-OC.org_AAA Traffic Safety IndexVolvo-OC.org_AAA Traffic Safety Index
Volvo-OC.org_AAA Traffic Safety IndexVolvoof OrangeCounty
 
RobertsAutoCenter.org_2009 AAA Traffic Safety Index
RobertsAutoCenter.org_2009 AAA Traffic Safety IndexRobertsAutoCenter.org_2009 AAA Traffic Safety Index
RobertsAutoCenter.org_2009 AAA Traffic Safety IndexRoberts Auto Center
 
Studies Show that Mobility Devices Contribute to Social Inclusion among the D...
Studies Show that Mobility Devices Contribute to Social Inclusion among the D...Studies Show that Mobility Devices Contribute to Social Inclusion among the D...
Studies Show that Mobility Devices Contribute to Social Inclusion among the D...Janelle_Martin
 
Presentation#4
Presentation#4Presentation#4
Presentation#4Yufan Sun
 

What's hot (20)

Awareness on Road Signs and Markings of Drivers and Passengers along Maharlik...
Awareness on Road Signs and Markings of Drivers and Passengers along Maharlik...Awareness on Road Signs and Markings of Drivers and Passengers along Maharlik...
Awareness on Road Signs and Markings of Drivers and Passengers along Maharlik...
 
Cycling safety in number
Cycling safety in numberCycling safety in number
Cycling safety in number
 
20320130406016 2-3
20320130406016 2-320320130406016 2-3
20320130406016 2-3
 
The Potential Benefits of Transit Travel Training
The Potential Benefits of Transit Travel TrainingThe Potential Benefits of Transit Travel Training
The Potential Benefits of Transit Travel Training
 
Linking livelihoods and spatial practices through mobility. The case of a res...
Linking livelihoods and spatial practices through mobility. The case of a res...Linking livelihoods and spatial practices through mobility. The case of a res...
Linking livelihoods and spatial practices through mobility. The case of a res...
 
BillWalshCommunity.com_AAA Traffic Safety Index
BillWalshCommunity.com_AAA Traffic Safety IndexBillWalshCommunity.com_AAA Traffic Safety Index
BillWalshCommunity.com_AAA Traffic Safety Index
 
Lakewoodtoyota.com 2009 aaa traffic safety index
Lakewoodtoyota.com 2009 aaa traffic safety indexLakewoodtoyota.com 2009 aaa traffic safety index
Lakewoodtoyota.com 2009 aaa traffic safety index
 
US Public Transportation Ridership
US Public Transportation RidershipUS Public Transportation Ridership
US Public Transportation Ridership
 
CircleAudi.net_AAA Traffic Safety Index
CircleAudi.net_AAA Traffic Safety IndexCircleAudi.net_AAA Traffic Safety Index
CircleAudi.net_AAA Traffic Safety Index
 
SuntrupAutomotiveFamily.com_AAA Traffic Safety Index
SuntrupAutomotiveFamily.com_AAA Traffic Safety IndexSuntrupAutomotiveFamily.com_AAA Traffic Safety Index
SuntrupAutomotiveFamily.com_AAA Traffic Safety Index
 
BMWGalleryNorwood.com 2009 AAA Traffic Safety Index
BMWGalleryNorwood.com 2009 AAA Traffic Safety IndexBMWGalleryNorwood.com 2009 AAA Traffic Safety Index
BMWGalleryNorwood.com 2009 AAA Traffic Safety Index
 
BillSmithAutomotive.org 2009 AAA Traffic Safety Index
BillSmithAutomotive.org 2009 AAA Traffic Safety IndexBillSmithAutomotive.org 2009 AAA Traffic Safety Index
BillSmithAutomotive.org 2009 AAA Traffic Safety Index
 
BillWalshCommunity.com_AAA Traffic Safety Index
BillWalshCommunity.com_AAA Traffic Safety IndexBillWalshCommunity.com_AAA Traffic Safety Index
BillWalshCommunity.com_AAA Traffic Safety Index
 
InlandEmpireNissan.com_AAA Traffic Safety Index
InlandEmpireNissan.com_AAA Traffic Safety IndexInlandEmpireNissan.com_AAA Traffic Safety Index
InlandEmpireNissan.com_AAA Traffic Safety Index
 
East coast automall 2009 aaa traffic safety index
East coast automall 2009 aaa traffic safety indexEast coast automall 2009 aaa traffic safety index
East coast automall 2009 aaa traffic safety index
 
Volvo-OC.org_AAA Traffic Safety Index
Volvo-OC.org_AAA Traffic Safety IndexVolvo-OC.org_AAA Traffic Safety Index
Volvo-OC.org_AAA Traffic Safety Index
 
RobertsAutoCenter.org_2009 AAA Traffic Safety Index
RobertsAutoCenter.org_2009 AAA Traffic Safety IndexRobertsAutoCenter.org_2009 AAA Traffic Safety Index
RobertsAutoCenter.org_2009 AAA Traffic Safety Index
 
SSC2011_Patricia Hu PPT
SSC2011_Patricia Hu PPTSSC2011_Patricia Hu PPT
SSC2011_Patricia Hu PPT
 
Studies Show that Mobility Devices Contribute to Social Inclusion among the D...
Studies Show that Mobility Devices Contribute to Social Inclusion among the D...Studies Show that Mobility Devices Contribute to Social Inclusion among the D...
Studies Show that Mobility Devices Contribute to Social Inclusion among the D...
 
Presentation#4
Presentation#4Presentation#4
Presentation#4
 

Viewers also liked

Viewers also liked (13)

Bike Safety Comic Strip
Bike Safety Comic StripBike Safety Comic Strip
Bike Safety Comic Strip
 
Bike safety
Bike safety Bike safety
Bike safety
 
Bike Safety Meme
Bike Safety MemeBike Safety Meme
Bike Safety Meme
 
Bike safety
Bike safety Bike safety
Bike safety
 
Bike safety
Bike safetyBike safety
Bike safety
 
Bike safety photos
Bike safety photosBike safety photos
Bike safety photos
 
Bike safety 101
Bike safety 101Bike safety 101
Bike safety 101
 
Bike Safety Presentation
Bike Safety PresentationBike Safety Presentation
Bike Safety Presentation
 
Cychic: Bike Safety
Cychic: Bike SafetyCychic: Bike Safety
Cychic: Bike Safety
 
Bike Safety for Sales Team
Bike Safety for Sales TeamBike Safety for Sales Team
Bike Safety for Sales Team
 
Bike Safety
Bike SafetyBike Safety
Bike Safety
 
Bicycle powerpoint
Bicycle powerpointBicycle powerpoint
Bicycle powerpoint
 
Bicycle safety!
Bicycle safety!Bicycle safety!
Bicycle safety!
 

Similar to Differentiating Commuters on Perceived Bike Safety & Transportation Attributes

Active transportation
Active transportationActive transportation
Active transportationSachaSmart1
 
2016 urisa track: a spatial analysis of bicycling behavior using census data...
2016 urisa track:  a spatial analysis of bicycling behavior using census data...2016 urisa track:  a spatial analysis of bicycling behavior using census data...
2016 urisa track: a spatial analysis of bicycling behavior using census data...GIS in the Rockies
 
Improving the quality and cost effectiveness of multimodal travel behavior da...
Improving the quality and cost effectiveness of multimodal travel behavior da...Improving the quality and cost effectiveness of multimodal travel behavior da...
Improving the quality and cost effectiveness of multimodal travel behavior da...Sean Barbeau
 
A Tale of Two Streets - Indiana Walk-Bike Summit.pptx
A Tale of Two Streets - Indiana Walk-Bike Summit.pptxA Tale of Two Streets - Indiana Walk-Bike Summit.pptx
A Tale of Two Streets - Indiana Walk-Bike Summit.pptxCynthia Hoyle
 
The State of Biking in St. Louis Rhonda Smythe
The State of Biking in St. Louis Rhonda SmytheThe State of Biking in St. Louis Rhonda Smythe
The State of Biking in St. Louis Rhonda SmytheTrailnet
 
Discrete Choice Analysis Class Final Paper
Discrete Choice Analysis Class Final PaperDiscrete Choice Analysis Class Final Paper
Discrete Choice Analysis Class Final PaperKiarash Fariborzi
 
1. Why do Muslims oppose icons and depictions of people How is.docx
1. Why do Muslims oppose icons and depictions of people  How is.docx1. Why do Muslims oppose icons and depictions of people  How is.docx
1. Why do Muslims oppose icons and depictions of people How is.docxjackiewalcutt
 
Safe States Slide Master
Safe States Slide MasterSafe States Slide Master
Safe States Slide MasterHeather Gramp
 
Cost-Benefit Analysis of Greenways
Cost-Benefit Analysis of GreenwaysCost-Benefit Analysis of Greenways
Cost-Benefit Analysis of GreenwaysJessie Baker
 
Effective Strategies for Shifting Behaviors
Effective Strategies for Shifting Behaviors Effective Strategies for Shifting Behaviors
Effective Strategies for Shifting Behaviors Trailnet
 
Effective Strategies for Shifting Behaviors, Presentation 1
Effective Strategies for Shifting Behaviors, Presentation 1Effective Strategies for Shifting Behaviors, Presentation 1
Effective Strategies for Shifting Behaviors, Presentation 1Trailnet
 
Improving estimates of capacity of populations to make journeys by walking an...
Improving estimates of capacity of populations to make journeys by walking an...Improving estimates of capacity of populations to make journeys by walking an...
Improving estimates of capacity of populations to make journeys by walking an...Institute for Transport Studies (ITS)
 
Mobility v accessibility1
Mobility v accessibility1Mobility v accessibility1
Mobility v accessibility1AnamariB
 
IRJET- Mode Choice Behaviour Analysis of Students in Thrissur City
IRJET- Mode Choice Behaviour Analysis of Students in Thrissur CityIRJET- Mode Choice Behaviour Analysis of Students in Thrissur City
IRJET- Mode Choice Behaviour Analysis of Students in Thrissur CityIRJET Journal
 
Transit and Pedestrian Safety - 2014 Public Transportation & Universities Con...
Transit and Pedestrian Safety - 2014 Public Transportation & Universities Con...Transit and Pedestrian Safety - 2014 Public Transportation & Universities Con...
Transit and Pedestrian Safety - 2014 Public Transportation & Universities Con...Cynthia Hoyle
 

Similar to Differentiating Commuters on Perceived Bike Safety & Transportation Attributes (20)

Perceived Bicycle Safety in Minnesota
Perceived Bicycle Safety in MinnesotaPerceived Bicycle Safety in Minnesota
Perceived Bicycle Safety in Minnesota
 
Active transportation
Active transportationActive transportation
Active transportation
 
2016 urisa track: a spatial analysis of bicycling behavior using census data...
2016 urisa track:  a spatial analysis of bicycling behavior using census data...2016 urisa track:  a spatial analysis of bicycling behavior using census data...
2016 urisa track: a spatial analysis of bicycling behavior using census data...
 
Improving the quality and cost effectiveness of multimodal travel behavior da...
Improving the quality and cost effectiveness of multimodal travel behavior da...Improving the quality and cost effectiveness of multimodal travel behavior da...
Improving the quality and cost effectiveness of multimodal travel behavior da...
 
Bicycle Safety
Bicycle SafetyBicycle Safety
Bicycle Safety
 
A Tale of Two Streets - Indiana Walk-Bike Summit.pptx
A Tale of Two Streets - Indiana Walk-Bike Summit.pptxA Tale of Two Streets - Indiana Walk-Bike Summit.pptx
A Tale of Two Streets - Indiana Walk-Bike Summit.pptx
 
VolatileEndeavors-SmithVu
VolatileEndeavors-SmithVuVolatileEndeavors-SmithVu
VolatileEndeavors-SmithVu
 
The State of Biking in St. Louis Rhonda Smythe
The State of Biking in St. Louis Rhonda SmytheThe State of Biking in St. Louis Rhonda Smythe
The State of Biking in St. Louis Rhonda Smythe
 
Measure for Measure: Boston-based Technical Toolkits for Measuring Walkabilit...
Measure for Measure: Boston-based Technical Toolkits for Measuring Walkabilit...Measure for Measure: Boston-based Technical Toolkits for Measuring Walkabilit...
Measure for Measure: Boston-based Technical Toolkits for Measuring Walkabilit...
 
Discrete Choice Analysis Class Final Paper
Discrete Choice Analysis Class Final PaperDiscrete Choice Analysis Class Final Paper
Discrete Choice Analysis Class Final Paper
 
1. Why do Muslims oppose icons and depictions of people How is.docx
1. Why do Muslims oppose icons and depictions of people  How is.docx1. Why do Muslims oppose icons and depictions of people  How is.docx
1. Why do Muslims oppose icons and depictions of people How is.docx
 
Safe States Slide Master
Safe States Slide MasterSafe States Slide Master
Safe States Slide Master
 
Cost-Benefit Analysis of Greenways
Cost-Benefit Analysis of GreenwaysCost-Benefit Analysis of Greenways
Cost-Benefit Analysis of Greenways
 
Effective Strategies for Shifting Behaviors
Effective Strategies for Shifting Behaviors Effective Strategies for Shifting Behaviors
Effective Strategies for Shifting Behaviors
 
Effective Strategies for Shifting Behaviors, Presentation 1
Effective Strategies for Shifting Behaviors, Presentation 1Effective Strategies for Shifting Behaviors, Presentation 1
Effective Strategies for Shifting Behaviors, Presentation 1
 
198 Presentation
198 Presentation198 Presentation
198 Presentation
 
Improving estimates of capacity of populations to make journeys by walking an...
Improving estimates of capacity of populations to make journeys by walking an...Improving estimates of capacity of populations to make journeys by walking an...
Improving estimates of capacity of populations to make journeys by walking an...
 
Mobility v accessibility1
Mobility v accessibility1Mobility v accessibility1
Mobility v accessibility1
 
IRJET- Mode Choice Behaviour Analysis of Students in Thrissur City
IRJET- Mode Choice Behaviour Analysis of Students in Thrissur CityIRJET- Mode Choice Behaviour Analysis of Students in Thrissur City
IRJET- Mode Choice Behaviour Analysis of Students in Thrissur City
 
Transit and Pedestrian Safety - 2014 Public Transportation & Universities Con...
Transit and Pedestrian Safety - 2014 Public Transportation & Universities Con...Transit and Pedestrian Safety - 2014 Public Transportation & Universities Con...
Transit and Pedestrian Safety - 2014 Public Transportation & Universities Con...
 

More from University of Minnesota Tourism Center

The Benefits & Difficulties of Adopting Sustainable Practices Among the MN To...
The Benefits & Difficulties of Adopting Sustainable Practices Among the MN To...The Benefits & Difficulties of Adopting Sustainable Practices Among the MN To...
The Benefits & Difficulties of Adopting Sustainable Practices Among the MN To...University of Minnesota Tourism Center
 
TAPPING into Community Tourism Potential in Rural Minnesota's Communities
TAPPING into Community Tourism Potential in Rural Minnesota's Communities TAPPING into Community Tourism Potential in Rural Minnesota's Communities
TAPPING into Community Tourism Potential in Rural Minnesota's Communities University of Minnesota Tourism Center
 
Perceptions of Invasive Species & Their Control Among the MN Tourism Industry
Perceptions of Invasive Species & Their Control Among the MN Tourism IndustryPerceptions of Invasive Species & Their Control Among the MN Tourism Industry
Perceptions of Invasive Species & Their Control Among the MN Tourism IndustryUniversity of Minnesota Tourism Center
 
State of Sustainable Tourism: Assessing waste minimization practices among to...
State of Sustainable Tourism: Assessing waste minimization practices among to...State of Sustainable Tourism: Assessing waste minimization practices among to...
State of Sustainable Tourism: Assessing waste minimization practices among to...University of Minnesota Tourism Center
 
Are Tourism Businesses Using the Internet? An Initial Assessment of Digital P...
Are Tourism Businesses Using the Internet? An Initial Assessment of Digital P...Are Tourism Businesses Using the Internet? An Initial Assessment of Digital P...
Are Tourism Businesses Using the Internet? An Initial Assessment of Digital P...University of Minnesota Tourism Center
 
Waste, water, and energy benchmarking and conservation opportunities for Minn...
Waste, water, and energy benchmarking and conservation opportunities for Minn...Waste, water, and energy benchmarking and conservation opportunities for Minn...
Waste, water, and energy benchmarking and conservation opportunities for Minn...University of Minnesota Tourism Center
 
State of Sustainable Tourism in Minnesota 2013 Initial Assessment of Water an...
State of Sustainable Tourism in Minnesota 2013 Initial Assessment of Water an...State of Sustainable Tourism in Minnesota 2013 Initial Assessment of Water an...
State of Sustainable Tourism in Minnesota 2013 Initial Assessment of Water an...University of Minnesota Tourism Center
 

More from University of Minnesota Tourism Center (20)

Dr. Schneider MRCA Keynote
Dr. Schneider MRCA KeynoteDr. Schneider MRCA Keynote
Dr. Schneider MRCA Keynote
 
Seasonal Residents and Economic Development
Seasonal Residents and Economic DevelopmentSeasonal Residents and Economic Development
Seasonal Residents and Economic Development
 
Quality of life & opportunities to position parks & recreation
Quality of life & opportunities to position parks & recreationQuality of life & opportunities to position parks & recreation
Quality of life & opportunities to position parks & recreation
 
Minnesota Museums Help Communities Grow Factsheet
Minnesota Museums Help Communities Grow Factsheet Minnesota Museums Help Communities Grow Factsheet
Minnesota Museums Help Communities Grow Factsheet
 
Profiling Festivals & Events in Minnesota: Select Results
Profiling Festivals & Events in Minnesota: Select ResultsProfiling Festivals & Events in Minnesota: Select Results
Profiling Festivals & Events in Minnesota: Select Results
 
The Benefits & Difficulties of Adopting Sustainable Practices Among the MN To...
The Benefits & Difficulties of Adopting Sustainable Practices Among the MN To...The Benefits & Difficulties of Adopting Sustainable Practices Among the MN To...
The Benefits & Difficulties of Adopting Sustainable Practices Among the MN To...
 
TAPPING into Community Tourism Potential in Rural Minnesota's Communities
TAPPING into Community Tourism Potential in Rural Minnesota's Communities TAPPING into Community Tourism Potential in Rural Minnesota's Communities
TAPPING into Community Tourism Potential in Rural Minnesota's Communities
 
Ripple Effect Mapping of the Tourism Assessment Program
Ripple Effect Mapping of the Tourism Assessment ProgramRipple Effect Mapping of the Tourism Assessment Program
Ripple Effect Mapping of the Tourism Assessment Program
 
Emerald Ash Borer Interviews
Emerald Ash Borer InterviewsEmerald Ash Borer Interviews
Emerald Ash Borer Interviews
 
Emerald Ash Borer Interviews
Emerald Ash Borer Interviews Emerald Ash Borer Interviews
Emerald Ash Borer Interviews
 
Perceptions of Invasive Species & Their Control Among the MN Tourism Industry
Perceptions of Invasive Species & Their Control Among the MN Tourism IndustryPerceptions of Invasive Species & Their Control Among the MN Tourism Industry
Perceptions of Invasive Species & Their Control Among the MN Tourism Industry
 
State of Sustainable Tourism: Assessing waste minimization practices among to...
State of Sustainable Tourism: Assessing waste minimization practices among to...State of Sustainable Tourism: Assessing waste minimization practices among to...
State of Sustainable Tourism: Assessing waste minimization practices among to...
 
Welcome to the New Tradition: Where we are & Where we are heading to
Welcome to the New Tradition: Where we are & Where we are heading toWelcome to the New Tradition: Where we are & Where we are heading to
Welcome to the New Tradition: Where we are & Where we are heading to
 
Quality of Life: Assessment for Transportation Performance Measures
Quality of Life: Assessment for Transportation Performance MeasuresQuality of Life: Assessment for Transportation Performance Measures
Quality of Life: Assessment for Transportation Performance Measures
 
Economic Impact of the 3M Championship Golf Tournament
Economic Impact of the 3M Championship Golf TournamentEconomic Impact of the 3M Championship Golf Tournament
Economic Impact of the 3M Championship Golf Tournament
 
Are Tourism Businesses Using the Internet? An Initial Assessment of Digital P...
Are Tourism Businesses Using the Internet? An Initial Assessment of Digital P...Are Tourism Businesses Using the Internet? An Initial Assessment of Digital P...
Are Tourism Businesses Using the Internet? An Initial Assessment of Digital P...
 
Chisago Lakes Area: Tourism Assessment Program Case Study 2008-2011
Chisago Lakes Area: Tourism Assessment Program Case Study 2008-2011Chisago Lakes Area: Tourism Assessment Program Case Study 2008-2011
Chisago Lakes Area: Tourism Assessment Program Case Study 2008-2011
 
Understanding & Aligning Transportation with Quality of Life
Understanding & Aligning Transportation with Quality of LifeUnderstanding & Aligning Transportation with Quality of Life
Understanding & Aligning Transportation with Quality of Life
 
Waste, water, and energy benchmarking and conservation opportunities for Minn...
Waste, water, and energy benchmarking and conservation opportunities for Minn...Waste, water, and energy benchmarking and conservation opportunities for Minn...
Waste, water, and energy benchmarking and conservation opportunities for Minn...
 
State of Sustainable Tourism in Minnesota 2013 Initial Assessment of Water an...
State of Sustainable Tourism in Minnesota 2013 Initial Assessment of Water an...State of Sustainable Tourism in Minnesota 2013 Initial Assessment of Water an...
State of Sustainable Tourism in Minnesota 2013 Initial Assessment of Water an...
 

Differentiating Commuters on Perceived Bike Safety & Transportation Attributes

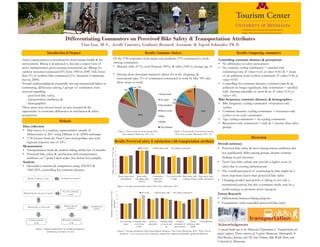
  • 1. Differentiating Commuters on Perceived Bike Safety & Transportation Attributes Tian Guo, M.S., Arielle Courtney, Graduate Research Assistant, & Ingrid Schneider, Ph.D. Introduction & Purpose Discussion A special thank you to the Minnesota Department of Transportation for project support. Photos courtesy of: Explore Minnesota, Minneapolis St. Paul Business Journal, and The Star Tribune, Bike Walk Move, and University of Minnesota. Overall summary • Perceived bike safety & most transportation attributes did not significantly differ among groups, despite contrary findings in past literature • Twin Cities bike culture may provide a higher sense of safety due to existing infrastructure • The overall perception of commuting by bike might be a more important factor than perceived bike safety • Changing people’s perception of biking as not only a recreational activity, but also a commute mode, may be a useful strategy to promote active transport Future Research • Differentiate between biking purposes • Experiments with controlled perceived bike safety Active transportation is beneficial for both human health & the environment. Biking is positioned to become a major form of active transportation given existing recreational use. Biking for outdoor recreation increased 63% from 1983 to 2009. Still, fewer than 1% of workers bike commuted (U.S. American Community Survey, 2009). Toward understanding & potentially moving recreational bikers to commuting, differences among 3 groups of commuters were assessed regarding - perceived bike safety, - transportation attributes, & - demographics. These areas were chosen based on past research & the opportunity to overcome differences in satisfaction & safety perceptions. Data collection • Mail survey to a random, representative sample of Minnesotans in 2011 using Dillman et al. (2009) technique • 1750 returns from the Twin Cities metropolitan area with regional response rate of 43% Measurement • Transportation mode & outdoor biking within last 12 months • Perceived bike safety & satisfaction with transportation attributes on 7-point Likert scales (See below for example) Analysis • Descriptive statistics & comparison using ANOVA & ANCOVA, controlling for commute distance Controlling commute distance & perceptions • No differences in safety perceptions • No controls, cycling commuters > satisfied with commuting time (F-value=4.63, p-value=0.01) & > aware of air pollution issues in their community (F-value=3.46, p- value=0.03) • Controlling for commute distance: commute time & air pollution no longer significant, bike commuters < satisfied with clearing sidewalks of snow & ice (F-value=3.31, p- value=.05) Bike frequency, commute distance, & demographics • Bike frequency: cycling commuters >recreation-only cyclists • Commute distance: cycling commuters < recreation-only cyclists or no-cycle commuters • Age: cycling commuters < no-cycling commuters • Recreation-only commuters > male & > income than other groups Of the 1750 responses from metro area residents, 57% commuted to work. Among commuters: • Majority male (67%), non-Hispanic (98%), & white (100%); average age 51 • Driving alone dominant transport option for work, shopping, & recreational trips, 5% of commuters commuted to work by bike 78% also drove alone to work. Acknowledgments Results: Comparing commuters Figure 4. Average perceived bike safety, Twin Cities, Minnesota, 2011 Figure 5. Average satisfaction with transportation attributes, Twin Cities, Minnesota, 2011. *Note: For air pollution, 7=it is an issue in the community; striped bars indicated statistically significant difference Figure 3. Travel mode for recreation among Twin Cities sample, Minnesota, 2011 (%) 80% 5% 6% 1% 4% 3% 1% Drive alone Car‐pool Bus (public) Metro trains Bike Walk Taxi/shuttle 53% 24% 2% 3% 7% 10% 1% Results: Commute choices Methods Results: Perceived safety & satisfaction with transportation attributes Figure 2. Travel mode for work among Twin Cities sample, Minnesota, 2011 (%) Whether commute to work Yes Whether biked in the past 12 months Whether bike to/from work Excluded from analysis No Whether bike for recreationNo No-cycle commuters n=456 Yes Cycling commuters n=48 Recreation commuters n=86 Yes Excluded from analysis Figure 1. Sample segmentation by cycling participation: commuting, recreation or none Safetyperception,7=verysafe Attributessatisfaction,7=very satisfied* 0 1 2 3 4 5 6 7 Road safety with other drivers Road safety excluding other drivers Community safety for bicyclists Too much traffic to bike Bike safety with roadway design Bike safety with traffic and speeds No-cycle Recreation-only Cycling commuters 0 1 2 3 4 5 6 7 On road bike lanes Commute time to & from work* Access to sidewalks Clearing roads of snow and ice Clearing sidewalks of snow and ice Noise pollution from traffic Air pollution* No-cycle Recreation-only Cycling commuters A collaboration of the University of Minnesota Extension &  College of Food, Agricultural & Natural Resource Sciences