High performance liquid chromatography
•Download as PPSX, PDF•
0 likes•905 views

High-performance liquid chromatography (HPLC) is a technique in analytical chemistry used to separate, identify, and quantify each component in a mixture. HPLC works by passing a pressurized liquid solvent containing the sample mixture through a long column packed with a stationary solid phase. The components within the mixture interact differently with the two phases at varying rates during passage through the column, allowing separation. A detector then measures the separated components as they exit the column, allowing for identification and quantification.

Recommended
More Related Content
What's hot
What's hot (20)
Similar to High performance liquid chromatography
Similar to High performance liquid chromatography (20)
Recently uploaded
Recently uploaded (20)
High performance liquid chromatography
- 1. High-performance liquid chromatography (HPLC) By : Hassan ALNAJEM hassan-alnajemAlnajemhassan@gmail.com
- 2. HPLC • Introduction • High Pressure Liquid Chromatography is the most versatile fast chromatographic separation technique in which the micro amount of a sample mixture is separated at a high mobile liquid phase pressure by passing them through long narrow packed column containing stationary solid phase of a very small uniform particle & giving continuous monitor facility for the column effluent and also the separated components are migrates through the column at different rates due to different in solubility , adsorption, partition, size and charge. • High pressure is required to increase the flow rate to speed elution without the loss of resolution. In HPLC better resolution is achieved by using small particle size of the stationary solid phase and by increase flow rate with increase in the pressure of the mobile phase. HPLC has high efficiency, high sensitivity, gives good resolution and also applicable to qualitative and quantitative analysis. When stationary phase is solid, the type of equilibrium between this phase and liquid mobile phase is termed as adsorption. hassan-alnajem
- 3. HPLC • High-performance liquid chromatography is a technique in analytical chemistry used to separate, identify, and quantify each component in a mixture. hassan-alnajem
- 4. HPLC Process High performance liquid chromatography is used to analyze liquid samples or liquid extract of samples. In HPLC sample is passed in high pressure solvent (mobile phase) through a steel tube column packed with sorbents (stationary phase). As the sample pass through the column, it interact with two phases at different rates. The difference in rate is primarily due to differ ence in polarity for analytes. The analytes that have least amount of interaction with stationary phase or most amount of inter action with mobile phase will exit the column faster. Repeated interaction along with length of column, effect the separation of analyte. As the analyte exit the column it is detected by detector (refractive index / UV absorbance). The amount of Analyte leaving the column will determine the intensity of signal produced in the detector. The detector measures the signal peak at each analyte leaves the column. By comparing time it take to peak show up is (retention time) with the retention time of known mixture (usually calibrated mixtures). Measuring signal intensity & comparing with known mixture, quantification can be done. hassan-alnajem
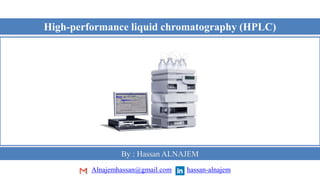
- 5. HPLC Process A HPLC consists of following basic parts 1) Injectors 2) MOBILE PHASE (liquid) 3) Pump 4) Column 5) UV Detector /Refractive Index 6) Data recorder system • Selection of column, detector & pressure profiles play important role in analysis of sample by HPLC hassan-alnajem
- 6. Injection hassan-alnajem 1) injection 1) Manual injection( Rheodyne / Valco injectors) Injection is done through specially designed 6-port rotary injection valve. The sample is introduced at atmospheric pressure by a syringe into a constant volume loop. In the LOAD position the loop is not in the path of the mobile phase. By rotating to the INJECT position thesample in the loop is moved by the mobile phase stream into the column. It is important to allow some sample to flow into waste from loop so as to ensure there are no air bubbles in the loop and previously used sample is completely washed out to prevent memory effects.
- 7. Injection hassan-alnajem 1) Injection 2) Automatic Injection It is attachment to HPLC and injecting the samples. Introduce sample automatically into the inl et of column by means of carrier liquid
- 8. Mobile phase hassan-alnajem 2) Mobile phase Choice of mobile phase depends on the mode of HPLC operation. Types Of Mobile Phase: 1) Mobile Phases in Reverse Phase chromatography 2) Mobile Phases in Normal Phase Chromatography 3) Mobile Phases in Ion Exchange Chromatography 4) Mobile Phases for Size Exclusion Chromatography
- 9. 3) Column (Stationary phase) hassan-alnajem 3) Column (Stationary phase) Column is the heart of chromatography system, where separation takes place. The column tubing can be made from fused silica, glass and stainless steel in a straight or coiled form. Columns are classified by tubing dimension and packing material. The sample is injected into the mobile phase stream just before the front of the column. The column is designed to produce the separation of different components. Separation is achieved by proper selection of the column & temperature profile of the column.
- 10. 4) Detector hassan-alnajem 4) Detector Detector is called brain of chromatography; it indicates the presence and measure the amount of components in the column effluent. Components separated by column elutes to detector, where it is detected in dimension of space & time. There are many types of detector based on applications. Choice of detector will depend on factor such as the concentration level to be measured and the nature of separated components. Detector used in analysis of additives is UV/RI detector. Detector is made up of Procelain, Quartz, platinium and specialize d steel. Each component of the mixture reaches the detector at a different time and produces a signal at a characteristic time called a retention time (RT).
- 11. 4) Detector 4) Detector Types of Detectors: 1) UV-VIS Detector 2) Photo Diode Array Detector 3) Fluorescence Detector 4) Mass Spectroscopic Detector hassan-alnajem
- 12. 4) Detector 5) Control & Data recording (recorder) The detector response output is sent to an amplifier, that modifies the signal with appropriate range and is processed through computer system and chromatograph is presented on printer. The progress of the sample is monitored on the computer monitor in graphical form that displays detector response as a function of run time & absorbance. Main function of Computer is data acquisition & processing. In chromatographic print out number of peak correlates with the number of components present in sample. The area under each peak correlates with the relative amount of that component in the sample. If standard information is available, the retention time under defined conditions can be used to identify each component. Generally detector response is plotted in y axis and retention time in x axis. hassan-alnajem
- 13. hassan-alnajem Thank you By : Hassan ALNAJEM Alnajemhassan@gmail.com