
Recommended
Recommended
More Related Content
Similar to Transcript PHY 21041 Lab 8 Hi again! Well back in Lab 4, y.docx
Similar to Transcript PHY 21041 Lab 8 Hi again! Well back in Lab 4, y.docx (19)
More from turveycharlyn
More from turveycharlyn (20)
Recently uploaded
Recently uploaded (20)
Transcript PHY 21041 Lab 8 Hi again! Well back in Lab 4, y.docx
- 1. Transcript: PHY 21041 Lab 8 Hi again! Well back in Lab 4, you measured the speed of sound in two different ways. That’s quite an accomplishment because sound travels as fast as a bullet or a jet plane. In this lab, your mission‐ should you decide to accept it‐ is to m easure the speed of light! Light‐ about a million times faster than sound. And it may soun d crazy, but one way to do that‐to measure the speed of light‐ is to use a microwave safe plate, and uh, marshmallows, or chocolate chips, or a candy car. This one fell over. I’ll just eat. Okay, not the speed of light, exactly, but of microwaves, a cousi n of light. Use an ordinary microwave oven, take out the tray inside and the roller mechanism, so it won’t rotate, put the plate of marshmallows or chocolate inside, set it for about thirty seconds or so and let it run. What you’ll see when you take the plate out , is little melted spots in the marshmallows or chocolate. They correspond to the locatio ns of the antinode of the standing wave inside the oven. You want to measure the dis tance in centimeters between those hot spots as accurately as you can, then follow th e directions in Learn. And believe it or not, you’ll be able to calculate the speed of mi crowaves, and the speed of light! You’ll also see from this of course, why it is that mic rowave ovens have those
- 2. turntables to move the food through those antinode hot spots to heat it more evenly. We have a more high‐tech way to measure the speed of light dir ectly, as well, with this equipment. On the left we have a precision, high speed oscillos cope. In the center; a speed of light module kit; on the right side, a spool of 20 meters of fiber optic cable‐ it looks like wire, but it’s actually plastic fiber. Here we have a li ttle light emitting diode that gives off very brief, very rapid pulses of light. If you look ed inside the hole, here, you’d see a steady red light because it happens too fast for us to see. The light travels out of here, around and around and around this fiber optic cable‐ 20 meters of cable, a little more than 60 feet of cable, comes back i n here, where if you see, by a photo transistor. All this circuitry just runs these two devices here. These wires bring the signals over to the oscilloscope. On the oscilloscope, the top track shows the pulse as being sent out, and the bottom track or graph shows the pulse being received. There will be a picture of this in the instructions on Learn, and from that you’ll be able to measure t he time delay between here and here. That’s the time it took for light to travel 20 mete rs. It’s amazing we can measure something as fast as light going in such a short distanc e as 20 meters, just amazing!
- 3. macaulay.cuny.edu Kent State University Act IIILab 8 Lab 8 Measuring the speed of light The idea: Part 1 of this lab is short and sweet – literally! Part 2 is not bad either. There is something special about the speed of light. No object can ever travel that fast. Not even an electron, the smallest bit of matter we know, can move that fast; there is not enough energy in the entire universe to make even one electron move at the speed of light. But light can travel that fast, because it is not an object. Light is a phenomenon, electric and magnetic fields tumbling over each other, re- creating each other, through space. Now when physics folks say ‘light,’ they mean – besides ‘not heavy’ – light that we can see, plus all the relatives of light, other electromagnetic waves. Gamma rays, X-rays, ultraviolet, visible and infrared light, microwaves, and radio waves – they are all the same phenomenon, but of different frequency. And since we know that the medium,
- 4. not the frequency, determines the speed of a wave, if we can measure the speed of any of those forms, we know the speed of all of them. Your microwave oven creates electromagnetic waves of a known frequency. In Part 1 of this lab you will measure their wavelength, and can then easily calculate their speed. In Part 2 you will measure the speed of visible light, using data from an electronic apparatus, and an oscilloscope stretched to its limit. Let’s go! What you’ll learn: By the end of this you will understand why most microwave ovens have rotating turntables. More related to this course, you will learn 1) how to measure the wavelength of a microwave, 2) two ways to calculate the speed and expected speed of light, and 3) how to do calculations involving index of refraction. 8.1 What you’ll need: Microwave oven Small metric ruler Calculator Microwave-safe glass dish or paper plate Miniature marshmallows or chocolate chips or a large chocolate bar Image of an oscilloscope screen
- 5. What you’ll do: Part 1 1) Remove the turntable and the bearing ring from your microwave oven. See if you can find a shallow, rectangular glass dish that fits nicely in the microwave oven. If not, a paper or foam plate will do. 2) Line the dish with marshmallows standing on their ends, one layer thick. Or tile over the paper plate with marshmallows standing on end. Or, spread a thin layer of chocolate chips over a paper or foam plate, or, unwrap a large chocolate bar and place it on a paper plate. Whatever you chose to use, place it in the microwave oven and heat for a few seconds at a time until you see the marshmallows or chocolate start to soften or melt in certain hot spots. Don’t heat too long, or the hot spots will grow and become difficult to measure. 3) Remove the dish or plate from the oven and carefully measure from the center of one hot spot to the center of the next, in cm. You may you need to make several measurements and average them out. Or you may decide to eat the marshmallows or the chocolate and start over. That’s fine with me. But seriously, record the distance between the hot spots on the Report Sheet.
- 6. 4) The hot spots appear at the antinodes of the standing wave that forms inside the oven. As with any standing wave, the distance between two successive antinodes is one-half wavelength. Double the measurement from Step 3, convert it to meters, and record that measure of the wavelength on the Report Sheet. You are almost done already! 5) Look up on the internet the frequency of the microwaves produced in microwave ovens. You may find the answer in terms of Gigahertz (billions of hertz) or Megahertz (millions of hertz). Whichever you found, multiply by a billion or a million, respectively, to convert the frequency to Hz and record that number. 8.2 6) Finally, multiply the frequency from Step 5 times the wavelength from Step 4. Round to two digits and the correct number of zeroes and record it in the table on the Report Sheet. Technically, we have measured the speed of microwaves, and therefore light, through air. The value is only three-hundredths of a percent lower than the speed of light in a vacuum, and that is well within the range of
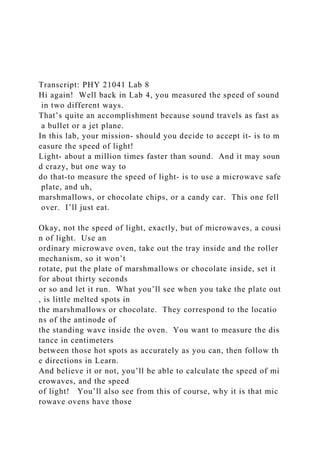
- 7. experimental error, so we can ignore the difference. Part 2 In this part of the lab you will measure the speed of light rather passively, I’m afraid, as this lab is not conducive to controlling by remote access, as you did in Labs 3 and 7. In Smith Hall we have electronic kits that produce a series of extremely short pulses of laser light from the blue upper connector on the right side. They travel through a 20.0 m long piece of fiber optic cable, and are received by a detector in the lower black connector on the right side. A high speed oscilloscope monitors both the outgoing and incoming signals through those two long black connectors that you see in the photo. ∫ to a 20 m long spool of fiber optic cableª back from the spool of cable 8.3 The upper channel trace on the oscilloscope screen below displays a frog-on-a-post graph of the light pulses as they are emitted, and the
- 8. lower line on the oscilloscope shows the pulses as they are received. If light traveled infinitely fast, the peaks in the two traces would line up. But even though the speed of light is the fastest known speed in the universe, it is not infinite! Light takes a tiny bit of time to travel any distance, even 20 meters. As a result, the lower trace on the screen is shifted a little to the right. The difference in the position of the two peaks tells the time for light to travel 20.0 m. 7) Open and print the enlarged image of the oscilloscope screen, in the same item as these instructions. Use the time scale information on that page, and as carefully as you possibly can, estimate the time delay caused by passing the light through the cable. Record that time, in seconds, on the Report Sheet. 8) Calculate the speed of light in the plastic cable, knowing that it traveled 20.0 m in the time you just found in step 8. 9) There is just one complication. Light travels more slowly in any material, such as the plastic in this cable, than in a vacuum. The speed of light in some substance is related to the speed of light in a vacuum, c, by this expression:
- 9. n = speed of light in vacuum/speed of light in some material n = c/v where v is the speed of light in a material and n is called the index of refraction of the that material. Think of n as the slowing-down factor, or how strongly light is bothered or pestered by the medium – how much light is affected by it. The manufacturer of the fiber optic cable reports that the value of n for their cables is 1.25. Use that value along with your measurement of the speed of light in the cable to estimate the speed of light in a vacuum, c, and record it. 8.4 10) You know from the companion class that the speed of light, to two decimal places, is 3.00 x 10⁸ m/s, or 300,000,000 m/s. Calculate the percent difference between each of your estimates for the speed of light, from Parts 1 and 2, and that known speed. Enter those percent differences on the Report Sheet Web extension One of the best measurements ever made of the speed of light
- 10. was accomplished by Albert Michelson and E. W. Morley at what is now Case Western Reserve University in Cleveland. Find out what year they made that measurement, and the value they found for the speed of light. Be sure to include the web address of the site where you found the information. 8.5 Kent State University Act IIILab 8 Measuring the speed of lightReport sheet Name Objective: To 1) measure the wavelength of a microwave, 2) calculate the speed of light in two ways, and3) perform calculations involving index of refraction.Data: Part 1 Distance between hot spots,cmWavelength of microwave,cmWavelength of microwave,m Frequency of microwaves,Ghz or MhzFrequency of microwaves,HzSpeed of microwaves andspeed of light, m/s Part 2 Number of small ticksbetween peaksTime between peaks, s Speed of light in the fiberoptic plastic, m/sSpeed of light in vacuum,m/sPercent difference fromknown speed, Part 1Percent
- 11. difference fromknown speed, Part 2 Comment on why either method (Part 1 or Part 2) may be more accurate. Web extensionWhen did Michelson and Morley, in Cleveland, make their precisemeasurement of the speed of light? What did they measure for its speed?What source did you consult for your answers? PR Photo (Proof you Really did the experiment)Upload a photo of you with the melted marshmallows or chocolate. Kent State University Act IILab 4 Lab 4 Measuring the speed of sound Report sheet Name Objective: To 1) measure the speed of sound outdoors, 2) capture a wave and measure its wavelength, and 3) demonstrate that the speed of sound depends on the medium through which it travels. Data: Table for Part 1
- 12. Time for sound to travel, sDistance sound traveled, mSpeed of sound, m/sAir temperature outdoors, oC Table for Part 2 Frequency, f, Hz Length of air column, L, cm Length of air column, L, m Wavelength, ë, m Speed of sound, m/s Average Air temperature indoors, oC For both parts Your expected speed of sound for Part 1, based on the air temperature, m/s Your expected speed of sound for Part 2, based on the air temperature, m/s Which of the methods in this experiment came closer to the expected speed of sound? Why might you expect one of these methods to be more or less accurate than the other?
- 13. Web extension In your search of the internet, who do you think should get credit for theearliest measurement of the speed of sound? When did that person make the measurement? How did he or she make the measurement? PR Photo (Proof you Really did the experiment) Submit a photo of you performing either part of this experiment. MyTextField: Isra TextField__2411235082793: TextField__2411548142185: TextField__2412479203183: TextField__2412548549225: TextField__2412551619489: TextField__2412554277885: TextField__2412559402469: TextField__2412563487179: TextField__2412588455848: TextField__2412592686071: TextField__2412595877075: TextField__2412599043506: TextField__2412616542852: TextField__2412621062973: TextField__2412624011497: TextField__2412637909909: TextField__2412643711073: TextField__2412648641902: TextField__2412652364394: TextField__2412658648943: TextField__2412662951776: TextField__2412667253922: TextField__2412672861754: TextField__2412676874001: TextField__2412689636766: TextField__2412693721474: TextField__2412699885548: TextField__2412704671138: TextField__3403331240464: TextField__2413003447039: TextField__3403552502805: TextField__2415915981882: MyMultiLineTextField: TextField__2416381052455: TextField__2416766940243: TextEditBox__2416888308235: TextField__2411542631331: TextField__2411542631332:
- 14. macaulay.cuny.edu Kent State University Act II Lab 4 Lab 4 Measuring the speed of sound The idea: By our standards, sound travels super fast, about the speed of a fast bullet. Even so, we can measure that speed in the lab. Today you will measure the speed of sound in two ways. The first takes advantage of the distance learning format and the wide open spaces outside a conventional laboratory (Part 1). The other is a clever indirect method (Part 2) that students use in the face-to-face version of this course. What you’ll learn: By the end of this experiment you will understand 1) how to measure the speed of sound outdoors, 2) how to capture a wave in a pipe and measure its wavelength, and 3) that the speed of sound depends only on the medium through which it travels. What you’ll need: Part 1 Stopwatch or stopwatch function on your phone Bell tower that chimes on the hour
- 15. Part 2 Deep bucket or sink Piece of plastic pipe or other tube Pencil and ruler Computer with headphones or earbuds and Audacity program, or a tone generator app on your smartphone Willing assistant 3.1 What you’ll do: Part 1 1) This direct method works if you live in or near a town that has a bell tower that chimes on the hour, perhaps on a city building or a church. If you don’t, come to Kent for a morning or afternoon. Kent has two chimes – the University Library, and St. Patrick’s Church on N. DePeyster Street, just east of downtown. With a stopwatch or other timer that will run for more than an hour, stand as close to the tower as you can, just before any given hour. Decide when in the cycle of chimes to start your timer. Both towers in Kent play the four-line Westminster chime before the actual gongs for the hour, so if I were doing the experiment, I would use the Westminster chime as a ‘get-ready’ signal, and then start timing on the first gong following the chimes.
- 16. Let the timer run; do not disturb it! 2) Go to a place in town where you can hear the tower from some distance, at least a few blocks, away. For a good guideline, if you can still see the tower or church but in the distance, you are probably in a good spot. Have lunch or talk with a friend for a while. Then, just before the next hour, wait for the same chime sequence and stand ready. At the same point in the cycle as before, stop the timer. Now, had you been in the same place both times, your timer would read exactly one hour. But it won’t, since you moved a distance away from the tower. The extra time is the time required for the sound of the gong to travel the distance between the tower and your new location. In other words, subtract one hour from the time you measured, and that is the travel time for the sound. Record that time, in seconds, on the Report Sheet. 3) At your convenience go to Mapquest or Google Maps on your computer and generate a map that includes both the tower location and the spot where you stood an hour later. Locate them precisely on the map; it may help to print it out and mark the spots carefully on the printed map. Measure the distance between the two points as
- 17. accurately as possible using a metric ruler. Then measure the length of the metric distance scale on the map. Set up a simple proportion: number of meters on distance scale distance from tower -------------------------------------- = ------------------------------ length of distance scale on map distance on map 3.2 A portion of the Google Maps image for Kent State University. The lower red X marks the location of the bell tower, where the chimes are housed. The upper X designates where I was standing while recording the introductory video for Lab 4. Notice the distance scale in the red oval. Cross-multiply and solve for the distance from the tower. We want the distance in meters, and as you see from inside the red oval on this map, Google Maps measures in feet. But that is no problem for Physics students! Simply divide the number of feet that the sound traveled by 3.28 feet per meter. Record that distance on the Report Sheet. 4) Divide the distance from Step 3 by the time from Step 2, and round off to a whole number. That’s one estimate of the speed of sound.
- 18. 5) Find and record the outside air temperature in oC. If you can only find the temperature in oF, check Google for how to convert the temperature to oC. Part 2 6) You know that for any wave, v = f ë. Here you will use a computer program or a phone app to make a sound wave with a known frequency, and a wavelength that you can measure. Multiplying those together gives the speed of the wave. 3.3 Resonance is that easy transfer of wave energy from one object to another when the frequencies match. One object is an earbud or phone producing a sound of known frequency, and the other is a column of air in a small piece of plastic pipe or other tube, where you will adjust the length of the air column until its frequency matches the tuning fork. You’ll know they match because the air in the pipe will ‘sing along’ with the earbud! If you happen to have some plastic pipe around the house, from 3/4" to 2" diameter and a pipe cutter, lop off a section about 18 inches
- 19. (or 45 cm) long. Now don’t laugh; some people out there will actually have that lying around. For those of you who do not include pipe cutters among your possessions, you have many inexpensive options. Lowes and Home Depot both sell two-foot long sections of plastic pipe of many different diameters. Lowes also has a great item for this experiment, a 16 inch long straight piece of plastic pipe for sink drain repairs. Even cheaper, and more available for some of you, is the plastic tube that some golfers use in their golf bags to keep the club shafts from rattling into one another. You can buy a long tube for only a couple of dollars and cut it into 16 in or 18 in long pieces with good scissors or a razor knife. Any sporting goods store will carry those tubes. You could even use the cardboard tube from a roll of paper towels. It will get soggy, but will last long enough for your purposes. And in case none of those will work for you, we have included in your free packet for this course a sheet of transparency film that you can roll into a straight tube about an inch or two in diameter, and then tape closed along the edge. You’ll also need a container of water about as deep as the pipe
- 20. is long. You may have a bucket around, or a deep washtub sink. The five gallon paint buckets that both Lowes and Home Depot sell for only a few dollars are great – and useful for lots of other stuff after the course is done. Do you have a tall vase? That would be perfect. Or an aquarium? Or a bathtub? Depending on its design, you could even use a toilet – everybody has one of them. Be sure to flush first! The more shallow the container, the higher the frequencies you will have to use, because you already know that the higher the frequency, 3.4 the shorter the wave. Remember, it’s not the width or volume of the container that matters, only the depth. 7) Fill the container or sink so that the water is almost as deep as whatever pipe or tube you are using. If you use the transparency sheet in the packet, hold it gently so that it stays round, and keep the zero end of the scale printed on it toward the top. 8) Plug headphones or earbuds into the audio output of your
- 21. computer. Run the Audacity program that you used previously, but now you will use it to generate a tone. Click Generate, then Track. In the pop-up, choose Sine and an amplitude of 1. Enter a frequency in the approximate range of 180 Hz to 500 Hz, then click OK. Record the frequency in the data table on the Report Sheet for this lab. If you have a smart phone, you could also download any free app that generates musical tones. For my Android phone, I found one called – guess what? – Tone Generator. In that case you would hold the speaker of the phone above the tube, in place of the computer headphone, as pictured. 9) Click the Play button (|) in Audacity, or have a friend click it. With one hand, hold the pipe straight up so that the lower end is just under the water. With the other, hold the headphone or earbud at the upper end of the pipe. If you are using a headphone, leave a little space between it and the upper end of the pipe, as shown. Then smoothly and gradually slide the plastic tube and headphone downward, together as one unit, until you suddenly hear a louder sound. It’s louder because the air in the pipe is now in resonance with the
- 22. headphone! You could say that the air inside the tube is singing along with the headphone, so the sound is louder. Move the pipe up and down just a little to find the loudest resonance. While you hold very still, your assistant can use a pencil to mark the water level on the plastic tube, as accurately as possible. Then you can stop the annoying sound source. 10) If you are using the tube you rolled up from your packet, you or your assistant can measure the level of the water right on the printed scale. If you are using any other kind of tube, remove it from the water and measure and record the length of the air column in the tube, which is the distance from the top of the tube down to the pencil mark. It’s better to measure in centimeters, but if you must use inches, multiply the 3.5 Since the pens lie diagonally, a pen a little longer than the cup still fits inside it. In the same way, we have to allow for the diameter of the pipe that ‘holds’ the wave.
- 23. shopapt.com length by 2.54 cm/in, and record it in the second column in the table, L in cm. 11) Divide the length of the air column that you measured by 100, to change the units to meters, and record that number in the third column. In a pipe closed at the bottom, only one-fourth of the wave is caught in the pipe in the fundamental mode. So, you should be able to multiply the length of the air column by four to find the wavelength. Now I wrote ‘should’ because in fact a pipe such as this one holds exactly one-fourth of a wave only if the pipe is very narrow compared with the wavelength. (If we used such a pipe – a glass tube from chemistry, or a really long straw – the sound in the tube is too faint to hear.) Acoustic books tell us that the proper formula, including the effect of the diameter of the pipe, looks like this: ë = 4 (L + 0.30 d) where L is the length of the air column in meters and d is the inside diameter of the pipe, also in meters. Measure the inside diameter of the pipe you used, ideally in cm. If you
- 24. used inches, multiply by 2.54 cm/in. Then divide that number by 100 mm/m and multiply by 0.30. As an example, suppose you used the plastic pipe for drain repair from Lowes. It is sold as 1-1/2" outside diameter, but inside, I measure it as 1-3/8.” That is 1.375 inches times 2.54 cm/in, or 3.49 cm. Dividing by 100 yields 0.0349 m, and multiplying that by 0.3 gives 0.0105 m (or 0.011 m). The equation now becomes ë = 4 (L + 0.0105) where L is in meters. Evaluate the expression and enter the wavelength in meters in the fourth column of the table on the Report Sheet. 12) Since v = f ë, multiply the frequency (the first column) times the wavelength (the fourth column) to find the speed. Round it to the nearest whole number and enter it in the fifth column. 13) Repeat steps 8 through 12 with four other frequencies. Since the speed of sound depends on the medium, the numbers in the last column should be about the same. Average them out and again round to the 3.6
- 25. nearest whole number. Record that number, your result from Part 1, in the last box in the table on the Report Sheet. 14) Almost done! Find a good estimate of the indoor temperature where you did your experiments, in oC. If you can only find the temperature in oF, check Google for how to convert the temperature to oC. Sound propagates at 331 m/s at zero oC, plus 0.6 m/s for each degree. For example, at 20 oC, sound waves advance at 331 m/s plus 20 times 0.6 m/s, or 331 m/s plus 12 m/s, or 343 m/s. See how that works? Record the expected speed of sound for both Parts 1 and 2 on the Report Sheet as well. 15) Finally, evaluate your results. How well did each method measure the speed of sound? That is, which method produced a result closer to the expected speed of sound? Speculate on why that method might have been more reliable. Web extension Browsing the web, I found sites claiming that at least three different people first measured the speed of sound in air. Carry on the search – find the earliest date that someone actually measured the speed of
- 26. sound. Tell me who did it, how, and when. Be sure to include the basic web address where you found your answer. 3.7 Transcript: PHY 21041 Lab 4 In this lab today, we’re going to measure the speed of sound in t wo ways; one direct, one indirect. I’m here at the base of the library tower. If you d on’t live in Kent, find a place where there’s a bell tower in your town and start your cell phone stopwatch exactly on some signal you decide. I’m going to use the first go ng after the four‐part Winchester chime. Let’s wait for that. Okay, here it is. I’m go ing to start now. Instead, you’ll go somewhere else in town where you can still h ear the library chimes. We’re here at the practice field by Music and Speech. When I h ear the gong now, and stop my watch it won’t show one hour. It will show one hour pl us the extra few seconds for sound to get to me from the library tower back there. Those extra few seconds, that’s the time for the sound to travel. Sound travels as fast as a speeding bullet. But even so, it will be a significant amount of time to get from back there to over here. I would then go to Google Maps, I’d find this location on the map
- 27. , I’d find the library tower on the map, and use the scale on the computer to figure o ut the exact distance from there to here. I’d divide that by those extra few seconds, a nd just like that, with the power of physics, there is the speed of sound. Let’s go back inside for the second part of our lab. In the rest o f Lab 4 we’re going to measure the speed of sound in a really clever, indirect way. We ’re going to catch a wave, or at least part of a wave and measure its wavelength. An d from that calculate its speed. Here are some of things you’re going to need. First you ’ll need a sun source that will make a reliable frequency. I downloaded a little signal gen erator app on my phone. You can also use your laptop with the Audacity program that yo u’ve downloaded. And either a computer speaker, or maybe better yet an ear bud or hea dphone. You need a container of water. This is a giant, cool vase I happen to have a t home. Anything that’s about a foot deep will do. You could use a bucket, a deep sink, or even an aquarium, the fish probably wouldn’t mind too much. You need some kin d of a pipe or tube. You could buy a very inexpensive piece plastic from Lowe’s or Hom e Depot. You could even use the cardboard tube from a paper towel roll, toilet paper wou ld be too short, but a paper towel roll could work. It will get soggy, but it will last lo ng enough to do the experiment. And we have also, is supplied in the kits you’ll hav e for this class, is a piece of plastic transparency film. With a piece of tape, you can mak
- 28. e it into a pipe. And use a ruler to measure the length of the pipe and its diameter. Let me show you what to do, how you can capture a wave and m easure the speed of sound. You may have a tube or type of some kind already. If y ou want to make one from this sheet we gave you, just roll this up long ways. It does n’t matter exactly what diameter you use, all that matters is that it’s not real big or real small. And you want it to be as straight as possible, so it isn’t wider at one end than it i s at the other. You can just roll this up and tape it closed. And you have a tube just lik e that, that you can use. This will show better on camera, I’m going to use this one inste ad. Set your sound source for any frequency of about 320 hertz or higher. I have m y phone set to generate a tone of 400 hertz. What I’m going to do is hold speaker with my thumb. If you’re using your laptop, you can use a headphone or ear bud at this location. Hold it a little bit above the end of the tube, and the lower it down into the water. You’ll hear somethi ng remarkable. Let’s try this. Ah‐ha! At one point the sound will be a lot louder. Why becau se you’re hearing two sound sources; this one, plus the air inside singing along at the same frequency. This is
- 29. another example of resonance, the easy transfer of energy to one medium to another. What you want to do is fine tune this. Move this up and down g radually, until you hear the loudest possible sound. You may need a friend to help you, then, to measure how long this is and to get the most precise measurement you can. You’ll also need to measure the inside diameter‐not the outside‐ the inside diameter of the pipe or tube or whichever you use. We need to know how bi g this is across, on the inside. And do this as accurately as you can in centimeters and millimeters. From the lab directions, you’ll see what to do with those measur ements to figure out the speed of sound in its clever, indirect way. Now the speed of sound depends on temperature as well. You’ll need to know the temperature of the room where you’re doing the experiment or t he temperature of the air outside when you do that part of the experiment inside. Have fun! Kent State University Act III Lab 10
- 30. Lab 10 Exploring color addition and subtraction Report sheet Name Objective: To 1) demonstrate how additive and subtractive primary colors are related, 2) model how televisions, computer monitors, and stage lights create colors by combining primary colors, and 3) determine the colors needed to generate any particular composite color. Data: Record the values of red, green, and blue needed to make the colors on the color wheel. Red Green Blue 1) Yellow 2) Orange 3) Red 4) Crimson 5) Magenta 6) Violet 7) Blue
- 31. 8) Cobalt 9) Cyan 10) Turquoise 11) Green 12) Yellow - Green 9.1 Slider settings for your color, based on your birthdate: Red Green Blue Describe the resulting color. Subtractive color mixing results Incoming light Subtractive pigments (filters) magenta yellow cyan magenta + yellow magenta + cyan
- 32. yellow + cyan white red green blue magenta yellow cyan 9.2 Web extension All television sets and computer monitors can only produce red, green, and blue – until recently. Why did Sharp add a fourth color, yellow, on their Quattro line of flat-screen televisions? Source you consulted:
- 33. PR Photo (Proof you Really did the experiment) Take a screenshot of your computer while it is displaying your color, based on your birthdate, and submit it. (On Windows machines, press PrintScreen, then open Paint and click Paste. Then click Save As and name your file. On Macs, press Command-Shift-3. The screenshot is added to your desktop.) 9.3 MyTextField: TextField__1868743585960: TextField__1869049951764: TextField__1869054930593: TextField__1869200246420: TextField__1869200266710: TextField__1869265460923: TextField__1869750858317: TextField__1869750951149: TextField__1869750972307: TextField__1869309355342: TextField__1869309376332: TextField__1869309397311: TextField__1869370580020: TextField__1869370602851: TextField__1869370626168: TextField__1869413991981: TextField__1869414014499: TextField__1869414038005: TextField__1869477755460: TextField__1869477781296: TextField__1869477805927: TextField__1869525323968: TextField__1869525349965: TextField__1869525370442: TextField__1869558148390: TextField__1869558175162: TextField__1869558201355: TextField__1869597837684: TextField__1869597864921: TextField__1869597885984: TextField__1869614757400: TextField__1869614784891: TextField__1869614812687: TextField__1869623797581: TextField__1869623821541:
- 34. TextField__1869623844848: TextField__1870617571279: TextField__1870698325351: TextField__1870748892066: TextEditBox__1870824312654: TextField__8931522675279: TextField__8931595908046: TextField__8931601588299: TextField__8931604098375: TextField__8931606483194: TextField__8931609251388: TextField__8931627143418: TextField__8931632168787: TextField__8931634524842: TextField__8931636818685: TextField__8931639253155: TextField__8931641859270: TextField__8931657212420: TextField__8931659228047: TextField__8931661192217: TextField__8931663421940: TextField__8931665640062: TextField__8931667712199: TextField__8931684558745: TextField__8931686726748: TextField__8931688676575: TextField__8931690612534: TextField__8931692640958: TextField__8931694933157: TextField__8931713743622: TextField__8931715888811: TextField__8931717801059: TextField__8931719828756: TextField__8931721872407: TextField__8931723981741: TextField__8931873205840: TextField__8931877762378: TextField__8931881635795: TextField__8931885562474: TextField__8931890315362: TextField__8931894295636: TextField__8931994157301: TextField__8931997698814: TextField__8932001854410: TextField__8932017684256: TextField__8932022264909: TextField__8932026441530: TextEditBox__5784639619357: TextField__1675500727948: Oscilloscope image for Lab 8 Each small tick mark along the x axis represents 5.0 x 10⁻⁹ sec, or 5.0 nanoseconds, or 0.0000000050 sec.
- 35. macaulay.cuny.edu Kent State University Act IV Lab 12 Exploring refraction in lenses The idea: Light is the fastest-moving phenomenon in the universe, but ordinary stuff – air, water, glass – slows it down appreciably. If light moves from one medium to another ‘head-on,’ so to speak, it slows down but it continues in the same direction. But if light enters a new medium at an angle, its direction of motion changes along with its speed. That fact, alone, makes possible our ability to bring light to a focus, to use and control beams of light for practical purposes and for entertainment, and to see! The great gift of eyesight depends completely on light slowing and bending in denser media. But how does light ‘know’ how much to bend? Think about three light rays, as in the simple diagram at the left, scattering off the tip of the object, an arrow standing upright. (Why do physics books always use arrows as objects? How often do you take a picture of an arrow standing
- 36. on its tail?) Of course there are uncountable numbers of rays coming from the arrow tip, and every other point along it – as well as everything else! How does a simple, inanimate curved piece of glass sort them all out into an image? How does your eye do it? But back to those three rays. What happens to them, happens to all. One explanation of why they come to a focus is that the farther the ray strikes the lens from the center, the more obliquely it hits the surface, and the more strongly it bends. The red ray hits the surface at a pretty large angle, but it comes out at the exact same angle, and so the effects cancel for it and it passes straight through. The blue ray makes a smaller angle with the surface coming in, but a larger one going out, and so it is bent downward quite a bit. The purple ray makes the most glancing impact of all with the lens surface, so it bends the most. In short, rays that hit the lens farthest from the center bend the most, and they ‘need’ to bend the most to come together. A deeper explanation came from French mathematician Pierre Fermat. In 1662 he suggested that light always takes the least time – not the
- 37. shortest path, but the quickest! The red ray takes the most direct route of the three, but it goes through the thickest part of the lens and slows down the most. The purple ray obviously takes the most roundabout path, but it passes through the least amount of glass and so is ‘penalized’ the least. The trouble is, Fermat’s Principle of least time seems to suggest that light ‘knows’ ahead of time where it will end up, and then calculates, somehow, the quickest path. The best explanation comes from redefining distance. If we measure the path length of those three rays in human terms, using millimeters or inches, then the paths are of different length. But how does light measure distance? In terms of wavelengths! Because the frequency of light (its color) does not change in refraction, but the speed does change, the wavelength of light changes. All three rays in the diagram travel the same number of wavelengths, so the rays interfere constructively only at exactly one point. The red ray travels through the most glass, so its wavelength stays shorter for more cycles. The purple ray travels through the least glass, so it has relatively few short waves. The point where all the rays meet is the only point where all three rays arrive in step, in the same phase relationship as when they left the arrow tip. They all left together; they must
- 38. all arrive together if they are to form an image! The same wonder is at work when you read these letters. Light streaming off your computer monitor, or bouncing off these letters on a page, go off at the same instant, and almost as if the waves are holding hands, they arrive together at a point inside your eye. Try to keep that sense of wonder about everything you ever see! – even the mundane images in this experiment. What you’ll learn: By the end of this lab, you will understand how to 1) measure the focal length of a convex or converging lens, 2) predict where images form when refracted by a convex lens, and 3) explain why object distance and image distance are inversely related. What you’ll need: Lens from any reading glasses Yard stick or tape measure from your lab packet Scissors Transparent tape Index card from your lab packet Computer monitor to act as a light source Dark room Willing assistant What you’ll do: 1) Acquire a pair of simple, non-prescription reading glasses. Since you
- 39. won’t be harming them, you could just borrow a pair from most any older person you know. Or you could buy an inexpensive pair from a drug store or discount store. You might do especially well at dollar stores, or Goodwill. If you get a new pair with the power marked in diopters (such as +2.0) so much the better. 2) Next, make your own meter stick by cutting apart the strips printed on the card stock in your lab packet. Lay them accurately end to end and tape them together to make a flexible and temporary but accurate way to measure. You have enough strips to make a second one, as well, if you need it. 3) Now, measure the focal length of the lens. As illustrated in the introductory video, use a room that can be darkened well by closing doors and pulling shades. You may have to do the lab at night with the lights off, if you can’t darken the room enough by day. Bring along your assistant and your laptop to use as a light source. (If you use a desktop computer in a room that can’t be darkened well, as I do, then choose some other small light source – a flashlight, a candle, a small desk lamp – anything that is bright if you look at it, but that does
- 40. not pour a lot of light all over the room.) Turn up the brightness of your laptop as high as you can and get a large, high contrast image in your screen. In the introductory video I down- loaded a fat red arrow and enlarged it so it nearly filled the screen on a bright white background. Or, you could open a blank white word processor screen and type I LOVE PHYSICS, or maybe something else, in giant bold letters. Set the laptop on one end of a long table or counter, if you have one. If not, use the floor! Put your hand over one lens of the glasses, so that only one lens is clear and available for use. Hold the lens several feet away from the laptop screen; the biggest problem in this lab is starting with the lens too close to the laptop! Have your assistant hold the card several feet beyond the lens, as I demonstrated in the introductory video. Then slowly move the lens toward or away from the card until you can see an image of the laptop on the card. It won’t be a perfect photographic image, but it still should be pretty clear and recognizable. What kind of image is it, virtual or real? How do you know? Record your answers on the Report Sheet.
- 41. 4) With the lens in place and the image in focus on the card, have your trusty assistant measure, as accurately as possible, the distances from both sides of the lens, in centimeters. The distance from the lens to the laptop is the object distance, do. On the other side of the lens, the distance from the lens to the card is the image distance, di. Record both distances on the Report Sheet. 5) While you have everything more or less in place, repeat the process twice more. Have your assistant move the card farther away from the laptop or closer to it – but not very close! – and again move the lens back and forth until you see a reasonably clear image. Again, measure do and di for each of the two new trials and record them on the Report Sheet. 6) You can get up off the floor and turn the lights back on! Next, use the lens equation to solve for f, the focal length of the lens, from each of the three pairs of distances. That equation is: 1/f = 1/do + 1/di All three variables of interest are in the denominator; this is not the same as f = do + di!
- 42. You can use the equation as written, but here it is, solved for f: f = (do di) / (do + di) That is, the focal length of lens equals the product of the two distances divided by their sum. Calculate the focal length of the lens from each pair of numbers and round them to whole numbers. Record your results in the third column on the Report Sheet. 7) Zoom lenses on cameras can change their focal length, but one solid piece of glass or plastic, as you had in your hands, has one fixed focal length, so all of the focal length values should be more or less the same. (If so, good for you! If not, back into the dark to do them over!) Average out the three values of the focal length and again round it to a whole number. 8) The shorter the focal length of a lens, the more strongly it will magnify an image if you hold it close to, say, small print on paper. That’s seems backwards, in a way, that a smaller focal length would have a higher magnifying power, so opticians and reading glass makers
- 43. invented the diopter scale. By definition, the power of a lens in diopters is the reciprocal of its focal length, in meters. So, a +2.0 lens would have a focal length of 1/2.0 or ½ m. Since we are working in centimeters, we can say that the diopter power is 100 cm divided by the focal length in cm. Using the value from step 7, calculate the diopter power of your lens. Round it to the nearest 0.25. How does that compare with the manufacturer’s stated diopter value, if known? As a brief aside, why is the image not perfectly clear, when these are reading glasses, after all? It’s because when you are reading through them, you are using only the tiny part of the lens directly between your eye and the letters you are trying to read at any one time. But in this experiment, you are using the entire lens, all at once. It’s easy to make a lens that is accurate over a small portion of its surface, and much harder – and so, much more expensive – to make it accurate over the entire surface. That’s why inexpensive, one-time use cameras, like those left on the table for you at wedding receptions, always have small lenses and must use flash for most pictures. Expensive cameras have large diameter lenses which often cost more than the camera itself!
- 44. Web extension The f/ ratio or f/ number for camera lenses is defined as the focal length of the lens divided by its aperture, or diameter. What are some of the more-or-less standard values of f/ ratios? With each increase in f/ number, what happens to the brightness of light passing through the lens? Be sure to include the web address of your sources. Kent State University Act III Lab 9 Lab 9 Exploring polarization Report sheet Name Objective: To 1) detect the polarization direction of light, 2) determine which kinds of objects look different when viewed through a polarizer, and 3) produce color using crossed polarizers.
- 45. Data: Which way was your slide oriented when you drew the vertical line on its frame? Which way is the display on your computer oriented? List items or scenes you examined through your polarizer, and what you observed: 9.1 List some items that you held between your monitor screen and your polarizer that produced interesting effects. Web extension What are some animals that can discern polarized light? For any one of those animals, how does its ability to detect polarized light serve that species? Sources you consulted: PR Photo (Proof you Really did the experiment) Submit a photo that a friend took of you, looking through your polarizer at a piece of plastic in front of your monitor. 9.2
- 46. MyTextField: Group1: OffTextField__1610823267834: MyMultiLineTextField: TextEditBox__1611473390448: TextEditBox__1611585932200: TextEditBox__1611827664544: TextField__1675500727948: macaulay.cuny.edu Kent State University Act III Lab 10 Exploring color addition and subtraction The idea: You know from the companion course that color is truly in our own brains. Objects don’t have color, and neither does light. Light has only different frequencies or wavelengths, and objects have only traps that catch one frequency or another and scatter the rest. Our eyes and brains are tickled differently by each frequency, and in response our brains paint a particular color in that speck of our visual field. The whole world is a giant paint-by-number kit, and instead of little color codes printed on the canvas, we receive little frequency codes in the colorless light we see.
- 47. Only three frequencies of light are necessary to generate the illusion of all others – those that tickle our eyes in ways that we have learned to call particular shades of red, green, and blue. That’s all that televisions and computer monitors can ever generate, but they can make more than 16 million different colors from them! What you’ll learn: By the end of this lab you will understand 1) how additive and subtractive primary colors are related, 2) how televisions, computer monitors, and stage lights create colors by combining primary colors, and 3) the colors needed to generate any particular composite color. What you’ll need: Computer with internet connection What you’ll do: 1) With any browser of your choice, go to www.michaelbach.de/ot/col_mix and you will see an interesting and well-designed color simulator. 10.1 Click fullscreen and then at the lower left, click preview, pull down the menu, and click white, giving you total control of the program. 2) First, an easy exercise. Turn any two sliders up all the way,
- 48. while the third is off. Name on the Report Sheet the color that you see. Repeat the process until you have seen all three combinations of two colors each. Remember that the colors you see are illusions, painted by your brain as your eyes are tickled by two frequencies at once. All you ever see on the screen is red, green, or blue in various intensities. Use this color wheel for the next part of the lab. 3) Let’s number the color swatches, as the hours on a clock. So, yellow is number 1, violet is number 6, and yellow-green is number 12. For each swatch, adjust the color sliders on the computer so that the window on the screen matches each color as well as possible. You should see an easy pattern! Write on the Report Sheet the slider settings for each color that give the best match. The sliders are not numbered, but you can number then in your imagination from zero at the bottom of each slider up to 5. 4) Next, make “your color,” based on your birth date, as described below. www.urlnextdoor.com 10.2
- 49. Red – take the month number of your birth (for example, 3 for March or 9 for September) and multiply it by 0.41, to scale the month numbers out along the range of intensities. Record that number on the Report Sheet and set the red slider to that number. You will of course have to estimate the slider setting, since we are supposing that it indicates whole numbers starting from zero. Green – take the date of your birth during the month (for example, the 15 or the 22 ) and multiply it by 0.16. Record that number and set theth nd green slider to its value, again estimating as well as you can the slider setting that seems closest to the number you calculated. Blue – take the day of the week on which you were born, with Sunday equal to 1 and Saturday, 7. Multiply that number by 0.71, record it, and set the blue slider to it. (What? You don’t know what day of the week you were born? Go to http://www.timeanddate.com/calendar/generate.html Enter the year and the country in which you were born, and then scroll
- 50. down the calendar to see which day of the week matches your birth date.) You will see a color swatch that is unique to that day, one of more than 2500 possibilities. Think of it as your own personal color! Save it and post it on the Report Sheet. If you are using a PC, press PrintScreen to capture the screen to the Clipboard, and use any photo editing program to crop out everything but the color swatch in the black circle. Are you a Mac user? Then press Command-Shift-3 to automatically save a PNG file on your desktop. Use any photo program to crop out everything but the color swatch in the black circle. Describe the color as well as you can on the Report Sheet. Please remember that your color, as all of the colors produced in this lab, is an illusion from your eyes and brains. The color that you think you saw never really existed at all; it was simply the averaged signal from your eyes to your brain. Wow! 5) Now experiment a bit with color subtraction, as well. Set the spotlights to produce each of the colors indicated in the table on the 10.3
- 51. Report Sheet, and then insert the color filters by moving each slider all the way up. Record each result on the Report Sheet. Yes, there are many entries, but they go quickly, and the resulting table will be a great help for the homework and quiz in the lecture course! 6) Want more practice? Find a Post-it note, or an index card and a piece of tape, and use it to cover the right side of the screen, flush with the yellow filter, as shown on the next page, so that it hides the final color. Post-it note or index card here to cover the final color swatch. 7) Click auto run and watch as the spotlights and filters change randomly. Whenever you feel like it, click stop, then consider the color of the light coming in to the set of filters and what each filter is removing. Make your best guess of the final color, then lift the Post-it note or index card to peek and see if you were correct. You don’t need to record any of these results; this is just a suggestion for more practice. I hope that you will never think of color in quite the same way again! Web extension
- 52. All television sets and computer monitors can only produce red, green, and blue – until now. Why did Sharp add a fourth color, yellow, on their Quattro line of flat-screen televisions? Be sure to include the basic web address where you found your answer. 10.4 Transcript: PHY 21041 Lab 9 Like my new glasses? You might recognize them as IMAX 3D movie glasses. It turns out, 3D movies are one of the most important applications of polariz ed light in entertainment and the arts. They act like gate keepers. They m ake sure that light coming from the screen that’s meant for my left eye only gets in my left eye, and light meant for my right eye only gets in on that side. The little pola rizer we supplied in the kit for the class, is a lot like this, but it’s more of a monocle! O h I say. The first thing we have to do, is figure out the polarization dire ctor in your filter. We’ll do that out in the hall. Light can be polarized by reflecting off a smooth surface. So find a smooth hallway, a smooth, polished hallway, and take a look a long the floor at about a
- 53. 45 degree angle from your point of view. Hold the polarizer up close to your eye, and rotate it, and watch some of the reflections‐not all‐ but some of the reflections go away. Then you want to make a mark on the frame of the polarizer ver tically. Because that means you found the vertical orientation that blocks the horizon tally polarized light coming off the floor. Let’s take a look in the camera and show you what this would lo ok like. We’re going to put the polarizer in front of the camera lens and rotate it. I hop e you see that some of those reflections went dark. It turns out that most flat screen displays work because of polari zed light, as you will see in the course. When I hold the polarizer in front of the laptop, you can see that I can allow the light from the screen to pass through or not to pass thr ough. I can block the light by turning the polarizer about 45 degrees. Explore your o wn environment, looking for things that look different through the polarizer in your kit. We zoomed in tight on my computer screen. This is a source of polarized light. We humans, can’t detect polarized light directly. But Keith is now going to hold the polarizer in front of the camera, and rotate it to make the screen go dark. We now have cross polarizers‐ virtually no light is getting through. But amaz ingly, if I hold some plastic objects in place, your able to rotate the plane of polarize
- 54. d light different colors are rotated by different amounts. And you can see amazing colo rs in this hard, plastic fork or in this hard plastic tape container. If you happen to hav e Karo syrup‐ corn syrup around, that also gives a fantastic view. The glucose molecules in there are able to rotate polarized light and the thickness of the syrup because it’s a curved bottle determines what color will be rotated to come through. I hope you have fun with polarized light in this lab. macaulay.cuny.edu Kent State University Act III Lab 9 Lab 9 Exploring polarized light The idea: If you have not yet watched and listened to the narrated PowerPoint presentations “Wave properties of light - part 3" and “A little on liquid crystal displays,” please go to the companion course page in Learn and study them. By now you know that we humans can see only the tiniest slice
- 55. of all the light waves out there. Not only that, we are unable to detect the direction in which the changing electric fields of light oscillate – that is, we can’t detect polarization of light. But with just a little help and a flat- screen computer monitor, we can explore this otherwise hidden and unknown aspect of light. The results can be surprising and beautiful! Remember that a polarizer – a thin plastic film in a cardboard frame, in this case – is a sort of gatekeeper, like a bouncer in an exclusive club. Just as some people with certain characteristics are let in to the club and others are kept out, the polarizer allows light vibrating in one plane to get through. The difference with the bouncer analogy is that people who don’t make the cut are simply turned away at the door, but a polarizer absorbs and completely annihilates light that doesn’t get through! It’s risky business getting in to the Polarizer Club! What you’ll learn: By the end of this lab you will understand 1) how to detect the polarization direction of light, 2) which kinds of objects look different when viewed through a polarizer, and 3) how to produce color using crossed polarizers. 9.1
- 56. What you’ll need: Flat-screen computer monitor Polarizer from the lab packet Pencil or pen A few pieces of hard clear plastic from around your home or dorm room What you’ll do: 1) First, you need to determine the orientation of the polarizer in your packet. The film is in a rather plain cardboard frame with no indication of the vibration direction that will be blocked. Find a smooth, shiny hallway with multiple ceiling lights. Office building, school building, and dorm hallways are great. (In a pinch, you could use something as simple as a glass of water positioned so that an overhead light reflects up off the water to your eyes at about a 45o angle.) Look down the hallway at the series of reflections of the ceiling lights off the floor. Choose a reflection about six feet or so in front of you. Close one eye and hold the polarizer close to your open eye, looking through it at the reflection ahead of you. Slowly rotate the polarizer left or right as you continue looking through it, until the reflection seems to disappear, mostly or even completely. One edge or another of the frame
- 57. will be parallel to the floor; the polarizer should not be diagonal or askew. Use a pencil or pen to make a vertical line, perpendicular to the floor, on the edge of your polarizer frame. The light bouncing off the floor is polarized horizontally, parallel with the floor. That is, light with its electric field component parallel with the floor will skip off the surface and bounce up, but light with its field oscillating vertically will take a dive into the floor polish and be absorbed. The line you draw on the polarizer frame indicates the vibration direction of the light that makes it through; drawing the line vertically when the reflected light is extinguished shows that the orientation of the polarizer is opposite that of the reflected light. Record on the Report Sheet the direction of the line you drew. 2) Now use one eye again to look through your polarizer at your computer monitor. Slowly rotate the polarizer right or left and you are likely to see an amazing sight – light from your monitor will be blocked or cancelled with one orientation of the polarizer. That’s because liquid crystal displays produce polarized light, and when the line on your polarizer is perpendicular to the oscillation direction of the
- 58. light from your monitor, light can’t get through. You may find that the light from 9.2 your monitor is polarized vertically, or horizontally, or diagonally. (I have two Dell monitors on my office desk, but one produces vertically polarized light while the other emits diagonal light. My guess is that Dell buys display components from various manufacturers, and I happened to get two slightly different models with screens made by two different companies.) Record your observation on the Report Sheet. 3) Try other displays around where you live – big screen televisions, calculators, the grey reflective displays on some land-line phones and microwave ovens, or perhaps on some car radios. Record what you looked at, and what you observed, if anything. (A negative result is still a result!) Also, try looking at patches of blue sky at various angles from the sun, or at reflections off smooth surfaces. Record what you discovered. 4) Finally, have fun with color. Gather up a few clear plastic
- 59. items. The hard styrene plastic in clear plastic tableware is excellent, as is an inexpensive school ruler or protractor, or the dispenser that holds a roll of ‘Scotch’ tape. Try a Zip-loc type bag or even the cellophane from a cigarette package. Open a blank word processor document on your computer so that your screen is mostly blank white space. Look through your polarizer and rotate it to extinguish the light from your monitor. The hold any of those plastic items in the space between your monitor and your polarizer. You will probably see stunning displays of color from what looks like dull, transparent plastic. Some kinds of organic molecules, as in styrene and some other plastics, can rotate the plane of polarized light, in the same kind of way that your body rotates on a spiral staircase. Different frequencies of light rotate different amounts, and the color you see is the frequency that rotated 90o and made it through your polarizer. List on the Report Sheet some items that looked especially interesting. 9.3
- 60. Web extension Even though we humans can’t detect polarized light, many animals can. Do a quick search on the internet to find some that can detect polarized light. For any one of them, explain briefly why the ability to discern polarized light serves an important function for that species. Be sure to include the web address of the site where you found the information. 9.4 Kent State University Act IV Lab 11 Exploring reflections Report sheet Name Objective: To 1) discriminate real images from virtual images, 2) learn more about geometrical optics with flat mirrors, and 3) observe real images from a concave reflecting surface.
- 61. Data: Distance between the Post-It notes on the mirror (that is, the height ot Flat Albert’s image) in cm: Flat Albert’s actual height, in cm How does Albert’s apparent height in the mirror compare with his actual height? What happened to the fit between Albert’s image and the marks on the mirror as you moved back and forth from the mirror? 11.1 Briefly describe your image in the back of a spoon: Is that image virtual or real? How do you know? Briefly describe your image in the bowl or front of a spoon: Is that image virtual or real? How do you know? Web extension Why do catadioptric or Cassegranian telescopes use both concave and convex mirrors? Sources you consulted:
- 62. PR Photo (Proof you Really did the experiment) Submit a picture with you looking through Flat Albert. 11.2 MyTextField: TextField__1425955907060: TextField__1426304849182: TextField__1426444446939: TextField__1426662758411: TextField__1426729518283: TextField__1426958319516: TextField__1427008159504: TextField__1427067474941: MyMultiLineTextField: TextField__1427508037203: macaulay.cuny.edu Kent State University Act IV Lab 11 Exploring reflections The idea: You see reflections in mirrors so often that you probably think you understand them. And you probably do – up to a point. But there are some interesting consequences and complications that you will explore in this fun and easy lab. What you’ll learn: By the end of this lab you will understand 1) how to discriminate real images from virtual images, 2) more about geometrical optics with flat mirrors, and
- 63. 3) how real images are formed from concave reflecting surfaces. What you’ll need: Post-It notes or a roll of masking tape Ruler Scissors or X-Acto knife Flat Albert image from the lab packet Wall mirror Large, shiny spoon Willing assistant What you’ll do: 1) Use scissors or an X-Acto type knife to cut an eye hole in the cartoon image of Albert Einstein in your lab packet. 2) Grab some Post-It notes and a friend and go to a room with a normal-sized wall-mounted mirror. Any bedroom or bathroom mirror will d0. Give the Post-its to your friend to hold. 3) Stand about six feet or so away from the mirror, hold the Einstein image in front of your face, and with one eye look through the eye hole so that you see his cartoon image in the mirror. Ask your friend to stick a Post-It note on the mirror where you say to put it, so that it looks to 11.1
- 64. you like Einstein is standing on the note. It’s fun to watch this, as people will almost always assume you will tell them to stick the note down low on the mirror. In fact, the note will have to move up surprisingly high. Give the person directions, such as “A little higher, over to the left,” and so on, until it looks to you that Flat Albert is standing right on the note. Do the same with another Post-It note on the mirror so that it seems to be resting right on top of Flat Albert’s head, as if the two notes were clamps that were holding him in place. 4) Use a ruler to measure the distance between the Post-Its on the mirror. It’s always better in physics to use centimeters! Record that distance, which is the height of Albert’s image, on the Report Sheet. 5) Now use the ruler again to measure on the piece of cardstock the actual height of Flat Albert, from his toes to the top of his pointy hair. Record his height on the Report Sheet as well. How do those last two measurements compare – Flat Albert’s actual height, and the distance between the Post-It notes on the mirror? Record your observation on the Report Sheet. 6) Go back to where you were standing and look through
- 65. Albert’s eye hole again. Take a few steps forward and backward, as far as you can move in the room, and observe Albert’s image and the Post-Its on the mirror. As you move, does Albert still fit between the notes? Record your observation on the Report Sheet. What do you conclude, in general, about the size of a mirror needed to see your whole self? Record your conclusion on the Report Sheet. Most everyone, in my experience, assumes that the size of the mirror you need to see your whole self depends on your distance from the mirror. That misconception stems from the fact that we are not two- dimensional objects, and that our eyes are in front of the front- to back midline of our bodies. If you look at yourself very closely, as in a small mirror in a compact, you see only a small part of yourself. If you pull it back to arm’s length, you will see quite a bit more of yourself. But if someone held the mirror for you and you backed up to two arm-lengths away, the amount of yourself 11.2
- 66. you could see would hardly change at all. This is another example of where our routine experience fails us if we apply that experience to more extreme circumstances. 7) You notice, of course that as you look at yourself in a mirror, you are right side up. That means that your image is virtual. It may or may not be virtuous; that’s not for me to say! But seriously, a virtual image is one that cannot be projected onto a screen or surface, and it depends on one’s point of view. After all, while you were looking at yourself in the mirror, you had to direct your assistant where to move to place the notes, because he or she could not see that same image that you did. A virtual image is not on the mirror, but appears to be behind it. We can explore virtual images further and their opposite, real images, using something as simple and common as a spoon. (I hope that you have noticed this on your own way before this.) Real images are always inverted and can be projected. Look at yourself in the back of a shiny spoon. Write a few words on the Report Sheet to describe your image, and whether it is virtual or real.
- 67. 8) Now flip the spoon over and look its bowl. Describe briefly on the Report Sheet what you notice about that image when you look into the bowl of a spoon. Is it virtual or real? Web extension Look up information on the web about Cassegranian or catadioptric telescopes – both terms mean approximately the same thing. Tell me how they use both concave and convex mirrors. Be sure to include the basic web addresses where you found your answers. 11.3 Kent State University Act IV Lab 12 Exploring refraction in lenses Report sheet Name
- 68. Objective: To 1) measure the focal length of a convex or converging lens, 2) predict where images form when refracted by a convex lens, and 3) explain why object distance and image distance are inversely related. Data: Diopter value (power) of the reading glasses, if known: Is the image the laptop or other light source virtual or real? How do you know? Object distance (do), cm Image distance (di), cm Calculated focal length (f), cm Average Power of your lens, in diopters : If you knew the power of the lens when you obtained the glasses, how well does your calculation of the power agree with the manufacturer’s value? Web extension
- 69. What are the more-or-less standard values of f/ ratios? With each increase in f/ number, what happens to the brightness of light passing through the lens? Sources you consulted: PR Photo (Proof you Really did the experiment) Upload a photo (use of flash will probably be necessary, unless you have good camera) of you holding the lens in position in front of the laptop or other light source that you used. MyTextField: TextField__1468813547338: TextField__1468862807368: TextField__1469031785531: TextField__1469547591933: TextField__1469588779212: TextField__1469594096763: TextField__1469597891450: TextField__1469601251388: TextField__1469604128040: TextField__1469607752239: TextField__1469610459884: TextField__1469614158452: TextField__1469618146793: TextField__1469751521578: TextField__1470028132366: MyMultiLineTextField: TextField__1470244751818: Transcript: PHY 21041 Lab 10 Hi! Suppose you could take a look at your computer monitor clo se up. I mean, really close up! What would you see? Wherever you looked, you would see these little bricks of color,
- 70. little micro‐Legos stacked in row after row. But no matter where on the screen yo u looked, you would only see these three colors – a particular sort of satanic red, a bright Kelly green, and a deep, deep blue. That’s it! That’s all the colors we have. Ever ything you see on your monitor, phone, or color TV is just combinations of those colors . In today’s lab you will explore this further by taking control of one big pixel. Here it is, under this fancy light shield, um, and upside down ca rdboard box. College may be expensive, but it’s not because we spend more than we n eed to o equipment. Inside, you see the light bulb, which it spread the light and the c amera staring at the bulb to show the color of light we make. Let me move the came ra and the light bulb. Now you can see nine special light‐emitting diodes, or LEDS. What’s special about them is that each contains three separate color generators. By adjusti ng the computer controls, I can energize just the red elements, or the green, or th e blue. Notice how similar those colors are to the standard primary colors you saw a moment ago. Let me put all of this back together so we can use it. This is another of the remote‐access labs in our course where yo u take control of the equipment from wherever you are. It’s a simple– looking program, but it does a lot of work. You have three sliders, one for each primary color. And the box shows the color
- 71. that the camera sees the color that you have made. What’s amaz ing is that it is all an illusion! You see, the LEDs that you just saw inside the box are either fu lly on, or completely off. Each slider determines the fraction of the time that each LED se gment is turned on. If all three are on any value but zero, then they all turn on fully br ight. They stay on for the time that you set and then turn off in the order of increasing settings. The whole cycle repeats 120 times a second. If you had super‐fast Spidey senses, you would see white at first as all the colors are present, then a combination of two colors, then just one, and then darkness, and then start all over again! Our amazi ng brains merge all of that action into smooth, continuous motion, and we see shades o f each color, blended into one color! With all the hundred different timing settings for each color, you can make one million colors! Let’s try them all, one at a time! No, let’s not, but you can try a few in this fun and easy lab. Transcript: PHY 21041 Lab 12 For this lab, you need to do a little bit of work ahead of time. Y ou need a pair of glasses, like old people would wear. Not prescription glasses, not bifoc als‐ they wouldn’t work, just ordinary, plain vanilla reading glasses. If you’re too embar
- 72. rassed to borrow them from somebody, just go to Goodwill or something like that to ge t the cheapest reading glasses you can find. So go ahead and get some glasses and co me right back! Unidentified voice: Hey, you young whippersnapper! Come bac k here with my glasses! And get off my lawn! Unidentified voice: Sorry, he made me do it! I’ll be right back. Unidentified voice: Here you go! Gotta run! Oh, Thank you! I guess. Now all we need is a place to set this up. We need a really dark room. I wonder where we could find one of those. Well, this is convenient. Let’s go o n in. We found our dark room, now. Here are the glasses my student just got for me. And I’m using my laptop as a light source. I found a big, red arrow t here as an image that we can use. I’m going to set it right here at the end of this long tab le, with the screen straight up and down. Way down there, at the other end of the t able, I have the piece of index card that came from your packet. I have it attached to your book end down there. I have another book end right here that I can use to stead y the lens so the image will be sharp and clear when I move it down there. Let’s see what you would do now in the lab. I’m going to hold t he glasses, covering one
- 73. lens. Only one lens is being used. I’m going to start a long dist ance away from the computer screen. The most common problem is in doing this la b is starting too close. So start a good distance away from the computer screen. And w hat I’m going to do now is move the lens further and further away until I see an image co me to focus on my card over here. And there it comes, we’re almost there. And there is a nice sharp image in the card. You’ll need to then measure, this distance from the le ns to the computer, that’s called the object distance, DO, because the computer scre en is the object. We’ll also measure from the lens to the card. That’s the image distanc e, DI. From the instructions in Blackboard learn, you’ll see how to cal culate the focal length of this lens using DO and DI. What I want you to do is several dif ferent trials like this, where you will move the cardboard screen and then move the le ns to a new place to refocus again, in each case measuring DO and DI.