SlideShare a Scribd company logo
1 of 405
4/7/2017
1
MONASH
BUSINESS
SCHOOL
MGBF3684 Business Strategy
“Resources” or people?
Dr Sarah Lindsay
Strategic HC decision‐making
• SHRM: the use of HR practices to achieve a return on human
capital
• Goals of SRHM
– First order goal: viability of the firm
–
Second order goal: sustained competitive advantage (Purcell &
Boxall, 2011)
versus
– Thunnissen
et al (2013): To achieve individual, organisational and societal
goals
• Best fit or best practice?
• Different approaches for different groups ‐
based on their strategic
value:
– “high commitment” or “high road”
– low commitment with flexibility and possible outsourced
Strategic tensions
• The language of strategy
• Labour productivity
• Organisational flexibility
• Social legitimacy
(chap. 1 Boxall and Purcell)
4/7/2017
2
• The language of strategy
– What does it mean to say humans are “valued” “resources” or
“investments”
– How or what is valued – risks the commodification of humans
– What is normal in the workplace
• Labour productivity
– How much to invest and in whom?
– Employee motivation
• Organisational flexibility
responsiveness v long‐run agility
• Social legitimacy
• Firms make use of human capabilities from the community
and the state
• Governments exercise their right to regulate employment
• Individuals (workers, customers, citizens) exercise
sanctions against firms
6
“SHRM may benefit from a more
balanced emphasis on meeting the
demands of other [non-owner]
stakeholder groups with diverse needs,
interests and agendas”
(Lepak and Colakoglu 2006 p.29)
4/7/2017
3
MONASH
BUSINESS
SCHOOL
Security and Behavior – in & out of work
OH&S
• Mental health
• Bullying
• Violence
• Privacy
8
The discipline of employees…
“security must be designed with the users in mind:
individuals with unique motivations, emotions and
cognitions”
– Identity theft
– physical objects & computer
networks
DUPress, Centre for integrated research
Series on behavioural economics and management
9
Connectivity and behaviour – in and out of work
The managerial and unitarist orientation on the achievement
of organisational goals needs to be expanded” (p.1757)
Taking a pluralist view of talent –
implications for Human Capital
Multiple stakeholders – multiple goals or outcomes
Thunnissen et al 2013
4/7/2017
4
Revisit
• Stakeholder: Individual or group with a legitimate
stake/investment/claim on the firm
• Owed benefit of protection from harm
• Extent of duty owed is proportional to the investment
• Principles of stakeholder theory
–
Stakeholders can not be used as a means to an end (deontologica
l)
–
Firms must be managed for the benefit of all stakeholders (utilit
arianism,
distributive justice)
–
Stakeholders have the right to pursue their own interests in the f
irm (rights
theory, procedural justice)
• Often used descriptively or instrumentally (aka stakeholder
management)
•
Stakeholder theory: best understood as a normative theory of bu
siness
ethics(an ethically pluralist theory)
Importance of OHS
safety (OH&S)
“The physical,
physiological and
psychosocial conditions
of an organisation’s
workforce, related to
aspects of work and the
work context”
Organisational benefits
• Improve quality of
work life
• Lower absenteeism
and turnover
• Increase productivity
• Reduce medical and
compensation costs
• Improve organisational
image
Responsibility for OHS
[compliance vs integrity]
– Adherence to minimum standards and improving workplace
safety could provide
large $ benefits to the economy and improve employee wellness
– But barriers to OH&S reform
• Lack of commitment/reactive responses
• Not integrated with business objectives
• Seen as a cost
• Conflict with workers compensation system, privacy, EEO
• Inadequate govt funding and enforcement
• Low penalties
4/7/2017
5
Current OH&S hot topics:
• Mental Health
• Bullying
–
Covert or overt workplace behaviour that results in harassment,
includes
yelling, screaming, abusive language, insults, physical injury, in
appropriate
comments about a person’s appearance of lifestyle, constant beli
ttling
comments (see Brodie’s Law)
• Occupational violence (physical or online)
–
Situations where a person suffers abuse or attack associated wit
h the
requirements of their position
http://www.heraldsun.com.au/news/victoria/most‐nurses‐attacke
d‐or‐faced‐aggressive‐patients‐
on‐the‐job/story‐fni0fit3‐1227061968627
• Employee privacy
The ‘right’ to privacy?
The example:
An employee who
accidentally sent her boss
an SMS calling him a
“complete dick” had her
case for unfair dismissal
thrown out by Australia’s
Fair Work Commission
(2015)
THE DILEMMA:
• THERE IS A LONG HISTORY
OF EMPLOYERS PLACING
LIMITATIONS ON EMPLOYEE
OFF-THE-JOB ACTIVITIES.
• THESE LIMITATIONS CAN
(LEGITIMATELY) VIOLATE
THE EMPLOYEES
EXPECTATION OF PRIVACY
WHILE NOT AT WORK
Solution
: properly crafted social media policy that has been effectively c
ommunicated to employees
Values: espoused versus enacted
(Lucero et al 2013)
http://www.smartcompany.com.au/people‐human‐resources/indu
strial‐relations/46369‐employee‐who‐accidentally‐texted‐her‐bo
ss‐
calling‐him‐a‐complete‐d‐ck‐loses‐unfair‐dismissal‐case/
Stress, well‐being & occupational
(organisational) health in the 21st century
• Stressors
– Job insecurity
– Job design – work overload
– Work hours
– Control at work
– Managerial style
– Organisational change
– Improper selection
– Unsatisfactory physical work
environment (heat)
– 24/7 connectivity
• Stress reactions
– Self‐report of distress and lower
general health
– Anxiety & depression
– Fatigue, poor lifestyle
– Absenteeism
– Lower productivity
– Bullying
“There are now fewer people at
work doing more and feeling
less security and control in
their jobs. Management in
particular have increased
pressures trying to keep pace
and manage their workplace
against a background of rapid
change”
(Sparks et al, 2001: 490).
(Sparks, Faragher and Cooper, 2001)
4/7/2017
6
SHR responses to HC wellbeing &
occupational health in the 21st century
• Job redesign
– Increase interest and levels of autonomy
• Development of career plans
– Antidote to insecurity
• Performance management and counselling programs
– Feedback to reduce uncertainty around job performance
• Award reform
– Address issues of insecurity and long hours
• Employee feedback programs
– Provide voice for frustrations and stresses in hope of creating
change
• Consultative committees
– Provide role for employees in work issues (and also
potentially, conflict)
• Stress reduction and stress management programs
– problematic internet use (PIU)/compulsive Internet use
(CIU)/Internet overuse
– Mindfulness (-> Mindfulness at Monash)
MONASH
BUSINESS
SCHOOL
MGBF3684 Business Strategy
A critical diversity perspective on ‘the business case’
Dr Sarah Lindsay
Acknowledgements:
Professor Veronique Ambrosini, HoD Management
Professor Gavin Jack, Deputy HoD Management
WHY BOTHER? (???)
We argue that CDP is a threshold concept,
central to developing students’ ability
to navigate the complexity of
making decisions, a sine qua non element
of strategy implementation
(Porter & Kramer, 2006).
From last week …
Stress the need for students to develop the students ability to
assess critically the
assumptions underpinning managerial actions and the impact of
those actions on others
4/7/2017
7
• A critical perspective is defined as an approach “that aims at
revealing organizational norms, in particular
organized dichotomies, in order to make organisations more
inclusive for groups” (Bleijenbergh & Fielden,
2015, p. 2/18).
• Enable people to navigate their own position but also to
recognise and consider others
• Develops nuance and sophistication
• Critical diversity studies (CDS) is a composite of theoretical
and empirical work that critiques the assumptions,
intentions and effects of the managing diversity approach. For
example:
• Zanoni et al. (2010): Sceptical. Argue that CDS is a response
to how the BCD enabled corporations to
reappropriate and weaken the equal opportunities and social
justice basis of workplace diversity
• Prasad (2006): argues that DM initiatives are, wittingly or
otherwise, ‘designed to fail’ since the
maintenance of dominant group privilege is the
hidden/unconscious agenda, perhaps even the ‘shadow’
(Prasad & Mills, 1997), of/ behind the diversity showcase.
• Prasad consequently encourages critical diversity scholars to
ask how failure is designed into diversity
initiatives, and to assess the value of DM in terms of the extent
to which it destabilises the ingroup-
outgroup binary oppositions that often frame social
group/identity-based diversity discourses.
Critical management studies and critical diversity perspectives
Porter (1991):
• ‘Heroic’/straight line approach to SM
• Economic focus
In practice … D&I showcased as a competitive advantage
(Thomas, 2004 - Diversity as
strategy HBR)
(Porter & Kramer, 2011):
• business should address social issues that intersect with
business interests
• to maximise return to both groups - shared value
• Possibilities include:
• products and markets
• productivity in the value chain
• local cluster development
Diversity and inclusion as a component of strategic (HR) manag
ement –
A timeline case study of Porter
( … )
The Hudson Institute’s famous Workforce 2000 Report
(Johnston & Packer, 1987) predicted that ‘by 2000 only 15%
of new entrants to the US workforce would be US-born white
males’ (Oswick & Noon, 2014, p. 24).
Incorrect (Edelman, Fuller, & Maradrita, 2001) but it brought
diversity into a strategic, economic frame,
by positioning diversity as valuable to organisations:
– Externally, through access to new markets;
– Internally, through:
• performance innovation; and
• as a new, better
approach to equal opportunity and affirmative action
( … )The business case for diversity
Diversity activities regularly
showcased in organisational
reports and websites,
yet little change in real terms
Equality
is a deeply unfashionable term in
practitioner literature & strategic
management is silent in this regard
4/7/2017
8
Top 20 US fortune 500 - employee representative groups
(ERGs)
Power implication: in self-identifying as a minority, individuals
reduce themselves
to one salient category, & reinforce the distinctions and power
imbalance. In some
ways, even making decisions about which identity is most
salient is problematic.
Do you join all, or some?
Does identifying self into a (sub)group requires you to locate
yourself as a
minority - and be treated as such, reinforcing the status quo?
“Diversity networks are formally established to counter the
power of the informal
old boys’ networks in organisations. Diversity networks as
diversity tools are
relatively easy for organisations yet they render people from
minority groups
responsible for solving their own isolation and career
difficulties; the focus on
community building may met the need for social support but fail
to address deeply
embedded inequalities in the workplace” (Benschop et al., 2015,
p 17/29)
Consider this:
Problems with the business case for diversity:
• Short‐term
• Blinkered view
• Dangerous arguments
• Flawed assumptions
(Noon, 2007)
(libguides.bc.edu)
(linkedin.com)
The distinction between the two concepts needs to be clear,
because utilisation in this form sets inclusion up to fail.
• Diversity: conceptualisations of single, social identity
categorisations for example, race, gender, age
etc.
• Inclusion: is a concept without consensus on the nature of the
construct or its theoretical
underpinnings. Shore et al. (2011, p. 1265) define inclusion as
“the degree to which an employee
perceives that he or she is an esteemed member of the
workgroup through experiencing treatment that
satisfies his or her needs for belongingness and uniqueness”.
Practitioners widely and academics occasionally conflate the
terms diversity and inclusion:
Example: 2015 publicly available documents from the top 20
US companies in the Fortune 500:
Inclusion does not merit a separate category in the reports,
instead is married to diversity. The term is not defined.
The only practitioner exception to this pattern is AT&T which
distinguishes between diversity as demographics
and inclusion as culture.
Diversity AND Inclusion?
4/7/2017
9
There may be an ongoing shift in workplace diversity fashion
from the ‘diversity’
approach to an ‘inclusion’ approach, speculating that:
“More recently, the debate has taken a new direction, as
academic commentators
and consultants are making a clear distinction between diversity
and inclusion”
(p. 26).
The research direction recently emerged to investigate this is
the climate for inclusion
(Dwertmann & Boehm, 2016; Nishii, 2013), with important
implications
Oswick & Noon (2014)
Diversity: recognizing the
value of differences within
the workforce and
managing them for
commercial advantage
Inclusion: the “effective
management” of differences,
concerned with the processes
that incorporate differences into
business practices.
Climate of inclusion
Nishii, (2013): Fairly implemented employment practices that:
• do not bias against women
• lack stigmas associated with expressing feminine identity
• have a propensity to value the perspectives of men and women
equally
signal to employees that being a woman is not associated with
having a disproportionately small share
of social value.
In contrast, when gender-based status differences are salient,
people will be motivated to derogate
others on the basis of gender in order to enhance their own
status.
Dwertmann & Boehm (2016): A climate of inclusion is invoked
when:
• Existing norms promote the commitment of resources to all
group members
regardless of disability status
• Support for group member uniqueness and belongingness
The role of position status is important. Climate for inclusion =
a culture for subordinates not to
discriminate against their supervisor with disabilities, but not
the other way. Status, influence, and
power may protect supervisors against sanctions from violating
the social norm, because subordinates
may be hesitant to voice their opinions
( … )
• There are differences between diversity and inclusion and
there is a need to consider and
respond to each as distinct but related areas of strategic
management
• Countervailing tensions along the dimensions of age, gender
and inter- and intra-
organisational variation limit not only strategic alignment but
also the materialization of the
gains vaunted by the RBV and the business case arguments
• A pragmatic approach to workforce diversity was adopted in
order to keep abreast of D&I
policy developments and to be viewed as socially responsible
organizations
• Long-standing views with regards to ethnic social classes
known as caste persist. Legitimacy
of these attitudes needs to be tackled both within and outside
these firms.
• Ought to be championed by organizational leaders as well as
members of staff
• RBV and business case need to adopt a broader internal-
external lens if the goals of attaining
a diverse and inclusive firm is to be achieved (p. 212).
The last word? Donnelly (2015):
Running head: SHORT TITLE OF PAPER (<= 50
CHARACTERS)
Title
Author
Author Affiliation
Title of Paper
Begin your paper with the introduction. The active voice, rather
than passive voice, should be used in your writing.
This template is formatted according to APA Style guidelines,
with one inch top, bottom, left, and right margins; Times New
Roman font in 12 point; double-spaced; aligned flush left; and
paragraphs indented 5-7 spaces. The page number appears one
inch from the right edge on the first line of each page,
excluding the Figures page.
In this introduction, you will describe the purpose of your paper
(the first rubric element) – in other words, what your paper sets
out to do. This video provides some guidance on how to
structure an introductory paragraph. In this case, you are
providing a microeconomic analysis of a particular company
and you will analyze different microeconomic criteria related to
your company and the market in which it operates. This analysis
will then inform your recommendations for how the company
can be successful in the future. Be sure to provide some
specifics about what you will be analyzing so the reader knows
what to expect – use the outline provided in the Final Project
Document as your guide. Lastly, make sure that the company
you choose is well suited for this kind of analysis. Please see
the suggested list provided in your course for ideas and email
your instructor your choice. Any company not on the list will
need prior approval.History of the Company
Use headings and subheadings to organize the sections of your
paper. The first heading level is formatted with initial caps and
is centered on the page. Do not start a new page for each
heading. This first heading aligns with the second rubric
element which gives an overview of the company’s history. Be
sure to personalize this heading to reflect your company. In
this section, include you will summarize the history of the firm
and also provide an overview of what the firm does and what
goods/services it sells. Be sure to include sufficient detail here.
Your company’s website is the best place to find this
information. This section should be about one page long.
Supply and Demand Conditions
There are two rubric elements to be included in this section and
combined they should be about 2 pages in length, perhaps
longer if you present more than one graph/table. The first
element asks you to evaluate the trends in demand over time and
explain their impact on the industry and on the firm. To do
this, you can consider market demand. Market demand is the
demand by all the consumers of a given good or service. Find
out who your customers are and provide detail on them. Use
annual sales data to find out how much of the product is
purchased. Here is a video explaining each of the following
determinants of market demand that you could examine for your
company’s market:
· Income
· Price of related goods
· Tastes
· Population and Demographics
· Expected Future Prices
The second rubric element to be included in this section is your
analysis of information and data related to the demand and
supply for your firm’s product(s) to support your
recommendation for the firm’s actions. You have already
presented the overall trends in demand in the last element. In
this rubric element, you will first collect data specific to your
company on demand. To do this, look at the following:
· Sales and Revenue. Building on the idea of market demand,
consider how the annual sales data changed over time for your
company in particular.
· Include a graph/table/chart of sales for your company. This
may be in dollars, product quantity or number of customers –
whichever is most relevant for your firm. You could use more
than one, if you think that would give a more detailed picture of
demand for your company’s product or service.
· Include 5 or more years of data will be enough to show a trend
that is supported by your market demand discussion.
· Data can be found from the company’s annual reports and
revenue can more specifically be found in the company’s
income statement.
One you have analyzed the demand side, you can now look at
the supply side of your company. For this, you will want to
watch this video on the determinants of supply, just as we
examined the determinants of demand in the last rubric element.
Here, some of the pieces you could explore and provide data on
are:
· Input costs
· Technological Improvement
· Prices of substitutes
· Number of firms in the market
· Expected future prices
Price Elasticity of Demand
This section has three elements and should be 1-2 pages long.
The first element asks that you analyze information and data to
justify how the price elasticity of demand for your product is
determined. Here, you will have to use pricing of your product,
the trend in the price over time and comparison to similar
products to justify whether you find the price elasticity of
demand to be either elastic or inelastic. You may not be able to
calculate a specific price elasticity of demand (video),
depending on your company and the available information.
However, looking at pricing data should help you justify
whether demand is inelastic or elastic.
You will then take your justification one step further in the
second rubric element and explain the factors that affect
consumer responsiveness to price changes. You can learn more
about these factors from this video on the determinants of price
elasticity of demand. Explore the following determinants as
they relate your company’s product(s):
· Availability of substitutes
· Passage of time
· Luxury or necessity
· Definition of the market
· Share of budget
The third and last element in this section ask you to assess how
the price elasticity of demand impacts the firm’s pricing
decisions. As you read in Chapter 6 in our textbook, there is a
relationship between elasticity of demand and revenue. You can
watch this video to review the relationship between price
elasticity of demand and total revenue and explain how this
relationship influences the company’s pricing decisions. For
instance, if a company sells a product that has very elastic
demand, meaning customers are very responsive to a price
change, then increasing their price means that their total
revenue will decrease. This could explain why, in such a
situation, the company may decide to not raise prices, even if
their costs are going up. This is just one example so be sure to
make your analysis relevant to your company’s specific
situation.
Costs of Production
This section of your paper has two rubric elements and will be
between 1-2 pages long, depending on your use of graphs or
tables. The first element in this section asks you to analyze the
various costs your company faces, their trends over time and
how they have impacted the company’s profitability. To gather
data on this, you will want to go to your company’s annual
report and look at their income statement. Here is a helpful
video to help you understand how to read an income statement.
You will notice that there are two section that deal with costs –
the first is Cost of Goods Sold which is essentially the cost of
the inputs, such as raw material and direct labor. For clothing
manufacturer, that would include the cost of the cloth; for an
auto manufacturer, it would include the cost of the steel. Then,
there is the section called expenses and these are the costs
beyond buying the raw materials. These include things like
rent, insurance and overhead and other indirect expenses. For
this section, you should include:
· Past 5 years (or more) of COGS, in a table or graph
· Past 5 years (or more) of Operating Expenses, in a table or
graph (can be combined with table/graph of COGS)
· Explanation of any observed trends in either (ie: why is COGS
increasing?) such as:
· Pricing history of major inputs, such as cotton for a clothing
company, as applicable
· Change in how goods/services are produced – for instance, a
change in major input such as moving from steel to aluminum
· Your analysis of how changes in either or both of these
affected profitability – remember that accounting profit, which
is what we are looking at here, is simply Revenue – Costs
The next rubric element in this section asks you to apply the
concepts of variable and fixed costs to company for informing
their output decisions. Chapter 11 examines the differences
between variable and fixed costs, and you can review in this
video the details about fixed and variable costs and how they
apply to business output decisions. In this video, our textbook
presents an example that shows how costs are distinguished
between fixed and variable. This example will help shed light
on how you can similar distinctions for your company. Also,
you have already done some of this work in your previous
rubric element. There you presented data on COGS and
Operating Expenses. Generally, variable costs will show up in
COGS and fixed costs will show up in Operating Expenses, so
this gives you a head start. You can then use the data and your
knowledge of fixed, variable and total costs from Chapter 11 to
explain how your company will base their production level on
the costs they face.
Overall Market
In this section, you will be examining three different aspects
of the overall market in which your company operates. By
overall market, we mean the market selling the product or
service. For instance, there is a market for mobile phones or a
market for jeans. Whatever product your company sells
determines what market it is in. Note that the term market here
does not refer to the stock market. In total, this section should
be 1-2 pages long.
The first rubric element of this section asks you to discuss
themarket share for your company and its top competitors by
providing details on current percentages for each company and
describing the trend over time. The best way to show this
would be to use some type of graph or table to show for the past
few years (5 would show any trends, if you can find the data
going that far back). To do this, you will need to find data on
the market as a whole – for instance, if the market is computers,
you will need to find the total value of computer sales in the
US. From there, you can determine that share (the percentage)
your company and the other top companies get from that total.
For an example of how to do this, check out this video on
calculating market shares. You may also find that industry
magazines or other market researchers have compiled this
information, so do look for those resources as well, to make
your data collection easier. Once you have the data, you will
want to see how your company has been doing. Having 80% of
the market might sound great but if you see that the company
had 90% of the market two years ago, then we have a different
story. This is why showing the trend is so important.
The second rubric element in this section asks you to analyze
the barriers to entry for your firm’s industry. This concept is
explored in detail in Chapter 14 and you can review in this
video the types of barriers to entry and their impact on the
market. For the market your company operates in, you will
detail the barriers to entry – some markets have more than other
and some barriers are weaker than others. Your specific
situation will allow you to explain how the existing barriers will
either help insulate your company from competition or allow for
competitors to break into the market.
The last rubric element in this section asks you to describe the
market structure for your firm and analyze how this affects their
ability to influence the overall market. Recall from Chapter 12
that there are 4 different market structures: Perfect Competition,
Monopolistic Competition, Oligopoly and Monopoly. You need
to categorize your company’s market into one of these four.
Use the criteria listed in Table 12.1 on page 392 of the textbook
and any supporting evidence you have presented so far. You
can also use the four-firm concentration ratio and/or the
Herfindahl-Hirschman Index (HHI) to support your conclusion.
Here is a video showing you how to calculate both the four-firm
concentration and the HHI*, and you can also review this on
pages 453 and 497, respectively. Once you have determined the
market structure, you can then analyze your company’s ability
to influence the whole market based on this and their position
within the market.
*this example uses the top 50 firms – you will not necessarily
have to use that many.
Recommendation
This last section of your paper contains three rubric elements,
where you will provide your recommendations for future actions
based on the three different criteria. This section will be about
one page long. In the first element, you will develop a
recommendation for how the firm can manage it future
production by synthesizing the data presented. This essentially
is asking you to look at the data and analysis done in the supply
and costs sections and make a suggestion how the company
should produce in the future. The determinants of supply and
specific costs trends that the company faces will determine what
you suggest for their production moving forward, in terms of
quantity and types of products.
The second element asks you to suggest how the firm’s position
within the market and among its competitors will allow it to
take the recommended action. This follows closely from your
last element in the Overall Market section and you should use
the evidence presented there to inform your recommendation
here. Specifically, consider how the firm’s market power would
allow them to make the suggested changes to production you
mention above. You should also include here advice for how
your firm can become stronger within their market.
The last rubric element asks you to describe how the firm can
sustain its success going forward by evaluating trends in
demand and price elasticity. Here you will revisit your analysis
in the demand and price elasticity section to further provide
suggestions for how your company can stay profitable. From
pricing decisions to responding to changes in demand, your
suggestions here should reflect your findings in those earlier
sections. Be sure to include specific ideas for how the firm can
remain successful, like new products to offer based on changing
tastes, or a different pricing strategy to remain competitive.
Your ideas should of course align with the rest of your analysis
and the microeconomic concepts.Citations
This is not a particular section of your paper, but rather
guidance on how to use APA format in-text citations throughout
your paper. Source material must be documented in the body of
the paper by citing the authors and dates of the sources. The full
source citation will appear in the list of references that follows
the body of the paper (see last page). When the names of the
authors of a source are part of the formal structure of the
sentence, the year of the publication appears in parenthesis
following the identification of the authors, for example, Smith
(2001). When the authors of a source are not part of the formal
structure of the sentence, both the authors and years of
publication appear in parentheses, separated by semicolons, for
example (Smith and Jones, 2001; Anderson, Charles, &
Johnson, 2003). When a source that has three, four, or five
authors is cited, all authors are included the first time the
source is cited. When that source is cited again, the first
author’s surname and “et al.” are used. See the example in the
following paragraph.
Use of this standard APA style “will result in a favorable
impression on your instructor” (Smith, 2001). This was affirmed
again in 2003 by Professor Anderson (Anderson, Charles &
Johnson, 2003).
When a source that has two authors is cited, both authors are
cited every time. If there are six or more authors to be cited, use
the first author’s surname and “et al.” the first and each
subsequent time it is cited. When a direct quotation is used,
always include the author, year, and page number as part of the
citation. A quotation of fewer than 40 words should be enclosed
in double quotation marks and should be incorporated into the
formal structure of the sentence. A longer quote of 40 or more
words should appear (without quotes) in block format with each
line indented five spaces from the left margin.
References
Entries are organized alphabetically by surnames of first
authors and are formatted with a hanging indent. Most reference
entries have three components:
1. Authors: Authors are listed in the same order as specified in
the source, using surnames and initials. Commas separate all
authors. When there are seven or more authors, list the first six
and then use “et al.” for remaining authors. If no author is
identified, the title of the document begins the reference.
2. Year of Publication: In parenthesis following authors, with a
period following the closing parenthesis. If no publication date
is identified, use “n.d.” in parenthesis following the authors.
3. Source Reference: Includes title, journal, volume, pages (for
journal article) or title, city of publication, publisher (for book).
Here is a link to a video to walk you through creating a
reference list in APA format.
2017
ANNUAL
REPORT
20
17
U
N
D
ER
A
RM
O
U
R
AN
N
U
AL
R
EP
O
RT
JORDAN SPIETH
DWAYNE “THE ROCK” JOHNSON
STEPHEN CURRY
2 0 1 7 I C O N I C A T H L E T E C O L L E C T I O N S
LINLINDSEDSEY VY VONNONN
TOM BRADY
2017 U
N
D
ER ARM
O
U
R AN
N
U
AL REPO
RT
FROM THE
CHAIRMAN AND CEO
To Our Shareholders,
2017 was one of the most
challenging and opportunistic
years in Under Armour’s history.
It was a year that provided
invaluable learning and will
success.
Following a sustained period
investments to gain global scale,
a number of external and internal
in our strategy to better align
our resources and operations
into an organization capable of
supporting the powerful brand
that is Under Armour.
Externally, disruption in our North
American business driven by retail
consolidation, bankruptcies and
shifts from physical to digital
consumption placed a great deal
of variability into the marketplace.
These dynamics, along with
changes in consumer preference
contributed to a highly
promotional backdrop, putting
pressure on our largest regional
business throughout the year.
Internally, our quick pace
at obtaining global scale in
innovation, product, sport
categories and a larger
international footprint generated
associated with our shift toward
cost structure built to support
the expectation of being a larger
company by now.
The intersection of the external and
internal factors provided an exceptional
opportunity to transform our operations
and further sharpen our strategy. In
and proactive decisions to advance our
operating systems, reset our structure
and recalibrate our leadership so that we
utilize the scale and infrastructure we’ve
built to better serve our consumers and
retail customers. Fundamental to this
design and storytelling, all while keeping
our consumer athletes at the center of
everything we do.
years of investing to scale within one
accelerating focus on discipline sets us up
to more consistently deliver sustainable,
To empower this, Under Armour must
ensure that we are constantly delighting
our consumer athletes. Since the
beginning, our promise has been to make
athletes better. As we push ourselves to
become a smarter, faster and stronger
athletic performance. And it’s precisely
through this lens, that our new mission
statement evolved – Under Armour Makes
You Better. This means that in every way
we connect – through the product we
create, the experiences we deliver and the
inspiration we provide – we will make you
better.
We’re proud of the incredibly strong brand
leading innovation and a truly unique
intimacy with Under Armour athletes.
By building a stronger ecosystem with a
20
17
U
N
D
ER
A
RM
O
U
R
AN
N
U
AL
R
EP
O
RT
FROM THE
CHAIRMAN AND CEO
empowering our team to create and operate
drives an even deeper authenticity and
connection with our consumers, inspiring
them with incredible products they never
knew they needed and wondered how they
ever lived without.
In 2017, our revenue was up 3% to reach
$5.0 billion. Throughout the year, we
leveraged our amazing roster of athletes
international business. In fact, our
international business grew 46% to
consumer, women’s and footwear on the
list of $1 billion businesses. Working as
a counterbalance to a contraction in our
North American business, the investments
we have made across our regions – EMEA,
dividends, with their size and scale on the
precipice of being able to deliver more
meaningful returns in the years ahead.
In addition to diversifying our portfolio
across regions and categories, we are
optimizing and expanding our distribution
right experience wherever and whenever
consumers choose to engage Under
Armour. Within our global wholesale
business, which declined 3% in 2017, we
are focused on improving our segmentation
and service levels to ensure we have the
right product in the right place at the right
continued its strong momentum with a 14%
increase in annual revenue, representing
35% of sales as our retail stores and
storytelling to deliver truly unique and
premium experiences.
As we drive forward into 2018,
Under Armour is a great brand
and a good company. We must
become a great company
positioned to execute against
our strategies and new mission
to become better. We are the
best at getting better. It’s in our
DNA. By building on the strategic
decisions and actions we took in
2017 and ones thus far in 2018,
we are heads down and focused
on doing just that.
At Under Armour, we have the
best team. I am so incredibly
proud of the strength and
resilience my teammates
demonstrate each and every
day, all around the world.
With a high level of situational
awareness, and the right strategy
and leadership in place, we are
fuel and innovate – emerging as a
stronger and better Under Armour
for our consumers, customers,
and shareholders.
Chairman and
2017 U
N
D
ER ARM
O
U
R AN
N
U
AL REPO
RT
MMMISMISMISMISMISMISMMIMISSMIMM TY TYTY TY
TYTYYYTYTY
COLCOLCOLCOOLOLOOLOLCOCOLCOLCOLLOLC
LLCOCO
LECLECLECLECELELELLLECCTTTIOTTIOTIOTIOIOOTIOO
ONNNNNNNNNNNNNNN
#SHEPLAYSWEWIN CAMPAIGN CAL BERKELEY
HARPER 2
20
17
U
N
D
ER
A
RM
O
U
R
AN
N
U
AL
R
EP
O
RT
AMSTERDAM BRAND HOUSE
BEIJING BRAND HOUSE
AMSTERDAM BRAND HOUSE
(TTM)
UNITED STATES
SECURITIES AND EXCHANGE COMMISSION
Washington, D.C. 20549
Form 10-K
(Mark One)
Í ANNUAL REPORT PURSUANT TO SECTION 13 OR 15(d)
OF THE SECURITIES
EXCHANGE ACT OF 1934
For the fiscal year ended December 31, 2017
or
‘ TRANSITION REPORT PURSUANT TO SECTION 13 OR
15(d) OF THE SECURITIES
EXCHANGE ACT OF 1934
For the transition period from to
Commission File No. 001-33202
UNDER ARMOUR, INC.
(Exact name of registrant as specified in its charter)
Maryland 52-1990078
(State or other jurisdiction of (I.R.S. Employer
incorporation or organization) Identification No.)
1020 Hull Street
Baltimore, Maryland 21230 (410) 454-6428
(Address of principal executive offices) (Zip Code)
(Registrant’s Telephone Number, Including Area Code)
Securities registered pursuant to Section 12(b) of the Act:
Class A Common Stock New York Stock Exchange
Class C Common Stock New York Stock Exchange
(Title of each class) (Name of each exchange on which
registered)
Securities registered pursuant to Section 12(g) of the Act:
None
Indicate by check mark if the registrant is a well-known
seasoned issuer, as defined in Rule 405 of the Securities
Act. Yes Í No ‘
Indicate by check mark if the registrant is not required to file
reports pursuant to Section 13 or Section 15(d) of the
Act. Yes ‘ No Í
Indicate by check mark whether the registrant (1) has filed all
reports required to be filed by Section 13 or 15(d) of
the Securities Exchange Act of 1934 during the preceding 12
months (or for such shorter period that the registrant was
required to file such reports), and (2) has been subject to such
filing requirements for the past 90 days. Yes Í No ‘
Indicate by check mark whether the registrant has submitted
electronically and posted on its corporate Web site, if
any, every Interactive Data File required to be submitted and
posted pursuant to Rule 405 of Regulation S-T (§229.405
of this chapter) during the preceding 12 months (or for such
shorter period that the registrant was required to submit and
post such files. Yes Í No ‘
Indicate by check mark if the disclosure of delinquent filers
pursuant to Item 405 or Regulation S-K (§229.405 of this
chapter) is not contained herein, and will not be contained, to
the best of registrant’s knowledge, in definitive proxy or
information statements incorporated by reference in Part III of
this Form 10-K or any amendment to this Form 10-K. ‘
Indicate by check mark whether the registrant is a large
accelerated filer, an accelerated filer, a non-accelerated
filer, or a smaller reporting company. See definitions of “large
accelerated filer,” “accelerated filer,” and “smaller reporting
company” in Rule 12b-2 of the Exchange Act.
Large accelerated filer Í Accelerated filer ‘
Non-accelerated filer ‘ (Do not check if a smaller reporting
company) Smaller reporting company ‘
Emerging growth company ‘
If an emerging growth company, indicate by check mark if the
registrant has elected not to use the extended
transition period for complying with any new or revised
financial accounting standards provided pursuant to
Section 13(a) of the Exchange Act. ‘
Indicate by check mark whether the registrant is a shell
company (as defined in Rule 12b-2 of the
Act). Yes ‘ No Í
As of June 30, 2017, the last business day of our most recently
completed second fiscal quarter, the aggregate
market value of the registrant’s Class A Common Stock and
Class C Common Stock held by non-affiliates was
$4,001,622,620 and $3,838,231,258, respectively.
As of January 31, 2018, there were 185,279,913 shares of Class
A Common Stock, 34,450,000 shares of Class B
Convertible Common Stock and 222,442,673 shares of Class C
Common Stock outstanding.
DOCUMENTS INCORPORATED BY REFERENCE
Portions of Under Armour, Inc.’s Proxy Statement for the
Annual Meeting of Stockholders to be held on May 9, 2018
are incorporated by reference in Part III of this Form 10-K.
UNDER ARMOUR, INC.
ANNUAL REPORT ON FORM 10-K
TABLE OF CONTENTS
PART I.
Item 1. Business
General . . . . . . . . . . . . . . . . . . . . . . . . . . . . . . . . . . . . . . . . .
. . . . . . . . . . . . . . . . . 1
Products . . . . . . . . . . . . . . . . . . . . . . . . . . . . . . . . . . . . . . . . .
. . . . . . . . . . . . . . . . . 1
Marketing and Promotion . . . . . . . . . . . . . . . . . . . . . . . . . . . .
. . . . . . . . . . . . . . . . 3
Sales and Distribution . . . . . . . . . . . . . . . . . . . . . . . . . . . . . . .
. . . . . . . . . . . . . . . . 4
Seasonality . . . . . . . . . . . . . . . . . . . . . . . . . . . . . . . . . . . . . . .
. . . . . . . . . . . . . . . . 6
Product Design and Development . . . . . . . . . . . . . . . . . . . . . .
. . . . . . . . . . . . . . . 6
Sourcing, Manufacturing and Quality Assurance . . . . . . . . . . . .
. . . . . . . . . . . . . 6
Inventory Management . . . . . . . . . . . . . . . . . . . . . . . . . . . . . .
. . . . . . . . . . . . . . . . 7
Intellectual Property . . . . . . . . . . . . . . . . . . . . . . . . . . . . . . . .
. . . . . . . . . . . . . . . . 8
Competition . . . . . . . . . . . . . . . . . . . . . . . . . . . . . . . . . . . . . .
. . . . . . . . . . . . . . . . . 8
Employees . . . . . . . . . . . . . . . . . . . . . . . . . . . . . . . . . . . . . . .
. . . . . . . . . . . . . . . . . 9
Available Information . . . . . . . . . . . . . . . . . . . . . . . . . . . . . . .
. . . . . . . . . . . . . . . . 9
Item 1A Risk Factors . . . . . . . . . . . . . . . . . . . . . . . . . . . . . . .
. . . . . . . . . . . . . . . . . . . . . . . . . . . 10
Item 1B Unresolved Staff Comments . . . . . . . . . . . . . . . . . . . .
. . . . . . . . . . . . . . . . . . . . . . . . . 26
Item 2 Properties . . . . . . . . . . . . . . . . . . . . . . . . . . . . . . . . . .
. . . . . . . . . . . . . . . . . . . . . . . . . . 27
Item 3 Legal Proceedings . . . . . . . . . . . . . . . . . . . . . . . . . . . .
. . . . . . . . . . . . . . . . . . . . . . . . . 27
Executive Officers of the Registrant . . . . . . . . . . . . . . . . . . . .
. . . . . . . . . . . . . . . . . . . 28
Item 4 Mine Safety Disclosures . . . . . . . . . . . . . . . . . . . . . . . .
. . . . . . . . . . . . . . . . . . . . . . . . . 30
PART II.
Item 5 Market for Registrant’s Common Equity, Related
Stockholder Matters and Issuer
Purchases of Equity Securities . . . . . . . . . . . . . . . . . . . . . . . . .
. . . . . . . . . . . . . . . . 31
Item 6 Selected Financial Data . . . . . . . . . . . . . . . . . . . . . . . .
. . . . . . . . . . . . . . . . . . . . . . . . . 34
Item 7 Management’s Discussion and Analysis of Financial
Condition and Results of
Operations . . . . . . . . . . . . . . . . . . . . . . . . . . . . . . . . . . . . . . .
. . . . . . . . . . . . . . . . . . . 35
Item 7A Quantitative and Qualitative Disclosures About Market
Risk . . . . . . . . . . . . . . . . . . . 54
Item 8 Financial Statements and Supplementary Data . . . . . . . .
. . . . . . . . . . . . . . . . . . . . . . 57
Item 9 Changes in and Disagreements With Accountants on
Accounting and Financial
Disclosure . . . . . . . . . . . . . . . . . . . . . . . . . . . . . . . . . . . . . . .
. . . . . . . . . . . . . . . . . . . 96
Item 9A Controls and Procedures . . . . . . . . . . . . . . . . . . . . . . .
. . . . . . . . . . . . . . . . . . . . . . . . . 96
Item 9B Other Information . . . . . . . . . . . . . . . . . . . . . . . . . . .
. . . . . . . . . . . . . . . . . . . . . . . . . . . 96
PART III.
Item 10 Directors, Executive Officers and Corporate
Governance . . . . . . . . . . . . . . . . . . . . . . 98
Item 11 Executive Compensation . . . . . . . . . . . . . . . . . . . . . . .
. . . . . . . . . . . . . . . . . . . . . . . . . 98
Item 12 Security Ownership of Certain Beneficial Owners and
Management and Related
Stockholder Matters . . . . . . . . . . . . . . . . . . . . . . . . . . . . . . . .
. . . . . . . . . . . . . . . . . . 98
Item 13 Certain Relationships and Related Transactions, and
Director Independence . . . . . 98
Item 14 Principal Accountant Fees and Services . . . . . . . . . . . .
. . . . . . . . . . . . . . . . . . . . . . . 98
PART IV.
Item 15 Exhibits and Financial Statement Schedules . . . . . . . . .
. . . . . . . . . . . . . . . . . . . . . . . 99
Item 16 Form 10-K Summary . . . . . . . . . . . . . . . . . . . . . . . . . .
. . . . . . . . . . . . . . . . . . . . . . . . . N/A
SIGNATURES . . . . . . . . . . . . . . . . . . . . . . . . . . . . . . . . . . . .
. . . . . . . . . . . . . . . . . . . . . . . . . . . . . . 104
PART I
ITEM 1. BUSINESS
General
Our principal business activities are the development, marketing
and distribution of branded
performance apparel, footwear and accessories for men, women
and youth. The brand’s performance
apparel and footwear are engineered in many designs and styles
for wear in nearly every climate to
provide a performance alternative to traditional products. Our
products are sold worldwide and are
worn by athletes at all levels, from youth to professional, on
playing fields around the globe, as well as
by consumers with active lifestyles.
Our net revenues are generated primarily from the wholesale
sales of our products to national,
regional, independent and specialty retailers and distributors.
We also generate net revenue from the
sale of our products through our direct to consumer sales
channel, which includes our brand and
factory house stores and websites, from product licensing and
from digital platform licensing and
subscriptions and digital advertising through our Connected
Fitness business. A large majority of our
products are sold in North America; however we believe that
our products appeal to athletes and
consumers with active lifestyles around the globe.
Internationally, our net revenues are generated from
a mix of wholesale sales to retailers and distributors and sales
through our direct to consumer sales
channels, and license revenue from sales by our third party
licensees.
We plan to continue to grow our business over the long term
through increased sales of our
apparel, footwear and accessories, expansion of our wholesale
distribution, growth in our direct to
consumer sales channel and expansion in international markets.
Our digital strategy is focused on
supporting these long term objectives, emphasizing connecting
and engaging with our consumers
through multiple digital touch points, including through our
Connected Fitness business.
We were incorporated as a Maryland corporation in 1996. As
used in this report, the terms “we,”
“our,” “us,” “Under Armour” and the “Company” refer to Under
Armour, Inc. and its subsidiaries unless
the context indicates otherwise. We have registered trademarks
around the globe, including UNDER
ARMOUR®, HEATGEAR®, COLDGEAR®,
ALLSEASONGEAR® and the Under Armour UA Logo, and
we have applied to register many other trademarks. This Annual
Report on Form 10-K also contains
additional trademarks and tradenames of our Company and our
subsidiaries. All trademarks and
tradenames appearing in this Annual Report on Form 10-K are
the property of their respective holders.
Products
Our product offerings consist of apparel, footwear and
accessories for men, women and youth. We
market our products at multiple price levels and provide
consumers with products that we believe are a
superior alternative to traditional athletic products. In 2017,
sales of apparel, footwear and accessories
represented 66%, 21% and 9% of net revenues, respectively.
Licensing arrangements, primarily for the
sale of our products, and revenue from our Connected Fitness
business represented the remaining 4%
of net revenues. Refer to Note 16 to the Consolidated Financial
Statements for net revenues by
product.
Apparel
Our apparel is offered in a variety of styles and fits intended to
enhance comfort and mobility,
regulate body temperature and improve performance regardless
of weather conditions. Our apparel is
engineered to replace traditional non-performance fabrics in the
world of athletics and fitness with
performance alternatives designed and merchandised along
gearlines. Our three gearlines are
1
marketed to tell a very simple story about our highly technical
products and extend across the sporting
goods, outdoor and active lifestyle markets. We market our
apparel for consumers to choose
HEATGEAR® when it is hot, COLDGEAR® when it is cold and
ALLSEASONGEAR® between the
extremes. Within each gearline our apparel comes in three
primary fit types: compression (tight fit),
fitted (athletic fit) and loose (relaxed).
HEATGEAR® is designed to be worn in warm to hot
temperatures under equipment or as a single
layer. While a sweat-soaked traditional non-performance T-shirt
can weigh two to three pounds,
HEATGEAR® is engineered with a microfiber blend designed
to wick moisture from the body which
helps the body stay cool, dry and light. We offer HEATGEAR®
in a variety of tops and bottoms in a
broad array of colors and styles for wear in the gym or outside
in warm weather.
COLDGEAR® is designed to wick moisture from the body
while circulating body heat from hot
spots to help maintain core body temperature. Our
COLDGEAR® apparel provides both dryness and
warmth in a single light layer that can be worn beneath a jersey,
uniform, protective gear or ski-vest,
and our COLDGEAR® outerwear products protect the athlete,
as well as the coach and the fan from
the outside in. Our COLDGEAR® products generally sell at
higher prices than our other gearlines.
ALLSEASONGEAR® is designed to be worn in between
extreme temperatures and uses technical
fabrics to keep the wearer cool and dry in warmer temperatures
while preventing a chill in cooler
temperatures.
Footwear
Our footwear offerings include running, basketball, cleated,
slides and performance training, and
outdoor footwear. Our footwear is light, breathable and built
with performance attributes for athletes.
Our footwear is designed with innovative technologies
including UA HOVR™, Anafoam™, UA Clutch
Fit® and Charged Cushioning®, which provide stabilization,
directional cushioning and moisture
management engineered to maximize the athlete’s comfort and
control.
Accessories
Accessories primarily includes the sale of athletic performance
gloves, bags and headwear. Our
accessories include HEATGEAR® and COLDGEAR®
technologies and are designed with advanced
fabrications to provide the same level of performance as our
other products.
Connected Fitness
We offer digital fitness subscriptions, along with digital
advertising through our MapMyFitness,
MyFitnessPal and Endomondo applications.
License
We have agreements with our licensees to develop Under
Armour apparel, accessories and
equipment. Our product, marketing and sales teams are involved
in substantially all steps of the design
and go to market process in order to maintain brand standards
and consistency. During 2017, our
licensees offered collegiate, National Football League (“NFL),
Major League Baseball (“MLB”), and
National Basketball Association (“NBA”) apparel and
accessories, baby and kids’ apparel, team
uniforms, socks, water bottles, eyewear, phone and golf
accessories and other specific hard goods
equipment that feature performance advantages and
functionality similar to our other product offerings.
2
Marketing and Promotion
We currently focus on marketing and selling our products to
consumers primarily for use in
athletics, fitness, training, outdoor activities and as part of an
active lifestyle. We seek to drive
consumer demand by building brand equity and awareness that
our products deliver advantages to
help athletes perform better.
Sports Marketing
Our marketing and promotion strategy begins with providing
and selling our products to high-
performing athletes and teams on the high school, collegiate and
professional levels. We execute this
strategy through outfitting agreements, professional and
collegiate sponsorships, individual athlete
agreements and by providing and selling our products directly
to team equipment managers and to
individual athletes. We also seek to sponsor events to drive
awareness and brand authenticity from a
grassroots level by hosting combines, camps and clinics for
young athletes in many sports at regional
sites across the country. As a result, our products are seen on
the field, giving them exposure to
various consumer audiences through the internet, television,
magazines and live at sporting events.
This exposure to consumers helps us establish on-field
authenticity as consumers can see our
products being worn by high-performing athletes.
We are the official outfitter of athletic teams in several high-
profile collegiate conferences. We are
an official supplier of footwear and gloves to the NFL. We are
the Official Performance Footwear
Supplier of MLB and a partner with the NBA which allows us to
market our NBA athletes in game
uniforms in connection with our basketball footwear. We are the
official headwear and performance
apparel provider for the NFL Scouting Combine and the official
partner and title sponsor of the NBA
Draft Combine, in each case with the right to sell licensed
combine training apparel and headwear. In
2016, we entered into an agreement to be the Official On-Field
Uniform Supplier, Official Authentic
Performance Apparel Partner, and Official Connected Fitness
Partner of MLB, now beginning with the
2019 season, which will allow us to provide on-field uniforms,
apparel, and accessories to all thirty MLB
clubs on an exclusive basis, and, together with our
manufacturing partner sell a broad range of MLB
licensed merchandise. Internationally, we sponsor and sell our
products to several European and Latin
American soccer and rugby teams, which helps drive brand
awareness in various countries and
regions around the world.
Media
We feature our products in a variety of national digital,
broadcast, and print media outlets. We also
utilize social and mobile media to engage consumers and
promote connectivity with our brand and our
products, and plan to increase our use of social media
promotion in the future. For example, in 2017,
we launched our first entirely digital marketing campaign for
our “Unlike Any” women’s campaign,
which included a variety of content on various social media
platforms.
Retail Presentation
The primary component of our retail marketing strategy is to
increase brand floor space dedicated
to our products within our major retail accounts. The design and
funding of Under Armour concept
shops within our major retail accounts has been a key initiative
for securing prime floor space,
educating the consumer and creating an exciting environment
for the consumer to experience our
brand. Under Armour concept shops enhance our brand’s
presentation within our major retail accounts
with a shop-in-shop approach, using dedicated floor space
exclusively for our products, including
flooring, lighting, walls, displays and images.
3
Sales and Distribution
The majority of our sales are generated through wholesale
channels, which include national and
regional sporting goods chains, independent and specialty
retailers, department store chains,
institutional athletic departments and leagues and teams. In
addition, we sell our products to
independent distributors in various countries where we
generally do not have direct sales operations
and through licensees.
We also sell our products directly to consumers through our
own network of brand and factory
house stores in our North America, Europe, the Middle East and
Africa (“EMEA”), Latin America and
Asia-Pacific operating segments, and through websites globally.
Factory house stores serve an
important role in our overall inventory management by allowing
us to sell a significant portion of
excess, discontinued and out-of-season products while
maintaining the pricing integrity of our brand in
our other distribution channels. Through our brand house stores,
consumers experience our brand
first-hand and have broader access to our performance products.
In 2017, sales through our
wholesale, direct to consumer, licensing and Connected Fitness
channels represented 61%, 35%, 2%
and 2% of net revenues, respectively.
We believe the trend toward performance products is global and
plan to continue to introduce our
products and simple merchandising story to athletes throughout
the world. We are introducing our
performance apparel, footwear and accessories outside of North
America in a manner consistent with
our past brand-building strategy, including selling our products
directly to teams and individual athletes
in these markets, thereby providing us with product exposure to
broad audiences of potential
consumers.
Our primary business operates in four geographic segments: (1)
North America, comprising the
United States and Canada, (2) EMEA, (3) Asia-Pacific, and (4)
Latin America. Each of these
geographic segments operate predominantly in one industry: the
design, development, marketing and
distribution of performance apparel, footwear and accessories.
We also operate our Connected Fitness
business as a separate segment. The following table presents net
revenues by segment for each of the
years ending December 31, 2017, 2016 and 2015:
Year ended December 31,
2017 2016 2015
(In thousands) Net Revenues
% of
Net Revenues Net Revenues
% of
Net Revenues Net Revenues
% of
Net Revenues
North America $3,802,406 76.5% $4,005,314 83.0% $3,455,737
87.2%
EMEA 469,997 9.4 330,584 6.9 203,109 5.1
Asia-Pacific 433,647 8.7 268,607 5.6 144,877 3.7
Latin America 181,324 3.6 141,793 2.9 106,175 2.7
Connected
Fitness 89,179 1.8 80,447 1.6 53,415 1.3
Intersegment
Eliminations — — (1,410) — — —
Total net
revenues $4,976,553 100.0% $4,825,335 100.0% $3,963,313
100.0%
North America
Our North America segment accounted for approximately 76.5%
of our net revenues for 2017. We
sell our branded apparel, footwear and accessories in North
America through our wholesale and direct
to consumer channels. Net revenues generated from the sales of
our products in the United States
4
were $3.6 billion, $3.8 billion and $3.3 billion for the years
ended December 31, 2017, 2016 and 2015
respectively. See Note 16 to the Consolidated Financial
Statements. No customers accounted for more
than 10% of our net revenues in 2017.
Our direct to consumer sales are generated through our brand
and factory house stores and
internet websites. As of December 31, 2017, we had 162 factory
house stores in North America
primarily located in outlet centers throughout the United States.
As of December 31, 2017, we had 19
brand house stores in North America. Consumers can purchase
our products directly from our
e-commerce website, www.underarmour.com.
In addition, we earn licensing revenue in North America based
on our licensees’ sale of collegiate
and league apparel and accessories, as well as sales of other
licensed products. In order to maintain
consistent quality and performance, we pre-approve all products
manufactured and sold by our
licensees, and our quality assurance team strives to ensure that
the products meet the same quality
and compliance standards as the products that we sell directly.
We distribute the majority of our products sold to our North
American wholesale customers and
our brand and factory house stores from distribution facilities
we lease and operate in California,
Maryland and Tennessee. In addition, we distribute our products
in North America through third-party
logistics providers with primary locations in Canada, New
Jersey and Florida. In some instances, we
arrange to have products shipped from the factories that
manufacture our products directly to
customer-designated facilities.
International
Approximately 21.7% of our net revenues were generated from
our international segments in
2017. We plan to continue to grow our business over the long
term in part through expansion in
international markets.
EMEA
We sell our apparel, footwear and accessories primarily through
wholesale customers, website
operations, independent distributors and a limited number of
stores we operate in certain European
countries. We also sell our branded products to various sports
clubs and teams in Europe. We
generally distribute our products to our retail customers and e-
commerce consumers in Europe through
a third-party logistics provider. We sell our apparel, footwear
and accessories through independent
distributors in the Middle East and Africa. In 2017 we began
selling our products to wholesale
customers in Russia.
Asia-Pacific
We sell our apparel, footwear and accessories products in
China, South Korea and Australia
through stores operated by our distribution and wholesale
partners, along with website operations and
stores we operate. We also sell our products to distributors in
New Zealand, Taiwan, Hong Kong and
other countries in Southeast Asia where we do not have direct
sales operations. We distribute our
products in Asia-Pacific primarily through a third-party
logistics provider based out of Hong Kong.
We have a license agreement with Dome Corporation, which
produces, markets and sells our
branded apparel, footwear and accessories in Japan. Our
branded products are sold in Japan to large
sporting goods retailers, independent specialty stores and
professional sports teams, and through
licensee-owned retail stores. We hold a cost-based minority
investment in Dome.
5
Latin America
We sell our products in Mexico, Chile, Brazil and Argentina
through wholesale customers, website
operations and brand and factory house stores. In these
countries we operate through third-party
distribution facilities. In other Latin American countries we
distribute our products through independent
distributors which are sourced through our international
distribution hubs in Hong Kong, Jordan and
Panama.
Connected Fitness
In 2013, we began offering digital fitness subscriptions and
licenses, along with digital advertising
through our MapMyFitness platform. In 2015, we acquired the
Endomondo and MyFitnessPal platforms
to create our Connected Fitness business. Approximately 1.8%
of our net revenues were generated
from our Connected Fitness business in 2017. We plan to
engage and grow this community by
developing innovative services and other digital solutions to
impact how athletes and fitness-minded
individuals train, perform and live.
Seasonality
Historically, we have recognized a majority of our net revenues
and a significant portion of our
income from operations in the last two quarters of the year,
driven primarily by increased sales volume
of our products during the fall selling season, including our
higher priced cold weather products, along
with a larger proportion of higher margin direct to consumer
sales. The level of our working capital
generally reflects the seasonality and growth in our business.
We generally expect inventory, accounts
payable and certain accrued expenses to be higher in the second
and third quarters in preparation for
the fall selling season.
Product Design and Development
Our products are manufactured with technical fabrications
produced by third parties and
developed in collaboration with our product development teams.
This approach enables us to select
and create superior, technically advanced fabrics, produced to
our specifications, while focusing our
product development efforts on design, fit, climate and product
end use.
We seek to regularly upgrade and improve our products with the
latest in innovative technology
while broadening our product offerings. Our goal, to deliver
superior performance in all our products,
provides our developers and licensees with a clear, overarching
direction for the brand and helps them
identify new opportunities to create performance products that
meet the changing needs of athletes.
We design products with “visible technology,” utilizing color,
texture and fabrication to enhance our
customers’ perception and understanding of product use and
benefits.
Our product development team works closely with our sports
marketing and sales teams as well
as professional and collegiate athletes to identify product trends
and determine market needs. For
example, these teams worked closely to identify the opportunity
and market for our COLDGEAR®
Infrared product, which is a ceramic print technology on the
inside of our garments that provides
athletes with lightweight warmth, and Speedform®, a
proprietary 3-dimensional molding technology for
footwear which delivers superior fit and feel. In 2017 we also
opened our newest center for footwear
performance innovation located in Portland, Oregon, bringing
together footwear design and
development teams into a centralized location.
Sourcing, Manufacturing and Quality Assurance
Many of the specialty fabrics and other raw materials used in
our apparel products are technically
advanced products developed by third parties and may be
available, in the short term, from a limited
6
number of sources. The fabric and other raw materials used to
manufacture our apparel products are
sourced by our contracted manufacturers from a limited number
of suppliers pre-approved by us. In
2017, approximately 53% of the fabric used in our apparel
products came from five suppliers. These
fabric suppliers have primary locations in Taiwan, Malaysia and
Mexico. The fabrics used by our
suppliers and manufacturers are primarily synthetic fabrics and
involve raw materials, including
petroleum based products that may be subject to price
fluctuations and shortages. We also use cotton
in our apparel products, as blended fabric and also in our
CHARGED COTTON® line. Cotton is a
commodity that is subject to price fluctuations and supply
shortages. Additionally, our footwear uses
raw materials that are sourced from a diverse base of third party
suppliers. This includes chemicals
and petroleum-based components such as rubber that are also
subject to price fluctuations and supply
shortages.
Substantially all of our products are manufactured by
unaffiliated manufacturers. In 2017, our
apparel and accessories products were manufactured by 39
primary contract manufacturers, operating
in 17 countries, with approximately 61% of our apparel and
accessories products manufactured in
Jordan, Vietnam, China and Malaysia. Of our 39 primary
contract manufacturers, 10 produced
approximately 57% of our apparel and accessories products. In
2017, our footwear products were
manufactured by seven primary contract manufacturers,
operating primarily in Vietnam, China and
Indonesia. Of our seven primary contract manufacturers, five
produced approximately 83% of our
footwear products.
All manufacturers across all product divisions are evaluated for
quality systems, social compliance
and financial strength by our internal teams prior to being
selected and on an ongoing basis. Where
appropriate, we strive to qualify multiple manufacturers for
particular product types and fabrications.
We also seek out vendors that can perform multiple
manufacturing stages, such as procuring raw
materials and providing finished products, which helps us to
control our cost of goods sold. We enter
into a variety of agreements with our contract manufacturers,
including non-disclosure and
confidentiality agreements, and we require that all of our
manufacturers adhere to a code of conduct
regarding quality of manufacturing and working conditions and
other social concerns. We do not,
however, have any long term agreements requiring us to utilize
any manufacturer, and no
manufacturer is required to produce our products in the long
term. We have subsidiaries strategically
located near our key partners to support our manufacturing,
quality assurance and sourcing efforts for
our products. We also manufacture a limited number of products
primarily for high-profile athletes and
teams, on-premises in our quick turn, Special Make-Up Shop
located at one of our facilities in
Maryland.
Inventory Management
Inventory management is important to the financial condition
and operating results of our
business. We manage our inventory levels based on existing
orders, anticipated sales and the rapid-
delivery requirements of our customers. Our inventory strategy
is focused on continuing to meet
consumer demand while improving our inventory efficiency
over the long term by putting systems and
processes in place to improve our inventory management. These
systems and processes, including
our new global operating and financial reporting information
technology system, are designed to
improve our forecasting and supply planning capabilities. In
addition to systems and processes, key
areas of focus that we believe will enhance inventory
performance are added discipline around the
purchasing of product, production lead time reduction, and
better planning and execution in selling of
excess inventory through our factory house stores and other
liquidation channels.
Our practice, and the general practice in the apparel, footwear
and accessory industries, is to offer
retail customers the right to return defective or improperly
shipped merchandise. As it relates to new
product introductions, which can often require large initial
launch shipments, we commence production
7
before receiving orders for those products from time to time.
This can affect our inventory levels as we
build pre-launch quantities.
Intellectual Property
We believe we own the material trademarks used in connection
with the marketing, distribution
and sale of our products, both domestically and internationally,
where our products are currently sold
or manufactured. Our major trademarks include the UA Logo
and UNDER ARMOUR®, both of which
are registered in the United States, Canada, Mexico, the
European Union, Japan, China and numerous
other countries. We also own trademark registrations for other
trademarks including, among others,
UA®, ARMOUR®, HEATGEAR®, COLDGEAR®,
ALLSEASONGEAR®, PROTECT THIS HOUSE®, I
WILL®, and many trademarks that incorporate the term
ARMOUR such as, ARMOURSTORM®,
ARMOUR® FLEECE, and ARMOUR BRA®. We also own
applications to protect connected fitness
branding such as UNDER ARMOUR CONNECTED FITNESS™.
We own domain names for our
primary trademarks (most notably underarmour.com and
ua.com) and hold copyright registrations for
several commercials, as well as for certain artwork. We intend
to continue to strategically register, both
domestically and internationally, trademarks and copyrights we
utilize today and those we develop in
the future. We will continue to aggressively enforce our
trademarks and pursue those who infringe,
both domestically and internationally.
We believe the distinctive trademarks we use in connection with
our products are important in
building our brand image and distinguishing our products from
those of others. These trademarks are
among our most valuable assets. In addition to our distinctive
trademarks, we also place significant
value on our trade dress, which is the overall image and
appearance of our products, and we believe
our trade dress helps to distinguish our products in the
marketplace.
We traditionally have had limited patent protection on much of
the technology, materials and
processes used in the manufacture of our products. In addition,
patents are increasingly important with
respect to our innovative products and new businesses and
investments, particularly in our Connected
Fitness business. As we continue to expand and drive innovation
in our products, we expect to seek
patent protection on products, features and concepts we believe
to be strategic and important to our
business. We will continue to strategically file patent
applications where we deem appropriate to
protect our new products, innovations and designs. We expect
the number of applications to increase
as our business grows and as we continue to expand our
products and innovate.
Competition
The market for performance apparel, footwear and accessories
is highly competitive and includes
many new competitors as well as increased competition from
established companies expanding their
production and marketing of performance products. Many of the
fabrics and technology used in
manufacturing our products are not unique to us, and we own a
limited number of fabric or process
patents. Many of our competitors are large apparel and footwear
companies with strong worldwide
brand recognition and significantly greater resources than us,
such as Nike and Adidas. We also
compete with other manufacturers, including those specializing
in performance apparel and footwear,
and private label offerings of certain retailers, including some
of our retail customers.
In addition, we must compete with others for purchasing
decisions, as well as limited floor space at
retailers. We believe we have been successful in this area
because of the relationships we have
developed and as a result of the strong sales of our products.
However, if retailers earn higher margins
from our competitors’ products, they may favor the display and
sale of those products.
We believe we have been able to compete successfully because
of our brand image and
recognition, the performance and quality of our products and
our selective distribution policies. We also
8
believe our focused gearline merchandising story differentiates
us from our competition. In the future
we expect to compete for consumer preferences and expect that
we may face greater competition on
pricing. This may favor larger competitors with lower
production costs per unit that can spread the
effect of price discounts across a larger array of products and
across a larger customer base than
ours. The purchasing decisions of consumers for our products
often reflect highly subjective
preferences that can be influenced by many factors, including
advertising, media, product
sponsorships, product improvements and changing styles.
Employees
As of December 31, 2017, we had approximately 15,800
employees, including approximately
9,900 in our brand and factory house stores and approximately
1,500 at our distribution facilities.
Approximately 6,900 of our employees were full-time. Most of
our employees are located in the United
States. None of our employees in the United States are currently
covered by a collective bargaining
agreement and there are no material collective bargaining
agreements in effect in any of our
international locations. We have had no labor-related work
stoppages, and we believe our relations
with our employees are good.
Available Information
We will make available free of charge on or through our website
at www.underarmour.com our
annual reports on Form 10-K, quarterly reports on Form 10-Q,
current reports on Form 8-K and
amendments to these reports filed or furnished pursuant to
Section 13(a) or 15(d) of the Exchange Act
as soon as reasonably practicable after we file these materials
with the Securities and Exchange
Commission. We also post on this website our key corporate
governance documents, including our
board committee charters, our corporate governance guidelines
and our code of conduct and ethics.
9
ITEM 1A. RISK FACTORS
Forward-Looking Statements
Some of the statements contained in this Form 10-K and the
documents incorporated herein by
reference constitute forward-looking statements. Forward-
looking statements relate to expectations,
beliefs, projections, future plans and strategies, anticipated
events or trends and similar expressions
concerning matters that are not historical facts, such as
statements regarding our future financial
condition or results of operations, our prospects and strategies
for future growth, our anticipated
charges and restructuring costs and the timing of these
measures, the impact of recent tax reform
legislation on our results of operations, the development and
introduction of new products and the
implementation of our marketing and branding strategies. In
many cases, you can identify forward-
looking statements by terms such as “may,” “will,” “should,”
“expects,” “plans,” “anticipates,” “believes,”
“estimates,” “predicts,” “outlook,” “potential” or the negative
of these terms or other comparable
terminology.
The forward-looking statements contained in this Form 10-K
and the documents incorporated
herein by reference reflect our current views about future events
and are subject to risks, uncertainties,
assumptions and changes in circumstances that may cause
events or our actual activities or results to
differ significantly from those expressed in any forward-looking
statement. Although we believe that the
expectations reflected in the forward-looking statements are
reasonable, we cannot guarantee future
events, results, actions, levels of activity, performance or
achievements. Readers are cautioned not to
place undue reliance on these forward-looking statements. A
number of important factors could cause
actual results to differ materially from those indicated by these
forward-looking statements, including,
but not limited to, those factors described in “Risk Factors” and
“Management’s Discussion and
Analysis of Financial Condition and Results of Operations.”
These factors include without limitation:
• changes in general economic or market conditions that could
affect overall consumer
spending or our industry;
• changes to the financial health of our customers;
• our ability to successfully execute our long-term strategies;
• our ability to successfully execute any restructuring plans and
realize expected benefits;
• our ability to effectively drive operational efficiency in our
business;
• our ability to manage the increasingly complex operations of
our global business;
• our ability to comply with existing trade and other regulations,
and the potential impact of new
trade and tax regulations on our profitability;
• our ability to effectively develop and launch new, innovative
and updated products;
• our ability to accurately forecast consumer demand for our
products and manage our
inventory in response to changing demands;
• any disruptions, delays or deficiencies in the design,
implementation or application of our new
global operating and financial reporting information technology
system;
• increased competition causing us to lose market share or
reduce the prices of our products or
to increase significantly our marketing efforts;
• fluctuations in the costs of our products;
• loss of key suppliers or manufacturers or failure of our
suppliers or manufacturers to produce
or deliver our products in a timely or cost-effective manner,
including due to port disruptions;
• our ability to further expand our business globally and to drive
brand awareness and
consumer acceptance of our products in other countries;
10
• our ability to accurately anticipate and respond to seasonal or
quarterly fluctuations in our
operating results;
• our ability to successfully manage or realize expected results
from acquisitions and other
significant investments or capital expenditures;
• risks related to foreign currency exchange rate fluctuations;
• our ability to effectively market and maintain a positive brand
image;
• the availability, integration and effective operation of
information systems and other
technology, as well as any potential interruption of such
systems or technology;
• risks related to data security or privacy breaches;
• our ability to raise additional capital required to grow our
business on terms acceptable to us;
• our potential exposure to litigation and other proceedings; and
• our ability to attract key talent and retain the services of our
senior management and key
employees.
The forward-looking statements contained in this Form 10-K
reflect our views and assumptions
only as of the date of this Form 10-K. We undertake no
obligation to update any forward-looking
statement to reflect events or circumstances after the date on
which the statement is made or to reflect
the occurrence of unanticipated events.
Our results of operations and financial condition could be
adversely affected by numerous
risks. You should carefully consider the risk factors detailed
below in conjunction with the
other information contained in this Form 10-K. Should any of
these risks actually materialize,
our business, financial condition and future prospects could be
negatively impacted.
During a downturn in the economy, consumer purchases of
discretionary items are affected,
which could materially harm our sales, profitability and
financial condition.
Many of our products may be considered discretionary items for
consumers. Factors affecting the
level of consumer spending for such discretionary items include
general economic conditions, the
availability of consumer credit and consumer confidence in
future economic conditions. Uncertainty in
global economic conditions continues, and trends in consumer
discretionary spending remain
unpredictable. However, consumer purchases of discretionary
items tend to decline during
recessionary periods when disposable income is lower or during
other periods of economic instability
or uncertainty, which may slow our growth more than we
anticipate. A downturn in the economies in
markets in which we sell our products, particularly in North
America, may materially harm our sales,
profitability and financial condition.
We derive a substantial portion of our sales from large
wholesale customers. If the financial
condition of our customers declines, our financial condition and
results of operations could be
adversely impacted.
In 2017, sales through our wholesale channel represented
approximately 61% of our net
revenues. We extend credit to our wholesale customers based on
an assessment of a customer’s
financial condition, generally without requiring collateral. We
face increased risk of order reduction or
cancellation when dealing with financially ailing customers or
customers struggling with economic
uncertainty. During weak economic conditions, customers may
be more cautious with orders or may
slow investments necessary to maintain a high quality in-store
experience for consumers, which may
result in lower sales of our products. In addition, a slowing
economy in our key markets or a continued
11
decline in consumer purchases of sporting goods generally
could have an adverse effect on the
financial health of our customers. From time to time certain of
our customers have experienced
financial difficulties. To the extent one or more of our
customers experience significant financial
difficulty, bankruptcy, insolvency or cease operations, this
could have a material adverse effect on our
sales, our ability to collect on receivables and our financial
condition and results of operations.
A decline in sales to, or the loss of, one or more of our key
customers could result in a material
loss of net revenues and negatively impact our prospects for
growth.
We generate a significant portion of our wholesale revenues
from sales to our largest customers.
We currently do not enter into long term sales contracts with
our key customers, relying instead on our
relationships with these customers and on our position in the
marketplace. As a result, we face the risk
that these key customers may not increase their business with us
as we expect, or may significantly
decrease their business with us or terminate their relationship
with us. The failure to increase our sales
to these customers as much as we anticipate would have a
negative impact on our growth prospects
and any decrease or loss of these key customers’ business could
result in a material decrease in our
net revenues and net income. In addition, our customers
continue to experience ongoing industry
consolidation, particularly in the sports specialty sector. As this
consolidation continues, it increases
the risk that if any one customer significantly reduces their
purchases of our products, we may be
unable to find sufficient alternative customers to continue to
grow our net revenues, or our net
revenues may decline.
We may not successfully execute our long-term strategies,
which may negatively impact our
results of operations.
Our ability to execute on our long-term strategies depends, in
part, on successfully executing on
strategic growth initiatives in key areas, such as our
international business, footwear and our global
direct to consumer sales channel. Our growth in these areas
depends on our ability to continue to
successfully expand our global network of brand and factory
house stores, grow our e-commerce and
mobile application offerings throughout the world and continue
to successfully increase our product
offerings and market share in footwear. Our ability to continue
to invest in these growth initiatives in the
near-term may be negatively impacted by the performance of
our North America business, which
represented 77% of our total net revenues in 2017 but declined
by 5% over 2016, and in particular the
performance of our wholesale channel in North America. Our
ability to execute on our long-term
strategy also depends on our ability to successfully manage our
cost structure and drive return on our
investments. If we cannot effectively execute our long-term
growth strategies while managing costs
effectively, our business and results of operations could be
negatively impacted.
We may not fully realize the expected benefits of any
restructuring plans or other operating or
cost-saving initiatives, which may negatively impact our
profitability.
We have recently announced restructuring plans designed to
more closely align our financial
resources against the critical priorities of our business. These
plans have included initiatives to improve
operational efficiencies, and our 2017 restructuring plan
included a reduction in our global workforce.
We may not achieve our targeted operational improvements and
efficiencies, which could adversely
impact our results of operations and financial condition. In
addition, implementing any restructuring
plan presents significant potential risks that may impair our
ability to achieve anticipated operating
improvements and/or cost reductions. These risks include,
among others, higher than anticipated costs
in implementing our restructuring plans, management
distraction from ongoing business activities,
failure to maintain adequate controls and procedures while
executing our restructuring plans, damage
to our reputation and brand image and workforce attrition
beyond planned reductions. If we fail to
achieve targeted operating improvements and/or cost reductions,
our profitability and results of
12
operations could be negatively impacted and we may be
required to implement additional restructuring-
related activities, which may be dilutive to our earnings in the
short term.
We must successfully manage the increasingly complex
operations of our global business, or
our business and results of operations may be negatively
impacted.
We have expanded our business and operations rapidly since our
inception and our net revenues
have increased to $4,976.6 million in 2017 from $2,332.1
million in 2013. We must continue to
successfully manage the operational difficulties associated with
expanding our business to meet
increased consumer demand throughout the world. We may
experience difficulties in obtaining
sufficient raw materials and manufacturing capacity to produce
our products, as well as delays in
production and shipments, as our products are subject to risks
associated with overseas sourcing and
manufacturing. We must also continually evaluate the need to
expand critical functions in our business,
including sales and marketing, product development and
distribution functions, our management
information systems and other processes and technology. To
support these functions, we must hire,
train and manage an increasing number of employees, and
obtain more space to support our
expanding workforce. We may not be successful in undertaking
these types of initiatives cost
effectively or at all, and could experience serious operating
difficulties if we fail to do so. These growth
efforts could also increase the strain on our existing resources.
If we experience difficulties in
supporting the growth of our business, we could experience an
erosion of our brand image and a
decrease in net revenues and net income.
If we are unable to anticipate consumer preferences,
successfully develop and introduce new,
innovative and updated products or engage our consumers, our
net revenues and profitability
may be negatively impacted.
Our success depends on our ability to identify and originate
product trends as well as to anticipate
and react to changing consumer demands in a timely manner.
All of our products are subject to
changing consumer preferences that cannot be predicted with
certainty. In addition, long lead times for
certain of our products may make it hard for us to quickly
respond to changes in consumer demands.
Our new products may not receive consumer acceptance as
consumer preferences could shift rapidly
to different types of performance or other sports products or
away from these types of products
altogether, and our future success depends in part on our ability
to anticipate and respond to these
changes.
Even if we are successful in anticipating consumer preferences,
our ability to adequately react to
and address those preferences will in part depend upon our
continued ability to develop and introduce
innovative, high-quality products. If we fail to introduce
technical innovation in our products or design
products in the categories and styles that consumers want,
demand for our products could decline and
our brand image could be negatively impacted. Our failure to
anticipate and respond timely to changing
consumer preferences or to effectively introduce new products
and enter into new product categories
that are accepted by consumers could result in a decrease in net
revenues and excess inventory
levels, which could have a material adverse effect on our
financial condition. In addition, if we
experience problems with the quality of our products, our brand
reputation may be negatively impacted
and we may incur substantial expense to remedy the problems,
which could negatively impact our
results of operations.
In addition, consumer preferences regarding the shopping
experience continue to rapidly evolve. If
we or our wholesale customers do not provide consumers with
an attractive in-store experience, or if
we do not continue to provide an engaging and user-friendly
digital commerce platform that attracts
consumers, our brand image and results of operations could be
negatively impacted.
13
Our results of operations could be materially harmed if we are
unable to accurately forecast
demand for our products.
To ensure adequate inventory supply, we must forecast
inventory needs and place orders with our
manufacturers before firm orders are placed by our customers.
In addition, a significant portion of our
net revenues are generated by at-once orders for immediate
delivery to customers, particularly during
the last two quarters of the year, which historically has been our
peak season. If we fail to accurately
forecast customer demand we may experience excess inventory
levels or a shortage of product to
deliver to our customers.
Factors that could affect our ability to accurately forecast
demand for our products include:
• an increase or decrease in consumer demand for our products;
• our failure to accurately forecast consumer acceptance for our
new products;
• product introductions by competitors;
• unanticipated changes in general market conditions or other
factors, which may result in
cancellations of advance orders or a reduction or increase in the
rate of reorders or at-once
orders placed by retailers;
• the impact on consumer demand due to unseasonable weather
conditions;
• weakening of economic conditions or consumer confidence in
future economic conditions,
which could reduce demand for discretionary items, such as our
products; and
• terrorism or acts of war, or the threat thereof, or political or
labor instability or unrest which
could adversely affect consumer confidence and spending or
interrupt production and
distribution of product and raw materials.
Inventory levels in excess of customer demand may result in
inventory write-downs or write-offs
and the sale of excess inventory at discounted prices or in less
preferred distribution channels, which
could impair our brand image and have an adverse effect on
gross margin. In addition, if we
underestimate the demand for our products, our manufacturers
may not be able to produce products to
meet our customer requirements, and this could result in delays
in the shipment of our products and
our ability to recognize revenue, lost sales, as well as damage to
our reputation and retailer and
distributor relationships.
The difficulty in forecasting demand also makes it difficult to
estimate our future results of
operations and financial condition from period to period. A
failure to accurately predict the level of
demand for our products could adversely impact our
profitability or cause us not to achieve our
expected financial results.
Sales of performance products may not continue to grow or may
decline, which could
negatively impact our sales and our ability to grow our
business.
We believe continued growth in industry-wide sales of
performance apparel, footwear and
accessories will be largely dependent on consumers continuing
to transition from traditional
alternatives to performance products. If consumers are not
convinced these products are a better
choice than traditional alternatives, growth in the industry and
our business could be adversely
affected. In addition, because performance products are often
more expensive than traditional
alternatives, consumers who are convinced these products
provide a better alternative may still not be
convinced they are worth the extra cost. If industry-wide sales
of performance products do not continue
to grow or rather decline, our sales could be negatively
impacted and we may not achieve our
expected financial results. In addition, our ability to continue to
grow our business in line with our
expectations could be adversely impacted.
14
We operate in highly competitive markets and the size and
resources of some of our
competitors may allow them to compete more effectively than
we can, resulting in a loss of our
market share and a decrease in our net revenues and gross
profit.
The market for performance apparel, footwear and accessories
is highly competitive and includes
many new competitors as well as increased competition from
established companies expanding their
production and marketing of performance products. Because we
own a limited number of fabric or
process patents, our current and future competitors are able to
manufacture and sell products with
performance characteristics and fabrications similar to certain
of our products. Many of our competitors
are large apparel and footwear companies with strong
worldwide brand recognition. Due to the
fragmented nature of the industry, we also compete with other
manufacturers, including those
specializing in products similar to ours and private label
offerings of certain retailers, including some of
our retail customers. Many of our competitors have significant
competitive advantages, including
greater financial, distribution, marketing and other resources,
longer operating histories, better brand
recognition among consumers, more experience in global
markets and greater economies of scale. In
addition, our competitors have long term relationships with our
key retail customers that are potentially
more important to those customers because of the significantly
larger volume and product mix that our
competitors sell to them. As a result, these competitors may be
better equipped than we are to
influence consumer preferences or otherwise increase their
market share by:
• quickly adapting to changes in customer requirements or
consumer preferences;
• readily taking advantage of acquisition and other
Critical analysis of the business case for diversity

More Related Content

Similar to Critical analysis of the business case for diversity

Employee Motivation, Retention, and Turnover in Public Accounting by Alexandr...
Employee Motivation, Retention, and Turnover in Public Accounting by Alexandr...Employee Motivation, Retention, and Turnover in Public Accounting by Alexandr...
Employee Motivation, Retention, and Turnover in Public Accounting by Alexandr...Alexandra Yarosh, MBA
 
Human Resource ManagementHRM Definitions• ‘HRM invol.docx
Human Resource ManagementHRM Definitions• ‘HRM invol.docxHuman Resource ManagementHRM Definitions• ‘HRM invol.docx
Human Resource ManagementHRM Definitions• ‘HRM invol.docxwellesleyterresa
 
H-E-B Central Market Management Theory Analysis
H-E-B Central Market Management Theory AnalysisH-E-B Central Market Management Theory Analysis
H-E-B Central Market Management Theory AnalysisAshley Fisher
 
NOTE EMCEM - ORGANIZATIONAL BEHAVIOR.pptx
NOTE EMCEM - ORGANIZATIONAL BEHAVIOR.pptxNOTE EMCEM - ORGANIZATIONAL BEHAVIOR.pptx
NOTE EMCEM - ORGANIZATIONAL BEHAVIOR.pptxWanHaikal11
 
Packet Learning 1 HRMD vs Personnel Management
Packet Learning 1  HRMD vs Personnel ManagementPacket Learning 1  HRMD vs Personnel Management
Packet Learning 1 HRMD vs Personnel ManagementJo Balucanag - Bitonio
 
CUBCL HRM Dec 15.pptx
CUBCL   HRM Dec 15.pptxCUBCL   HRM Dec 15.pptx
CUBCL HRM Dec 15.pptxjo bitonio
 
1 scope and nature of hrm -sept 2013-ver 2(1)
1  scope and nature of hrm -sept 2013-ver 2(1)1  scope and nature of hrm -sept 2013-ver 2(1)
1 scope and nature of hrm -sept 2013-ver 2(1)Sanjeewa Abeysinghe
 
Global human resource management new
Global human resource management newGlobal human resource management new
Global human resource management newMariam Alia
 
BA 205 Robbinsjudge ob18 inppt_01
BA 205 Robbinsjudge ob18 inppt_01BA 205 Robbinsjudge ob18 inppt_01
BA 205 Robbinsjudge ob18 inppt_01BealCollegeOnline
 
Assignment 4 Analysis of the Agency’s Policies, Procedures, and P.docx
Assignment 4 Analysis of the Agency’s Policies, Procedures, and P.docxAssignment 4 Analysis of the Agency’s Policies, Procedures, and P.docx
Assignment 4 Analysis of the Agency’s Policies, Procedures, and P.docxbraycarissa250
 
CH-1&2-introduction-of-hrm...ppt
CH-1&2-introduction-of-hrm...pptCH-1&2-introduction-of-hrm...ppt
CH-1&2-introduction-of-hrm...pptselam49
 
Hr training in chandigarh - Cbitss TEchnologies
Hr training in chandigarh - Cbitss  TEchnologies Hr training in chandigarh - Cbitss  TEchnologies
Hr training in chandigarh - Cbitss TEchnologies Cbitss Technologies
 
Talent managementDefinition of strategic talent management .docx
Talent managementDefinition of strategic talent management .docxTalent managementDefinition of strategic talent management .docx
Talent managementDefinition of strategic talent management .docxperryk1
 
Talent management pp
Talent management ppTalent management pp
Talent management ppsedunham
 

Similar to Critical analysis of the business case for diversity (20)

Employee Motivation, Retention, and Turnover in Public Accounting by Alexandr...
Employee Motivation, Retention, and Turnover in Public Accounting by Alexandr...Employee Motivation, Retention, and Turnover in Public Accounting by Alexandr...
Employee Motivation, Retention, and Turnover in Public Accounting by Alexandr...
 
Human Resource ManagementHRM Definitions• ‘HRM invol.docx
Human Resource ManagementHRM Definitions• ‘HRM invol.docxHuman Resource ManagementHRM Definitions• ‘HRM invol.docx
Human Resource ManagementHRM Definitions• ‘HRM invol.docx
 
H-E-B Central Market Management Theory Analysis
H-E-B Central Market Management Theory AnalysisH-E-B Central Market Management Theory Analysis
H-E-B Central Market Management Theory Analysis
 
Ob
ObOb
Ob
 
NOTE EMCEM - ORGANIZATIONAL BEHAVIOR.pptx
NOTE EMCEM - ORGANIZATIONAL BEHAVIOR.pptxNOTE EMCEM - ORGANIZATIONAL BEHAVIOR.pptx
NOTE EMCEM - ORGANIZATIONAL BEHAVIOR.pptx
 
GFGC CHIKKABASUR ( Human Resource Manangement)
GFGC CHIKKABASUR ( Human Resource Manangement)GFGC CHIKKABASUR ( Human Resource Manangement)
GFGC CHIKKABASUR ( Human Resource Manangement)
 
2020 week 2 bb
2020 week 2 bb2020 week 2 bb
2020 week 2 bb
 
Packet Learning 1 HRMD vs Personnel Management
Packet Learning 1  HRMD vs Personnel ManagementPacket Learning 1  HRMD vs Personnel Management
Packet Learning 1 HRMD vs Personnel Management
 
HRM new.pptx
HRM new.pptxHRM new.pptx
HRM new.pptx
 
HR Encyclopedia
HR EncyclopediaHR Encyclopedia
HR Encyclopedia
 
CUBCL HRM Dec 15.pptx
CUBCL   HRM Dec 15.pptxCUBCL   HRM Dec 15.pptx
CUBCL HRM Dec 15.pptx
 
1 scope and nature of hrm -sept 2013-ver 2(1)
1  scope and nature of hrm -sept 2013-ver 2(1)1  scope and nature of hrm -sept 2013-ver 2(1)
1 scope and nature of hrm -sept 2013-ver 2(1)
 
Global human resource management new
Global human resource management newGlobal human resource management new
Global human resource management new
 
BA 205 Robbinsjudge ob18 inppt_01
BA 205 Robbinsjudge ob18 inppt_01BA 205 Robbinsjudge ob18 inppt_01
BA 205 Robbinsjudge ob18 inppt_01
 
Assignment 4 Analysis of the Agency’s Policies, Procedures, and P.docx
Assignment 4 Analysis of the Agency’s Policies, Procedures, and P.docxAssignment 4 Analysis of the Agency’s Policies, Procedures, and P.docx
Assignment 4 Analysis of the Agency’s Policies, Procedures, and P.docx
 
CH-1&2-introduction-of-hrm...ppt
CH-1&2-introduction-of-hrm...pptCH-1&2-introduction-of-hrm...ppt
CH-1&2-introduction-of-hrm...ppt
 
Hr training in chandigarh - Cbitss TEchnologies
Hr training in chandigarh - Cbitss  TEchnologies Hr training in chandigarh - Cbitss  TEchnologies
Hr training in chandigarh - Cbitss TEchnologies
 
Talent managementDefinition of strategic talent management .docx
Talent managementDefinition of strategic talent management .docxTalent managementDefinition of strategic talent management .docx
Talent managementDefinition of strategic talent management .docx
 
Talent management pp
Talent management ppTalent management pp
Talent management pp
 
hrm
hrmhrm
hrm
 

More from troutmanboris

Christian Schussele Men of ProgressOil on canvas, 1862Coope.docx
Christian Schussele  Men of ProgressOil on canvas, 1862Coope.docxChristian Schussele  Men of ProgressOil on canvas, 1862Coope.docx
Christian Schussele Men of ProgressOil on canvas, 1862Coope.docxtroutmanboris
 
Christian EthicsChristian ethics deeply align with absolutism. E.docx
Christian EthicsChristian ethics deeply align with absolutism. E.docxChristian EthicsChristian ethics deeply align with absolutism. E.docx
Christian EthicsChristian ethics deeply align with absolutism. E.docxtroutmanboris
 
Christian Ethics BA 616 Business Ethics Definiti.docx
Christian Ethics BA 616 Business Ethics Definiti.docxChristian Ethics BA 616 Business Ethics Definiti.docx
Christian Ethics BA 616 Business Ethics Definiti.docxtroutmanboris
 
CHPSI think you made a really good point that Howard lacks poli.docx
CHPSI think you made a really good point that Howard lacks poli.docxCHPSI think you made a really good point that Howard lacks poli.docx
CHPSI think you made a really good point that Howard lacks poli.docxtroutmanboris
 
Chrétien de Troyes, Lancelot, 1Chrétien de Troyes, Lancelo.docx
Chrétien de Troyes, Lancelot, 1Chrétien de Troyes, Lancelo.docxChrétien de Troyes, Lancelot, 1Chrétien de Troyes, Lancelo.docx
Chrétien de Troyes, Lancelot, 1Chrétien de Troyes, Lancelo.docxtroutmanboris
 
Chosen brand CHANELStudents are required to research a fash.docx
Chosen brand CHANELStudents are required to research a fash.docxChosen brand CHANELStudents are required to research a fash.docx
Chosen brand CHANELStudents are required to research a fash.docxtroutmanboris
 
Chose one person to reply to ALBORES 1. Were Manning’s acti.docx
Chose one person to reply to ALBORES 1. Were Manning’s acti.docxChose one person to reply to ALBORES 1. Were Manning’s acti.docx
Chose one person to reply to ALBORES 1. Were Manning’s acti.docxtroutmanboris
 
Choosing your literary essay topic on Disgrace by J. M. Coetzee .docx
Choosing your literary essay topic on Disgrace by J. M. Coetzee .docxChoosing your literary essay topic on Disgrace by J. M. Coetzee .docx
Choosing your literary essay topic on Disgrace by J. M. Coetzee .docxtroutmanboris
 
Choosing your Philosophical Question The Final Project is an opp.docx
Choosing your Philosophical Question The Final Project is an opp.docxChoosing your Philosophical Question The Final Project is an opp.docx
Choosing your Philosophical Question The Final Project is an opp.docxtroutmanboris
 
Choosing Your Research Method in a NutshellBy James Rice and.docx
Choosing Your Research Method in a NutshellBy James Rice and.docxChoosing Your Research Method in a NutshellBy James Rice and.docx
Choosing Your Research Method in a NutshellBy James Rice and.docxtroutmanboris
 
Choose two of the systems (education, work, the military, and im.docx
Choose two of the systems (education, work, the military, and im.docxChoose two of the systems (education, work, the military, and im.docx
Choose two of the systems (education, work, the military, and im.docxtroutmanboris
 
Choose two disorders from the categories presented this week.C.docx
Choose two disorders from the categories presented this week.C.docxChoose two disorders from the categories presented this week.C.docx
Choose two disorders from the categories presented this week.C.docxtroutmanboris
 
Choose ONE of the following topics Length 750-900 words, .docx
Choose ONE of the following topics Length 750-900 words, .docxChoose ONE of the following topics Length 750-900 words, .docx
Choose ONE of the following topics Length 750-900 words, .docxtroutmanboris
 
Choose one of the following topicsAmerica A Narrative.docx
Choose one of the following topicsAmerica A Narrative.docxChoose one of the following topicsAmerica A Narrative.docx
Choose one of the following topicsAmerica A Narrative.docxtroutmanboris
 
Choose one of the following topics below. Comparecont.docx
Choose one of the following topics below. Comparecont.docxChoose one of the following topics below. Comparecont.docx
Choose one of the following topics below. Comparecont.docxtroutmanboris
 
Choose one of the following topics below. Comparecon.docx
Choose one of the following topics below. Comparecon.docxChoose one of the following topics below. Comparecon.docx
Choose one of the following topics below. Comparecon.docxtroutmanboris
 
Choose one of the states of RacialCultural Identity Development.docx
Choose one of the states of RacialCultural Identity Development.docxChoose one of the states of RacialCultural Identity Development.docx
Choose one of the states of RacialCultural Identity Development.docxtroutmanboris
 
Choose one of the following topicsNative AmericansWomenEnvi.docx
Choose one of the following topicsNative AmericansWomenEnvi.docxChoose one of the following topicsNative AmericansWomenEnvi.docx
Choose one of the following topicsNative AmericansWomenEnvi.docxtroutmanboris
 
Choose one of the following films for review (with faculty’s appro.docx
Choose one of the following films for review (with faculty’s appro.docxChoose one of the following films for review (with faculty’s appro.docx
Choose one of the following films for review (with faculty’s appro.docxtroutmanboris
 
Choose and complete one of the two assignment options.docx
Choose and complete one of the two assignment options.docxChoose and complete one of the two assignment options.docx
Choose and complete one of the two assignment options.docxtroutmanboris
 

More from troutmanboris (20)

Christian Schussele Men of ProgressOil on canvas, 1862Coope.docx
Christian Schussele  Men of ProgressOil on canvas, 1862Coope.docxChristian Schussele  Men of ProgressOil on canvas, 1862Coope.docx
Christian Schussele Men of ProgressOil on canvas, 1862Coope.docx
 
Christian EthicsChristian ethics deeply align with absolutism. E.docx
Christian EthicsChristian ethics deeply align with absolutism. E.docxChristian EthicsChristian ethics deeply align with absolutism. E.docx
Christian EthicsChristian ethics deeply align with absolutism. E.docx
 
Christian Ethics BA 616 Business Ethics Definiti.docx
Christian Ethics BA 616 Business Ethics Definiti.docxChristian Ethics BA 616 Business Ethics Definiti.docx
Christian Ethics BA 616 Business Ethics Definiti.docx
 
CHPSI think you made a really good point that Howard lacks poli.docx
CHPSI think you made a really good point that Howard lacks poli.docxCHPSI think you made a really good point that Howard lacks poli.docx
CHPSI think you made a really good point that Howard lacks poli.docx
 
Chrétien de Troyes, Lancelot, 1Chrétien de Troyes, Lancelo.docx
Chrétien de Troyes, Lancelot, 1Chrétien de Troyes, Lancelo.docxChrétien de Troyes, Lancelot, 1Chrétien de Troyes, Lancelo.docx
Chrétien de Troyes, Lancelot, 1Chrétien de Troyes, Lancelo.docx
 
Chosen brand CHANELStudents are required to research a fash.docx
Chosen brand CHANELStudents are required to research a fash.docxChosen brand CHANELStudents are required to research a fash.docx
Chosen brand CHANELStudents are required to research a fash.docx
 
Chose one person to reply to ALBORES 1. Were Manning’s acti.docx
Chose one person to reply to ALBORES 1. Were Manning’s acti.docxChose one person to reply to ALBORES 1. Were Manning’s acti.docx
Chose one person to reply to ALBORES 1. Were Manning’s acti.docx
 
Choosing your literary essay topic on Disgrace by J. M. Coetzee .docx
Choosing your literary essay topic on Disgrace by J. M. Coetzee .docxChoosing your literary essay topic on Disgrace by J. M. Coetzee .docx
Choosing your literary essay topic on Disgrace by J. M. Coetzee .docx
 
Choosing your Philosophical Question The Final Project is an opp.docx
Choosing your Philosophical Question The Final Project is an opp.docxChoosing your Philosophical Question The Final Project is an opp.docx
Choosing your Philosophical Question The Final Project is an opp.docx
 
Choosing Your Research Method in a NutshellBy James Rice and.docx
Choosing Your Research Method in a NutshellBy James Rice and.docxChoosing Your Research Method in a NutshellBy James Rice and.docx
Choosing Your Research Method in a NutshellBy James Rice and.docx
 
Choose two of the systems (education, work, the military, and im.docx
Choose two of the systems (education, work, the military, and im.docxChoose two of the systems (education, work, the military, and im.docx
Choose two of the systems (education, work, the military, and im.docx
 
Choose two disorders from the categories presented this week.C.docx
Choose two disorders from the categories presented this week.C.docxChoose two disorders from the categories presented this week.C.docx
Choose two disorders from the categories presented this week.C.docx
 
Choose ONE of the following topics Length 750-900 words, .docx
Choose ONE of the following topics Length 750-900 words, .docxChoose ONE of the following topics Length 750-900 words, .docx
Choose ONE of the following topics Length 750-900 words, .docx
 
Choose one of the following topicsAmerica A Narrative.docx
Choose one of the following topicsAmerica A Narrative.docxChoose one of the following topicsAmerica A Narrative.docx
Choose one of the following topicsAmerica A Narrative.docx
 
Choose one of the following topics below. Comparecont.docx
Choose one of the following topics below. Comparecont.docxChoose one of the following topics below. Comparecont.docx
Choose one of the following topics below. Comparecont.docx
 
Choose one of the following topics below. Comparecon.docx
Choose one of the following topics below. Comparecon.docxChoose one of the following topics below. Comparecon.docx
Choose one of the following topics below. Comparecon.docx
 
Choose one of the states of RacialCultural Identity Development.docx
Choose one of the states of RacialCultural Identity Development.docxChoose one of the states of RacialCultural Identity Development.docx
Choose one of the states of RacialCultural Identity Development.docx
 
Choose one of the following topicsNative AmericansWomenEnvi.docx
Choose one of the following topicsNative AmericansWomenEnvi.docxChoose one of the following topicsNative AmericansWomenEnvi.docx
Choose one of the following topicsNative AmericansWomenEnvi.docx
 
Choose one of the following films for review (with faculty’s appro.docx
Choose one of the following films for review (with faculty’s appro.docxChoose one of the following films for review (with faculty’s appro.docx
Choose one of the following films for review (with faculty’s appro.docx
 
Choose and complete one of the two assignment options.docx
Choose and complete one of the two assignment options.docxChoose and complete one of the two assignment options.docx
Choose and complete one of the two assignment options.docx
 

Recently uploaded

Accessible design: Minimum effort, maximum impact
Accessible design: Minimum effort, maximum impactAccessible design: Minimum effort, maximum impact
Accessible design: Minimum effort, maximum impactdawncurless
 
Sanyam Choudhary Chemistry practical.pdf
Sanyam Choudhary Chemistry practical.pdfSanyam Choudhary Chemistry practical.pdf
Sanyam Choudhary Chemistry practical.pdfsanyamsingh5019
 
POINT- BIOCHEMISTRY SEM 2 ENZYMES UNIT 5.pptx
POINT- BIOCHEMISTRY SEM 2 ENZYMES UNIT 5.pptxPOINT- BIOCHEMISTRY SEM 2 ENZYMES UNIT 5.pptx
POINT- BIOCHEMISTRY SEM 2 ENZYMES UNIT 5.pptxSayali Powar
 
Z Score,T Score, Percential Rank and Box Plot Graph
Z Score,T Score, Percential Rank and Box Plot GraphZ Score,T Score, Percential Rank and Box Plot Graph
Z Score,T Score, Percential Rank and Box Plot GraphThiyagu K
 
Software Engineering Methodologies (overview)
Software Engineering Methodologies (overview)Software Engineering Methodologies (overview)
Software Engineering Methodologies (overview)eniolaolutunde
 
mini mental status format.docx
mini    mental       status     format.docxmini    mental       status     format.docx
mini mental status format.docxPoojaSen20
 
1029 - Danh muc Sach Giao Khoa 10 . pdf
1029 -  Danh muc Sach Giao Khoa 10 . pdf1029 -  Danh muc Sach Giao Khoa 10 . pdf
1029 - Danh muc Sach Giao Khoa 10 . pdfQucHHunhnh
 
A Critique of the Proposed National Education Policy Reform
A Critique of the Proposed National Education Policy ReformA Critique of the Proposed National Education Policy Reform
A Critique of the Proposed National Education Policy ReformChameera Dedduwage
 
microwave assisted reaction. General introduction
microwave assisted reaction. General introductionmicrowave assisted reaction. General introduction
microwave assisted reaction. General introductionMaksud Ahmed
 
Call Girls in Dwarka Mor Delhi Contact Us 9654467111
Call Girls in Dwarka Mor Delhi Contact Us 9654467111Call Girls in Dwarka Mor Delhi Contact Us 9654467111
Call Girls in Dwarka Mor Delhi Contact Us 9654467111Sapana Sha
 
Measures of Central Tendency: Mean, Median and Mode
Measures of Central Tendency: Mean, Median and ModeMeasures of Central Tendency: Mean, Median and Mode
Measures of Central Tendency: Mean, Median and ModeThiyagu K
 
Russian Call Girls in Andheri Airport Mumbai WhatsApp 9167673311 💞 Full Nigh...
Russian Call Girls in Andheri Airport Mumbai WhatsApp  9167673311 💞 Full Nigh...Russian Call Girls in Andheri Airport Mumbai WhatsApp  9167673311 💞 Full Nigh...
Russian Call Girls in Andheri Airport Mumbai WhatsApp 9167673311 💞 Full Nigh...Pooja Nehwal
 
1029-Danh muc Sach Giao Khoa khoi 6.pdf
1029-Danh muc Sach Giao Khoa khoi  6.pdf1029-Danh muc Sach Giao Khoa khoi  6.pdf
1029-Danh muc Sach Giao Khoa khoi 6.pdfQucHHunhnh
 
Grant Readiness 101 TechSoup and Remy Consulting
Grant Readiness 101 TechSoup and Remy ConsultingGrant Readiness 101 TechSoup and Remy Consulting
Grant Readiness 101 TechSoup and Remy ConsultingTechSoup
 
Mastering the Unannounced Regulatory Inspection
Mastering the Unannounced Regulatory InspectionMastering the Unannounced Regulatory Inspection
Mastering the Unannounced Regulatory InspectionSafetyChain Software
 
The byproduct of sericulture in different industries.pptx
The byproduct of sericulture in different industries.pptxThe byproduct of sericulture in different industries.pptx
The byproduct of sericulture in different industries.pptxShobhayan Kirtania
 
APM Welcome, APM North West Network Conference, Synergies Across Sectors
APM Welcome, APM North West Network Conference, Synergies Across SectorsAPM Welcome, APM North West Network Conference, Synergies Across Sectors
APM Welcome, APM North West Network Conference, Synergies Across SectorsAssociation for Project Management
 
Measures of Dispersion and Variability: Range, QD, AD and SD
Measures of Dispersion and Variability: Range, QD, AD and SDMeasures of Dispersion and Variability: Range, QD, AD and SD
Measures of Dispersion and Variability: Range, QD, AD and SDThiyagu K
 
Kisan Call Centre - To harness potential of ICT in Agriculture by answer farm...
Kisan Call Centre - To harness potential of ICT in Agriculture by answer farm...Kisan Call Centre - To harness potential of ICT in Agriculture by answer farm...
Kisan Call Centre - To harness potential of ICT in Agriculture by answer farm...Krashi Coaching
 
Advanced Views - Calendar View in Odoo 17
Advanced Views - Calendar View in Odoo 17Advanced Views - Calendar View in Odoo 17
Advanced Views - Calendar View in Odoo 17Celine George
 

Recently uploaded (20)

Accessible design: Minimum effort, maximum impact
Accessible design: Minimum effort, maximum impactAccessible design: Minimum effort, maximum impact
Accessible design: Minimum effort, maximum impact
 
Sanyam Choudhary Chemistry practical.pdf
Sanyam Choudhary Chemistry practical.pdfSanyam Choudhary Chemistry practical.pdf
Sanyam Choudhary Chemistry practical.pdf
 
POINT- BIOCHEMISTRY SEM 2 ENZYMES UNIT 5.pptx
POINT- BIOCHEMISTRY SEM 2 ENZYMES UNIT 5.pptxPOINT- BIOCHEMISTRY SEM 2 ENZYMES UNIT 5.pptx
POINT- BIOCHEMISTRY SEM 2 ENZYMES UNIT 5.pptx
 
Z Score,T Score, Percential Rank and Box Plot Graph
Z Score,T Score, Percential Rank and Box Plot GraphZ Score,T Score, Percential Rank and Box Plot Graph
Z Score,T Score, Percential Rank and Box Plot Graph
 
Software Engineering Methodologies (overview)
Software Engineering Methodologies (overview)Software Engineering Methodologies (overview)
Software Engineering Methodologies (overview)
 
mini mental status format.docx
mini    mental       status     format.docxmini    mental       status     format.docx
mini mental status format.docx
 
1029 - Danh muc Sach Giao Khoa 10 . pdf
1029 -  Danh muc Sach Giao Khoa 10 . pdf1029 -  Danh muc Sach Giao Khoa 10 . pdf
1029 - Danh muc Sach Giao Khoa 10 . pdf
 
A Critique of the Proposed National Education Policy Reform
A Critique of the Proposed National Education Policy ReformA Critique of the Proposed National Education Policy Reform
A Critique of the Proposed National Education Policy Reform
 
microwave assisted reaction. General introduction
microwave assisted reaction. General introductionmicrowave assisted reaction. General introduction
microwave assisted reaction. General introduction
 
Call Girls in Dwarka Mor Delhi Contact Us 9654467111
Call Girls in Dwarka Mor Delhi Contact Us 9654467111Call Girls in Dwarka Mor Delhi Contact Us 9654467111
Call Girls in Dwarka Mor Delhi Contact Us 9654467111
 
Measures of Central Tendency: Mean, Median and Mode
Measures of Central Tendency: Mean, Median and ModeMeasures of Central Tendency: Mean, Median and Mode
Measures of Central Tendency: Mean, Median and Mode
 
Russian Call Girls in Andheri Airport Mumbai WhatsApp 9167673311 💞 Full Nigh...
Russian Call Girls in Andheri Airport Mumbai WhatsApp  9167673311 💞 Full Nigh...Russian Call Girls in Andheri Airport Mumbai WhatsApp  9167673311 💞 Full Nigh...
Russian Call Girls in Andheri Airport Mumbai WhatsApp 9167673311 💞 Full Nigh...
 
1029-Danh muc Sach Giao Khoa khoi 6.pdf
1029-Danh muc Sach Giao Khoa khoi  6.pdf1029-Danh muc Sach Giao Khoa khoi  6.pdf
1029-Danh muc Sach Giao Khoa khoi 6.pdf
 
Grant Readiness 101 TechSoup and Remy Consulting
Grant Readiness 101 TechSoup and Remy ConsultingGrant Readiness 101 TechSoup and Remy Consulting
Grant Readiness 101 TechSoup and Remy Consulting
 
Mastering the Unannounced Regulatory Inspection
Mastering the Unannounced Regulatory InspectionMastering the Unannounced Regulatory Inspection
Mastering the Unannounced Regulatory Inspection
 
The byproduct of sericulture in different industries.pptx
The byproduct of sericulture in different industries.pptxThe byproduct of sericulture in different industries.pptx
The byproduct of sericulture in different industries.pptx
 
APM Welcome, APM North West Network Conference, Synergies Across Sectors
APM Welcome, APM North West Network Conference, Synergies Across SectorsAPM Welcome, APM North West Network Conference, Synergies Across Sectors
APM Welcome, APM North West Network Conference, Synergies Across Sectors
 
Measures of Dispersion and Variability: Range, QD, AD and SD
Measures of Dispersion and Variability: Range, QD, AD and SDMeasures of Dispersion and Variability: Range, QD, AD and SD
Measures of Dispersion and Variability: Range, QD, AD and SD
 
Kisan Call Centre - To harness potential of ICT in Agriculture by answer farm...
Kisan Call Centre - To harness potential of ICT in Agriculture by answer farm...Kisan Call Centre - To harness potential of ICT in Agriculture by answer farm...
Kisan Call Centre - To harness potential of ICT in Agriculture by answer farm...
 
Advanced Views - Calendar View in Odoo 17
Advanced Views - Calendar View in Odoo 17Advanced Views - Calendar View in Odoo 17
Advanced Views - Calendar View in Odoo 17
 

Critical analysis of the business case for diversity

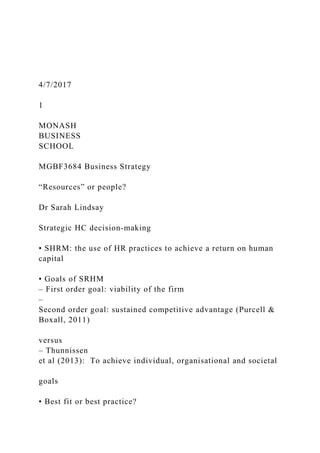
  • 1. 4/7/2017 1 MONASH BUSINESS SCHOOL MGBF3684 Business Strategy “Resources” or people? Dr Sarah Lindsay Strategic HC decision‐making • SHRM: the use of HR practices to achieve a return on human capital • Goals of SRHM – First order goal: viability of the firm – Second order goal: sustained competitive advantage (Purcell & Boxall, 2011) versus – Thunnissen et al (2013): To achieve individual, organisational and societal goals • Best fit or best practice?
  • 2. • Different approaches for different groups ‐ based on their strategic value: – “high commitment” or “high road” – low commitment with flexibility and possible outsourced Strategic tensions • The language of strategy • Labour productivity • Organisational flexibility • Social legitimacy (chap. 1 Boxall and Purcell) 4/7/2017 2 • The language of strategy – What does it mean to say humans are “valued” “resources” or “investments” – How or what is valued – risks the commodification of humans – What is normal in the workplace • Labour productivity – How much to invest and in whom? – Employee motivation
  • 3. • Organisational flexibility responsiveness v long‐run agility • Social legitimacy • Firms make use of human capabilities from the community and the state • Governments exercise their right to regulate employment • Individuals (workers, customers, citizens) exercise sanctions against firms 6 “SHRM may benefit from a more balanced emphasis on meeting the demands of other [non-owner] stakeholder groups with diverse needs, interests and agendas” (Lepak and Colakoglu 2006 p.29) 4/7/2017 3 MONASH BUSINESS SCHOOL Security and Behavior – in & out of work
  • 4. OH&S • Mental health • Bullying • Violence • Privacy 8 The discipline of employees… “security must be designed with the users in mind: individuals with unique motivations, emotions and cognitions” – Identity theft – physical objects & computer networks DUPress, Centre for integrated research Series on behavioural economics and management 9 Connectivity and behaviour – in and out of work The managerial and unitarist orientation on the achievement of organisational goals needs to be expanded” (p.1757)
  • 5. Taking a pluralist view of talent – implications for Human Capital Multiple stakeholders – multiple goals or outcomes Thunnissen et al 2013 4/7/2017 4 Revisit • Stakeholder: Individual or group with a legitimate stake/investment/claim on the firm • Owed benefit of protection from harm • Extent of duty owed is proportional to the investment • Principles of stakeholder theory – Stakeholders can not be used as a means to an end (deontologica l) – Firms must be managed for the benefit of all stakeholders (utilit arianism, distributive justice) – Stakeholders have the right to pursue their own interests in the f irm (rights
  • 6. theory, procedural justice) • Often used descriptively or instrumentally (aka stakeholder management) • Stakeholder theory: best understood as a normative theory of bu siness ethics(an ethically pluralist theory) Importance of OHS safety (OH&S) “The physical, physiological and psychosocial conditions of an organisation’s workforce, related to aspects of work and the work context” Organisational benefits • Improve quality of work life • Lower absenteeism and turnover
  • 7. • Increase productivity • Reduce medical and compensation costs • Improve organisational image Responsibility for OHS [compliance vs integrity] – Adherence to minimum standards and improving workplace safety could provide large $ benefits to the economy and improve employee wellness – But barriers to OH&S reform • Lack of commitment/reactive responses • Not integrated with business objectives • Seen as a cost • Conflict with workers compensation system, privacy, EEO • Inadequate govt funding and enforcement • Low penalties 4/7/2017 5 Current OH&S hot topics: • Mental Health • Bullying
  • 8. – Covert or overt workplace behaviour that results in harassment, includes yelling, screaming, abusive language, insults, physical injury, in appropriate comments about a person’s appearance of lifestyle, constant beli ttling comments (see Brodie’s Law) • Occupational violence (physical or online) – Situations where a person suffers abuse or attack associated wit h the requirements of their position http://www.heraldsun.com.au/news/victoria/most‐nurses‐attacke d‐or‐faced‐aggressive‐patients‐ on‐the‐job/story‐fni0fit3‐1227061968627 • Employee privacy The ‘right’ to privacy? The example: An employee who accidentally sent her boss an SMS calling him a “complete dick” had her case for unfair dismissal thrown out by Australia’s Fair Work Commission (2015) THE DILEMMA:
  • 9. • THERE IS A LONG HISTORY OF EMPLOYERS PLACING LIMITATIONS ON EMPLOYEE OFF-THE-JOB ACTIVITIES. • THESE LIMITATIONS CAN (LEGITIMATELY) VIOLATE THE EMPLOYEES EXPECTATION OF PRIVACY WHILE NOT AT WORK Solution : properly crafted social media policy that has been effectively c ommunicated to employees Values: espoused versus enacted (Lucero et al 2013) http://www.smartcompany.com.au/people‐human‐resources/indu strial‐relations/46369‐employee‐who‐accidentally‐texted‐her‐bo ss‐ calling‐him‐a‐complete‐d‐ck‐loses‐unfair‐dismissal‐case/ Stress, well‐being & occupational (organisational) health in the 21st century
  • 10. • Stressors – Job insecurity – Job design – work overload – Work hours – Control at work – Managerial style – Organisational change – Improper selection – Unsatisfactory physical work environment (heat) – 24/7 connectivity • Stress reactions – Self‐report of distress and lower general health – Anxiety & depression – Fatigue, poor lifestyle – Absenteeism – Lower productivity – Bullying “There are now fewer people at
  • 11. work doing more and feeling less security and control in their jobs. Management in particular have increased pressures trying to keep pace and manage their workplace against a background of rapid change” (Sparks et al, 2001: 490). (Sparks, Faragher and Cooper, 2001) 4/7/2017 6 SHR responses to HC wellbeing & occupational health in the 21st century • Job redesign
  • 12. – Increase interest and levels of autonomy • Development of career plans – Antidote to insecurity • Performance management and counselling programs – Feedback to reduce uncertainty around job performance • Award reform – Address issues of insecurity and long hours • Employee feedback programs – Provide voice for frustrations and stresses in hope of creating change • Consultative committees – Provide role for employees in work issues (and also potentially, conflict) • Stress reduction and stress management programs – problematic internet use (PIU)/compulsive Internet use (CIU)/Internet overuse – Mindfulness (-> Mindfulness at Monash) MONASH
  • 13. BUSINESS SCHOOL MGBF3684 Business Strategy A critical diversity perspective on ‘the business case’ Dr Sarah Lindsay Acknowledgements: Professor Veronique Ambrosini, HoD Management Professor Gavin Jack, Deputy HoD Management WHY BOTHER? (???) We argue that CDP is a threshold concept, central to developing students’ ability to navigate the complexity of making decisions, a sine qua non element of strategy implementation (Porter & Kramer, 2006). From last week …
  • 14. Stress the need for students to develop the students ability to assess critically the assumptions underpinning managerial actions and the impact of those actions on others 4/7/2017 7 • A critical perspective is defined as an approach “that aims at revealing organizational norms, in particular organized dichotomies, in order to make organisations more inclusive for groups” (Bleijenbergh & Fielden, 2015, p. 2/18). • Enable people to navigate their own position but also to recognise and consider others • Develops nuance and sophistication • Critical diversity studies (CDS) is a composite of theoretical and empirical work that critiques the assumptions, intentions and effects of the managing diversity approach. For
  • 15. example: • Zanoni et al. (2010): Sceptical. Argue that CDS is a response to how the BCD enabled corporations to reappropriate and weaken the equal opportunities and social justice basis of workplace diversity • Prasad (2006): argues that DM initiatives are, wittingly or otherwise, ‘designed to fail’ since the maintenance of dominant group privilege is the hidden/unconscious agenda, perhaps even the ‘shadow’ (Prasad & Mills, 1997), of/ behind the diversity showcase. • Prasad consequently encourages critical diversity scholars to ask how failure is designed into diversity initiatives, and to assess the value of DM in terms of the extent to which it destabilises the ingroup- outgroup binary oppositions that often frame social group/identity-based diversity discourses. Critical management studies and critical diversity perspectives Porter (1991): • ‘Heroic’/straight line approach to SM • Economic focus
  • 16. In practice … D&I showcased as a competitive advantage (Thomas, 2004 - Diversity as strategy HBR) (Porter & Kramer, 2011): • business should address social issues that intersect with business interests • to maximise return to both groups - shared value • Possibilities include: • products and markets • productivity in the value chain • local cluster development Diversity and inclusion as a component of strategic (HR) manag ement – A timeline case study of Porter ( … ) The Hudson Institute’s famous Workforce 2000 Report (Johnston & Packer, 1987) predicted that ‘by 2000 only 15% of new entrants to the US workforce would be US-born white males’ (Oswick & Noon, 2014, p. 24).
  • 17. Incorrect (Edelman, Fuller, & Maradrita, 2001) but it brought diversity into a strategic, economic frame, by positioning diversity as valuable to organisations: – Externally, through access to new markets; – Internally, through: • performance innovation; and • as a new, better approach to equal opportunity and affirmative action ( … )The business case for diversity Diversity activities regularly showcased in organisational reports and websites, yet little change in real terms Equality is a deeply unfashionable term in practitioner literature & strategic
  • 18. management is silent in this regard 4/7/2017 8 Top 20 US fortune 500 - employee representative groups (ERGs) Power implication: in self-identifying as a minority, individuals reduce themselves to one salient category, & reinforce the distinctions and power imbalance. In some ways, even making decisions about which identity is most salient is problematic. Do you join all, or some? Does identifying self into a (sub)group requires you to locate yourself as a minority - and be treated as such, reinforcing the status quo? “Diversity networks are formally established to counter the
  • 19. power of the informal old boys’ networks in organisations. Diversity networks as diversity tools are relatively easy for organisations yet they render people from minority groups responsible for solving their own isolation and career difficulties; the focus on community building may met the need for social support but fail to address deeply embedded inequalities in the workplace” (Benschop et al., 2015, p 17/29) Consider this: Problems with the business case for diversity: • Short‐term • Blinkered view • Dangerous arguments • Flawed assumptions
  • 20. (Noon, 2007) (libguides.bc.edu) (linkedin.com) The distinction between the two concepts needs to be clear, because utilisation in this form sets inclusion up to fail. • Diversity: conceptualisations of single, social identity categorisations for example, race, gender, age etc. • Inclusion: is a concept without consensus on the nature of the construct or its theoretical underpinnings. Shore et al. (2011, p. 1265) define inclusion as “the degree to which an employee perceives that he or she is an esteemed member of the workgroup through experiencing treatment that satisfies his or her needs for belongingness and uniqueness”. Practitioners widely and academics occasionally conflate the terms diversity and inclusion: Example: 2015 publicly available documents from the top 20
  • 21. US companies in the Fortune 500: Inclusion does not merit a separate category in the reports, instead is married to diversity. The term is not defined. The only practitioner exception to this pattern is AT&T which distinguishes between diversity as demographics and inclusion as culture. Diversity AND Inclusion? 4/7/2017 9 There may be an ongoing shift in workplace diversity fashion from the ‘diversity’ approach to an ‘inclusion’ approach, speculating that: “More recently, the debate has taken a new direction, as academic commentators and consultants are making a clear distinction between diversity and inclusion” (p. 26).
  • 22. The research direction recently emerged to investigate this is the climate for inclusion (Dwertmann & Boehm, 2016; Nishii, 2013), with important implications Oswick & Noon (2014) Diversity: recognizing the value of differences within the workforce and managing them for commercial advantage Inclusion: the “effective management” of differences, concerned with the processes that incorporate differences into business practices. Climate of inclusion Nishii, (2013): Fairly implemented employment practices that:
  • 23. • do not bias against women • lack stigmas associated with expressing feminine identity • have a propensity to value the perspectives of men and women equally signal to employees that being a woman is not associated with having a disproportionately small share of social value. In contrast, when gender-based status differences are salient, people will be motivated to derogate others on the basis of gender in order to enhance their own status. Dwertmann & Boehm (2016): A climate of inclusion is invoked when: • Existing norms promote the commitment of resources to all group members regardless of disability status • Support for group member uniqueness and belongingness The role of position status is important. Climate for inclusion = a culture for subordinates not to
  • 24. discriminate against their supervisor with disabilities, but not the other way. Status, influence, and power may protect supervisors against sanctions from violating the social norm, because subordinates may be hesitant to voice their opinions ( … ) • There are differences between diversity and inclusion and there is a need to consider and respond to each as distinct but related areas of strategic management • Countervailing tensions along the dimensions of age, gender and inter- and intra- organisational variation limit not only strategic alignment but also the materialization of the gains vaunted by the RBV and the business case arguments • A pragmatic approach to workforce diversity was adopted in order to keep abreast of D&I policy developments and to be viewed as socially responsible organizations • Long-standing views with regards to ethnic social classes
  • 25. known as caste persist. Legitimacy of these attitudes needs to be tackled both within and outside these firms. • Ought to be championed by organizational leaders as well as members of staff • RBV and business case need to adopt a broader internal- external lens if the goals of attaining a diverse and inclusive firm is to be achieved (p. 212). The last word? Donnelly (2015): Running head: SHORT TITLE OF PAPER (<= 50 CHARACTERS) Title Author Author Affiliation Title of Paper Begin your paper with the introduction. The active voice, rather than passive voice, should be used in your writing.
  • 26. This template is formatted according to APA Style guidelines, with one inch top, bottom, left, and right margins; Times New Roman font in 12 point; double-spaced; aligned flush left; and paragraphs indented 5-7 spaces. The page number appears one inch from the right edge on the first line of each page, excluding the Figures page. In this introduction, you will describe the purpose of your paper (the first rubric element) – in other words, what your paper sets out to do. This video provides some guidance on how to structure an introductory paragraph. In this case, you are providing a microeconomic analysis of a particular company and you will analyze different microeconomic criteria related to your company and the market in which it operates. This analysis will then inform your recommendations for how the company can be successful in the future. Be sure to provide some specifics about what you will be analyzing so the reader knows what to expect – use the outline provided in the Final Project Document as your guide. Lastly, make sure that the company you choose is well suited for this kind of analysis. Please see the suggested list provided in your course for ideas and email your instructor your choice. Any company not on the list will need prior approval.History of the Company Use headings and subheadings to organize the sections of your paper. The first heading level is formatted with initial caps and
  • 27. is centered on the page. Do not start a new page for each heading. This first heading aligns with the second rubric element which gives an overview of the company’s history. Be sure to personalize this heading to reflect your company. In this section, include you will summarize the history of the firm and also provide an overview of what the firm does and what goods/services it sells. Be sure to include sufficient detail here. Your company’s website is the best place to find this information. This section should be about one page long. Supply and Demand Conditions There are two rubric elements to be included in this section and combined they should be about 2 pages in length, perhaps longer if you present more than one graph/table. The first element asks you to evaluate the trends in demand over time and explain their impact on the industry and on the firm. To do this, you can consider market demand. Market demand is the demand by all the consumers of a given good or service. Find out who your customers are and provide detail on them. Use annual sales data to find out how much of the product is purchased. Here is a video explaining each of the following determinants of market demand that you could examine for your company’s market: · Income
  • 28. · Price of related goods · Tastes · Population and Demographics · Expected Future Prices The second rubric element to be included in this section is your analysis of information and data related to the demand and supply for your firm’s product(s) to support your recommendation for the firm’s actions. You have already presented the overall trends in demand in the last element. In this rubric element, you will first collect data specific to your company on demand. To do this, look at the following: · Sales and Revenue. Building on the idea of market demand, consider how the annual sales data changed over time for your company in particular. · Include a graph/table/chart of sales for your company. This may be in dollars, product quantity or number of customers – whichever is most relevant for your firm. You could use more than one, if you think that would give a more detailed picture of demand for your company’s product or service. · Include 5 or more years of data will be enough to show a trend that is supported by your market demand discussion.
  • 29. · Data can be found from the company’s annual reports and revenue can more specifically be found in the company’s income statement. One you have analyzed the demand side, you can now look at the supply side of your company. For this, you will want to watch this video on the determinants of supply, just as we examined the determinants of demand in the last rubric element. Here, some of the pieces you could explore and provide data on are: · Input costs · Technological Improvement · Prices of substitutes · Number of firms in the market · Expected future prices Price Elasticity of Demand This section has three elements and should be 1-2 pages long. The first element asks that you analyze information and data to justify how the price elasticity of demand for your product is determined. Here, you will have to use pricing of your product, the trend in the price over time and comparison to similar products to justify whether you find the price elasticity of demand to be either elastic or inelastic. You may not be able to
  • 30. calculate a specific price elasticity of demand (video), depending on your company and the available information. However, looking at pricing data should help you justify whether demand is inelastic or elastic. You will then take your justification one step further in the second rubric element and explain the factors that affect consumer responsiveness to price changes. You can learn more about these factors from this video on the determinants of price elasticity of demand. Explore the following determinants as they relate your company’s product(s): · Availability of substitutes · Passage of time · Luxury or necessity · Definition of the market · Share of budget The third and last element in this section ask you to assess how the price elasticity of demand impacts the firm’s pricing decisions. As you read in Chapter 6 in our textbook, there is a relationship between elasticity of demand and revenue. You can watch this video to review the relationship between price elasticity of demand and total revenue and explain how this relationship influences the company’s pricing decisions. For instance, if a company sells a product that has very elastic demand, meaning customers are very responsive to a price change, then increasing their price means that their total
  • 31. revenue will decrease. This could explain why, in such a situation, the company may decide to not raise prices, even if their costs are going up. This is just one example so be sure to make your analysis relevant to your company’s specific situation. Costs of Production This section of your paper has two rubric elements and will be between 1-2 pages long, depending on your use of graphs or tables. The first element in this section asks you to analyze the various costs your company faces, their trends over time and how they have impacted the company’s profitability. To gather data on this, you will want to go to your company’s annual report and look at their income statement. Here is a helpful video to help you understand how to read an income statement. You will notice that there are two section that deal with costs – the first is Cost of Goods Sold which is essentially the cost of the inputs, such as raw material and direct labor. For clothing manufacturer, that would include the cost of the cloth; for an auto manufacturer, it would include the cost of the steel. Then, there is the section called expenses and these are the costs beyond buying the raw materials. These include things like rent, insurance and overhead and other indirect expenses. For this section, you should include: · Past 5 years (or more) of COGS, in a table or graph
  • 32. · Past 5 years (or more) of Operating Expenses, in a table or graph (can be combined with table/graph of COGS) · Explanation of any observed trends in either (ie: why is COGS increasing?) such as: · Pricing history of major inputs, such as cotton for a clothing company, as applicable · Change in how goods/services are produced – for instance, a change in major input such as moving from steel to aluminum · Your analysis of how changes in either or both of these affected profitability – remember that accounting profit, which is what we are looking at here, is simply Revenue – Costs The next rubric element in this section asks you to apply the concepts of variable and fixed costs to company for informing their output decisions. Chapter 11 examines the differences between variable and fixed costs, and you can review in this video the details about fixed and variable costs and how they apply to business output decisions. In this video, our textbook presents an example that shows how costs are distinguished between fixed and variable. This example will help shed light on how you can similar distinctions for your company. Also, you have already done some of this work in your previous
  • 33. rubric element. There you presented data on COGS and Operating Expenses. Generally, variable costs will show up in COGS and fixed costs will show up in Operating Expenses, so this gives you a head start. You can then use the data and your knowledge of fixed, variable and total costs from Chapter 11 to explain how your company will base their production level on the costs they face. Overall Market In this section, you will be examining three different aspects of the overall market in which your company operates. By overall market, we mean the market selling the product or service. For instance, there is a market for mobile phones or a market for jeans. Whatever product your company sells determines what market it is in. Note that the term market here does not refer to the stock market. In total, this section should be 1-2 pages long. The first rubric element of this section asks you to discuss themarket share for your company and its top competitors by providing details on current percentages for each company and describing the trend over time. The best way to show this would be to use some type of graph or table to show for the past few years (5 would show any trends, if you can find the data going that far back). To do this, you will need to find data on the market as a whole – for instance, if the market is computers, you will need to find the total value of computer sales in the
  • 34. US. From there, you can determine that share (the percentage) your company and the other top companies get from that total. For an example of how to do this, check out this video on calculating market shares. You may also find that industry magazines or other market researchers have compiled this information, so do look for those resources as well, to make your data collection easier. Once you have the data, you will want to see how your company has been doing. Having 80% of the market might sound great but if you see that the company had 90% of the market two years ago, then we have a different story. This is why showing the trend is so important. The second rubric element in this section asks you to analyze the barriers to entry for your firm’s industry. This concept is explored in detail in Chapter 14 and you can review in this video the types of barriers to entry and their impact on the market. For the market your company operates in, you will detail the barriers to entry – some markets have more than other and some barriers are weaker than others. Your specific situation will allow you to explain how the existing barriers will either help insulate your company from competition or allow for competitors to break into the market. The last rubric element in this section asks you to describe the market structure for your firm and analyze how this affects their ability to influence the overall market. Recall from Chapter 12
  • 35. that there are 4 different market structures: Perfect Competition, Monopolistic Competition, Oligopoly and Monopoly. You need to categorize your company’s market into one of these four. Use the criteria listed in Table 12.1 on page 392 of the textbook and any supporting evidence you have presented so far. You can also use the four-firm concentration ratio and/or the Herfindahl-Hirschman Index (HHI) to support your conclusion. Here is a video showing you how to calculate both the four-firm concentration and the HHI*, and you can also review this on pages 453 and 497, respectively. Once you have determined the market structure, you can then analyze your company’s ability to influence the whole market based on this and their position within the market. *this example uses the top 50 firms – you will not necessarily have to use that many. Recommendation This last section of your paper contains three rubric elements, where you will provide your recommendations for future actions based on the three different criteria. This section will be about one page long. In the first element, you will develop a recommendation for how the firm can manage it future production by synthesizing the data presented. This essentially is asking you to look at the data and analysis done in the supply
  • 36. and costs sections and make a suggestion how the company should produce in the future. The determinants of supply and specific costs trends that the company faces will determine what you suggest for their production moving forward, in terms of quantity and types of products. The second element asks you to suggest how the firm’s position within the market and among its competitors will allow it to take the recommended action. This follows closely from your last element in the Overall Market section and you should use the evidence presented there to inform your recommendation here. Specifically, consider how the firm’s market power would allow them to make the suggested changes to production you mention above. You should also include here advice for how your firm can become stronger within their market. The last rubric element asks you to describe how the firm can sustain its success going forward by evaluating trends in demand and price elasticity. Here you will revisit your analysis in the demand and price elasticity section to further provide suggestions for how your company can stay profitable. From pricing decisions to responding to changes in demand, your suggestions here should reflect your findings in those earlier sections. Be sure to include specific ideas for how the firm can remain successful, like new products to offer based on changing
  • 37. tastes, or a different pricing strategy to remain competitive. Your ideas should of course align with the rest of your analysis and the microeconomic concepts.Citations This is not a particular section of your paper, but rather guidance on how to use APA format in-text citations throughout your paper. Source material must be documented in the body of the paper by citing the authors and dates of the sources. The full source citation will appear in the list of references that follows the body of the paper (see last page). When the names of the authors of a source are part of the formal structure of the sentence, the year of the publication appears in parenthesis following the identification of the authors, for example, Smith (2001). When the authors of a source are not part of the formal structure of the sentence, both the authors and years of publication appear in parentheses, separated by semicolons, for example (Smith and Jones, 2001; Anderson, Charles, & Johnson, 2003). When a source that has three, four, or five authors is cited, all authors are included the first time the source is cited. When that source is cited again, the first author’s surname and “et al.” are used. See the example in the following paragraph. Use of this standard APA style “will result in a favorable impression on your instructor” (Smith, 2001). This was affirmed again in 2003 by Professor Anderson (Anderson, Charles &
  • 38. Johnson, 2003). When a source that has two authors is cited, both authors are cited every time. If there are six or more authors to be cited, use the first author’s surname and “et al.” the first and each subsequent time it is cited. When a direct quotation is used, always include the author, year, and page number as part of the citation. A quotation of fewer than 40 words should be enclosed in double quotation marks and should be incorporated into the formal structure of the sentence. A longer quote of 40 or more words should appear (without quotes) in block format with each line indented five spaces from the left margin. References Entries are organized alphabetically by surnames of first authors and are formatted with a hanging indent. Most reference entries have three components: 1. Authors: Authors are listed in the same order as specified in the source, using surnames and initials. Commas separate all authors. When there are seven or more authors, list the first six and then use “et al.” for remaining authors. If no author is identified, the title of the document begins the reference. 2. Year of Publication: In parenthesis following authors, with a period following the closing parenthesis. If no publication date
  • 39. is identified, use “n.d.” in parenthesis following the authors. 3. Source Reference: Includes title, journal, volume, pages (for journal article) or title, city of publication, publisher (for book). Here is a link to a video to walk you through creating a reference list in APA format. 2017 ANNUAL REPORT 20 17 U N D ER A
  • 41. 2 0 1 7 I C O N I C A T H L E T E C O L L E C T I O N S LINLINDSEDSEY VY VONNONN TOM BRADY 2017 U N D ER ARM O U R AN N U AL REPO RT
  • 42. FROM THE CHAIRMAN AND CEO To Our Shareholders, 2017 was one of the most challenging and opportunistic years in Under Armour’s history. It was a year that provided invaluable learning and will success. Following a sustained period investments to gain global scale, a number of external and internal in our strategy to better align our resources and operations into an organization capable of supporting the powerful brand that is Under Armour.
  • 43. Externally, disruption in our North American business driven by retail consolidation, bankruptcies and shifts from physical to digital consumption placed a great deal of variability into the marketplace. These dynamics, along with changes in consumer preference contributed to a highly promotional backdrop, putting pressure on our largest regional business throughout the year. Internally, our quick pace at obtaining global scale in innovation, product, sport categories and a larger international footprint generated associated with our shift toward cost structure built to support the expectation of being a larger company by now.
  • 44. The intersection of the external and internal factors provided an exceptional opportunity to transform our operations and further sharpen our strategy. In and proactive decisions to advance our operating systems, reset our structure and recalibrate our leadership so that we utilize the scale and infrastructure we’ve built to better serve our consumers and retail customers. Fundamental to this design and storytelling, all while keeping our consumer athletes at the center of everything we do. years of investing to scale within one accelerating focus on discipline sets us up to more consistently deliver sustainable, To empower this, Under Armour must ensure that we are constantly delighting
  • 45. our consumer athletes. Since the beginning, our promise has been to make athletes better. As we push ourselves to become a smarter, faster and stronger athletic performance. And it’s precisely through this lens, that our new mission statement evolved – Under Armour Makes You Better. This means that in every way we connect – through the product we create, the experiences we deliver and the inspiration we provide – we will make you better. We’re proud of the incredibly strong brand leading innovation and a truly unique intimacy with Under Armour athletes. By building a stronger ecosystem with a 20 17
  • 47. FROM THE CHAIRMAN AND CEO empowering our team to create and operate drives an even deeper authenticity and connection with our consumers, inspiring them with incredible products they never knew they needed and wondered how they ever lived without. In 2017, our revenue was up 3% to reach $5.0 billion. Throughout the year, we leveraged our amazing roster of athletes international business. In fact, our international business grew 46% to consumer, women’s and footwear on the list of $1 billion businesses. Working as a counterbalance to a contraction in our North American business, the investments
  • 48. we have made across our regions – EMEA, dividends, with their size and scale on the precipice of being able to deliver more meaningful returns in the years ahead. In addition to diversifying our portfolio across regions and categories, we are optimizing and expanding our distribution right experience wherever and whenever consumers choose to engage Under Armour. Within our global wholesale business, which declined 3% in 2017, we are focused on improving our segmentation and service levels to ensure we have the right product in the right place at the right continued its strong momentum with a 14% increase in annual revenue, representing 35% of sales as our retail stores and storytelling to deliver truly unique and premium experiences.
  • 49. As we drive forward into 2018, Under Armour is a great brand and a good company. We must become a great company positioned to execute against our strategies and new mission to become better. We are the best at getting better. It’s in our DNA. By building on the strategic decisions and actions we took in 2017 and ones thus far in 2018, we are heads down and focused on doing just that. At Under Armour, we have the best team. I am so incredibly proud of the strength and resilience my teammates demonstrate each and every day, all around the world. With a high level of situational awareness, and the right strategy and leadership in place, we are
  • 50. fuel and innovate – emerging as a stronger and better Under Armour for our consumers, customers, and shareholders. Chairman and 2017 U N D ER ARM O U R AN N U AL REPO RT
  • 51. MMMISMISMISMISMISMISMMIMISSMIMM TY TYTY TY TYTYYYTYTY COLCOLCOLCOOLOLOOLOLCOCOLCOLCOLLOLC LLCOCO LECLECLECLECELELELLLECCTTTIOTTIOTIOTIOIOOTIOO ONNNNNNNNNNNNNNN #SHEPLAYSWEWIN CAMPAIGN CAL BERKELEY HARPER 2 20 17 U N D ER A RM
  • 52. O U R AN N U AL R EP O RT AMSTERDAM BRAND HOUSE BEIJING BRAND HOUSE AMSTERDAM BRAND HOUSE (TTM)
  • 53. UNITED STATES SECURITIES AND EXCHANGE COMMISSION Washington, D.C. 20549 Form 10-K (Mark One) Í ANNUAL REPORT PURSUANT TO SECTION 13 OR 15(d) OF THE SECURITIES EXCHANGE ACT OF 1934 For the fiscal year ended December 31, 2017 or ‘ TRANSITION REPORT PURSUANT TO SECTION 13 OR 15(d) OF THE SECURITIES EXCHANGE ACT OF 1934 For the transition period from to
  • 54. Commission File No. 001-33202 UNDER ARMOUR, INC. (Exact name of registrant as specified in its charter) Maryland 52-1990078 (State or other jurisdiction of (I.R.S. Employer incorporation or organization) Identification No.) 1020 Hull Street Baltimore, Maryland 21230 (410) 454-6428 (Address of principal executive offices) (Zip Code) (Registrant’s Telephone Number, Including Area Code) Securities registered pursuant to Section 12(b) of the Act: Class A Common Stock New York Stock Exchange Class C Common Stock New York Stock Exchange (Title of each class) (Name of each exchange on which registered) Securities registered pursuant to Section 12(g) of the Act: None
  • 55. Indicate by check mark if the registrant is a well-known seasoned issuer, as defined in Rule 405 of the Securities Act. Yes Í No ‘ Indicate by check mark if the registrant is not required to file reports pursuant to Section 13 or Section 15(d) of the Act. Yes ‘ No Í Indicate by check mark whether the registrant (1) has filed all reports required to be filed by Section 13 or 15(d) of the Securities Exchange Act of 1934 during the preceding 12 months (or for such shorter period that the registrant was required to file such reports), and (2) has been subject to such filing requirements for the past 90 days. Yes Í No ‘ Indicate by check mark whether the registrant has submitted electronically and posted on its corporate Web site, if any, every Interactive Data File required to be submitted and posted pursuant to Rule 405 of Regulation S-T (§229.405 of this chapter) during the preceding 12 months (or for such shorter period that the registrant was required to submit and post such files. Yes Í No ‘ Indicate by check mark if the disclosure of delinquent filers pursuant to Item 405 or Regulation S-K (§229.405 of this
  • 56. chapter) is not contained herein, and will not be contained, to the best of registrant’s knowledge, in definitive proxy or information statements incorporated by reference in Part III of this Form 10-K or any amendment to this Form 10-K. ‘ Indicate by check mark whether the registrant is a large accelerated filer, an accelerated filer, a non-accelerated filer, or a smaller reporting company. See definitions of “large accelerated filer,” “accelerated filer,” and “smaller reporting company” in Rule 12b-2 of the Exchange Act. Large accelerated filer Í Accelerated filer ‘ Non-accelerated filer ‘ (Do not check if a smaller reporting company) Smaller reporting company ‘ Emerging growth company ‘ If an emerging growth company, indicate by check mark if the registrant has elected not to use the extended transition period for complying with any new or revised financial accounting standards provided pursuant to Section 13(a) of the Exchange Act. ‘ Indicate by check mark whether the registrant is a shell company (as defined in Rule 12b-2 of the Act). Yes ‘ No Í
  • 57. As of June 30, 2017, the last business day of our most recently completed second fiscal quarter, the aggregate market value of the registrant’s Class A Common Stock and Class C Common Stock held by non-affiliates was $4,001,622,620 and $3,838,231,258, respectively. As of January 31, 2018, there were 185,279,913 shares of Class A Common Stock, 34,450,000 shares of Class B Convertible Common Stock and 222,442,673 shares of Class C Common Stock outstanding. DOCUMENTS INCORPORATED BY REFERENCE Portions of Under Armour, Inc.’s Proxy Statement for the Annual Meeting of Stockholders to be held on May 9, 2018 are incorporated by reference in Part III of this Form 10-K. UNDER ARMOUR, INC. ANNUAL REPORT ON FORM 10-K TABLE OF CONTENTS
  • 58. PART I. Item 1. Business General . . . . . . . . . . . . . . . . . . . . . . . . . . . . . . . . . . . . . . . . . . . . . . . . . . . . . . . . . . 1 Products . . . . . . . . . . . . . . . . . . . . . . . . . . . . . . . . . . . . . . . . . . . . . . . . . . . . . . . . . . 1 Marketing and Promotion . . . . . . . . . . . . . . . . . . . . . . . . . . . . . . . . . . . . . . . . . . . . 3 Sales and Distribution . . . . . . . . . . . . . . . . . . . . . . . . . . . . . . . . . . . . . . . . . . . . . . . 4 Seasonality . . . . . . . . . . . . . . . . . . . . . . . . . . . . . . . . . . . . . . . . . . . . . . . . . . . . . . . 6 Product Design and Development . . . . . . . . . . . . . . . . . . . . . . . . . . . . . . . . . . . . . 6 Sourcing, Manufacturing and Quality Assurance . . . . . . . . . . . . . . . . . . . . . . . . . 6 Inventory Management . . . . . . . . . . . . . . . . . . . . . . . . . . . . . . . . . . . . . . . . . . . . . . 7 Intellectual Property . . . . . . . . . . . . . . . . . . . . . . . . . . . . . . . . . . . . . . . . . . . . . . . . 8 Competition . . . . . . . . . . . . . . . . . . . . . . . . . . . . . . . . . . . . . . . . . . . . . . . . . . . . . . . 8 Employees . . . . . . . . . . . . . . . . . . . . . . . . . . . . . . . . . . . . . . .
  • 59. . . . . . . . . . . . . . . . . . 9 Available Information . . . . . . . . . . . . . . . . . . . . . . . . . . . . . . . . . . . . . . . . . . . . . . . 9 Item 1A Risk Factors . . . . . . . . . . . . . . . . . . . . . . . . . . . . . . . . . . . . . . . . . . . . . . . . . . . . . . . . . . 10 Item 1B Unresolved Staff Comments . . . . . . . . . . . . . . . . . . . . . . . . . . . . . . . . . . . . . . . . . . . . . 26 Item 2 Properties . . . . . . . . . . . . . . . . . . . . . . . . . . . . . . . . . . . . . . . . . . . . . . . . . . . . . . . . . . . . 27 Item 3 Legal Proceedings . . . . . . . . . . . . . . . . . . . . . . . . . . . . . . . . . . . . . . . . . . . . . . . . . . . . . 27 Executive Officers of the Registrant . . . . . . . . . . . . . . . . . . . . . . . . . . . . . . . . . . . . . . . 28 Item 4 Mine Safety Disclosures . . . . . . . . . . . . . . . . . . . . . . . . . . . . . . . . . . . . . . . . . . . . . . . . . 30 PART II. Item 5 Market for Registrant’s Common Equity, Related Stockholder Matters and Issuer Purchases of Equity Securities . . . . . . . . . . . . . . . . . . . . . . . . . . . . . . . . . . . . . . . . . 31
  • 60. Item 6 Selected Financial Data . . . . . . . . . . . . . . . . . . . . . . . . . . . . . . . . . . . . . . . . . . . . . . . . . 34 Item 7 Management’s Discussion and Analysis of Financial Condition and Results of Operations . . . . . . . . . . . . . . . . . . . . . . . . . . . . . . . . . . . . . . . . . . . . . . . . . . . . . . . . . . 35 Item 7A Quantitative and Qualitative Disclosures About Market Risk . . . . . . . . . . . . . . . . . . . 54 Item 8 Financial Statements and Supplementary Data . . . . . . . . . . . . . . . . . . . . . . . . . . . . . . 57 Item 9 Changes in and Disagreements With Accountants on Accounting and Financial Disclosure . . . . . . . . . . . . . . . . . . . . . . . . . . . . . . . . . . . . . . . . . . . . . . . . . . . . . . . . . . 96 Item 9A Controls and Procedures . . . . . . . . . . . . . . . . . . . . . . . . . . . . . . . . . . . . . . . . . . . . . . . . 96 Item 9B Other Information . . . . . . . . . . . . . . . . . . . . . . . . . . . . . . . . . . . . . . . . . . . . . . . . . . . . . . 96
  • 61. PART III. Item 10 Directors, Executive Officers and Corporate Governance . . . . . . . . . . . . . . . . . . . . . . 98 Item 11 Executive Compensation . . . . . . . . . . . . . . . . . . . . . . . . . . . . . . . . . . . . . . . . . . . . . . . . 98 Item 12 Security Ownership of Certain Beneficial Owners and Management and Related Stockholder Matters . . . . . . . . . . . . . . . . . . . . . . . . . . . . . . . . . . . . . . . . . . . . . . . . . . 98 Item 13 Certain Relationships and Related Transactions, and Director Independence . . . . . 98 Item 14 Principal Accountant Fees and Services . . . . . . . . . . . . . . . . . . . . . . . . . . . . . . . . . . . 98 PART IV. Item 15 Exhibits and Financial Statement Schedules . . . . . . . . . . . . . . . . . . . . . . . . . . . . . . . . 99 Item 16 Form 10-K Summary . . . . . . . . . . . . . . . . . . . . . . . . . .
  • 62. . . . . . . . . . . . . . . . . . . . . . . . . . N/A SIGNATURES . . . . . . . . . . . . . . . . . . . . . . . . . . . . . . . . . . . . . . . . . . . . . . . . . . . . . . . . . . . . . . . . . . 104 PART I ITEM 1. BUSINESS General Our principal business activities are the development, marketing and distribution of branded performance apparel, footwear and accessories for men, women and youth. The brand’s performance apparel and footwear are engineered in many designs and styles for wear in nearly every climate to provide a performance alternative to traditional products. Our products are sold worldwide and are worn by athletes at all levels, from youth to professional, on playing fields around the globe, as well as by consumers with active lifestyles.
  • 63. Our net revenues are generated primarily from the wholesale sales of our products to national, regional, independent and specialty retailers and distributors. We also generate net revenue from the sale of our products through our direct to consumer sales channel, which includes our brand and factory house stores and websites, from product licensing and from digital platform licensing and subscriptions and digital advertising through our Connected Fitness business. A large majority of our products are sold in North America; however we believe that our products appeal to athletes and consumers with active lifestyles around the globe. Internationally, our net revenues are generated from a mix of wholesale sales to retailers and distributors and sales through our direct to consumer sales channels, and license revenue from sales by our third party licensees. We plan to continue to grow our business over the long term through increased sales of our apparel, footwear and accessories, expansion of our wholesale distribution, growth in our direct to consumer sales channel and expansion in international markets. Our digital strategy is focused on
  • 64. supporting these long term objectives, emphasizing connecting and engaging with our consumers through multiple digital touch points, including through our Connected Fitness business. We were incorporated as a Maryland corporation in 1996. As used in this report, the terms “we,” “our,” “us,” “Under Armour” and the “Company” refer to Under Armour, Inc. and its subsidiaries unless the context indicates otherwise. We have registered trademarks around the globe, including UNDER ARMOUR®, HEATGEAR®, COLDGEAR®, ALLSEASONGEAR® and the Under Armour UA Logo, and we have applied to register many other trademarks. This Annual Report on Form 10-K also contains additional trademarks and tradenames of our Company and our subsidiaries. All trademarks and tradenames appearing in this Annual Report on Form 10-K are the property of their respective holders. Products Our product offerings consist of apparel, footwear and accessories for men, women and youth. We market our products at multiple price levels and provide
  • 65. consumers with products that we believe are a superior alternative to traditional athletic products. In 2017, sales of apparel, footwear and accessories represented 66%, 21% and 9% of net revenues, respectively. Licensing arrangements, primarily for the sale of our products, and revenue from our Connected Fitness business represented the remaining 4% of net revenues. Refer to Note 16 to the Consolidated Financial Statements for net revenues by product. Apparel Our apparel is offered in a variety of styles and fits intended to enhance comfort and mobility, regulate body temperature and improve performance regardless of weather conditions. Our apparel is engineered to replace traditional non-performance fabrics in the world of athletics and fitness with performance alternatives designed and merchandised along gearlines. Our three gearlines are 1
  • 66. marketed to tell a very simple story about our highly technical products and extend across the sporting goods, outdoor and active lifestyle markets. We market our apparel for consumers to choose HEATGEAR® when it is hot, COLDGEAR® when it is cold and ALLSEASONGEAR® between the extremes. Within each gearline our apparel comes in three primary fit types: compression (tight fit), fitted (athletic fit) and loose (relaxed). HEATGEAR® is designed to be worn in warm to hot temperatures under equipment or as a single layer. While a sweat-soaked traditional non-performance T-shirt can weigh two to three pounds, HEATGEAR® is engineered with a microfiber blend designed to wick moisture from the body which helps the body stay cool, dry and light. We offer HEATGEAR® in a variety of tops and bottoms in a broad array of colors and styles for wear in the gym or outside in warm weather. COLDGEAR® is designed to wick moisture from the body while circulating body heat from hot spots to help maintain core body temperature. Our
  • 67. COLDGEAR® apparel provides both dryness and warmth in a single light layer that can be worn beneath a jersey, uniform, protective gear or ski-vest, and our COLDGEAR® outerwear products protect the athlete, as well as the coach and the fan from the outside in. Our COLDGEAR® products generally sell at higher prices than our other gearlines. ALLSEASONGEAR® is designed to be worn in between extreme temperatures and uses technical fabrics to keep the wearer cool and dry in warmer temperatures while preventing a chill in cooler temperatures. Footwear Our footwear offerings include running, basketball, cleated, slides and performance training, and outdoor footwear. Our footwear is light, breathable and built with performance attributes for athletes. Our footwear is designed with innovative technologies including UA HOVR™, Anafoam™, UA Clutch Fit® and Charged Cushioning®, which provide stabilization, directional cushioning and moisture management engineered to maximize the athlete’s comfort and
  • 68. control. Accessories Accessories primarily includes the sale of athletic performance gloves, bags and headwear. Our accessories include HEATGEAR® and COLDGEAR® technologies and are designed with advanced fabrications to provide the same level of performance as our other products. Connected Fitness We offer digital fitness subscriptions, along with digital advertising through our MapMyFitness, MyFitnessPal and Endomondo applications. License We have agreements with our licensees to develop Under Armour apparel, accessories and equipment. Our product, marketing and sales teams are involved in substantially all steps of the design and go to market process in order to maintain brand standards and consistency. During 2017, our
  • 69. licensees offered collegiate, National Football League (“NFL), Major League Baseball (“MLB”), and National Basketball Association (“NBA”) apparel and accessories, baby and kids’ apparel, team uniforms, socks, water bottles, eyewear, phone and golf accessories and other specific hard goods equipment that feature performance advantages and functionality similar to our other product offerings. 2 Marketing and Promotion We currently focus on marketing and selling our products to consumers primarily for use in athletics, fitness, training, outdoor activities and as part of an active lifestyle. We seek to drive consumer demand by building brand equity and awareness that our products deliver advantages to help athletes perform better. Sports Marketing
  • 70. Our marketing and promotion strategy begins with providing and selling our products to high- performing athletes and teams on the high school, collegiate and professional levels. We execute this strategy through outfitting agreements, professional and collegiate sponsorships, individual athlete agreements and by providing and selling our products directly to team equipment managers and to individual athletes. We also seek to sponsor events to drive awareness and brand authenticity from a grassroots level by hosting combines, camps and clinics for young athletes in many sports at regional sites across the country. As a result, our products are seen on the field, giving them exposure to various consumer audiences through the internet, television, magazines and live at sporting events. This exposure to consumers helps us establish on-field authenticity as consumers can see our products being worn by high-performing athletes. We are the official outfitter of athletic teams in several high- profile collegiate conferences. We are an official supplier of footwear and gloves to the NFL. We are the Official Performance Footwear Supplier of MLB and a partner with the NBA which allows us to
  • 71. market our NBA athletes in game uniforms in connection with our basketball footwear. We are the official headwear and performance apparel provider for the NFL Scouting Combine and the official partner and title sponsor of the NBA Draft Combine, in each case with the right to sell licensed combine training apparel and headwear. In 2016, we entered into an agreement to be the Official On-Field Uniform Supplier, Official Authentic Performance Apparel Partner, and Official Connected Fitness Partner of MLB, now beginning with the 2019 season, which will allow us to provide on-field uniforms, apparel, and accessories to all thirty MLB clubs on an exclusive basis, and, together with our manufacturing partner sell a broad range of MLB licensed merchandise. Internationally, we sponsor and sell our products to several European and Latin American soccer and rugby teams, which helps drive brand awareness in various countries and regions around the world. Media We feature our products in a variety of national digital, broadcast, and print media outlets. We also
  • 72. utilize social and mobile media to engage consumers and promote connectivity with our brand and our products, and plan to increase our use of social media promotion in the future. For example, in 2017, we launched our first entirely digital marketing campaign for our “Unlike Any” women’s campaign, which included a variety of content on various social media platforms. Retail Presentation The primary component of our retail marketing strategy is to increase brand floor space dedicated to our products within our major retail accounts. The design and funding of Under Armour concept shops within our major retail accounts has been a key initiative for securing prime floor space, educating the consumer and creating an exciting environment for the consumer to experience our brand. Under Armour concept shops enhance our brand’s presentation within our major retail accounts with a shop-in-shop approach, using dedicated floor space exclusively for our products, including flooring, lighting, walls, displays and images.
  • 73. 3 Sales and Distribution The majority of our sales are generated through wholesale channels, which include national and regional sporting goods chains, independent and specialty retailers, department store chains, institutional athletic departments and leagues and teams. In addition, we sell our products to independent distributors in various countries where we generally do not have direct sales operations and through licensees. We also sell our products directly to consumers through our own network of brand and factory house stores in our North America, Europe, the Middle East and Africa (“EMEA”), Latin America and Asia-Pacific operating segments, and through websites globally. Factory house stores serve an important role in our overall inventory management by allowing us to sell a significant portion of excess, discontinued and out-of-season products while
  • 74. maintaining the pricing integrity of our brand in our other distribution channels. Through our brand house stores, consumers experience our brand first-hand and have broader access to our performance products. In 2017, sales through our wholesale, direct to consumer, licensing and Connected Fitness channels represented 61%, 35%, 2% and 2% of net revenues, respectively. We believe the trend toward performance products is global and plan to continue to introduce our products and simple merchandising story to athletes throughout the world. We are introducing our performance apparel, footwear and accessories outside of North America in a manner consistent with our past brand-building strategy, including selling our products directly to teams and individual athletes in these markets, thereby providing us with product exposure to broad audiences of potential consumers. Our primary business operates in four geographic segments: (1) North America, comprising the United States and Canada, (2) EMEA, (3) Asia-Pacific, and (4) Latin America. Each of these
  • 75. geographic segments operate predominantly in one industry: the design, development, marketing and distribution of performance apparel, footwear and accessories. We also operate our Connected Fitness business as a separate segment. The following table presents net revenues by segment for each of the years ending December 31, 2017, 2016 and 2015: Year ended December 31, 2017 2016 2015 (In thousands) Net Revenues % of Net Revenues Net Revenues % of Net Revenues Net Revenues % of Net Revenues North America $3,802,406 76.5% $4,005,314 83.0% $3,455,737 87.2%
  • 76. EMEA 469,997 9.4 330,584 6.9 203,109 5.1 Asia-Pacific 433,647 8.7 268,607 5.6 144,877 3.7 Latin America 181,324 3.6 141,793 2.9 106,175 2.7 Connected Fitness 89,179 1.8 80,447 1.6 53,415 1.3 Intersegment Eliminations — — (1,410) — — — Total net revenues $4,976,553 100.0% $4,825,335 100.0% $3,963,313 100.0% North America Our North America segment accounted for approximately 76.5% of our net revenues for 2017. We sell our branded apparel, footwear and accessories in North America through our wholesale and direct to consumer channels. Net revenues generated from the sales of our products in the United States 4
  • 77. were $3.6 billion, $3.8 billion and $3.3 billion for the years ended December 31, 2017, 2016 and 2015 respectively. See Note 16 to the Consolidated Financial Statements. No customers accounted for more than 10% of our net revenues in 2017. Our direct to consumer sales are generated through our brand and factory house stores and internet websites. As of December 31, 2017, we had 162 factory house stores in North America primarily located in outlet centers throughout the United States. As of December 31, 2017, we had 19 brand house stores in North America. Consumers can purchase our products directly from our e-commerce website, www.underarmour.com. In addition, we earn licensing revenue in North America based on our licensees’ sale of collegiate and league apparel and accessories, as well as sales of other licensed products. In order to maintain consistent quality and performance, we pre-approve all products manufactured and sold by our licensees, and our quality assurance team strives to ensure that
  • 78. the products meet the same quality and compliance standards as the products that we sell directly. We distribute the majority of our products sold to our North American wholesale customers and our brand and factory house stores from distribution facilities we lease and operate in California, Maryland and Tennessee. In addition, we distribute our products in North America through third-party logistics providers with primary locations in Canada, New Jersey and Florida. In some instances, we arrange to have products shipped from the factories that manufacture our products directly to customer-designated facilities. International Approximately 21.7% of our net revenues were generated from our international segments in 2017. We plan to continue to grow our business over the long term in part through expansion in international markets. EMEA
  • 79. We sell our apparel, footwear and accessories primarily through wholesale customers, website operations, independent distributors and a limited number of stores we operate in certain European countries. We also sell our branded products to various sports clubs and teams in Europe. We generally distribute our products to our retail customers and e- commerce consumers in Europe through a third-party logistics provider. We sell our apparel, footwear and accessories through independent distributors in the Middle East and Africa. In 2017 we began selling our products to wholesale customers in Russia. Asia-Pacific We sell our apparel, footwear and accessories products in China, South Korea and Australia through stores operated by our distribution and wholesale partners, along with website operations and stores we operate. We also sell our products to distributors in New Zealand, Taiwan, Hong Kong and other countries in Southeast Asia where we do not have direct sales operations. We distribute our products in Asia-Pacific primarily through a third-party
  • 80. logistics provider based out of Hong Kong. We have a license agreement with Dome Corporation, which produces, markets and sells our branded apparel, footwear and accessories in Japan. Our branded products are sold in Japan to large sporting goods retailers, independent specialty stores and professional sports teams, and through licensee-owned retail stores. We hold a cost-based minority investment in Dome. 5 Latin America We sell our products in Mexico, Chile, Brazil and Argentina through wholesale customers, website operations and brand and factory house stores. In these countries we operate through third-party distribution facilities. In other Latin American countries we distribute our products through independent distributors which are sourced through our international distribution hubs in Hong Kong, Jordan and
  • 81. Panama. Connected Fitness In 2013, we began offering digital fitness subscriptions and licenses, along with digital advertising through our MapMyFitness platform. In 2015, we acquired the Endomondo and MyFitnessPal platforms to create our Connected Fitness business. Approximately 1.8% of our net revenues were generated from our Connected Fitness business in 2017. We plan to engage and grow this community by developing innovative services and other digital solutions to impact how athletes and fitness-minded individuals train, perform and live. Seasonality Historically, we have recognized a majority of our net revenues and a significant portion of our income from operations in the last two quarters of the year, driven primarily by increased sales volume of our products during the fall selling season, including our higher priced cold weather products, along with a larger proportion of higher margin direct to consumer
  • 82. sales. The level of our working capital generally reflects the seasonality and growth in our business. We generally expect inventory, accounts payable and certain accrued expenses to be higher in the second and third quarters in preparation for the fall selling season. Product Design and Development Our products are manufactured with technical fabrications produced by third parties and developed in collaboration with our product development teams. This approach enables us to select and create superior, technically advanced fabrics, produced to our specifications, while focusing our product development efforts on design, fit, climate and product end use. We seek to regularly upgrade and improve our products with the latest in innovative technology while broadening our product offerings. Our goal, to deliver superior performance in all our products, provides our developers and licensees with a clear, overarching direction for the brand and helps them identify new opportunities to create performance products that
  • 83. meet the changing needs of athletes. We design products with “visible technology,” utilizing color, texture and fabrication to enhance our customers’ perception and understanding of product use and benefits. Our product development team works closely with our sports marketing and sales teams as well as professional and collegiate athletes to identify product trends and determine market needs. For example, these teams worked closely to identify the opportunity and market for our COLDGEAR® Infrared product, which is a ceramic print technology on the inside of our garments that provides athletes with lightweight warmth, and Speedform®, a proprietary 3-dimensional molding technology for footwear which delivers superior fit and feel. In 2017 we also opened our newest center for footwear performance innovation located in Portland, Oregon, bringing together footwear design and development teams into a centralized location. Sourcing, Manufacturing and Quality Assurance
  • 84. Many of the specialty fabrics and other raw materials used in our apparel products are technically advanced products developed by third parties and may be available, in the short term, from a limited 6 number of sources. The fabric and other raw materials used to manufacture our apparel products are sourced by our contracted manufacturers from a limited number of suppliers pre-approved by us. In 2017, approximately 53% of the fabric used in our apparel products came from five suppliers. These fabric suppliers have primary locations in Taiwan, Malaysia and Mexico. The fabrics used by our suppliers and manufacturers are primarily synthetic fabrics and involve raw materials, including petroleum based products that may be subject to price fluctuations and shortages. We also use cotton in our apparel products, as blended fabric and also in our CHARGED COTTON® line. Cotton is a commodity that is subject to price fluctuations and supply shortages. Additionally, our footwear uses
  • 85. raw materials that are sourced from a diverse base of third party suppliers. This includes chemicals and petroleum-based components such as rubber that are also subject to price fluctuations and supply shortages. Substantially all of our products are manufactured by unaffiliated manufacturers. In 2017, our apparel and accessories products were manufactured by 39 primary contract manufacturers, operating in 17 countries, with approximately 61% of our apparel and accessories products manufactured in Jordan, Vietnam, China and Malaysia. Of our 39 primary contract manufacturers, 10 produced approximately 57% of our apparel and accessories products. In 2017, our footwear products were manufactured by seven primary contract manufacturers, operating primarily in Vietnam, China and Indonesia. Of our seven primary contract manufacturers, five produced approximately 83% of our footwear products. All manufacturers across all product divisions are evaluated for quality systems, social compliance and financial strength by our internal teams prior to being
  • 86. selected and on an ongoing basis. Where appropriate, we strive to qualify multiple manufacturers for particular product types and fabrications. We also seek out vendors that can perform multiple manufacturing stages, such as procuring raw materials and providing finished products, which helps us to control our cost of goods sold. We enter into a variety of agreements with our contract manufacturers, including non-disclosure and confidentiality agreements, and we require that all of our manufacturers adhere to a code of conduct regarding quality of manufacturing and working conditions and other social concerns. We do not, however, have any long term agreements requiring us to utilize any manufacturer, and no manufacturer is required to produce our products in the long term. We have subsidiaries strategically located near our key partners to support our manufacturing, quality assurance and sourcing efforts for our products. We also manufacture a limited number of products primarily for high-profile athletes and teams, on-premises in our quick turn, Special Make-Up Shop located at one of our facilities in Maryland.
  • 87. Inventory Management Inventory management is important to the financial condition and operating results of our business. We manage our inventory levels based on existing orders, anticipated sales and the rapid- delivery requirements of our customers. Our inventory strategy is focused on continuing to meet consumer demand while improving our inventory efficiency over the long term by putting systems and processes in place to improve our inventory management. These systems and processes, including our new global operating and financial reporting information technology system, are designed to improve our forecasting and supply planning capabilities. In addition to systems and processes, key areas of focus that we believe will enhance inventory performance are added discipline around the purchasing of product, production lead time reduction, and better planning and execution in selling of excess inventory through our factory house stores and other liquidation channels. Our practice, and the general practice in the apparel, footwear and accessory industries, is to offer
  • 88. retail customers the right to return defective or improperly shipped merchandise. As it relates to new product introductions, which can often require large initial launch shipments, we commence production 7 before receiving orders for those products from time to time. This can affect our inventory levels as we build pre-launch quantities. Intellectual Property We believe we own the material trademarks used in connection with the marketing, distribution and sale of our products, both domestically and internationally, where our products are currently sold or manufactured. Our major trademarks include the UA Logo and UNDER ARMOUR®, both of which are registered in the United States, Canada, Mexico, the European Union, Japan, China and numerous other countries. We also own trademark registrations for other trademarks including, among others,
  • 89. UA®, ARMOUR®, HEATGEAR®, COLDGEAR®, ALLSEASONGEAR®, PROTECT THIS HOUSE®, I WILL®, and many trademarks that incorporate the term ARMOUR such as, ARMOURSTORM®, ARMOUR® FLEECE, and ARMOUR BRA®. We also own applications to protect connected fitness branding such as UNDER ARMOUR CONNECTED FITNESS™. We own domain names for our primary trademarks (most notably underarmour.com and ua.com) and hold copyright registrations for several commercials, as well as for certain artwork. We intend to continue to strategically register, both domestically and internationally, trademarks and copyrights we utilize today and those we develop in the future. We will continue to aggressively enforce our trademarks and pursue those who infringe, both domestically and internationally. We believe the distinctive trademarks we use in connection with our products are important in building our brand image and distinguishing our products from those of others. These trademarks are among our most valuable assets. In addition to our distinctive trademarks, we also place significant value on our trade dress, which is the overall image and
  • 90. appearance of our products, and we believe our trade dress helps to distinguish our products in the marketplace. We traditionally have had limited patent protection on much of the technology, materials and processes used in the manufacture of our products. In addition, patents are increasingly important with respect to our innovative products and new businesses and investments, particularly in our Connected Fitness business. As we continue to expand and drive innovation in our products, we expect to seek patent protection on products, features and concepts we believe to be strategic and important to our business. We will continue to strategically file patent applications where we deem appropriate to protect our new products, innovations and designs. We expect the number of applications to increase as our business grows and as we continue to expand our products and innovate. Competition The market for performance apparel, footwear and accessories is highly competitive and includes
  • 91. many new competitors as well as increased competition from established companies expanding their production and marketing of performance products. Many of the fabrics and technology used in manufacturing our products are not unique to us, and we own a limited number of fabric or process patents. Many of our competitors are large apparel and footwear companies with strong worldwide brand recognition and significantly greater resources than us, such as Nike and Adidas. We also compete with other manufacturers, including those specializing in performance apparel and footwear, and private label offerings of certain retailers, including some of our retail customers. In addition, we must compete with others for purchasing decisions, as well as limited floor space at retailers. We believe we have been successful in this area because of the relationships we have developed and as a result of the strong sales of our products. However, if retailers earn higher margins from our competitors’ products, they may favor the display and sale of those products. We believe we have been able to compete successfully because
  • 92. of our brand image and recognition, the performance and quality of our products and our selective distribution policies. We also 8 believe our focused gearline merchandising story differentiates us from our competition. In the future we expect to compete for consumer preferences and expect that we may face greater competition on pricing. This may favor larger competitors with lower production costs per unit that can spread the effect of price discounts across a larger array of products and across a larger customer base than ours. The purchasing decisions of consumers for our products often reflect highly subjective preferences that can be influenced by many factors, including advertising, media, product sponsorships, product improvements and changing styles. Employees As of December 31, 2017, we had approximately 15,800
  • 93. employees, including approximately 9,900 in our brand and factory house stores and approximately 1,500 at our distribution facilities. Approximately 6,900 of our employees were full-time. Most of our employees are located in the United States. None of our employees in the United States are currently covered by a collective bargaining agreement and there are no material collective bargaining agreements in effect in any of our international locations. We have had no labor-related work stoppages, and we believe our relations with our employees are good. Available Information We will make available free of charge on or through our website at www.underarmour.com our annual reports on Form 10-K, quarterly reports on Form 10-Q, current reports on Form 8-K and amendments to these reports filed or furnished pursuant to Section 13(a) or 15(d) of the Exchange Act as soon as reasonably practicable after we file these materials with the Securities and Exchange Commission. We also post on this website our key corporate governance documents, including our
  • 94. board committee charters, our corporate governance guidelines and our code of conduct and ethics. 9 ITEM 1A. RISK FACTORS Forward-Looking Statements Some of the statements contained in this Form 10-K and the documents incorporated herein by reference constitute forward-looking statements. Forward- looking statements relate to expectations, beliefs, projections, future plans and strategies, anticipated events or trends and similar expressions concerning matters that are not historical facts, such as statements regarding our future financial condition or results of operations, our prospects and strategies for future growth, our anticipated charges and restructuring costs and the timing of these measures, the impact of recent tax reform legislation on our results of operations, the development and introduction of new products and the
  • 95. implementation of our marketing and branding strategies. In many cases, you can identify forward- looking statements by terms such as “may,” “will,” “should,” “expects,” “plans,” “anticipates,” “believes,” “estimates,” “predicts,” “outlook,” “potential” or the negative of these terms or other comparable terminology. The forward-looking statements contained in this Form 10-K and the documents incorporated herein by reference reflect our current views about future events and are subject to risks, uncertainties, assumptions and changes in circumstances that may cause events or our actual activities or results to differ significantly from those expressed in any forward-looking statement. Although we believe that the expectations reflected in the forward-looking statements are reasonable, we cannot guarantee future events, results, actions, levels of activity, performance or achievements. Readers are cautioned not to place undue reliance on these forward-looking statements. A number of important factors could cause actual results to differ materially from those indicated by these forward-looking statements, including, but not limited to, those factors described in “Risk Factors” and
  • 96. “Management’s Discussion and Analysis of Financial Condition and Results of Operations.” These factors include without limitation: • changes in general economic or market conditions that could affect overall consumer spending or our industry; • changes to the financial health of our customers; • our ability to successfully execute our long-term strategies; • our ability to successfully execute any restructuring plans and realize expected benefits; • our ability to effectively drive operational efficiency in our business; • our ability to manage the increasingly complex operations of our global business; • our ability to comply with existing trade and other regulations, and the potential impact of new trade and tax regulations on our profitability;
  • 97. • our ability to effectively develop and launch new, innovative and updated products; • our ability to accurately forecast consumer demand for our products and manage our inventory in response to changing demands; • any disruptions, delays or deficiencies in the design, implementation or application of our new global operating and financial reporting information technology system; • increased competition causing us to lose market share or reduce the prices of our products or to increase significantly our marketing efforts; • fluctuations in the costs of our products; • loss of key suppliers or manufacturers or failure of our suppliers or manufacturers to produce or deliver our products in a timely or cost-effective manner, including due to port disruptions; • our ability to further expand our business globally and to drive brand awareness and
  • 98. consumer acceptance of our products in other countries; 10 • our ability to accurately anticipate and respond to seasonal or quarterly fluctuations in our operating results; • our ability to successfully manage or realize expected results from acquisitions and other significant investments or capital expenditures; • risks related to foreign currency exchange rate fluctuations; • our ability to effectively market and maintain a positive brand image; • the availability, integration and effective operation of information systems and other technology, as well as any potential interruption of such systems or technology; • risks related to data security or privacy breaches;
  • 99. • our ability to raise additional capital required to grow our business on terms acceptable to us; • our potential exposure to litigation and other proceedings; and • our ability to attract key talent and retain the services of our senior management and key employees. The forward-looking statements contained in this Form 10-K reflect our views and assumptions only as of the date of this Form 10-K. We undertake no obligation to update any forward-looking statement to reflect events or circumstances after the date on which the statement is made or to reflect the occurrence of unanticipated events. Our results of operations and financial condition could be adversely affected by numerous risks. You should carefully consider the risk factors detailed below in conjunction with the other information contained in this Form 10-K. Should any of these risks actually materialize, our business, financial condition and future prospects could be
  • 100. negatively impacted. During a downturn in the economy, consumer purchases of discretionary items are affected, which could materially harm our sales, profitability and financial condition. Many of our products may be considered discretionary items for consumers. Factors affecting the level of consumer spending for such discretionary items include general economic conditions, the availability of consumer credit and consumer confidence in future economic conditions. Uncertainty in global economic conditions continues, and trends in consumer discretionary spending remain unpredictable. However, consumer purchases of discretionary items tend to decline during recessionary periods when disposable income is lower or during other periods of economic instability or uncertainty, which may slow our growth more than we anticipate. A downturn in the economies in markets in which we sell our products, particularly in North America, may materially harm our sales, profitability and financial condition.
  • 101. We derive a substantial portion of our sales from large wholesale customers. If the financial condition of our customers declines, our financial condition and results of operations could be adversely impacted. In 2017, sales through our wholesale channel represented approximately 61% of our net revenues. We extend credit to our wholesale customers based on an assessment of a customer’s financial condition, generally without requiring collateral. We face increased risk of order reduction or cancellation when dealing with financially ailing customers or customers struggling with economic uncertainty. During weak economic conditions, customers may be more cautious with orders or may slow investments necessary to maintain a high quality in-store experience for consumers, which may result in lower sales of our products. In addition, a slowing economy in our key markets or a continued 11
  • 102. decline in consumer purchases of sporting goods generally could have an adverse effect on the financial health of our customers. From time to time certain of our customers have experienced financial difficulties. To the extent one or more of our customers experience significant financial difficulty, bankruptcy, insolvency or cease operations, this could have a material adverse effect on our sales, our ability to collect on receivables and our financial condition and results of operations. A decline in sales to, or the loss of, one or more of our key customers could result in a material loss of net revenues and negatively impact our prospects for growth. We generate a significant portion of our wholesale revenues from sales to our largest customers. We currently do not enter into long term sales contracts with our key customers, relying instead on our relationships with these customers and on our position in the
  • 103. marketplace. As a result, we face the risk that these key customers may not increase their business with us as we expect, or may significantly decrease their business with us or terminate their relationship with us. The failure to increase our sales to these customers as much as we anticipate would have a negative impact on our growth prospects and any decrease or loss of these key customers’ business could result in a material decrease in our net revenues and net income. In addition, our customers continue to experience ongoing industry consolidation, particularly in the sports specialty sector. As this consolidation continues, it increases the risk that if any one customer significantly reduces their purchases of our products, we may be unable to find sufficient alternative customers to continue to grow our net revenues, or our net revenues may decline. We may not successfully execute our long-term strategies, which may negatively impact our results of operations. Our ability to execute on our long-term strategies depends, in
  • 104. part, on successfully executing on strategic growth initiatives in key areas, such as our international business, footwear and our global direct to consumer sales channel. Our growth in these areas depends on our ability to continue to successfully expand our global network of brand and factory house stores, grow our e-commerce and mobile application offerings throughout the world and continue to successfully increase our product offerings and market share in footwear. Our ability to continue to invest in these growth initiatives in the near-term may be negatively impacted by the performance of our North America business, which represented 77% of our total net revenues in 2017 but declined by 5% over 2016, and in particular the performance of our wholesale channel in North America. Our ability to execute on our long-term strategy also depends on our ability to successfully manage our cost structure and drive return on our investments. If we cannot effectively execute our long-term growth strategies while managing costs effectively, our business and results of operations could be negatively impacted. We may not fully realize the expected benefits of any
  • 105. restructuring plans or other operating or cost-saving initiatives, which may negatively impact our profitability. We have recently announced restructuring plans designed to more closely align our financial resources against the critical priorities of our business. These plans have included initiatives to improve operational efficiencies, and our 2017 restructuring plan included a reduction in our global workforce. We may not achieve our targeted operational improvements and efficiencies, which could adversely impact our results of operations and financial condition. In addition, implementing any restructuring plan presents significant potential risks that may impair our ability to achieve anticipated operating improvements and/or cost reductions. These risks include, among others, higher than anticipated costs in implementing our restructuring plans, management distraction from ongoing business activities, failure to maintain adequate controls and procedures while executing our restructuring plans, damage to our reputation and brand image and workforce attrition beyond planned reductions. If we fail to
  • 106. achieve targeted operating improvements and/or cost reductions, our profitability and results of 12 operations could be negatively impacted and we may be required to implement additional restructuring- related activities, which may be dilutive to our earnings in the short term. We must successfully manage the increasingly complex operations of our global business, or our business and results of operations may be negatively impacted. We have expanded our business and operations rapidly since our inception and our net revenues have increased to $4,976.6 million in 2017 from $2,332.1 million in 2013. We must continue to successfully manage the operational difficulties associated with expanding our business to meet increased consumer demand throughout the world. We may
  • 107. experience difficulties in obtaining sufficient raw materials and manufacturing capacity to produce our products, as well as delays in production and shipments, as our products are subject to risks associated with overseas sourcing and manufacturing. We must also continually evaluate the need to expand critical functions in our business, including sales and marketing, product development and distribution functions, our management information systems and other processes and technology. To support these functions, we must hire, train and manage an increasing number of employees, and obtain more space to support our expanding workforce. We may not be successful in undertaking these types of initiatives cost effectively or at all, and could experience serious operating difficulties if we fail to do so. These growth efforts could also increase the strain on our existing resources. If we experience difficulties in supporting the growth of our business, we could experience an erosion of our brand image and a decrease in net revenues and net income. If we are unable to anticipate consumer preferences, successfully develop and introduce new,
  • 108. innovative and updated products or engage our consumers, our net revenues and profitability may be negatively impacted. Our success depends on our ability to identify and originate product trends as well as to anticipate and react to changing consumer demands in a timely manner. All of our products are subject to changing consumer preferences that cannot be predicted with certainty. In addition, long lead times for certain of our products may make it hard for us to quickly respond to changes in consumer demands. Our new products may not receive consumer acceptance as consumer preferences could shift rapidly to different types of performance or other sports products or away from these types of products altogether, and our future success depends in part on our ability to anticipate and respond to these changes. Even if we are successful in anticipating consumer preferences, our ability to adequately react to and address those preferences will in part depend upon our
  • 109. continued ability to develop and introduce innovative, high-quality products. If we fail to introduce technical innovation in our products or design products in the categories and styles that consumers want, demand for our products could decline and our brand image could be negatively impacted. Our failure to anticipate and respond timely to changing consumer preferences or to effectively introduce new products and enter into new product categories that are accepted by consumers could result in a decrease in net revenues and excess inventory levels, which could have a material adverse effect on our financial condition. In addition, if we experience problems with the quality of our products, our brand reputation may be negatively impacted and we may incur substantial expense to remedy the problems, which could negatively impact our results of operations. In addition, consumer preferences regarding the shopping experience continue to rapidly evolve. If we or our wholesale customers do not provide consumers with an attractive in-store experience, or if we do not continue to provide an engaging and user-friendly digital commerce platform that attracts
  • 110. consumers, our brand image and results of operations could be negatively impacted. 13 Our results of operations could be materially harmed if we are unable to accurately forecast demand for our products. To ensure adequate inventory supply, we must forecast inventory needs and place orders with our manufacturers before firm orders are placed by our customers. In addition, a significant portion of our net revenues are generated by at-once orders for immediate delivery to customers, particularly during the last two quarters of the year, which historically has been our peak season. If we fail to accurately forecast customer demand we may experience excess inventory levels or a shortage of product to deliver to our customers. Factors that could affect our ability to accurately forecast
  • 111. demand for our products include: • an increase or decrease in consumer demand for our products; • our failure to accurately forecast consumer acceptance for our new products; • product introductions by competitors; • unanticipated changes in general market conditions or other factors, which may result in cancellations of advance orders or a reduction or increase in the rate of reorders or at-once orders placed by retailers; • the impact on consumer demand due to unseasonable weather conditions; • weakening of economic conditions or consumer confidence in future economic conditions, which could reduce demand for discretionary items, such as our products; and • terrorism or acts of war, or the threat thereof, or political or labor instability or unrest which
  • 112. could adversely affect consumer confidence and spending or interrupt production and distribution of product and raw materials. Inventory levels in excess of customer demand may result in inventory write-downs or write-offs and the sale of excess inventory at discounted prices or in less preferred distribution channels, which could impair our brand image and have an adverse effect on gross margin. In addition, if we underestimate the demand for our products, our manufacturers may not be able to produce products to meet our customer requirements, and this could result in delays in the shipment of our products and our ability to recognize revenue, lost sales, as well as damage to our reputation and retailer and distributor relationships. The difficulty in forecasting demand also makes it difficult to estimate our future results of operations and financial condition from period to period. A failure to accurately predict the level of demand for our products could adversely impact our profitability or cause us not to achieve our expected financial results.
  • 113. Sales of performance products may not continue to grow or may decline, which could negatively impact our sales and our ability to grow our business. We believe continued growth in industry-wide sales of performance apparel, footwear and accessories will be largely dependent on consumers continuing to transition from traditional alternatives to performance products. If consumers are not convinced these products are a better choice than traditional alternatives, growth in the industry and our business could be adversely affected. In addition, because performance products are often more expensive than traditional alternatives, consumers who are convinced these products provide a better alternative may still not be convinced they are worth the extra cost. If industry-wide sales of performance products do not continue to grow or rather decline, our sales could be negatively impacted and we may not achieve our expected financial results. In addition, our ability to continue to grow our business in line with our
  • 114. expectations could be adversely impacted. 14 We operate in highly competitive markets and the size and resources of some of our competitors may allow them to compete more effectively than we can, resulting in a loss of our market share and a decrease in our net revenues and gross profit. The market for performance apparel, footwear and accessories is highly competitive and includes many new competitors as well as increased competition from established companies expanding their production and marketing of performance products. Because we own a limited number of fabric or process patents, our current and future competitors are able to manufacture and sell products with performance characteristics and fabrications similar to certain of our products. Many of our competitors
  • 115. are large apparel and footwear companies with strong worldwide brand recognition. Due to the fragmented nature of the industry, we also compete with other manufacturers, including those specializing in products similar to ours and private label offerings of certain retailers, including some of our retail customers. Many of our competitors have significant competitive advantages, including greater financial, distribution, marketing and other resources, longer operating histories, better brand recognition among consumers, more experience in global markets and greater economies of scale. In addition, our competitors have long term relationships with our key retail customers that are potentially more important to those customers because of the significantly larger volume and product mix that our competitors sell to them. As a result, these competitors may be better equipped than we are to influence consumer preferences or otherwise increase their market share by: • quickly adapting to changes in customer requirements or consumer preferences; • readily taking advantage of acquisition and other