T distribution | Statistics
•Download as PPTX, PDF•
15 likes•5,013 views

T-distribution is the most famous theoretical probability distribution in continuous family of distributions. T distribution is used in estimation where normal distribution cannot be used to estimate population parameters. Copy the link given below and paste it in new browser window to get more information on T distribution:- http://www.transtutors.com/homework-help/statistics/t-distribution.aspx

Recommended
More Related Content
What's hot
What's hot (20)
Viewers also liked
Viewers also liked (15)
Similar to T distribution | Statistics
Similar to T distribution | Statistics (20)
More from Transweb Global Inc
More from Transweb Global Inc (20)
Recently uploaded
Recently uploaded (20)
T distribution | Statistics
- 2. What is T-distribution? T distribution is theoretical distribution that arises from sampling from normal distribution Discovered by William S Gosset in 1908 and published under penname ‘Student’ in Biometrika. Best for estimation of population mean when sample size is small and population standard deviation is unknown
- 3. Specifics of T-distribution PDF: Mean = 0 Median = 0 Mode = 0 Variance = n / (n-2) Skewness coefficient = 0 Kurtosis coefficient = 6 / (n-4) 2 1 2 1 2 , 2 1 1 )( n n x n Bn xf
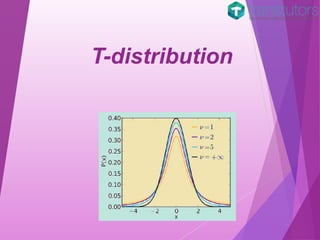
- 4. T-Distribution vs Normal Distribution T distribution Normal distribution More spread Less spread More area in tails Less area in tails Less area in centre More area in centre Used for small n Used for large n Population standard deviation is unknown Population standard deviation is known
- 5. T-distribution Curve in comparison with Normal Curve
- 6. Determination of T-table critical values Critical value tables are available for specified level of significance and degrees of freedom.
- 7. Application of t-tests Test for single sample mean Independent samples t test Dependent sample t test Test for correlation coefficient
- 8. Hey Friends, This was just a summary on T-distribution. For more detailed information on this topic, please type the link given below or copy it from the description of this PPT and open it in a new browser window. http://www.transtutors.com/homework- help/statistics/t-distribution.aspx