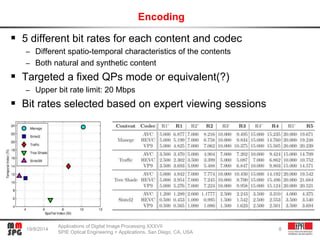
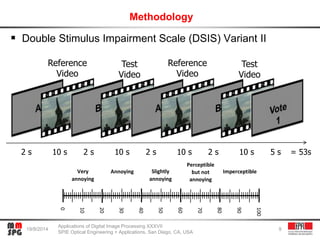
Applications of Digital Image Processing XXXVII
SPIE Optical Engineering + Applications, San Diego, CA, USA, August 18-21, 2014
Martin Rerabek and Touradj Ebrahimi
martin.rerabek@epfl.ch
touradj.ebrahimi@epfl.ch
MMSPG, EPFL, Switzerland
Comparison of compression efficiency
between HEVC and VP9
based on subjective assessments
Outline
 Introduction
 Codecs settings
 Dataset
 Test methodology
 Test equipment and environment
 Results
 Conclusion
19/8/2014
Applications of Digital Image Processing XXXVII
SPIE Optical Engineering + Applications, San Diego, CA, USA
2
Video compression standards for UHDTV
 Motivation
– Increased UHDTV content consumption
• Broadcasting, internet streaming
– Video acquisition and display technologies
evolve faster than network capabilities
– Demand for more efficient compression
 H264/MPEG-4 Part 10 AVC
 H.265/MPEG-H Part 2 HEVC
– Recently released
 WebM data format
– VP9 – recently announced
 Goals
– Better coding efficiency at higher resolutions
– Suitability to a wide variety of applications
19/8/2014
Applications of Digital Image Processing XXXVII
SPIE Optical Engineering + Applications, San Diego, CA, USA
3
HEVC vs VP9 vs AVC comparisons
 Can be reliably compared by means of subjective tests
 Next-generation encoders
– better compression efficiency is expected for resolutions beyond HDTV
 No official subjective evaluations
of HEVC compared to VP9
 This paper provides results
of subjective evaluation
on 4K/QFHD video content
– Professional high-performance
4K/QFHD LCD reference monitor
19/8/2014
Applications of Digital Image Processing XXXVII
SPIE Optical Engineering + Applications, San Diego, CA, USA
4
Contents
Manege (3840x2160@30fps)
Sintel2 (3840x1744@24fps)
Traffic (3840x2048@30fps)
Tree Shade
(3840x2160@30fps)
Sintel39* (3840x1744@24fps)
19/8/2014
Applications of Digital Image Processing XXXVII
SPIE Optical Engineering + Applications, San Diego, CA, USA
5
Encoding
 Standard codecs
– AVC (JM 18.6)
– HEVC (HM 15.0)
 Configuration
– Random Access
– GOP size: 8 pictures
– Intra Period: 1s (broadcast scenario)
 Hierarchical B-pictures
 QP increase of 1 between
each Temporal Level
– Coding Order: 0 8 4 2 1 3 6 5 7
19/8/2014
Applications of Digital Image Processing XXXVII
SPIE Optical Engineering + Applications, San Diego, CA, USA
6
Encoding
 VP9 (1:2:0 - 5183)
 No official documentation
 Parameters set based on VP9 developers recommendations
 Intra Period = 1s
– 24 @ 24 fps, 32 @ 30 fps
19/8/2014
Applications of Digital Image Processing XXXVII
SPIE Optical Engineering + Applications, San Diego, CA, USA
7
Encoding
 5 different bit rates for each content and codec
– Different spatio-temporal characteristics of the contents
– Both natural and synthetic content
 Targeted a fixed QPs mode or equivalent(?)
– Upper bit rate limit: 20 Mbps
 Bit rates selected based on expert viewing sessions
19/8/2014
Applications of Digital Image Processing XXXVII
SPIE Optical Engineering + Applications, San Diego, CA, USA
8
Methodology
 Double Stimulus Impairment Scale (DSIS) Variant II
19/8/2014
Applications of Digital Image Processing XXXVII
SPIE Optical Engineering + Applications, San Diego, CA, USA
9
Age
D
1
Very
annoying
ImperceptibleSlightly
annoying
Perceptible
but not
annoying
Annoying
100
90
80
70
60
50
40
30
20
10
0
10 s
Reference
Video
Test
Video
Reference
Video
Test
Video
10 s 10 s 10 s 5 s2 s 2 s 2 s 2 s = 53s
Sessions
 ITU BT.500-13
– One test session should not last more than 30 minutes
– Alternate as many different contents as possible
 10s sequences => evaluation task requires a lot of attention
– Test sessions no longer than 24 minutes each
– Each session is followed by a resting phase
 Details
– Never the same content in consecutive presentations
– Randomization to avoid possible effect of content presentation order
– Dummy sequences at beginning of 1st session to stabilize observers’ rating
– Reference versus reference stimulus to check subject’s reliability
19/8/2014
Applications of Digital Image Processing XXXVII
SPIE Optical Engineering + Applications, San Diego, CA, USA
10
Tests
 Timing
– 60 sequences (3 codecs × 4 contents × 5 bit rates)
– 3 test sessions + training session
– 1st test session: 2 dummies + 1 ref vs ref + 20 stimuli = 18 x 53 s ~ 21 min
– 2nd test session: 15 stimuli = 20 x 53 s ~ 18 min
– 3rd test session: 15 stimuli = 20 x 53 s ~ 18 min
 Test planning
– 1 day, 4 time slots per day
– 6 subjects per slot, split in 2 groups of 3 subjects each
 Subjects
– 24 naive subjects, 3F/21M
– Ages ranged from 19 to 35 years old (median of 25.5 years old)
 Screening
– Snellen + Ishiara charts
19/8/2014
Applications of Digital Image Processing XXXVII
SPIE Optical Engineering + Applications, San Diego, CA, USA
11
Laboratory for subjective video quality assessment
 PC server
– SSD solution read and play in real time 3840x2160@30fps
YUV 4:2:0 raw video (i.e., 373.25 MB/s!)
 56-inch professional high-performance 4K/QFHD LCD
reference monitor Sony Trimaster SRM-L560
 ITU-R BT.500-13 compliant test environment
 ITU-R BT.2022 viewing condition
– 3 subjects in front of the screen
– Viewing distance ≈ 1.6x screen height
19/8/2014
Applications of Digital Image Processing XXXVII
SPIE Optical Engineering + Applications, San Diego, CA, USA
12
Manege
 HEVC vs AVC bit-rate reduction
– BD-PSNR: 28.7%
– BD-MOS: 44.6%
 VP9 vs AVC bit-rate reduction
– BD-PSNR: -10.6%
– BD-MOS: -29.2%
 HEVC vs VP9 bit-rate reduction
– BD-PSNR: 39.7%
– BD-MOS: 63.7%
19/8/2014
Applications of Digital Image Processing XXXVII
SPIE Optical Engineering + Applications, San Diego, CA, USA
13
Traffic
 HEVC vs AVC bit-rate reduction
– BD-PSNR: 37.2%
– BD-MOS: 57.5%
 VP9 vs AVC bit-rate reduction
– BD-PSNR: -25.1%
– BD-MOS: -61.0%
 HEVC vs VP9 bit-rate reduction
– BD-PSNR: 49.8%
– BD-MOS: 74.7%
19/8/2014
Applications of Digital Image Processing XXXVII
SPIE Optical Engineering + Applications, San Diego, CA, USA
14
Tree Shade
 HEVC vs AVC bit-rate reduction
– BD-PSNR: 22.7%
– BD-MOS: 37.4%
 VP9 vs AVC bit-rate reduction
– BD-PSNR: -18.9%
– BD-MOS: 8.2%
 HEVC vs VP9 bit-rate reduction
– BD-PSNR: 33.7%
– BD-MOS: 31.9%
19/8/2014
Applications of Digital Image Processing XXXVII
SPIE Optical Engineering + Applications, San Diego, CA, USA
15
Sintel2
 HEVC vs AVC bit-rate reduction
– BD-PSNR: 69.9%
– BD-MOS: 70.9%
 VP9 vs AVC bit-rate reduction
– BD-PSNR: 60.9%
– BD-MOS: 61.7%
 HEVC vs VP9 bit-rate reduction
– BD-PSNR: 19.0%
– BD-MOS: 27.5%
19/8/2014
Applications of Digital Image Processing XXXVII
SPIE Optical Engineering + Applications, San Diego, CA, USA
16
HEVC vs VP9 vs AVC overall results
 General comparison for all content
– average bit-rate reduction over widest range of bit-rates and quality
 Robustness in transparent or close to transparent bit-rates
– Further bit-rate savings for each codec based on MOS scores related to fully
transparent or close to transparent quality of decoded content
19/8/2014
Applications of Digital Image Processing XXXVII
SPIE Optical Engineering + Applications, San Diego, CA, USA
17
BD-PSNR BD-MOS BD-PSNR BD-MOS BD-PSNR BD-MOS
39.60% 52.60% 1.59% -5.10% 35.60% 49.40%
HEVC vs AVC VP9 vs AVC HEVC vs VP9
Natural Synthetic Natural Synthetic Natural Synthetic
68.90% 71.90% 43.00% 26.80% 24.30% 56.70%
HEVC AVC VP9
Conclusion
 Comparison for broadcast scenario – I frame each 1s
 Reliability of subjective evaluation results
 Variability in codecs performance
– Depending on content and coding conditions
 General improvement in compression performance for
HEVC compared to VP9
– When considering wide range of bit-rate form low to high
corresponding to low to transparent quality video content
– Similar performance for higher bit-rates and for synthetic content
 Future work
– Comparison between HEVC and VP9 for Internet Streaming
– More content to further verify results
19/8/2014
Applications of Digital Image Processing XXXVII
SPIE Optical Engineering + Applications, San Diego, CA, USA
18
19/8/2014
Applications of Digital Image Processing XXXVII
SPIE Optical Engineering + Applications, San Diego, CA, USA
19
Thank you for your attention!

Comparison of compression efficiency between HEVC and VP9 based on subjective assessments

  • 1.
    Applications of DigitalImage Processing XXXVII SPIE Optical Engineering + Applications, San Diego, CA, USA, August 18-21, 2014 Martin Rerabek and Touradj Ebrahimi martin.rerabek@epfl.ch touradj.ebrahimi@epfl.ch MMSPG, EPFL, Switzerland Comparison of compression efficiency between HEVC and VP9 based on subjective assessments
  • 2.
    Outline  Introduction  Codecssettings  Dataset  Test methodology  Test equipment and environment  Results  Conclusion 19/8/2014 Applications of Digital Image Processing XXXVII SPIE Optical Engineering + Applications, San Diego, CA, USA 2
  • 3.
    Video compression standardsfor UHDTV  Motivation – Increased UHDTV content consumption • Broadcasting, internet streaming – Video acquisition and display technologies evolve faster than network capabilities – Demand for more efficient compression  H264/MPEG-4 Part 10 AVC  H.265/MPEG-H Part 2 HEVC – Recently released  WebM data format – VP9 – recently announced  Goals – Better coding efficiency at higher resolutions – Suitability to a wide variety of applications 19/8/2014 Applications of Digital Image Processing XXXVII SPIE Optical Engineering + Applications, San Diego, CA, USA 3
  • 4.
    HEVC vs VP9vs AVC comparisons  Can be reliably compared by means of subjective tests  Next-generation encoders – better compression efficiency is expected for resolutions beyond HDTV  No official subjective evaluations of HEVC compared to VP9  This paper provides results of subjective evaluation on 4K/QFHD video content – Professional high-performance 4K/QFHD LCD reference monitor 19/8/2014 Applications of Digital Image Processing XXXVII SPIE Optical Engineering + Applications, San Diego, CA, USA 4
  • 5.
    Contents Manege (3840x2160@30fps) Sintel2 (3840x1744@24fps) Traffic(3840x2048@30fps) Tree Shade (3840x2160@30fps) Sintel39* (3840x1744@24fps) 19/8/2014 Applications of Digital Image Processing XXXVII SPIE Optical Engineering + Applications, San Diego, CA, USA 5
  • 6.
    Encoding  Standard codecs –AVC (JM 18.6) – HEVC (HM 15.0)  Configuration – Random Access – GOP size: 8 pictures – Intra Period: 1s (broadcast scenario)  Hierarchical B-pictures  QP increase of 1 between each Temporal Level – Coding Order: 0 8 4 2 1 3 6 5 7 19/8/2014 Applications of Digital Image Processing XXXVII SPIE Optical Engineering + Applications, San Diego, CA, USA 6
  • 7.
    Encoding  VP9 (1:2:0- 5183)  No official documentation  Parameters set based on VP9 developers recommendations  Intra Period = 1s – 24 @ 24 fps, 32 @ 30 fps 19/8/2014 Applications of Digital Image Processing XXXVII SPIE Optical Engineering + Applications, San Diego, CA, USA 7
  • 8.
    Encoding  5 differentbit rates for each content and codec – Different spatio-temporal characteristics of the contents – Both natural and synthetic content  Targeted a fixed QPs mode or equivalent(?) – Upper bit rate limit: 20 Mbps  Bit rates selected based on expert viewing sessions 19/8/2014 Applications of Digital Image Processing XXXVII SPIE Optical Engineering + Applications, San Diego, CA, USA 8
  • 9.
    Methodology  Double StimulusImpairment Scale (DSIS) Variant II 19/8/2014 Applications of Digital Image Processing XXXVII SPIE Optical Engineering + Applications, San Diego, CA, USA 9 Age D 1 Very annoying ImperceptibleSlightly annoying Perceptible but not annoying Annoying 100 90 80 70 60 50 40 30 20 10 0 10 s Reference Video Test Video Reference Video Test Video 10 s 10 s 10 s 5 s2 s 2 s 2 s 2 s = 53s
  • 10.
    Sessions  ITU BT.500-13 –One test session should not last more than 30 minutes – Alternate as many different contents as possible  10s sequences => evaluation task requires a lot of attention – Test sessions no longer than 24 minutes each – Each session is followed by a resting phase  Details – Never the same content in consecutive presentations – Randomization to avoid possible effect of content presentation order – Dummy sequences at beginning of 1st session to stabilize observers’ rating – Reference versus reference stimulus to check subject’s reliability 19/8/2014 Applications of Digital Image Processing XXXVII SPIE Optical Engineering + Applications, San Diego, CA, USA 10
  • 11.
    Tests  Timing – 60sequences (3 codecs × 4 contents × 5 bit rates) – 3 test sessions + training session – 1st test session: 2 dummies + 1 ref vs ref + 20 stimuli = 18 x 53 s ~ 21 min – 2nd test session: 15 stimuli = 20 x 53 s ~ 18 min – 3rd test session: 15 stimuli = 20 x 53 s ~ 18 min  Test planning – 1 day, 4 time slots per day – 6 subjects per slot, split in 2 groups of 3 subjects each  Subjects – 24 naive subjects, 3F/21M – Ages ranged from 19 to 35 years old (median of 25.5 years old)  Screening – Snellen + Ishiara charts 19/8/2014 Applications of Digital Image Processing XXXVII SPIE Optical Engineering + Applications, San Diego, CA, USA 11
  • 12.
    Laboratory for subjectivevideo quality assessment  PC server – SSD solution read and play in real time 3840x2160@30fps YUV 4:2:0 raw video (i.e., 373.25 MB/s!)  56-inch professional high-performance 4K/QFHD LCD reference monitor Sony Trimaster SRM-L560  ITU-R BT.500-13 compliant test environment  ITU-R BT.2022 viewing condition – 3 subjects in front of the screen – Viewing distance ≈ 1.6x screen height 19/8/2014 Applications of Digital Image Processing XXXVII SPIE Optical Engineering + Applications, San Diego, CA, USA 12
  • 13.
    Manege  HEVC vsAVC bit-rate reduction – BD-PSNR: 28.7% – BD-MOS: 44.6%  VP9 vs AVC bit-rate reduction – BD-PSNR: -10.6% – BD-MOS: -29.2%  HEVC vs VP9 bit-rate reduction – BD-PSNR: 39.7% – BD-MOS: 63.7% 19/8/2014 Applications of Digital Image Processing XXXVII SPIE Optical Engineering + Applications, San Diego, CA, USA 13
  • 14.
    Traffic  HEVC vsAVC bit-rate reduction – BD-PSNR: 37.2% – BD-MOS: 57.5%  VP9 vs AVC bit-rate reduction – BD-PSNR: -25.1% – BD-MOS: -61.0%  HEVC vs VP9 bit-rate reduction – BD-PSNR: 49.8% – BD-MOS: 74.7% 19/8/2014 Applications of Digital Image Processing XXXVII SPIE Optical Engineering + Applications, San Diego, CA, USA 14
  • 15.
    Tree Shade  HEVCvs AVC bit-rate reduction – BD-PSNR: 22.7% – BD-MOS: 37.4%  VP9 vs AVC bit-rate reduction – BD-PSNR: -18.9% – BD-MOS: 8.2%  HEVC vs VP9 bit-rate reduction – BD-PSNR: 33.7% – BD-MOS: 31.9% 19/8/2014 Applications of Digital Image Processing XXXVII SPIE Optical Engineering + Applications, San Diego, CA, USA 15
  • 16.
    Sintel2  HEVC vsAVC bit-rate reduction – BD-PSNR: 69.9% – BD-MOS: 70.9%  VP9 vs AVC bit-rate reduction – BD-PSNR: 60.9% – BD-MOS: 61.7%  HEVC vs VP9 bit-rate reduction – BD-PSNR: 19.0% – BD-MOS: 27.5% 19/8/2014 Applications of Digital Image Processing XXXVII SPIE Optical Engineering + Applications, San Diego, CA, USA 16
  • 17.
    HEVC vs VP9vs AVC overall results  General comparison for all content – average bit-rate reduction over widest range of bit-rates and quality  Robustness in transparent or close to transparent bit-rates – Further bit-rate savings for each codec based on MOS scores related to fully transparent or close to transparent quality of decoded content 19/8/2014 Applications of Digital Image Processing XXXVII SPIE Optical Engineering + Applications, San Diego, CA, USA 17 BD-PSNR BD-MOS BD-PSNR BD-MOS BD-PSNR BD-MOS 39.60% 52.60% 1.59% -5.10% 35.60% 49.40% HEVC vs AVC VP9 vs AVC HEVC vs VP9 Natural Synthetic Natural Synthetic Natural Synthetic 68.90% 71.90% 43.00% 26.80% 24.30% 56.70% HEVC AVC VP9
  • 18.
    Conclusion  Comparison forbroadcast scenario – I frame each 1s  Reliability of subjective evaluation results  Variability in codecs performance – Depending on content and coding conditions  General improvement in compression performance for HEVC compared to VP9 – When considering wide range of bit-rate form low to high corresponding to low to transparent quality video content – Similar performance for higher bit-rates and for synthetic content  Future work – Comparison between HEVC and VP9 for Internet Streaming – More content to further verify results 19/8/2014 Applications of Digital Image Processing XXXVII SPIE Optical Engineering + Applications, San Diego, CA, USA 18
  • 19.
    19/8/2014 Applications of DigitalImage Processing XXXVII SPIE Optical Engineering + Applications, San Diego, CA, USA 19 Thank you for your attention!

Editor's Notes

  • #6 *Only used for training
  • #9 Select lower/upper bounds for each content separately Targeting realistic bit rates Try to cover the full quality scale
  • #10 “Rate the level of annoyance of the visual defects that you see in stimulus B, knowing that A is the reference video.”
  • #12 Training: Oral instructions to explain the task and the meaning of each label reported on the scale Viewing session to allow the viewer familiarizing with the assessment procedure Training samples have quality levels representative of the labels reported on the rating scales
  • #18 - Sign correspond to bit-rate over-head