SlideShare a Scribd company logo
1 of 177
Download to read offline
ASSISTANT SECRETARY OF DEFENSE 
3500 DEFENSE PENTAGON 
WASHINGTON, DC 20301-3500 
LOGISTICS AND MAY 2 7 2014 
MATERIEL READINESS 
MEMORANDUM FOR SECRETARIES OF THE MILITARY DEPARTMENTS 
DEPUTY CHIEF MANAGEMENT OFFICER 
DEPARTMENT OF DEFENSE CHIEF INFORMATION OFFICER 
DIRECTORS OF THE DEFENSE AGENCIES 
AT&L DIRECT REPORTS 
SUBJECT: Performance Based Logistics (PBL) Guidebook 
REFERENCE: Under Secretary of Defense for Acquisition, Technology, and Logistics (USD(AT&L)) memorandum, “Implementing Directive for Better Buying Power 2.0 – Achieving Greater Efficiency and Productivity in Defense Spending,” April 24, 2013 
PBL has achieved some notable success as a tool for sustaining warfighting capability at reasonable cost. Recent studies point to additional opportunity to be realized through more broadly applying properly structured and executed PBL arrangements. Better Buying Power (BBP) 2.0 heightened the Department’s urgency to incentivize productivity and innovation in industry and government, and performance based arrangements are one tool for achieving this end. The Office of the Assistant Secretary of Defense for Logistics and Materiel Readiness, in collaboration with the Services and the Defense Acquisition University, developed the attached PBL Guidebook to assist the workforce in developing effective PBL arrangements. The PBL Guidebook was designed from front to back as a reference manual for experienced practitioners and a how-to-guide for new-to-PBL logisticians. 
The guidebook complements Department policies and guidance while providing PBL best practices and practical examples. The content of the guidebook will be integrated with the DAU PBL Community of Practice to ensure it is readily accessible to Program Managers, Product Support Managers, Logistics Managers, Contracting Officers, Financial Managers, System Engineers and others with sustainment responsibilities. As lessons learned are harnessed from across the Services, the guidebook will be updated annually to ensure its content remains timely, relevant, and actionable. 
Paul D. Peters 
Acting 
Attachment 
As stated
1 
U.S. Department of Defense | 2014 
PBL GUIDEBOOK 
A Guide to Developing Performance-Based Arrangements
2 
[INTENTIONALLY LEFT BLANK]
3 
Introduction 
Better Buying Power (BBP) 2.0 identifies seven focus areas to achieve greater efficiency and productivity in defense spending. Based on proven success, Performance-Based Logistics (PBL) is included within BBP 2.0 area three – “Incentivize Productivity and Innovation in Industry and Government.” BBP 2.0 emphasizes that delivering better value to the taxpayer and Warfighter is the goal. In support of BBP 2.0, the Assistant Secretary of Defense for Logistics and Materiel Readiness (ASD (L&MR)), in collaboration with the Services and Defense Acquisition University (DAU), prepared this PBL Guidebook. This document is for Component Leadership, Program Executive Officers (PEO), Program Managers (PM), Product Support Managers (PSM), Logistics Managers, Contracting Officers, Financial Managers, System Engineers, and other parties responsible for developing and executing product support strategies. It is a consolidated resource that leverages Department of Defense Instructions (DoDI) and other guidebooks, and uses the Product Support Business Model as an organizing construct for PBL best practices, processes, and supporting documentation needed to craft effective PBL arrangements. 
How to Use This Document 
This Guidebook is divided into three major sections, each with various subsections. Section One provides background information that addresses the history of PBL, how it works, and considerations for its application across the various phases of a program’s life cycle. Section Two complements and expands upon the DoD 12-Step Product Support Strategy Process Model provided in the PSM Guidebook for systems, subsystems, or components. The steps in Section Two are intended to assist the reader in successfully implementing a PBL arrangement with the recognition that, depending on the life cycle phase, not all steps may be applicable and all are tailorable depending on the unique requirements of a given program. Section Three is the appendices. This document provides hardware-focused examples, but the steps in this document may also be applied to Major Automated Information System (MAIS) programs. As an example for the reader to follow in developing and implementing a PBL arrangement, a notional Generic Subsystem (GSS) (that implements a PBL solution with a commercial Original Equipment Manufacturer (OEM)) is included throughout the Guidebook.
4 
Table of Contents 
PBL-Defined ............................................................................................................... 8 1.1. 
Policy and Guidance Overview................................................................................... 8 1.2. 
History of PBL ............................................................................................................ 8 1.3. 
PBL in Commercial Industry............................................................. 8 1.3.1. 
PBL Origins in DoD .......................................................................... 9 1.3.2. 
An Analysis of PBL Effectiveness .................................................... 9 1.3.3. 
How Performance-Based Arrangements Work......................................................... 11 1.4. 
Industry is Driven by Profit, Return on Invested Capital, Long-Term 1.4.1. Revenue Stream, and Risk ............................................................... 12 
Aligning the Interests of Government and Industry.................................................. 14 1.5. 
Product Support Business Model and PBL: An Enabling Function across a 1.6. Program/Product Life Cycle...................................................................................... 15 
Materiel Solution Analysis .............................................................. 17 1.6.1. 
Technology Maturation and Risk Reduction ................................... 18 1.6.2. 
Engineering and Manufacturing Development................................ 19 1.6.3. 
Production and Deployment ............................................................ 19 1.6.4. 
Operations and Support.................................................................... 20 1.6.5. 
2. Standard and Repeatable Processes (S&RP) for PBL ................................................ 22 
Step 1. Integrate Warfighter Requirements & Support ............................................. 24 2.1. 
Introduction...................................................................................... 24 2.1.1. 
Process ............................................................................................. 25 2.1.2. 
Conclusion ....................................................................................... 26 2.1.3. 
Concepts in Action: GSS Use Case ................................................. 26 2.1.4. 
Step 2. Form the Product Support Management IPT ................................................ 27 2.2. 
Introduction...................................................................................... 27 2.2.1. 
Process ............................................................................................. 27 2.2.2. 
Conclusion ....................................................................................... 29 2.2.3. 
Concepts in Action: GSS Use Case ................................................. 29 2.2.4. 
Step 3. Baseline the System ...................................................................................... 31 2.3. 
Introduction...................................................................................... 31 2.3.1. 
Process ............................................................................................. 32 2.3.2. 
Conclusion ....................................................................................... 37 2.3.3. 
Concepts in Action: GSS Use Case ................................................. 37 2.3.4. 
Step 4. Identify/Refine Performance Outcomes........................................................ 41 2.4. 
Introduction...................................................................................... 41 2.4.1. 
Process ............................................................................................. 41 2.4.2. 
Conclusion ....................................................................................... 44 2.4.3. 
Concepts in Action: GSS Use Case ................................................. 44 2.4.4. 
Step 5. Business Case Analysis................................................................................. 46 2.5. 
Introduction...................................................................................... 46 2.5.1. 
Process ............................................................................................. 47 2.5.2. 
Conclusion ....................................................................................... 51 2.5.3. 
Concepts in Action: GSS Use Case ................................................. 51 2.5.4. 
Step 6. Product Support Value Analysis ................................................................... 54 2.6. 
Introduction...................................................................................... 54 2.6.1.
5 
Process ............................................................................................. 54 2.6.2. 
Conclusion ....................................................................................... 66 2.6.3. 
Concepts in Action: GSS Use Case ................................................. 67 2.6.4. 
Step 7. Determine Support Methods(s) ..................................................................... 69 2.7. 
Introduction...................................................................................... 69 2.7.1. 
Process ............................................................................................. 69 2.7.2. 
Conclusion ....................................................................................... 70 2.7.3. 
Concepts in Action: GSS Use Case ................................................. 70 2.7.4. 
Step 8. Designate Product Support Integrator(s) (PSI) ............................................. 72 2.8. 
Introduction...................................................................................... 72 2.8.1. 
Process ............................................................................................. 72 2.8.2. 
Conclusion ....................................................................................... 72 2.8.3. 
Concepts in Action: GSS Use Case ................................................. 72 2.8.4. 
Step 9. Identify Product Support Provider(s) (PSP).................................................. 74 2.9. 
Introduction...................................................................................... 74 2.9.1. 
Process ............................................................................................. 74 2.9.2. 
Conclusion ....................................................................................... 75 2.9.3. 
Concepts in Action: GSS Use Case ................................................. 75 2.9.4. 
Step 10. Identify/Refine Financial Enablers.............................................................. 76 2.10. 
Introduction...................................................................................... 76 2.10.1. 
Process ............................................................................................. 76 2.10.2. 
Conclusion ....................................................................................... 79 2.10.3. 
Concepts in Action: GSS Use Case ................................................. 79 2.10.4. 
Step 11. Establish/Refine Product Support Arrangements........................................ 80 2.11. 
Introduction...................................................................................... 80 2.11.1. 
Process ............................................................................................. 80 2.11.2. 
Contract Framework ........................................................................ 80 2.11.3. 
Conclusion ....................................................................................... 88 2.11.4. 
Concepts in Action: GSS Use Case ................................................. 88 2.11.5. 
Step 12. Implement and Assess................................................................................. 89 2.12. 
Introduction...................................................................................... 89 2.12.1. 
Process ............................................................................................. 89 2.12.2. 
Conclusion ....................................................................................... 90 2.12.3. 
Concepts in Action: GSS Use Case ................................................. 90 2.12.4. 
Resource A: Frequently Asked Questions (FAQ)..................................................... 92 3.1. 
Resource B: Acronyms............................................................................................ 104 3.2. 
Resource C: Bibliography ....................................................................................... 109 3.3. 
Appendix A: PBL Tenets ........................................................................................ 113 3.4. 
Appendix B: GSS PSMIPT Charter Example......................................................... 117 3.5. 
Appendix C: Knowledge Transfer and PSMIPT Training...................................... 120 3.6. 
Appendix D: DAU’s PBL Training and Knowledge-Sharing Resources ............... 124 3.7. 
Appendix E: Expansion of Key Considerations to Baseline the System................ 126 3.8. 
Appendix F: PBL Metrics ....................................................................................... 132 3.9. 
Appendix G: Calculating Weights from Pairwise Comparison Votes .................... 146 3.10. 
Appendix H: Other Sources for Cost Estimation .................................................... 147 3.11. 
Appendix I: PBL Contract Example ....................................................................... 148 3.12.
6 
List of Tables 
Table 1: Tenets of PBL................................................................................................................... 9 
Table 2: Empirical Findings.......................................................................................................... 10 
Table 3: Commercial Firms’ Business Goals ............................................................................... 13 
Table 4: PBL Key Considerations ................................................................................................ 18 
Table 5: When to Pursue a Change in Product Support Strategy ................................................. 21 
Table 6: JCIDS Sustainment Requirements.................................................................................. 25 
Table 7: PSMIPT Principles ......................................................................................................... 29 
Table 8: Initial Questions for Cost, Readiness, and Other Factors............................................... 32 
Table 9: Phase 1: Data-Gathering Activities ................................................................................ 34 
Table 10: Phase 2: Data Review and Analysis Process Steps ...................................................... 35 
Table 11: Factors to Consider When Assessing Readiness and Cost ........................................... 36 
Table 12: Phase 3 Recommendation Generation Process Steps ................................................... 37 
Table 13: Key Considerations Addressed for GSS....................................................................... 40 
Table 14: Metrics Selection by Level and Product Support Element........................................... 42 
Table 15: Types of Partnerships to Consider for PBL Alternatives ............................................. 48 
Table 16: PBL Partnership Scope Assessment Criteria................................................................ 50 
Table 17: Continuum of PBL Arrangements ................................................................................ 51 
Table 18: Cost Drivers and Cost Estimate Considerations for Product Support Alternatives...... 57 
Table 19: Cost Estimation Methodologies.................................................................................... 58 
Table 20: Benefits Evaluation Criteria ......................................................................................... 60 
Table 21: Sample Benefits Scale .................................................................................................. 61 
Table 22: Risk Categories............................................................................................................. 62 
Table 23: List of Risks for GSS.................................................................................................... 63 
Table 24: GSS Final Normalized Score and Ranking .................................................................. 66 
Table 25: Alternatives Summary for GSS Use Case .................................................................... 68 
Table 26: GSS Risk Mitigation Plan............................................................................................. 71 
Table 27. Funding Source Comparison ........................................................................................ 79 
Table 28: Priorities Tied to CWT Metric...................................................................................... 82 
Table 29: CWT Incentives and Disincentives .............................................................................. 83 
Table 30: MTBF Incentives and Disincentives ............................................................................ 83 
Table 31: Industry Perspective...................................................................................................... 84 
Table 32: Reporting Requirements ............................................................................................... 85 
Table 33: Operational Hour and Demand Bands.......................................................................... 86 
List of Figures 
Figure 1: Proof Point Results........................................................................................................ 10 
Figure 2: Product Support Business Model .................................................................................. 16 
Figure 3: Program/Product Life Cycle and GSS........................................................................... 17 
Figure 4. The DoD Product Support Strategy Process Model ...................................................... 22 
Figure 5: Relationship between AO and AM.................................................................................. 25 
Figure 6. Product Support Management IPT................................................................................ 28 
Figure 7: Metrics Alignment......................................................................................................... 42 
Figure 8: Metrics Decomposition ................................................................................................. 43 
Figure 9: GSS Metrics by Level and IPS Elements...................................................................... 45 
Figure 10: PBL Partnership Assessment....................................................................................... 49
7 
Figure 11: Approach for Utility Scoring....................................................................................... 55 
Figure 12: Pairwise Comparison................................................................................................... 55 
Figure 13: GSS Cost, Benefit, and Risk Weights ......................................................................... 55 
Figure 14: Cumulative Costs by Cost Drivers .............................................................................. 58 
Figure 15: GSS Evaluation Criteria Weights................................................................................ 60 
Figure 16: Alternative Benefit Ranking........................................................................................ 61 
Figure 17: Risk Matrix.................................................................................................................. 64 
Figure 18: Risk Matrix.................................................................................................................. 64 
Figure 19: Average Risk Scores ................................................................................................... 65 
Figure 20: GSS Cost, Benefit, and Risk Weights ......................................................................... 66 
Figure 21. Alternatives to Fund a PBL Contract .......................................................................... 76 
Figure 22. Steps to Fund a PBL Contract Using WCFs ............................................................... 77 
Figure 23. Uniform Contract Structure......................................................................................... 81
PBL Guidebook Section 1: Background 
8 
1. Background 
PBL Defined 1.1. 
PBL is synonymous with performance-based life cycle product support, where outcomes are acquired through performance-based arrangements that deliver Warfighter requirements and incentivize product support providers to reduce costs through innovation. These arrangements are contracts with industry or intragovernmental agreements.1 
A PBL arrangement is not synonymous with Contractor Logistics Support (CLS). CLS signifies the “who” of providing support, not the “how” of the business model. CLS is support provided by a contractor, whether the arrangement is structured around Warfighter outcomes with associated incentives or not. PBL arrangements, on the other hand, are tied to Warfighter outcomes and integrate the various product support activities (e.g., supply support, sustaining engineering, maintenance, etc.) of the supply chain with appropriate incentives and metrics. In addition, PBL focuses on combining best practices of both Government and industry. 
Policy and Guidance Overview 1.2. 
PBL has been the preferred sustainment strategy since the 2001 Quadrennial Defense Review (QDR) stating, “DoD will implement PBL to compress the supply chain and improve readiness for major weapons systems and commodities.” Since then, it has been both DoD policy2 and a strategic priority to increase the use of performance-based arrangements to deliver product support solutions3 that satisfy Warfighter requirements. 
The policies governing these strategies have gone through several iterations since 2001, but the intent has remained the same: to provide life cycle product support that delivers needed reliability and availability at a reduced cost while complying with directives, such as inventory accountability within a Government Accountable Property System of Record, and maximizing the use of existing Government-owned inventory when purchasing through a PBL. A detailed listing of the Product Support and PBL policies, guidance, and tools can be found at: https://acc.dau.mil/productsupport and https://acc.dau.mil/pbl. 
History of PBL 1.3. 
PBL in Commercial Industry 1.3.1. 
System and subsystem4 PBL strategies have been around for many years in commercial aviation. In these strategies, often referred to as “Power by the Hour,5” the customer pays the Product Support Provider (PSP) for a specified target level (system, subsystem, or component) of availability; this availability is measured as a percent value or the number of hours in an operational period, and the payment is based on usage. The provider incurs whatever costs are necessary to deliver the specified performance outcome. Similar strategies were successfully implemented in the heavy construction equipment sector. As the DoD considered the merits of 
1 PBL description from the ASD L&MR “Performance-Based Logistics Comprehensive Guidance” Memorandum DTD 22 Nov 13 
2DoDI 5000.02 
3 A product support solution is the implementation of a product support strategy 
4 System, subsystem, and component definitions can be found in the PSM Guidebook at https://acc.dau.mil/psm-guidebook 
5Rolls-Royce Corporation
PBL Guidebook Section 1: Background 
9 
adopting PBL, it determined the practices proven in commercial aviation were extensible to a broad range of hardware and software-intensive weapons systems. 
PBL Origins in DoD 1.3.2. 
PBL in DoD can be traced back to 1999, specifically to a collaborative approach adopted by Lockheed Martin and the Air Force to deliver support for the F-117 Nighthawk stealth ground-attack aircraft after the Base Realignment and Closure (BRAC) of the Sacramento Air Logistics Center (Geary & Vitasek, 2008). The Services originally implemented PBL to improve system readiness. More recently, PBL has been implemented to deliver needed reliability and availability, reduce total cost, and encourage and reward innovative cost reduction initiatives. 
An Analysis of PBL Effectiveness 1.3.3. 
ASD (L&MR) chartered a study in the fall of 2010 to analyze the impact of PBL on Life Cycle Costs (LCC), as compared to non-PBL sustainment arrangements. The “Proof Point” study6 concluded that, when properly structured7 and executed, PBL arrangements reduce the Services’ cost per unit-of-performance while simultaneously driving up system, subsystem, or component readiness. The study further estimated that an average annual cost savings or avoidance of 5-20 percent is possible for programs with generally sound adherence to the PBL tenets. As with any complex acquisition and/or sustainment strategy, there are certain desired characteristics necessary to drive optimal outcomes. For PBL, these characteristics are commonly referred to as the “tenets” of PBL. In Table 1, the Tenets of PBL are shown. 
Tenets of PBL 
Description 
Tenets Tied to Arrangements 
1. Acquire clearly defined Warfighter-relevant outcomes, not just sustainment services or replacement equipment 
2. Use measurable and manageable metrics that accurately assess the product support provider’s performance against delivery of targeted Warfighter outcomes 
3. Provide significant incentives to the support provider that are tied to the achievement of the outcomes (for aspects of performance that are within their control) 
4. Firm Fixed Price (FFP) contracts are generally the preferred contract type (Fixed Price Incentive Firm (FPIF) and Cost Plus Incentive Fee (CPIF) may be effective) 
5. Provide sufficient contract length for the product support provider to recoup investments on improved product (e.g., Mean Time Between Failure (MTBF) and sustainment processes (e.g., manufacturing capabilities) 
Tenets Tied to Organization 
6. PBL knowledge and resources are maintained for the Government team and product support providers 
7. Leadership champions the effort throughout their organization(s) 
8. Everyone with a vested interest in the outcome is involved 
9. Supply chain activities are aligned to the desired PBL outcome versus disparate internal goals 
10. Risk management is shared between the Government, customer, and support provider 
Table 1: Tenets of PBL8 
6 “Proof Point” PBL Study summary and briefing slides can be found at: https://acc.dau.mil/CommunityBrowser.aspx?id=550259&lang=en-US 
7 “Properly structured” refers to alignment with the PBL tenets 
8Based on original research done by the University of Tennessee for USAF. See Appendix A for additional information.
PBL Guidebook Section 1: Background 
10 
Table 2 and Figure 1 display the empirical findings from the “Proof Point” study, providing compelling evidence of the impact of performance-based sustainment on both cost and performance. 
Empirical Findings 
• Twenty of 21 programs studied experienced performance improvements, including three with very limited adherence to the generally accepted PBL tenets. 
o The 21st program’s declining performance resulted from a part failing more than it was forecast; this situation was unrelated to the PBL arrangement and would have occurred in a non-PBL arrangement as well. 
• Of the 21 programs, 15 had at least moderate9 tenet adherence (where the cost impact was determinable with certainty) and experienced both cost and performance improvements. 
• Three programs with very limited tenet adherence experienced cost increases. 
o None of the three programs were structured to deliver savings. 
Table 2: Empirical Findings 
Figure 1: Proof Point Results 
This empirical evidence provides a compelling case that performance-based sustainment is both a successful and robust strategy. Realizing both cost and performance savings requires a program 
9 Moderate: “of medium quantity, extent, or amount”
PBL Guidebook Section 1: Background 
11 
to achieve only moderate tenet adherence. For the programs with moderate tenet adherence, savings ranged from the low single digits to 27 percent. In general, the stronger the tenet adherence, the greater savings realized. These facts support the estimated 5–20 percent savings (or cost avoidance) range. The empirical evidence also illustrates that calling an arrangement “performance-based” in the absence of at least moderate adherence to the tenets will not guarantee success. 
PBL arrangements also contribute to other cost avoidance effects not quantified in the study’s findings. For example, one program determined that with the higher platform availability of its PBL-maintained aircraft, it could reduce the number of required aircraft, resulting in a 10 percent decrease in procurement costs and a savings of hundreds of millions of dollars. Another program avoided almost a billion-dollar depot facilitation cost through a PBL arrangement by utilizing existing commercial capability versus establishing public sector facilities.10 Another program experienced a dramatic decline in cannibalizations, duplicate ordering, and more expensive transportation modes, as its subsystem availability approached 100 percent after PBL implementation. 
The study—through its quantifiable and nonquantifiable results—demonstrates that performance-based product support strategies contribute to cost savings for DoD when structured and executed properly. There are examples of past PBL arrangements that did not deliver the anticipated cost or availability improvements, but these PBLs were the result of poor execution, rather than an indication of a flaw in the PBL plan. In sum, performance-based product support strategies that are properly managed deliver cost and availability improvements within the DoD environment. 
How Performance-Based Arrangements Work 1.4. 
The PBL strategy works by incentivizing desired outcomes across the product life cycle, from design through sustainment to retirement. Those individuals responsible for designing the system, crafting the strategy, and fulfilling the requirement must have an understanding of the business model and the perspectives of the Warfighter and the provider. 
Under the traditional transactional product support model, where the Government purchases parts or maintenance services from a commercial PSP (Contractor) when a repair is needed, the Contractor is not incentivized to reduce the need for repairs and repair parts. When equipment fails or is overhauled, the provider charges the Services for repair or replacement on a transaction-by-transaction basis. With transactional sustainment, the provider’s revenue and workload increase as equipment failures increase. This model creates a fundamental product support misalignment for DoD; PBL arrangements address this misalignment. When commercial providers are paid for performance, not per transaction, their profits are directly impacted in a negative way by any additional costs they incur in delivering contractual requirements. In a PBL arrangement, a commercial provider is incentivized to reduce both the number of repairs and the cost of the parts and labor used in the repair process. Commercial providers are incentivized to reduce system downtime in PBL arrangements because the contract specifies it or their profit is increased by reducing their cost. 
10 Avoidance of depot facilitation may not be possible if required by 10 USC 2464 Core repair capability
PBL Guidebook Section 1: Background 
12 
Public providers respond to a different set of incentives than commercial industry. While commercial industry is driven by profit, Return on Invested Capital (ROIC), and a guaranteed revenue stream, public providers are driven by increased workload and additional labor at the depots. However, since Program Offices (PO) also like to see a decrease in required repairs (i.e., work), the incentives must be established to satisfy both of these goals. Monetary incentives for shop performance may be used; however, the funds must come from the organic Command as the OEM Product Support Integrator (PSI) is prohibited from bonuses or other monetary incentives to the public PSP as part of a Public Private Partnership (PPP). 
Industry is Driven by Profit, Return on Invested Capital, Long-Term 1.4.1. Revenue Stream, and Risk 
When the PSI or PSP is a commercial business, it is important to understand the factors that influence and motivate its behavior. Industry, accountable to shareholders, competes to provide goods and services in the marketplace, balancing business risks and the potential for profit with providing a sound return on investment to shareholders. Since a strong business relationship is one of the foundational elements of successful performance-based arrangements, it is important to understand how industry works from a corporate and individual perspective. This understanding will facilitate the development of incentives that will best motivate the necessary behaviors for desired performance outcomes. 
As the owners and originators of DoD sustainment arrangements, the Services have significant, often exclusive, control over where the work is performed. It is important to note that transitioning to a PBL arrangement with a commercial business does not automatically result in all work being performed by the commercial provider. Options for where work may be performed when transitioning to a PBL arrangement include, but are not limited to: 
• Work previously performed at a Government activity continues to be performed by Government workers 
• Work previously performed at a Government activity is transitioned to a commercial repair facility 
• Work previously performed in a commercial activity transitions to a Government activity 
• Work previously performed in a commercial activity continues to be performed by the commercial provider 
• The work previously split between a Government and commercial activity is realigned according to the provisions of the PBL arrangement 
As noted above, transitioning to a PBL arrangement can result in the Government making a deliberate decision to award a contract to a commercial provider where touch labor is moved to the commercial provider. It can also result in repair work currently being performed by a commercial provider being transitioned to a Government activity. 
Depending on the circumstances, outsourcing maintenance work to a commercial entity may be the right answer for the Warfighter, military service, taxpayer, and commercial company. Often, however, transitioning work to the commercial PBL provider is not the right answer for the aforementioned entities. Understanding why and when having the commercial PBL provider execute all work may not be the optimal solution requires an understanding of the business goals
PBL Guidebook Section 1: Background 
13 
commercial firms attempt to optimize. Table 3 below highlights three key goals commercial businesses are driven to optimize. 
Business Goals Commercial Firms Attempt to Optimize 
Profit: The mandate for companies in capitalist economies is to make a profit for its owners (shareholders). 
Assured Revenue Streams: In the commercial Aerospace and Defense industry, Wall Street and money markets reward companies with steadily growing or steady revenue over companies with greater variability of revenue, and therefore, greater uncertainty. 
Return on Invested Capital (ROIC): A key measure of a commercial firm’s success is the efficiency with which it converts shareholder assets into profit. The fewer capital assets required to generate a given level of profit, the better the ROIC. 
Table 3: Commercial Firms’ Business Goals 
Understanding that profit and ROIC are core industry behavior drivers is key to understanding where businesses prefer repair work be performed. 
Companies optimize their profits by having maintenance and repair work performed where they can get the required level of product quality at the lowest cost. Sometimes quality work can most profitably be performed in the commercial providers’ plants. Sometimes quality work can be most profitably performed in Government activities where labor costs are lower than industry plants. In these cases, the industry PBL providers, through PPP arrangements, outsource touch labor back to the Service. 
With respect to ROIC, PPPs also provide industry an opportunity to use Government facilities thereby avoiding the capital investments (i.e., infrastructure) required to perform some or all of the touch labor. PPPs can facilitate higher ROICs for the commercial providers and cause them to leave work in a Government facility or move work performed in a commercial plant into a Government activity. Government benefits from these PPPs because they gain access to industry processes, equipment, and sources of supply, which improves both their capability and capacity. 
It is essential that commercial PSIs and PSPs retain the opportunity to realize profitability commensurate with the risks embedded in fixed price-type contracts. These efforts often demand up-front financial investments in reliability, maintainability, and repair process improvements. The commercial PSP needs an appropriate base Period of Performance (PoP) in order to recoup its investment (this will be discussed further in step 10). The magnitude of investment — and consequently, the appropriate PoP — depends upon the scope and complexity of the individual program, as well as the operational environment of the weapon system. Many PBL contracts are implemented on systems, subsystems, or components experiencing declining performance, decreased availability, and/or rising sustainment costs. These trends require proactive action and time to identify, correct, and reverse. A PSI or PSP will assume cost and performance risks to accomplish these objectives, and they may need multiple years to recoup these investments.
PBL Guidebook Section 1: Background 
14 
Both organic and commercial providers are driven primarily by the mandate to optimize the long-term health of the organization. Commercial providers often strive to optimize long-term revenue and profits; while the organic provider is often motivated to retain workload, capitalize on existing Government infrastructure, and utilize and build upon resident expertise. A long-term arrangement offers industry the certainty and confidence to invest in the system to achieve future savings and offers the organic PSP a business case to invest in infrastructure and workforce improvements. Opportunities that provide stable revenue streams and consistent workloads are viewed as attractive to both commercial and organic organizations, even though the motivations and benefits may differ. From industry’s point of view, profit targets in a business arrangement are directly related to the level of risk. Business risks take various forms, including technical and financial risks, and incentives that mitigate these risks are appealing. Incentive types include: longer contract lengths that provide time for the PSI/PSP to recoup investments; targeted financial incentives (such as fees) tied to specific, achievable performance outcomes; and optimal award term periods linked to performance. 
PBL arrangements are not limited to fixed price-type contracts. Successful PBL plans have been implemented with CPIF contracts, which may be the more appropriate arrangement when the risk cannot be reasonably quantified or the cost of transferring risk to the PSI or PSP is more than the Government will accept. It is important to note that with cost plus-type arrangements, there is no inherent incentive for the provider to lower their costs since all of their costs are covered and lowering them has no impact on profit. Organic PBLs need to implement Memorandums of Agreement (MOAs) that incorporate appropriate incentives and metrics. The key to successful PBLs is using incentives to elicit desired behavior and outcomes from the PSI/PSP, in spite of the guaranteed cost reimbursement. 
Performance-based arrangements provide industry the flexibility to determine how to deliver quality service and performance outcomes for their Government counterparts with an acceptable level of profit and risk. In the context of PBL arrangements, industry will ‘compete’ within their own organization in order to cut costs and increase profit, and will typically do so by: 
• Optimizing processes, thereby reducing inefficiency and the associated costs to satisfy a logistics demand 
• Improving the quality of the product (e.g., reliability), thereby reducing overall demand and the cost to deliver the desired performance 
Both approaches can result in reduced cost of support and savings to DoD and increased profits to the provider. 
Aligning the Interests of Government and Industry 1.5. 
Because of the nature of the market for weapons systems, both the suppliers and the customers are vulnerable to each other. The contractors depend on the DoD for a substantial portion of their business, while the DoD depends on this specialized group of industry providers (weapons, telecommunications, information, etc.) to support the Warfighters. This relationship is simultaneously cooperative and adversarial. Performance-based product support is successful in this environment because it aligns the interests of the Contractor and the Government, creating
PBL Guidebook Section 1: Background 
15 
‘internal competition11’ that ultimately saves money for the taxpayer while focusing on support to the Warfighters. The Government’s interest is to procure quality products and services at a fair and reasonable price, while industry is primarily interested in meeting its fiduciary responsibility to shareholders by maximizing profits. In the end, when structured and executed properly, performance-based product support arrangements (PSA) deliver increased or equivalent levels of availability to the Warfighter at lower cost per unit of performance (e.g., cost/operating hour). Further, at contract renewal, a new-cost basis is used to further reduce the cost to the Government, allowing the Government to benefit from the improvements made by the PSI or PSP in product and process. The PSI and PSP benefit by keeping the increased profits (either in whole or part) that come from lowering their cost to deliver. The PSI/PSP also benefits by stabilizing their revenue stream with longer-term arrangements and by leveraging Government facilities/work force versus their own invested capital. 
Product Support Business Model and PBL: An Enabling Function across a 1.6. Program/Product Life Cycle 
As stated in the PSM Guidebook, “the PM is assigned Life Cycle Management responsibility and is accountable for the implementation, management, and oversight of all activities associated with development, production, sustainment, and disposal of a system across its life cycle. The PM has the responsibility to develop an appropriate sustainment strategy to achieve effective and affordable operational readiness consistent with the Warfighter resources allocated to that objective.” PBL is a strategy for the PM to affordably and effectively satisfy Warfighter requirements (e.g., reliability, availability) and reduce Operating and Support (O&S) cost. Congress12 directed a PSM be assigned to each major weapon system to assist the PM with this responsibility. The PSM, a key leadership position in the PO, leads the development, implementation, and top-level integration and management of all sources of support to meet Warfighter sustainment and readiness requirements. 
The Product Support Business Model (PSBM) was developed to assist the PM and PSM, who must be tightly aligned, with the numerous supportability considerations and trade-offs that take place during the development and fielding of a weapon system. The PSBM defines the hierarchical framework and methodology through which the planning, development, implementation, management, and execution of product support for a weapon system component, subsystem, or platform will be accomplished over the life cycle. The model seeks to balance weapon system availability with the most affordable and predictable total ownership cost. Performance-based product support is a mechanism for accomplishing this task in a manner that shares performance risk between the Government and commercial product support provider(s). A properly designed PBL arrangement will align the provider’s and Government’s goals through the proper application of incentives. In Figure 2, the PSBM shows that alignment. 
11 “Internal Competition” refers to a company being motivated to improve their product quality (reliability) and the efficiency of their processes to increase their profit. This is the same type of pressure that comes from external competition in the marketplace. 
12 10 U.S.C. § 2337
PBL Guidebook Section 1: Background 
16 
Figure 2: Product Support Business Model 
Decisions made during the development phases impact the ability to execute PBL arrangements after fielding. During the development phases, there are two main product support considerations for the PM/PSM along with the Systems Engineer: 1) influence the design for supportability and 2) design and develop the support system. The optimal approach is to include supportability and life cycle cost considerations at program inception (or before). This inclusion ensures that the attributes of the weapon system have been designed to minimize the need for logistics resources, reducing O&S costs. It also ensures that the acquisition strategy and the Life Cycle Sustainment Plan (LCSP) will address the technical and product support data needed to promote competition and other sources of supply during sustainment, keeping a downward pressure on the cost of support. For instance, sustainment managers implementing repair contracts for weapon system components should collaborate with all applicable stakeholders to incorporate the arrangement into the Weapon Systems LCSP (to include common and unique components). 
A notional Generic Subsystem (GSS) is discussed throughout the Guidebook to allow the reader to conceptually apply the detailed steps of developing and implementing a PBL arrangement. The developmental GSS (pre-milestone C) considerations differ from those of the fielded GSS (post-milestone C); thus, considerations for both types of GSS will be discussed in Section Two. In Figure 3, the product life cycle and the developmental and fielded GSS scenarios are shown.
PBL Guidebook Section 1: Background 
17 
Figure 3: Program/Product Life Cycle and GSS 
Figure 3 depicts a hardware intensive program, as captured in Model 1 of DoDI 5000.02. This is the classic model that has existed in some form in all previous editions of instruction and is the starting point for most military weapon systems. For software-intensive or accelerated programs, Hybrid Model A or Models 2-4 may be more appropriate, and the phasing of the activities discussed below will need to be tailored appropriately. 
Materiel Solution Analysis 1.6.1. 
The Materiel Solution Analysis phase provides the first significant opportunity to influence the supportability and affordability of weapon systems by balancing Warfighter requirements and desired operational capabilities with support and cost considerations. The Analysis of Alternatives (AoA) is completed at this time, which includes a comparison of the life cycle support approaches and costs. Suitability attributes (reflected in metrics such as Materiel Availability, Reliability, O&S cost, and other sustainment metrics) that are required to support the Warfighter should be evaluated in requirements trade-offs, along with performance characteristics (such as speed, range, and lethality for hardware and speed, agility and scalability for software). A failure to do so can result in a solution that creates unaffordable demands for resources during operations and sustainment. In Table 4, the key considerations that support performance-based solutions are highlighted. 
20 to 50+ years
PBL Guidebook Section 1: Background 
18 
Key Considerations That Support PBL Strategies and Arrangements 
• Work with the Warfighter to establish sustainment requirements that are specific and measurable at program initiation. 
• Identify and quantify O&S cost and readiness drivers early, and pursue opportunities to mitigate via system design and sustainment alternatives. 
• Influence design for reliability, maintainability, prognostics and diagnostics, and special requirements for hardware (e.g., corrosion control), plus modularity, reusability, and testability for software. 
• Promote standardized (common) systems, components, spare parts, and support equipment. This enables the greatest flexibility and competition for PBL arrangements in sustainment. 
• Produce a product support intellectual property strategy, including ownership needs as part of the acquisition strategy being developed for a Milestone A decision. This enables multiple provider and system/subsystem options for PBL. 
• Promote standard and stable manufacturing/factory floor processes that could be used in the depot, as well as production activities. 
• Promote structured, consistent processes for software development and sustainment activities based on standard maturity models. This enables the greatest flexibility and competition for PBL support solutions. 
• Ensure the broad product support strategy requirements are aligned with the Warfighter’s requirements. 
• Search within and outside of Service for existing support solutions that will satisfy Warfighter requirements and reduce support costs. 
Table 4: PBL Key Considerations13 
Technology Maturation and Risk Reduction 1.6.2. 
During the Technology Maturation and Risk Reduction phase, supportability design features (e.g., reliability, maintainability) are incorporated in the overall design specifications, as reflected in the system requirements review (SRR) and preliminary design review (PDR). This phase is critical for establishing the life cycle costs of the program. Maintenance and logistics support planning are coordinated with design (levels of maintenance, repair skills, support equipment, etc.). Suitability (supportability) attributes should be incorporated and reflected in the support system designs, including Low Observable (LO) maintenance, ease of removing and replacing components, and other human/systems interface considerations. The Reliability, Availability, and Maintainability Cost (RAM-C) rationale approach is integrated within the systems engineering process. Continued analysis refines the conceptual support strategies that were previously developed into an integrated preliminary product support solution. Core and other depot requirements are determined and included in the support solution. Lastly, the Intellectual Property (IP) required to implement a PBL strategy should be identified and included in the system’s IP strategy (as a part of the overall acquisition strategy). 
13 Compilation from OSD Guidance, DAU learning aids and Subject Matter Experts input
PBL Guidebook Section 1: Background 
19 
In sum, technical, cost, and schedule risks associated with hardware and software development must be managed throughout the program’s life cycle and will be an important topic at all decision points and milestones. 
Engineering and Manufacturing Development 1.6.3. 
Engineering and Manufacturing Development (EMD) completes all needed hardware and software detailed design, systemically retires or mitigates any open risks, builds and tests prototypes or first articles to verify compliance with capability requirements, and prepares for production or deployment. This phase includes the establishment of the initial product baseline for all configuration items. One of the PM/PSM’s objectives in the EMD phase is ensuring the program develops an integrated product support (IPS) solution that meets readiness requirements, Materiel Availability (AM) and Materiel Reliability (RM), while taking advantage of Should Cost14 opportunities to reduce projected O&S costs. Trade-offs between supportability and other design constraints (weight, size, bandwidth, etc.) result in maturing design within the budget and schedule. The product support models used for inventory planning, manpower planning, training, planning, etc., are updated with actual versus estimated data as it becomes available during this phase of development. Reliability growth success/issues are assessed and adjustments to the product support solution are made to accommodate projected demand for logistics resources. It is critical to have robust testing to ensure reliability requirements are being met. As the design matures, the trade space for sustainment solutions narrows and the sustainment strategy becomes more refined. For this reason, it is extremely important to consider future PBLs during weapon system development. PBL considerations should be part of the Production/Quality Assurance (QA) process since repair processes (included in the PBL) are impacted by production build decisions. 
Production and Deployment 1.6.4. 
During Operational Test and Evaluation (OT&E)/Production (Low-Rate Initial Production (LRIP) and Full-Rate Production (FRP))/Deployment phases, issues identified through various tests, demonstrations, and other evaluation techniques are addressed and remediation plans are executed. LRIP for MAIS programs and other software systems is typically limited deployment or limited fielding. As products are fielded and logistics demand can be reasonably forecasted, performance-based arrangements can be implemented. Early in this phase, shorter-term cost-type arrangements may be appropriate until sufficient cost data and technical data on failure modes and rates and field reliability data are accumulated in conjunction with design stability. Later arrangements may use a combination of fixed-price contracts with incentives and other considerations as design matures, tailoring the contract type to the appropriate level of design maturity and stability. Longer-term fixed price-type arrangements that incentivize continuous process and product improvement at a reduced cost are appropriate with a reasonable ability to forecast demand, and assess risk and cost impacts. PPPs are an excellent way to leverage the best of Government and commercial expertise. The commercial PSI or PSP provides lean repair processes, a responsive supply chain for bit/piece parts, and sustaining engineering. The public sector provides a skilled workforce at very competitive labor rates and repair and transportation assets. Once fielded, the performance-based solution and associated arrangements are measured against their ability to meet planned AM, RM, O&S cost, and other sustainment metrics required to support the Warfighter. 
14 Discussion of “Should Cost” can be found in Better Buying Power 2.0 at http://bbp.dau.mil/bbp2focus.html
PBL Guidebook Section 1: Background 
20 
Operations and Support 1.6.5. 
The Operations and Support phase of a system or product life cycle is the longest phase of the life cycle and generates the largest portion of LCC—approximately 60–75 percent depending on the weapon system category—even though the ability to influence LCC is reduced at this point. The ability to implement and execute performance-based arrangements provides the greatest opportunity to positively impact LCCs while satisfying Warfighter requirements. 
Software support considerations are uniquely different that those of hardware support.15 Hardware support activities are typically dominated by preventive and corrective maintenance. When software fails, the software engineer does not replace the offending code with an identical piece of code, but rather must modify the code to provide the needed functionality. Software modification is undertaken to defect corrections, address policy or doctrine, ensure safety, enable interoperability, reflect hardware changes, accommodate technology insertion, and incorporate functional changes. While hardware improvements are incorporated for these reasons as well, as stated above, they do not represent the routine reason for repair. 
Software support costs include the update, maintenance and modification, integration, and configuration management of software. The respective costs of operating and maintaining the Software Support Environment (SSE) (the associated computer/peripheral equipment and associated software dedicated to performing software maintenance) and the cost to conduct all testing of the software are also be included. Other costs may include licensing fees for commercial software and accreditation of processes and facilities. 
The identification and establishment of Software Support Activity (SSA) is often the first step in the preparation of post-production software support. The SSA typically assumes the role of providing post-deployment life cycle support for modifications or upgrades made to a system’s software following the system’s initial fielding. The SSA can be an organic or commercial activity or a mixture of both, and is often established via performance-based arrangements. 
Table 5 displays circumstances where PBL arrangements should be considered. 
PBL arrangement(s) should be considered under the following circumstances: 
Issue: System availability or derivative subrequirement for subsystem or component is consistently below the required threshold 
Opportunity: Part demand and/or labor hour requirements have achieved a level of predictability post-fielding that supports consistency of pricing in the market of potential product support providers 
Opportunity: Number of potential product support providers is sufficiently large to serve as a competitive market, or leverage16 exists to structure internal competitive pressure in a limited or sole-source situation 
15 NAVAIR Software Logistics Primer Version 1.0 DTD August 2008 (https://acc.dau.mil/CommunityBrowser.aspx?id=203465) 
16 The government is often in a position to structure the terms of an arrangement to increase product quality and process efficiency even in the absence of a competitive marketplace
PBL Guidebook Section 1: Background 
21 
Opportunity: Sufficient operational life remains (typically five to seven years) in the product as an attractive capital investment opportunity for potential providers 
Opportunity: Common subsystems or components among platforms and/or Services that, when combined, improve the Government’s negotiating leverage and offer industry the opportunity to benefit from scale economies 
Opportunity: Actual sustainment costs exceed programed resources, life cycle cost estimates, or should cost management efforts indicate an opportunity to lower the cost of required performance 
Table 5: When to Pursue a Change in Product Support Strategy 
Product support solution performance is continuously monitored by the PSM during the Operations and Support phase, and provider performance is measured with metrics commensurate with the delegated responsibility. Technical and product data delivered as part of the product support solution facilitate this process and provide the PM/PSM the opportunity to reallocate resources and/or recompete aspects of the support solution as appropriate.
PBL Guidebook Section 2: Standard and Repeatable Processes for PBL 
22 
2. Standard and Repeatable Processes (S&RP) for PBL 
A gap identified by DoD through the course of the OSD-chartered PBL study (Proof Point) was the need for standardized repeatable processes to facilitate effective performance-based PSAs. The processes and procedures described herein are intended to fill that gap. Users are reminded that PBL arrangements are not “one size fits all,” and the development processes should be tailored to the specific needs of their program as appropriate. This document will assist the Program Office in the creation, management, renegotiation, and/or resolicitation of performance- based arrangements, realizing that this process may involve more rigor than current transactional arrangements. 
The S&RP follows the 12-Step Product Support Strategy Process Model found in the PSM Guidebook. The PBL Guidebook provides complementary information on specific activities within each of the existing 12-Step processes and focuses on the “how” regarding PBL arrangement development and execution. The 12-Step model is a repeatable process that facilitates the successful accomplishment of these activities. The model should not be seen as rigid, but instead as flexible to support the unique needs of individual programs. The steps may be performed in a different order, or they may be repeated or deleted depending on the life cycle phase and program requirements. Figure 4 illustrates the 12-Step Product Support Strategy Process Model. This model provides the framework for the S&RP. 
Figure 4. The DoD Product Support Strategy Process Model17 
17 PSM Guidebook (April, 2011)
PBL Guidebook Section 2: Standard and Repeatable Processes for PBL 
23 
Throughout this section, a notional Generic Subsystem (GSS) is used to illustrate in practical terms the content of the preceding associated step. In the GSS use case, the PBL strategy is being considered after fielding, which is a common practice. However, guidance on developing PBL strategies during the development phase(s) of a program is also addressed throughout the document (See blue “Developmental System Consideration” boxes at the end of each step). While consideration of PBL arrangements throughout the life cycle is appropriate, consideration early in development provides the program with the greatest latitude to achieve the required performance at lower cost during sustainment.
PBL Guidebook Section 2: Step 1 Integrate Warfighter Requirements & Support 
24 
Step 1. Integrate Warfighter Requirements & Support 2.1. 
Introduction 2.1.1. 
When considering a sustainment strategy, the Program Office team (for Major Defense Acquisition Programs (MDAP) and Major Automated Information Systems (MAIS) should always start in the same place: identifying Warfighter requirements. The objective of product support is to execute a sustainment strategy that delivers affordable readiness, defined as providing mission capability to the Warfighter at the lowest possible cost to the taxpayer. The first step in developing a product support strategy is to identify the operational requirements for the system being supported— even if the PSM is considering a PBL at the subsystem or component level that utilizes a decomposition of AM or AO as the assigned metric. 
Step 1 is particularly important when structuring a performance-based logistics arrangement, as the outcome will be derived from Warfighter requirements. In order to properly align the objectives of the PO and the PSI and PSP, it is crucial to understand the Warfighter’s requirements for system performance. In most cases, the Warfighter’s requirement will be some form of availability and reliability allocated by the program to the system, subsystem, or component level. 
The Joint Requirements Oversight Council (JROC) requires a sustainment Key Performance Parameter (KPP) for all Acquisition Category (ACAT) I and select ACAT II programs. The Sustainment KPP consists of two elements: AM and AO. JROC also requires two sustainment Key System Attributes: Reliability and O&S Cost. More information is available in the Joint Capabilities Integration Development System (JCIDS) Manual and the Defense Acquisition Guidebook. Table 6 lists the life cycle sustainment requirements. 
Key Life Cycle Sustainment Requirements 
Sustainment Key Performance Parameter (KPP) 
Materiel Availability (AM) 
AM is the measure of the percentage of the total inventory of a system operationally capable, based on materiel condition, to perform an assigned mission. This can be expressed as the number of operationally available end items/total population. This metric is not applicable to nonmateriel solutions.18 
Operational 
Availability (AO) 
AO is the measure of the percentage of time that a system or group of systems within a unit are operationally capable to perform an assigned mission and can be expressed as uptime/(uptime + downtime). 
Sustainment Key System Attributes (KSA) 
Reliability 
RM is a measure of the probability that the system will perform without failure over a specific interval, under specified conditions. More than one reliability metric may be specified for a system as appropriate. 
18 A Nonmateriel Solution changes doctrine, organization, training, materiel, leadership and education, personnel, facilities, or policy (including all human systems integration domains) to satisfy identified functional capabilities. The materiel portion is restricted to commercial or nondevelopmental items, which may be purchased commercially, or by purchasing more systems from an existing materiel program.
PBL Guidebook Section 2: Step 1 Integrate Warfighter Requirements & Support 
25 
Operating& Support (O&S) Cost 
Total O&S costs associated with achieving AM. 
Table 6: JCIDS Sustainment Requirements 
How is AM related to AO? As shown in Figure 5, AO is typically a subset of AM. AO is measured as a snapshot, the number of assets that are mission capable assigned to a unit at a given point in time; while AM reflects the total inventory of a system at a given point in time from placement into operational service through the planned end-of-service life. AM is typically the appropriate metric for expressing the Warfighter’s product support requirements. 
Figure 5: Relationship between AO and AM 
Process 2.1.2. 
As stated in the interim version of DoDI 5000.02 (2013), “the Program Manager will deploy the product support package and monitor its performance according to the Life Cycle Sustainment Plan (LCSP)…a successful program meets the sustainment performance requirements, remains affordable, and continues to seek cost reductions by applying “should cost” management and other techniques…doing so requires close coordination with the war fighting sponsor (i.e., user), resource sponsors, and materiel enterprise stake holders, along with effective management of support arrangements and contracts.” The PM/PSM is responsible for communicating the Warfighter requirements to the PSI/PSPs and determining the appropriate method for allocating the requirements in PBL arrangements. 
Warfighter requirements are set by the operational commands or Service requirements offices through the JCIDS process and formalized in the JCDIS requirements documents. How the PM will address them may be further articulated in the arrangmeent between the PM and the Warfighter command(s). If the sustainment objective for the platform or end item has not already been explicitly documented, the platform-level PSM should work with the Warfighter to establish an arrangement that designates the top-level sustainment outcome and supporting metrics as appropriate.
PBL Guidebook Section 2: Step 1 Integrate Warfighter Requirements & Support 
26 
The requirements and associated metrics should be defined during the Material Solution Analysis (MSA) phase and ultimately documented in the Capability Development Document (CDD). The PM, with the service requirements officer, may negotiate revisions to the requirements as the system design and sustainment strategy matures. An Integrated Data Environment (IDE) is a useful tool in tracking and managing requirements as the program design evolves. The PM and PSM should review and revalidate the requirements and threshold values with the operational commands to identify the threshold value for this metric (e.g., AM of 85%). Revalidation is particularly important when test data and operational performance data become available. 
Conclusion 2.1.3. 
The PM/PSM should coordinate with Warfighter representatives to ensure product support requirements are identified/documented and threshold values are established/updated. 
Identifying Warfighter requirements is the first step toward establishing a PBL arrangement. Many PBL arrangements are executed at the subsystem or component level, and the system-level requirement should be decomposed to lower-level metrics appropriate for the level of responsibility and risk assigned to the PSI and PSP. These are the metrics that will be included in the PBL arrangement and the outcomes of these arrangements must be linked to the overall system-level requirements. 
Concepts in Action: GSS Use Case 2.1.4. 
The PM for GSS has decided to investigate if a PBL arrangement may help in achieving the sustainment strategy for the subsystem. After reviewing the material in Section 1, the PM is ready to proceed with the first step: identifying Warfighter requirements. 
The GSS is installed on a larger platform, and the sustainment requirements for the GSS are derived from the operational requirements for this platform. The platform has an Operational Availability (AO) target of 90%, as determined by the units for the platform. Based on the failure rates of the GSS and the size of the inventory, the PSM has calculated that the AM requirement for the GSS is 85%. The current inventory of complete GSS assemblies exceeds the fleet size of the platform end item. As long as 85% of the inventory is operationally capable, the system-level AO target of 90% can be met. In addition, the GSS is on average responsible for less than one percent of the Non-Mission Capable (NMC) end items. If the GSS were a significant readiness driver for the end item, the PSM may have considered a higher AM target. It is sometimes difficult to link the availability requirements for an individual subsystem to the platform-level requirements, but with the right data (i.e., data that indicate how the subsystem is impacting system availability) and in cooperation with the platform-level PSM (if different from the subsystem PSM), these metrics can be derived. 
Step 1: Developmental System Considerations 
For pre-production systems, the sustainment requirements are defined during the Material Solution Analysis (MSA) phase and ultimately documented in the Capability Development Document. It is important that the sustainment strategy is carefully examined, and the design and contract needs are specified before Milestone B to preserve the greatest latitude after Milestone C. Among the areas requiring close review are the intellectual property strategy, cost/reliability trade-offs, performance, obsolescence, and logistics footprint. The Government’s options for commercial competition and stand-up of organic capability is contingent upon securing the relevant technical data, license agreements, software documentation, software, and any other applicable intellectual property.
PBL Guidebook Section 2: Step 2 Form the Product Support Management IPT 
27 
Step 2. Form the Product Support Management IPT 2.2. 
Introduction 2.2.1. 
The second step of the 12-Step process is for the PSM to leverage the subject matter expertise within the PO, supplemented by PBL experts in the supply chain and user organizations, to form a Product Support Management IPT (PSMIPT). The PSMIPT is a collaborative working body comprising key program staff and stakeholders whose purpose is to develop a product support solution. The PSM is responsible to the PM for the management and oversight of life cycle product support for the materiel system and software, and the PSM must establish and lead the PSMIPT to ensure its collective input, expertise, and support are leveraged to address the multitude of required supportability tasks. There are various disciplines represented within the PSMIPT, including Life Cycle Logistics, Engineering, Finance, Contracting, Legal, and individuals from other functional groups specific to the program and life cycle needs. For software intensive programs, it is critical to embed software representatives early in the program to ensure software-unique management issues are addressed. 
Representatives of the PSMIPT will collaborate to deliver an integrated, affordable product support package that includes appropriate arrangements, both organic and commercial. The PSM maintains the PSMIPT throughout the program life cycle, as this body will be tasked with supporting the PSM in defining, developing, and implementing the product support strategy. The PSMIPT will also support the PM and PSM in preparing for milestone reviews and Independent Logistics Assessments (ILA). PSMs should ensure that members possess appropriate PBL expertise to help maximize opportunities for performance-based arrangements in the program’s support strategy. 
Process 2.2.2. 
The PSMIPT is led by the PSM and should include all appropriate stakeholders, including Warfighter representatives. The team may consist of both Government and commercial functional experts. It is crucial that all members are able to work collaboratively, regardless of their organizational alignment or sustainment preferences and objectives. The core PSMIPT members are responsible for assisting the PSM with planning, developing, and implementing the product support strategy, and overseeing the product support performance. Additional stakeholders and subject matter experts (SME) involved in sustainment will be consulted as their expertise is required. In Figure 6, a typical PSMIPT is shown, with the suggested core team outlined in blue.
PBL Guidebook Section 2: Step 2 Form the Product Support Management IPT 
28 
Figure 6. Product Support Management IPT19 
The composition of a structured PSMIPT drives the success of pre-execution efforts such as the issuance of contracts with industry or establishment of intragovernmental Memorandums of Understanding (MOU) or MOA. The team also ensures the proper transition into ongoing performance management activities. After the PSMIPT is assembled, the members should determine their goals, develop Plans of Action and Milestones (POA&M), and obtain adequate resources. 
Adequate funding can be among the most challenging issues the PSMIPT must manage when implementing a PBL arrangement. A best practice that can mitigate funding constraints to PBL implementation is for the PSMIPT to include representatives from the Service resource sponsor and the materiel command responsible for managing Operations and Maintenance (O&M) funding for the fielded system. These representatives can inform the team on planning factors driving the choice of funding mechanism (e.g., direct appropriation, working capital fund) and appropriation type (e.g., Procurement, O&M). 
19 PSM Guidebook (April, 2011) section 4 
PBL Leading Practice(s) 
Leverage PBL expertise and lessons learned from other Program Offices with similar systems, PBL Award Winners, and PBL SMEs within DoD.
PBL Guidebook Section 2: Step 2 Form the Product Support Management IPT 
29 
The PSM should develop a PSMIPT charter, which outlines the activities, roles, responsibilities, key deliverables, initial implementation project plan, and an executive summary review schedule. The charter should also include the names, contact information, alternates, and expected time commitments from the participants. See Appendix B for a sample PSMIPT charter. The PSMIPT should be included among the management groups listed in the LCSP. Table 7 lists the principles for establishing the PSMIPT. 
PSMIPT Principles 
• When establishing the PSMIPT, the PSM should: 
o Streamline the membership to include only relevant stakeholders and SMEs. Add or remove members as necessary to ensure the right mix of expertise is available and utilized when needed. 
o Ensure the team members have a life-cycle perspective of cost, risk, and benefits. 
o Facilitate buy-in from all team members by soliciting open and honest communication and developing trust and mutual respect among members. 
o Ensure that Non-Disclosure Agreements (NDA) are in place for any contracted advisory assistance that will be part of the IPT. NDAs are particularly important when the program expects the OEM or other vendors to provide proprietary data. 
• The team should focus on life-cycle management, involving sustainment in all aspects of the product life cycle. This includes recommending potential design changes that facilitate application of PBL strategies to meet requirements and reduce costs. 
Table 7: PSMIPT Principles 
Throughout each of the 12 steps, the PSMIPT should periodically review the status and risks in developing the LCSP and associated arrangement. Summaries of these reviews should be used to inform the PSM and brief the PM on the IPT’s progress. Detailed discussion on required expertise and training for the team is provided in Appendix C. 
Conclusion 2.2.3. 
The result of Step 2 should be a cohesive product support team that is fully trained on PBL fundamentals and has a thorough understanding of the benefits associated with an outcome-based product support strategy. 
Concepts in Action: GSS Use Case 2.2.4. 
The PSM for the GSS assembled the PSMIPT with the representatives listed in Figure 6, including a representative from a program who successfully implemented a PBL arrangement on a similar subsystem arrangement. The PSM conducted a baseline survey (see example in Appendix C) to determine the experience level of each team member. Only one team member had previously implemented a PBL arrangement. Some members had taken 
Step 2: Developmental System Considerations 
The PM/PSM should engage engineering and sustainment SMEs who can estimate the impact of sustainment cost and performance. The team might use system modeling/simulation or an evaluation of similar deployed systems to estimate the performance and cost of the system when it reaches sustainment. A thorough evaluation of the impact of engineering design trade-offs on the sustainment strategy will inform the PSMIPT regarding the magnitude of constraints it will face in developing PBL arrangements.
PBL Guidebook Section 2: Step 2 Form the Product Support Management IPT 
30 
DAU’s course on performance-based logistics (LOG 235). The PSM encouraged the team members to read OSD guidance and the DoD Business Case Analysis (BCA) Guidebook in preparation for the knowledge transfer workshop. The PSM hosted a kickoff session for all of the PSMIPT members where the objectives, timeline, roles, and responsibilities for the PBL implementation were outlined.
PBL Guidebook Section 2: Step 3 Baseline the System 
31 
Step 3. Baseline the System 2.3. 
Introduction 2.3.1. 
This step assesses the “As-Is” product support strategy, plan, and arrangements and determines if further analysis is warranted to change the plan from its current baseline. The “As-Is” analysis identifies possible impediments and improvement opportunities. This step is conducted in three phases: data gathering, data review and analysis, and recommendation generation. 
This step is intended to be a quick assessment designed to give the program insight as to whether an alternative performance-based strategy is feasible and if more detailed analysis should be conducted. Part of this step will include evaluating data in the Product Support Package. This assessment provides sufficient decision-making information to determine if an investment in more detailed analysis is warranted. 
For a new system, establishing an initial baseline requires engineering and supportability data. The initial baseline should be established at Milestone A; however, this may only be possible at a higher level of the hardware or software description. The program’s confidence in the assessment is limited by its ability to allocate performance measures lower than major subsystems (e.g., structure, propulsion, and mission equipment). During the earlier life cycle phases, analogous data from similar systems are required to project the system’s baseline. As the program advances to later milestones, additional data will be available from systems engineering and product support analyses (e.g., the Reliability, Maintainability, and Diagnostics predictions, Failure Mode, Effects & Criticality Analysis (FMECA), Failure Reporting and Corrective Action System (FRACAS), Level of Repair Analysis (LORA), Maintenance Task Analysis (MTA), Reliability-Centered Maintenance (RCM) analysis, and Reliability, Availability, and Maintainability (RAM) and LCC analyses). 
For fielded systems, this step begins with the inventory of assets and services that will be considered among the PBL arrangement alternatives. The PSMIPT should scope the diagnostic to an appropriate level (system, subsystem, components), potentially spanning multiple programs or even Services. The PSMIPT should also consider the product support elements that should be included in the alternatives. 
This step produces a recommendation for continued analysis based upon the feasibility of, and the potential benefit from, a change in strategy. Additionally, this recommendation will include whether a system, subsystem, or component-level PBL arrangement is most appropriate. If the result of the diagnostic indicates that an alternative strategy with performance-based arrangement(s) can maintain or improve performance, and 
PBL Leading Practice 
If a program is in development, data availability will evolve as the platform progresses through its life cycle and should be given appropriate attention when available. This process includes replacing estimates with actual data or refining estimates that resulted from test and operational experiences. 
PBL Leading Practice(s) 
Potential PBL arrangement candidates for fielded programs may have the following characteristics: legacy systems with poor reliability, system availability, obsolescence issues, and increasing repair costs.
PBL Guidebook Section 2: Step 3 Baseline the System 
32 
reduce costs for the program, a decision to proceed with more detailed analysis (if needed) to evaluate performance-based alternatives will be made by the PM. 
Process 2.3.2. 
The PSMIPT, along with the representatives of the materiel command as appropriate, should consider the questions in Table 8. The answers to these questions will provide the team with an initial understanding of the opportunities for improvement to the baseline. 
Factors 
Initial questions that inform potential benefit 
Cost 
• How many systems, subsystems, or components under consideration are in the system (e.g., 256 F117 engines inducted per year)? 
• What will it cost to field new infrastructure (organic or commercial) or to modify the current infrastructure? 
• How much does the system cost (specifically the replacement cost of the system or subsystem)? 
• What is the projected annual spending to support the system (i.e., does the annual spend support time required to analyze alternatives)? 
• Is the number of potential product support providers sufficient to serve as a competitive market, or does leverage exist to structure internal competitive pressure in a limited or sole-source situation? 
• Have part demand and/or labor hour requirements achieved a level of predictability post-fielding that support consistency of pricing in the market of potential product support providers? 
• Are there common subsystems or components among platforms and/or Services that, when combined, improve the Government’s negotiating leverage and offer industry the opportunity to benefit from scale economies? 
• Is there an opportunity to lower the sustainment cost to achieve the required operational performance? 
Readiness 
• Is the system availability or the derivative requirement for subsystem or component consistently below or projected to be below the required threshold? 
• How are the systems, subsystems, or components in question being supported today? 
Other factors 
• Is there sufficient operational life remaining (typically five to seven years) in the product to warrant a change to the support solution and be an attractive investment opportunity for potential providers? 
• Are there any planned upgrades, service life extension programs, or overhauls? 
• How is the PO organized? Where do logistics, maintenance, finance, and contracting competencies fit within the PO? 
Table 8: Initial Questions for Cost, Readiness, and Other Factors 
Phase 1: Data Gathering 2.3.2.1. 
Data gathering begins with the development of a data collection plan. The data collection plan lists the needed information. The information gathered will help the team understand the current
PBL Guidebook Section 2: Step 3 Baseline the System 
33 
system readiness and the overall product support strategy to provide a foundation for analysis. This phase includes interviews with appropriate stakeholders and an analysis of the product support policy and other supporting documentation. The plan does not have to be elaborate or complex, but should be comprehensive. The complexity will be dependent on the program, including its life cycle stage. It can be as simple as a two-page outline. The data collection plan should include the data source to establish accountability and improve the accuracy and the traceability of the data collected for any necessary follow ups. 
The PSMIPT should ensure that the data is accurate, timely, and relevant to the Alternatives being assessed. The data collection plan should categorize the needed data using the following priorities: 
The team should document each meeting, interview, and received data, so individuals not present can easily access and understand the findings. The data should be placed in a central location for all members to access. Some of the data generated and analyzed will be done by a contractor, while other data may be generated/analyzed by the Government. Data delivered under contract should contain markings to indicate if there are any restrictions to the Government’s ability to use, modify, reproduce, release, perform, display, or disclose that data. These markings must be reviewed, challenged, and/or corrected when appropriate. 
Not all data needs to be obtained prior to commencing the next phase. The team should continue to monitor the data received throughout phases 1 and 2, and follow up to ensure remaining data are received before the completion of phase 2. 
Table 9 details the work required to complete the Data Gathering phase. 
Activity 
Description 
Identify the Data/ Documentation Required to Conduct the Baseline the System Step 
Identify required and useful current and historical data to develop a full understanding of the program or, if in the design phase, any analogous program’s current state. Examples of pertinent data include: 
• Remaining useful life 
• Number of assets in inventory 
• Historic/projected sustainment spend 
• Current/historic projected readiness levels 
• Current/historic sustainment strategy 
• Current/historic configuration management procedures 
Priority 1: Necessary to begin the analysis 
Priority 2: Necessary to complete the analysis 
Priority 3: Beneficial to develop a more robust analysis, but not essential
PBL Guidebook Section 2: Step 3 Baseline the System 
34 
For new systems data sources include: 
• Reliability, Maintainability, and Diagnostics predictions 
• Failure Mode, Effects, and Criticality Analysis (FMECA) 
• Failure Reporting and Corrective Action System (FRACAS) 
• Level of Repair Analysis (LORA) 
• Maintenance Task Analysis (MTA) 
• Reliability-Centered Maintenance (RCM) analysis 
• Reliability, Availability, and Maintainability (RAM) and Life Cycle Cost (LCC) analyses 
Develop a Data Collection Plan20 
Priorities for data collection may be: 
• Priority 1 – data necessary to develop an initial understanding of the situation and help prepare users for interviews 
• Priority 2 – data necessary to complete the baseline step 
• Priority 3 – data that would benefit the robustness of the baseline, but is not necessary 
Execute Data Collection Plan 
• Request, collect, organize, and review the documentation 
• Prepare for and schedule interview(s) 
• Meet with stakeholders to document the existing processes for procurement, maintenance/repair, and overhaul 
Perform Initial Interviews 
Meet with stakeholders to obtain input on the current state of the sustainment strategy 
Verify Required Information has Been Gathered 
Perform a reconciliation of obtained documents, prioritize/remove documents accordingly, and make additional requests for data as necessary 
Extract/Summarize Key Details 
Summarize the key information for each document and interview to facilitate analysis 
Table 9: Phase 1: Data-Gathering Activities 
Phase 2. Data review and analysis. 2.3.2.2. 
This phase consists of a top-level analysis to determine the need for further analysis. The PO should work with stakeholders to determine material flow relationships, cycle times, labor requirements, and other process elements using existing process maps. The process map will help the team visualize the entire supply chain and will enable the PSM IPT to find high-level opportunities to improve the product support strategy. The process map should include the specific activities involved in the supply chain, including supply support, maintenance, repair, and overhaul or other IPS elements as appropriate. If no process maps have been created in the past or they are insufficient in detail or scope, the PO may choose to develop or augment process maps of the current (and desired future) state. If a detailed process map has already been documented, then stakeholders should meet to review and validate it. 
20 The data collection plan is a working document for use by the PSMIPT and is not intended to be a formal program plan.
PBL Guidebook Section 2: Step 3 Baseline the System 
35 
Table 10 details the work required to complete the Data Review and Analysis phase. 
Activity 
Description 
Evaluate Data Collected Relative to Other Factors 
Assess the data collected to determine if a reduction in cost or increase in readiness may be possible through the introduction of a performance-based arrangement. Ensure access to technical data is included in the top-level assessment, as a change in sustainment strategy will be impacted by restrictions (or a lack thereof). 
Analyze Feasibility 
Perform a feasibility check for the likelihood of PBL implementation. 
Analyze Timing 
From the data collected and interviews performed, decide if the program is ready to transition to a new PSA at this time or in the future. 
Estimate Cost Savings and Performance Improvements 
Determine if significant costs savings and/or readiness improvements can be achieved through a change in the PSA. 
Table 10: Phase 2: Data Review and Analysis Process Steps 
Factor suggestions for the analysis are included below. They are not meant to be prescriptive or a “one-size-fits-all” aggregation of data needs for diagnostic purposes. These product support elements are listed because they are routinely where most of the O&S costs occur. However, each program should determine which IPS elements are the drivers for their program/product and thus need to be evaluated. 
In Table 11, the key considerations for impacting readiness and cost are shown. 
Factors 
Key Considerations 
Maintenance Planning and Management 
1. Is the current maintenance planning and management strategy satisfying Warfighter requirements? 
2. Can the maintenance process (fault reporting, transportation, workload management, etc.) be made more efficient? 
3. Are there any substantial delays in the repair process? 
4. Can sustainment planning and demand forecasting be more accurate and efficient through the introduction of performance incentives? 
Supply Support 
1. Is the supply support strategy satisfying Warfighter requirements? 
2. Can the supporting supply chains be made more efficient through the introduction of performance incentives? 
3. Are there any substantial delays in the procurement process for spare parts or new units? 
4. Are there significant inventory build-ups at any stage in the supply chain due to overproduction or quality issues? 
5. Are there any Diminished Manufacturing Sources and Material Shortage (DMSMS) concerns?
PBL Guidebook Section 2: Step 3 Baseline the System 
36 
Market Space for Sustainment Providers 
1. What is the current competitive landscape for product support providers? For suppliers of new and repair parts? Are there alternate organic sources (i.e., from another location or another Service)? 
2. Does the organic workforce have access to applicable technical data for repair? 
3. What is the scope of the opportunity? 
Funding Mechanism 
1. Does the available funding mechanism (e.g.,Working Capital Fund (WCF), Operations and Maintenance (O&M) funding) allow for a long-term performance-based arrangement? 
2. If not, what other funding mechanisms may be available? 
Stakeholder Alignment and PBL Capabilities 
1. Organic PBL Commitment: Is there support from leadership and/or from the PO? 
2. Organic PBL Capability: Are the requisite knowledge and skills present? Are there sufficient resources available for implementation? 
3. Commercial PBL Commitment: Is there interest from the current/potential PSP/PSI, OEM, or other commercial firms? 
4. Commercial PBL Capability: Are the requisite knowledge and skills present? Are there sufficient resources available for implementation? 
5. Trust and Transparency: Is there significant trust and transparency among key stakeholders? 
6. Are there PPP opportunities available between potential organic and commercial support providers? 
Timing 
1. Stage in life cycle: Is it the right time for a change in sustainment strategy? Is there sufficient remaining service life for a transition to be worthwhile? 
2. What is the state of emerging technology? 
3. Existing contracts: Are there any conflicting contractual arrangements? 
4. Operating environment: Is change feasible under projected Operational Tempo (OPTEMPO)? 
Program-Specific Considerations 
1. Are there any program-specific barriers or major opportunities? 
Table 11: Factors to Consider when Assessing Readiness and Cost 
An expansion of the key considerations can be found in Appendix E. 
Phase 3: Recommendation Generation 2.3.2.3. 
The Recommendation Generation phase synthesizes the net evaluation of all factors to produce recommendations regarding the feasibility and potential opportunities. The team should review the opportunities identified in Phase 2. Then, a weighting and scoring of data should be performed based on the criteria’s level of importance to the program. The results from this analysis should be used to inform further data collection and to identify any points requiring
PBL Guidebook Section 2: Step 3 Baseline the System 
37 
clarification before making a final determination of feasibility. 
The feasibility analysis will generate two possible recommendations: a PBL arrangement is feasible or not. In those cases where a performance-based logistics arrangement(s) is found to be a viable strategy, a more detailed analysis may be required. If pursuing a performance-based arrangement is deemed the inappropriate course of action (CoA), the PM/PSM should still ensure their current plan is designed to support the Warfighter requirements at the lowest possible costs, and document their decisions in the LCSP and other documentation as appropriate. The PSMIPT should consider making specific recommendations to guide additional analysis. A best practice when generating a recommendation is to consider and identify CoA and determine the degree that a more detailed analysis is warranted to support the product support strategy decisions. 
Table 12 provides a high-level view of requirements for Phase 3. 
Process Step 
Description 
Review the Description of the Program 
Review the description of the program to provide context and verify a common understanding. 
Review Performance Requirements for Current State 
If performance requirements exist, review the requirements and the current state of the program (e.g., metrics, sustainment costs) relative to the requirements. If performance requirements are absent, provide initial performance requirements as part of the recommendation. 
Review Phase 2 Analysis 
Review the current product support strategy and show the benefits and disadvantages based on the findings. 
Create a Recommendation 
Generate product support analysis recommendations and obtain a decision from the Decision Authority for the development and evaluation of product support alternatives. 
Table 12: Phase 3 Recommendation Generation Process Steps 
Conclusion 2.3.3. 
The end of this step will conclude with a “Go/No-Go” recommendation for continued analysis based upon the feasibility of, and the potential benefit from, a change in sustainment strategy to a PBL arrangement. The PO should review the opportunities in cost savings and readiness improvements that a PBL strategy would provide and should explore potential alternatives in Steps 5 and 6. 
Concepts in Action: 2.3.4. GSS Use Case 
The PSM identified the necessary information using the data-gathering 
Step 3: Developmental System Considerations 
For new programs, the baseline step should include an examination of the cost to support the replaced systems. If there is no antecedent system, LCC estimates should be used. The following data may be considered: 
• Reliability, maintainability, and diagnostics predictions 
• Failure Modes Effects and Criticality Analysis (FMECA) 
• Failure Reporting and Corrective Action System (FRACAS) 
• Level of Repair Analysis (LORA) 
• Maintenance Task Analysis (MTA) 
• Reliability-Centered Maintenance (RCM) analysis 
• Reliability, Availability, and Maintainability (RAM) and Life Cycle Cost (LCC) analyses
OSD ASD(LMR) Performance Based Logistics Guidebook_May_2014

More Related Content

Similar to OSD ASD(LMR) Performance Based Logistics Guidebook_May_2014

Portfolio management and the ppbe process at the department of energy white p...
Portfolio management and the ppbe process at the department of energy white p...Portfolio management and the ppbe process at the department of energy white p...
Portfolio management and the ppbe process at the department of energy white p...p6academy
 
Government Process Architecting Framework (GPAF)
Government Process Architecting Framework (GPAF)Government Process Architecting Framework (GPAF)
Government Process Architecting Framework (GPAF)Consultant
 
Operations and-maintenance-best-practices
Operations and-maintenance-best-practicesOperations and-maintenance-best-practices
Operations and-maintenance-best-practicesNikhil Nangia
 
Project plan preparation guidelines
Project plan preparation guidelinesProject plan preparation guidelines
Project plan preparation guidelinesKapila Kapila
 
Continuous Process Improvement Transformation Guidebook.docx
Continuous Process Improvement  Transformation Guidebook.docxContinuous Process Improvement  Transformation Guidebook.docx
Continuous Process Improvement Transformation Guidebook.docxdonnajames55
 
Running head critical path method1 critical path method7critic
Running head critical path method1 critical path method7criticRunning head critical path method1 critical path method7critic
Running head critical path method1 critical path method7criticDIPESH30
 
Tools description for product development process management in food industries
Tools description for product development process management in food industriesTools description for product development process management in food industries
Tools description for product development process management in food industrieseSAT Journals
 
Tools description for product development process management in food industries
Tools description for product development process management in food industriesTools description for product development process management in food industries
Tools description for product development process management in food industrieseSAT Publishing House
 
Observation Report-CRP-22July-2014
Observation Report-CRP-22July-2014Observation Report-CRP-22July-2014
Observation Report-CRP-22July-2014Rahmat Hashim, PMP
 
Sexton_Jay_MPM357_IP5
Sexton_Jay_MPM357_IP5Sexton_Jay_MPM357_IP5
Sexton_Jay_MPM357_IP5Jay T Sexton
 
Ils management overview
Ils management overviewIls management overview
Ils management overviewDaniel Pappas
 
Ultimate Guide to Supply Chain Resiliency Program Success
Ultimate Guide to Supply Chain Resiliency Program SuccessUltimate Guide to Supply Chain Resiliency Program Success
Ultimate Guide to Supply Chain Resiliency Program SuccessGlobal Business Professor
 
Modern Software Productivity Measurement: The Pragmatic Guide
Modern Software Productivity Measurement: The Pragmatic GuideModern Software Productivity Measurement: The Pragmatic Guide
Modern Software Productivity Measurement: The Pragmatic GuideCAST
 
Maintain Inventories of Hardware and Software.pdf
Maintain Inventories of Hardware and Software.pdfMaintain Inventories of Hardware and Software.pdf
Maintain Inventories of Hardware and Software.pdfamare lakew
 
Organisational Change Management in ERP Projects
Organisational Change Management in ERP Projects Organisational Change Management in ERP Projects
Organisational Change Management in ERP Projects Lumenia Consulting
 

Similar to OSD ASD(LMR) Performance Based Logistics Guidebook_May_2014 (20)

Portfolio management and the ppbe process at the department of energy white p...
Portfolio management and the ppbe process at the department of energy white p...Portfolio management and the ppbe process at the department of energy white p...
Portfolio management and the ppbe process at the department of energy white p...
 
TerryBrightPortfolio
TerryBrightPortfolioTerryBrightPortfolio
TerryBrightPortfolio
 
Government Process Architecting Framework (GPAF)
Government Process Architecting Framework (GPAF)Government Process Architecting Framework (GPAF)
Government Process Architecting Framework (GPAF)
 
Smp 2009
Smp 2009Smp 2009
Smp 2009
 
Operations and-maintenance-best-practices
Operations and-maintenance-best-practicesOperations and-maintenance-best-practices
Operations and-maintenance-best-practices
 
Project plan preparation guidelines
Project plan preparation guidelinesProject plan preparation guidelines
Project plan preparation guidelines
 
Continuous Process Improvement Transformation Guidebook.docx
Continuous Process Improvement  Transformation Guidebook.docxContinuous Process Improvement  Transformation Guidebook.docx
Continuous Process Improvement Transformation Guidebook.docx
 
Cmgt 410 cmgt410
Cmgt 410 cmgt410Cmgt 410 cmgt410
Cmgt 410 cmgt410
 
Assessing ERP Critical Success Factors
Assessing ERP Critical Success FactorsAssessing ERP Critical Success Factors
Assessing ERP Critical Success Factors
 
Running head critical path method1 critical path method7critic
Running head critical path method1 critical path method7criticRunning head critical path method1 critical path method7critic
Running head critical path method1 critical path method7critic
 
Finding Balance
Finding BalanceFinding Balance
Finding Balance
 
Tools description for product development process management in food industries
Tools description for product development process management in food industriesTools description for product development process management in food industries
Tools description for product development process management in food industries
 
Tools description for product development process management in food industries
Tools description for product development process management in food industriesTools description for product development process management in food industries
Tools description for product development process management in food industries
 
Observation Report-CRP-22July-2014
Observation Report-CRP-22July-2014Observation Report-CRP-22July-2014
Observation Report-CRP-22July-2014
 
Sexton_Jay_MPM357_IP5
Sexton_Jay_MPM357_IP5Sexton_Jay_MPM357_IP5
Sexton_Jay_MPM357_IP5
 
Ils management overview
Ils management overviewIls management overview
Ils management overview
 
Ultimate Guide to Supply Chain Resiliency Program Success
Ultimate Guide to Supply Chain Resiliency Program SuccessUltimate Guide to Supply Chain Resiliency Program Success
Ultimate Guide to Supply Chain Resiliency Program Success
 
Modern Software Productivity Measurement: The Pragmatic Guide
Modern Software Productivity Measurement: The Pragmatic GuideModern Software Productivity Measurement: The Pragmatic Guide
Modern Software Productivity Measurement: The Pragmatic Guide
 
Maintain Inventories of Hardware and Software.pdf
Maintain Inventories of Hardware and Software.pdfMaintain Inventories of Hardware and Software.pdf
Maintain Inventories of Hardware and Software.pdf
 
Organisational Change Management in ERP Projects
Organisational Change Management in ERP Projects Organisational Change Management in ERP Projects
Organisational Change Management in ERP Projects
 

More from Tom "Blad" Lindblad

2017 U.S. Marine Corps Aviation Plan
2017 U.S. Marine Corps Aviation Plan2017 U.S. Marine Corps Aviation Plan
2017 U.S. Marine Corps Aviation PlanTom "Blad" Lindblad
 
CSBA - FY-2016 Weapon Systems Factbook
CSBA - FY-2016  Weapon Systems FactbookCSBA - FY-2016  Weapon Systems Factbook
CSBA - FY-2016 Weapon Systems FactbookTom "Blad" Lindblad
 
The Tustin Hangars - Titans of History
The Tustin Hangars - Titans of HistoryThe Tustin Hangars - Titans of History
The Tustin Hangars - Titans of HistoryTom "Blad" Lindblad
 
Commanant Marine Corps' Planning 2015 Planning Guidance
Commanant Marine Corps' Planning 2015 Planning GuidanceCommanant Marine Corps' Planning 2015 Planning Guidance
Commanant Marine Corps' Planning 2015 Planning GuidanceTom "Blad" Lindblad
 
Updated Commandant USMC Planning Guidance
Updated Commandant USMC Planning GuidanceUpdated Commandant USMC Planning Guidance
Updated Commandant USMC Planning GuidanceTom "Blad" Lindblad
 
CRS - Marine Corps Amphibious Combat Vehicle (ACV) and Marine Personnel Carri...
CRS - Marine Corps Amphibious Combat Vehicle (ACV) and Marine Personnel Carri...CRS - Marine Corps Amphibious Combat Vehicle (ACV) and Marine Personnel Carri...
CRS - Marine Corps Amphibious Combat Vehicle (ACV) and Marine Personnel Carri...Tom "Blad" Lindblad
 
Sec Def Military Decorations and Awards Review
Sec Def  Military Decorations and Awards Review Sec Def  Military Decorations and Awards Review
Sec Def Military Decorations and Awards Review Tom "Blad" Lindblad
 
MCRP 5-12D Organization of United States Marine Corps 26 Aug15
MCRP 5-12D Organization of United States Marine Corps 26 Aug15MCRP 5-12D Organization of United States Marine Corps 26 Aug15
MCRP 5-12D Organization of United States Marine Corps 26 Aug15Tom "Blad" Lindblad
 
Rand Reforming Military Retirement July 2015
Rand Reforming Military Retirement July 2015Rand Reforming Military Retirement July 2015
Rand Reforming Military Retirement July 2015Tom "Blad" Lindblad
 
GAO - Surface Ships: Status of the Navy’s Phased Modernization Plan
GAO - Surface Ships: Status of the Navy’s Phased Modernization PlanGAO - Surface Ships: Status of the Navy’s Phased Modernization Plan
GAO - Surface Ships: Status of the Navy’s Phased Modernization PlanTom "Blad" Lindblad
 
DOD 2015 China Military Power Report
DOD 2015 China Military Power ReportDOD 2015 China Military Power Report
DOD 2015 China Military Power ReportTom "Blad" Lindblad
 
Doing Business with DHS (Feb 2015)
Doing Business with DHS  (Feb 2015)Doing Business with DHS  (Feb 2015)
Doing Business with DHS (Feb 2015)Tom "Blad" Lindblad
 
USMC UAS Family of Systems (April 2015)
USMC UAS Family of Systems (April 2015)USMC UAS Family of Systems (April 2015)
USMC UAS Family of Systems (April 2015)Tom "Blad" Lindblad
 
USMC Expeditionary Force 21 MAGTF Ground Combat Element (2015)
USMC Expeditionary Force 21 MAGTF Ground Combat Element (2015)USMC Expeditionary Force 21 MAGTF Ground Combat Element (2015)
USMC Expeditionary Force 21 MAGTF Ground Combat Element (2015)Tom "Blad" Lindblad
 
Commandant of Marine Corps Posture Statement_2015 to Congress
Commandant of Marine Corps Posture Statement_2015 to CongressCommandant of Marine Corps Posture Statement_2015 to Congress
Commandant of Marine Corps Posture Statement_2015 to CongressTom "Blad" Lindblad
 
FY2016 Army PRESBUD Highlights (Feb 2015)
FY2016 Army PRESBUD Highlights (Feb 2015)FY2016 Army PRESBUD Highlights (Feb 2015)
FY2016 Army PRESBUD Highlights (Feb 2015)Tom "Blad" Lindblad
 
US DOD Program Acquisition Cost by Weapon System for FY16 Feb 2015
US DOD Program Acquisition Cost by Weapon System for FY16 Feb 2015US DOD Program Acquisition Cost by Weapon System for FY16 Feb 2015
US DOD Program Acquisition Cost by Weapon System for FY16 Feb 2015Tom "Blad" Lindblad
 
Report of the Military Compensation and Retirement Modernization Commission-2...
Report of the Military Compensation and Retirement Modernization Commission-2...Report of the Military Compensation and Retirement Modernization Commission-2...
Report of the Military Compensation and Retirement Modernization Commission-2...Tom "Blad" Lindblad
 
Joint Capabilities Integration and Development System
Joint Capabilities Integration and Development SystemJoint Capabilities Integration and Development System
Joint Capabilities Integration and Development SystemTom "Blad" Lindblad
 
CRS Casualty Statistics: Operations Inherent Resolve, New Dawn, Iraqi Freedo...
CRS  Casualty Statistics: Operations Inherent Resolve, New Dawn, Iraqi Freedo...CRS  Casualty Statistics: Operations Inherent Resolve, New Dawn, Iraqi Freedo...
CRS Casualty Statistics: Operations Inherent Resolve, New Dawn, Iraqi Freedo...Tom "Blad" Lindblad
 

More from Tom "Blad" Lindblad (20)

2017 U.S. Marine Corps Aviation Plan
2017 U.S. Marine Corps Aviation Plan2017 U.S. Marine Corps Aviation Plan
2017 U.S. Marine Corps Aviation Plan
 
CSBA - FY-2016 Weapon Systems Factbook
CSBA - FY-2016  Weapon Systems FactbookCSBA - FY-2016  Weapon Systems Factbook
CSBA - FY-2016 Weapon Systems Factbook
 
The Tustin Hangars - Titans of History
The Tustin Hangars - Titans of HistoryThe Tustin Hangars - Titans of History
The Tustin Hangars - Titans of History
 
Commanant Marine Corps' Planning 2015 Planning Guidance
Commanant Marine Corps' Planning 2015 Planning GuidanceCommanant Marine Corps' Planning 2015 Planning Guidance
Commanant Marine Corps' Planning 2015 Planning Guidance
 
Updated Commandant USMC Planning Guidance
Updated Commandant USMC Planning GuidanceUpdated Commandant USMC Planning Guidance
Updated Commandant USMC Planning Guidance
 
CRS - Marine Corps Amphibious Combat Vehicle (ACV) and Marine Personnel Carri...
CRS - Marine Corps Amphibious Combat Vehicle (ACV) and Marine Personnel Carri...CRS - Marine Corps Amphibious Combat Vehicle (ACV) and Marine Personnel Carri...
CRS - Marine Corps Amphibious Combat Vehicle (ACV) and Marine Personnel Carri...
 
Sec Def Military Decorations and Awards Review
Sec Def  Military Decorations and Awards Review Sec Def  Military Decorations and Awards Review
Sec Def Military Decorations and Awards Review
 
MCRP 5-12D Organization of United States Marine Corps 26 Aug15
MCRP 5-12D Organization of United States Marine Corps 26 Aug15MCRP 5-12D Organization of United States Marine Corps 26 Aug15
MCRP 5-12D Organization of United States Marine Corps 26 Aug15
 
Rand Reforming Military Retirement July 2015
Rand Reforming Military Retirement July 2015Rand Reforming Military Retirement July 2015
Rand Reforming Military Retirement July 2015
 
GAO - Surface Ships: Status of the Navy’s Phased Modernization Plan
GAO - Surface Ships: Status of the Navy’s Phased Modernization PlanGAO - Surface Ships: Status of the Navy’s Phased Modernization Plan
GAO - Surface Ships: Status of the Navy’s Phased Modernization Plan
 
DOD 2015 China Military Power Report
DOD 2015 China Military Power ReportDOD 2015 China Military Power Report
DOD 2015 China Military Power Report
 
Doing Business with DHS (Feb 2015)
Doing Business with DHS  (Feb 2015)Doing Business with DHS  (Feb 2015)
Doing Business with DHS (Feb 2015)
 
USMC UAS Family of Systems (April 2015)
USMC UAS Family of Systems (April 2015)USMC UAS Family of Systems (April 2015)
USMC UAS Family of Systems (April 2015)
 
USMC Expeditionary Force 21 MAGTF Ground Combat Element (2015)
USMC Expeditionary Force 21 MAGTF Ground Combat Element (2015)USMC Expeditionary Force 21 MAGTF Ground Combat Element (2015)
USMC Expeditionary Force 21 MAGTF Ground Combat Element (2015)
 
Commandant of Marine Corps Posture Statement_2015 to Congress
Commandant of Marine Corps Posture Statement_2015 to CongressCommandant of Marine Corps Posture Statement_2015 to Congress
Commandant of Marine Corps Posture Statement_2015 to Congress
 
FY2016 Army PRESBUD Highlights (Feb 2015)
FY2016 Army PRESBUD Highlights (Feb 2015)FY2016 Army PRESBUD Highlights (Feb 2015)
FY2016 Army PRESBUD Highlights (Feb 2015)
 
US DOD Program Acquisition Cost by Weapon System for FY16 Feb 2015
US DOD Program Acquisition Cost by Weapon System for FY16 Feb 2015US DOD Program Acquisition Cost by Weapon System for FY16 Feb 2015
US DOD Program Acquisition Cost by Weapon System for FY16 Feb 2015
 
Report of the Military Compensation and Retirement Modernization Commission-2...
Report of the Military Compensation and Retirement Modernization Commission-2...Report of the Military Compensation and Retirement Modernization Commission-2...
Report of the Military Compensation and Retirement Modernization Commission-2...
 
Joint Capabilities Integration and Development System
Joint Capabilities Integration and Development SystemJoint Capabilities Integration and Development System
Joint Capabilities Integration and Development System
 
CRS Casualty Statistics: Operations Inherent Resolve, New Dawn, Iraqi Freedo...
CRS  Casualty Statistics: Operations Inherent Resolve, New Dawn, Iraqi Freedo...CRS  Casualty Statistics: Operations Inherent Resolve, New Dawn, Iraqi Freedo...
CRS Casualty Statistics: Operations Inherent Resolve, New Dawn, Iraqi Freedo...
 

Recently uploaded

12052024_First India Newspaper Jaipur.pdf
12052024_First India Newspaper Jaipur.pdf12052024_First India Newspaper Jaipur.pdf
12052024_First India Newspaper Jaipur.pdfFIRST INDIA
 
declarationleaders_sd_re_greens_theleft_5.pdf
declarationleaders_sd_re_greens_theleft_5.pdfdeclarationleaders_sd_re_greens_theleft_5.pdf
declarationleaders_sd_re_greens_theleft_5.pdfssuser5750e1
 
10052024_First India Newspaper Jaipur.pdf
10052024_First India Newspaper Jaipur.pdf10052024_First India Newspaper Jaipur.pdf
10052024_First India Newspaper Jaipur.pdfFIRST INDIA
 
11052024_First India Newspaper Jaipur.pdf
11052024_First India Newspaper Jaipur.pdf11052024_First India Newspaper Jaipur.pdf
11052024_First India Newspaper Jaipur.pdfFIRST INDIA
 
Income Tax Regime Dilemma – New VS. Old pdf
Income Tax Regime Dilemma – New VS. Old pdfIncome Tax Regime Dilemma – New VS. Old pdf
Income Tax Regime Dilemma – New VS. Old pdftaxguruedu
 
KING VISHNU BHAGWANON KA BHAGWAN PARAMATMONKA PARATOMIC PARAMANU KASARVAMANVA...
KING VISHNU BHAGWANON KA BHAGWAN PARAMATMONKA PARATOMIC PARAMANU KASARVAMANVA...KING VISHNU BHAGWANON KA BHAGWAN PARAMATMONKA PARATOMIC PARAMANU KASARVAMANVA...
KING VISHNU BHAGWANON KA BHAGWAN PARAMATMONKA PARATOMIC PARAMANU KASARVAMANVA...IT Industry
 
Textile Waste In India/managing-textile-waste-in-India
Textile Waste In India/managing-textile-waste-in-IndiaTextile Waste In India/managing-textile-waste-in-India
Textile Waste In India/managing-textile-waste-in-Indiatheunitedindian7
 

Recently uploaded (7)

12052024_First India Newspaper Jaipur.pdf
12052024_First India Newspaper Jaipur.pdf12052024_First India Newspaper Jaipur.pdf
12052024_First India Newspaper Jaipur.pdf
 
declarationleaders_sd_re_greens_theleft_5.pdf
declarationleaders_sd_re_greens_theleft_5.pdfdeclarationleaders_sd_re_greens_theleft_5.pdf
declarationleaders_sd_re_greens_theleft_5.pdf
 
10052024_First India Newspaper Jaipur.pdf
10052024_First India Newspaper Jaipur.pdf10052024_First India Newspaper Jaipur.pdf
10052024_First India Newspaper Jaipur.pdf
 
11052024_First India Newspaper Jaipur.pdf
11052024_First India Newspaper Jaipur.pdf11052024_First India Newspaper Jaipur.pdf
11052024_First India Newspaper Jaipur.pdf
 
Income Tax Regime Dilemma – New VS. Old pdf
Income Tax Regime Dilemma – New VS. Old pdfIncome Tax Regime Dilemma – New VS. Old pdf
Income Tax Regime Dilemma – New VS. Old pdf
 
KING VISHNU BHAGWANON KA BHAGWAN PARAMATMONKA PARATOMIC PARAMANU KASARVAMANVA...
KING VISHNU BHAGWANON KA BHAGWAN PARAMATMONKA PARATOMIC PARAMANU KASARVAMANVA...KING VISHNU BHAGWANON KA BHAGWAN PARAMATMONKA PARATOMIC PARAMANU KASARVAMANVA...
KING VISHNU BHAGWANON KA BHAGWAN PARAMATMONKA PARATOMIC PARAMANU KASARVAMANVA...
 
Textile Waste In India/managing-textile-waste-in-India
Textile Waste In India/managing-textile-waste-in-IndiaTextile Waste In India/managing-textile-waste-in-India
Textile Waste In India/managing-textile-waste-in-India
 

OSD ASD(LMR) Performance Based Logistics Guidebook_May_2014

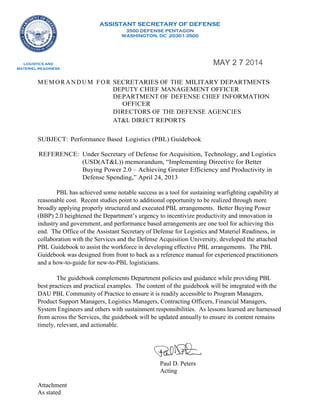
  • 1. ASSISTANT SECRETARY OF DEFENSE 3500 DEFENSE PENTAGON WASHINGTON, DC 20301-3500 LOGISTICS AND MAY 2 7 2014 MATERIEL READINESS MEMORANDUM FOR SECRETARIES OF THE MILITARY DEPARTMENTS DEPUTY CHIEF MANAGEMENT OFFICER DEPARTMENT OF DEFENSE CHIEF INFORMATION OFFICER DIRECTORS OF THE DEFENSE AGENCIES AT&L DIRECT REPORTS SUBJECT: Performance Based Logistics (PBL) Guidebook REFERENCE: Under Secretary of Defense for Acquisition, Technology, and Logistics (USD(AT&L)) memorandum, “Implementing Directive for Better Buying Power 2.0 – Achieving Greater Efficiency and Productivity in Defense Spending,” April 24, 2013 PBL has achieved some notable success as a tool for sustaining warfighting capability at reasonable cost. Recent studies point to additional opportunity to be realized through more broadly applying properly structured and executed PBL arrangements. Better Buying Power (BBP) 2.0 heightened the Department’s urgency to incentivize productivity and innovation in industry and government, and performance based arrangements are one tool for achieving this end. The Office of the Assistant Secretary of Defense for Logistics and Materiel Readiness, in collaboration with the Services and the Defense Acquisition University, developed the attached PBL Guidebook to assist the workforce in developing effective PBL arrangements. The PBL Guidebook was designed from front to back as a reference manual for experienced practitioners and a how-to-guide for new-to-PBL logisticians. The guidebook complements Department policies and guidance while providing PBL best practices and practical examples. The content of the guidebook will be integrated with the DAU PBL Community of Practice to ensure it is readily accessible to Program Managers, Product Support Managers, Logistics Managers, Contracting Officers, Financial Managers, System Engineers and others with sustainment responsibilities. As lessons learned are harnessed from across the Services, the guidebook will be updated annually to ensure its content remains timely, relevant, and actionable. Paul D. Peters Acting Attachment As stated
  • 2. 1 U.S. Department of Defense | 2014 PBL GUIDEBOOK A Guide to Developing Performance-Based Arrangements
  • 4. 3 Introduction Better Buying Power (BBP) 2.0 identifies seven focus areas to achieve greater efficiency and productivity in defense spending. Based on proven success, Performance-Based Logistics (PBL) is included within BBP 2.0 area three – “Incentivize Productivity and Innovation in Industry and Government.” BBP 2.0 emphasizes that delivering better value to the taxpayer and Warfighter is the goal. In support of BBP 2.0, the Assistant Secretary of Defense for Logistics and Materiel Readiness (ASD (L&MR)), in collaboration with the Services and Defense Acquisition University (DAU), prepared this PBL Guidebook. This document is for Component Leadership, Program Executive Officers (PEO), Program Managers (PM), Product Support Managers (PSM), Logistics Managers, Contracting Officers, Financial Managers, System Engineers, and other parties responsible for developing and executing product support strategies. It is a consolidated resource that leverages Department of Defense Instructions (DoDI) and other guidebooks, and uses the Product Support Business Model as an organizing construct for PBL best practices, processes, and supporting documentation needed to craft effective PBL arrangements. How to Use This Document This Guidebook is divided into three major sections, each with various subsections. Section One provides background information that addresses the history of PBL, how it works, and considerations for its application across the various phases of a program’s life cycle. Section Two complements and expands upon the DoD 12-Step Product Support Strategy Process Model provided in the PSM Guidebook for systems, subsystems, or components. The steps in Section Two are intended to assist the reader in successfully implementing a PBL arrangement with the recognition that, depending on the life cycle phase, not all steps may be applicable and all are tailorable depending on the unique requirements of a given program. Section Three is the appendices. This document provides hardware-focused examples, but the steps in this document may also be applied to Major Automated Information System (MAIS) programs. As an example for the reader to follow in developing and implementing a PBL arrangement, a notional Generic Subsystem (GSS) (that implements a PBL solution with a commercial Original Equipment Manufacturer (OEM)) is included throughout the Guidebook.
  • 5. 4 Table of Contents PBL-Defined ............................................................................................................... 8 1.1. Policy and Guidance Overview................................................................................... 8 1.2. History of PBL ............................................................................................................ 8 1.3. PBL in Commercial Industry............................................................. 8 1.3.1. PBL Origins in DoD .......................................................................... 9 1.3.2. An Analysis of PBL Effectiveness .................................................... 9 1.3.3. How Performance-Based Arrangements Work......................................................... 11 1.4. Industry is Driven by Profit, Return on Invested Capital, Long-Term 1.4.1. Revenue Stream, and Risk ............................................................... 12 Aligning the Interests of Government and Industry.................................................. 14 1.5. Product Support Business Model and PBL: An Enabling Function across a 1.6. Program/Product Life Cycle...................................................................................... 15 Materiel Solution Analysis .............................................................. 17 1.6.1. Technology Maturation and Risk Reduction ................................... 18 1.6.2. Engineering and Manufacturing Development................................ 19 1.6.3. Production and Deployment ............................................................ 19 1.6.4. Operations and Support.................................................................... 20 1.6.5. 2. Standard and Repeatable Processes (S&RP) for PBL ................................................ 22 Step 1. Integrate Warfighter Requirements & Support ............................................. 24 2.1. Introduction...................................................................................... 24 2.1.1. Process ............................................................................................. 25 2.1.2. Conclusion ....................................................................................... 26 2.1.3. Concepts in Action: GSS Use Case ................................................. 26 2.1.4. Step 2. Form the Product Support Management IPT ................................................ 27 2.2. Introduction...................................................................................... 27 2.2.1. Process ............................................................................................. 27 2.2.2. Conclusion ....................................................................................... 29 2.2.3. Concepts in Action: GSS Use Case ................................................. 29 2.2.4. Step 3. Baseline the System ...................................................................................... 31 2.3. Introduction...................................................................................... 31 2.3.1. Process ............................................................................................. 32 2.3.2. Conclusion ....................................................................................... 37 2.3.3. Concepts in Action: GSS Use Case ................................................. 37 2.3.4. Step 4. Identify/Refine Performance Outcomes........................................................ 41 2.4. Introduction...................................................................................... 41 2.4.1. Process ............................................................................................. 41 2.4.2. Conclusion ....................................................................................... 44 2.4.3. Concepts in Action: GSS Use Case ................................................. 44 2.4.4. Step 5. Business Case Analysis................................................................................. 46 2.5. Introduction...................................................................................... 46 2.5.1. Process ............................................................................................. 47 2.5.2. Conclusion ....................................................................................... 51 2.5.3. Concepts in Action: GSS Use Case ................................................. 51 2.5.4. Step 6. Product Support Value Analysis ................................................................... 54 2.6. Introduction...................................................................................... 54 2.6.1.
  • 6. 5 Process ............................................................................................. 54 2.6.2. Conclusion ....................................................................................... 66 2.6.3. Concepts in Action: GSS Use Case ................................................. 67 2.6.4. Step 7. Determine Support Methods(s) ..................................................................... 69 2.7. Introduction...................................................................................... 69 2.7.1. Process ............................................................................................. 69 2.7.2. Conclusion ....................................................................................... 70 2.7.3. Concepts in Action: GSS Use Case ................................................. 70 2.7.4. Step 8. Designate Product Support Integrator(s) (PSI) ............................................. 72 2.8. Introduction...................................................................................... 72 2.8.1. Process ............................................................................................. 72 2.8.2. Conclusion ....................................................................................... 72 2.8.3. Concepts in Action: GSS Use Case ................................................. 72 2.8.4. Step 9. Identify Product Support Provider(s) (PSP).................................................. 74 2.9. Introduction...................................................................................... 74 2.9.1. Process ............................................................................................. 74 2.9.2. Conclusion ....................................................................................... 75 2.9.3. Concepts in Action: GSS Use Case ................................................. 75 2.9.4. Step 10. Identify/Refine Financial Enablers.............................................................. 76 2.10. Introduction...................................................................................... 76 2.10.1. Process ............................................................................................. 76 2.10.2. Conclusion ....................................................................................... 79 2.10.3. Concepts in Action: GSS Use Case ................................................. 79 2.10.4. Step 11. Establish/Refine Product Support Arrangements........................................ 80 2.11. Introduction...................................................................................... 80 2.11.1. Process ............................................................................................. 80 2.11.2. Contract Framework ........................................................................ 80 2.11.3. Conclusion ....................................................................................... 88 2.11.4. Concepts in Action: GSS Use Case ................................................. 88 2.11.5. Step 12. Implement and Assess................................................................................. 89 2.12. Introduction...................................................................................... 89 2.12.1. Process ............................................................................................. 89 2.12.2. Conclusion ....................................................................................... 90 2.12.3. Concepts in Action: GSS Use Case ................................................. 90 2.12.4. Resource A: Frequently Asked Questions (FAQ)..................................................... 92 3.1. Resource B: Acronyms............................................................................................ 104 3.2. Resource C: Bibliography ....................................................................................... 109 3.3. Appendix A: PBL Tenets ........................................................................................ 113 3.4. Appendix B: GSS PSMIPT Charter Example......................................................... 117 3.5. Appendix C: Knowledge Transfer and PSMIPT Training...................................... 120 3.6. Appendix D: DAU’s PBL Training and Knowledge-Sharing Resources ............... 124 3.7. Appendix E: Expansion of Key Considerations to Baseline the System................ 126 3.8. Appendix F: PBL Metrics ....................................................................................... 132 3.9. Appendix G: Calculating Weights from Pairwise Comparison Votes .................... 146 3.10. Appendix H: Other Sources for Cost Estimation .................................................... 147 3.11. Appendix I: PBL Contract Example ....................................................................... 148 3.12.
  • 7. 6 List of Tables Table 1: Tenets of PBL................................................................................................................... 9 Table 2: Empirical Findings.......................................................................................................... 10 Table 3: Commercial Firms’ Business Goals ............................................................................... 13 Table 4: PBL Key Considerations ................................................................................................ 18 Table 5: When to Pursue a Change in Product Support Strategy ................................................. 21 Table 6: JCIDS Sustainment Requirements.................................................................................. 25 Table 7: PSMIPT Principles ......................................................................................................... 29 Table 8: Initial Questions for Cost, Readiness, and Other Factors............................................... 32 Table 9: Phase 1: Data-Gathering Activities ................................................................................ 34 Table 10: Phase 2: Data Review and Analysis Process Steps ...................................................... 35 Table 11: Factors to Consider When Assessing Readiness and Cost ........................................... 36 Table 12: Phase 3 Recommendation Generation Process Steps ................................................... 37 Table 13: Key Considerations Addressed for GSS....................................................................... 40 Table 14: Metrics Selection by Level and Product Support Element........................................... 42 Table 15: Types of Partnerships to Consider for PBL Alternatives ............................................. 48 Table 16: PBL Partnership Scope Assessment Criteria................................................................ 50 Table 17: Continuum of PBL Arrangements ................................................................................ 51 Table 18: Cost Drivers and Cost Estimate Considerations for Product Support Alternatives...... 57 Table 19: Cost Estimation Methodologies.................................................................................... 58 Table 20: Benefits Evaluation Criteria ......................................................................................... 60 Table 21: Sample Benefits Scale .................................................................................................. 61 Table 22: Risk Categories............................................................................................................. 62 Table 23: List of Risks for GSS.................................................................................................... 63 Table 24: GSS Final Normalized Score and Ranking .................................................................. 66 Table 25: Alternatives Summary for GSS Use Case .................................................................... 68 Table 26: GSS Risk Mitigation Plan............................................................................................. 71 Table 27. Funding Source Comparison ........................................................................................ 79 Table 28: Priorities Tied to CWT Metric...................................................................................... 82 Table 29: CWT Incentives and Disincentives .............................................................................. 83 Table 30: MTBF Incentives and Disincentives ............................................................................ 83 Table 31: Industry Perspective...................................................................................................... 84 Table 32: Reporting Requirements ............................................................................................... 85 Table 33: Operational Hour and Demand Bands.......................................................................... 86 List of Figures Figure 1: Proof Point Results........................................................................................................ 10 Figure 2: Product Support Business Model .................................................................................. 16 Figure 3: Program/Product Life Cycle and GSS........................................................................... 17 Figure 4. The DoD Product Support Strategy Process Model ...................................................... 22 Figure 5: Relationship between AO and AM.................................................................................. 25 Figure 6. Product Support Management IPT................................................................................ 28 Figure 7: Metrics Alignment......................................................................................................... 42 Figure 8: Metrics Decomposition ................................................................................................. 43 Figure 9: GSS Metrics by Level and IPS Elements...................................................................... 45 Figure 10: PBL Partnership Assessment....................................................................................... 49
  • 8. 7 Figure 11: Approach for Utility Scoring....................................................................................... 55 Figure 12: Pairwise Comparison................................................................................................... 55 Figure 13: GSS Cost, Benefit, and Risk Weights ......................................................................... 55 Figure 14: Cumulative Costs by Cost Drivers .............................................................................. 58 Figure 15: GSS Evaluation Criteria Weights................................................................................ 60 Figure 16: Alternative Benefit Ranking........................................................................................ 61 Figure 17: Risk Matrix.................................................................................................................. 64 Figure 18: Risk Matrix.................................................................................................................. 64 Figure 19: Average Risk Scores ................................................................................................... 65 Figure 20: GSS Cost, Benefit, and Risk Weights ......................................................................... 66 Figure 21. Alternatives to Fund a PBL Contract .......................................................................... 76 Figure 22. Steps to Fund a PBL Contract Using WCFs ............................................................... 77 Figure 23. Uniform Contract Structure......................................................................................... 81
  • 9. PBL Guidebook Section 1: Background 8 1. Background PBL Defined 1.1. PBL is synonymous with performance-based life cycle product support, where outcomes are acquired through performance-based arrangements that deliver Warfighter requirements and incentivize product support providers to reduce costs through innovation. These arrangements are contracts with industry or intragovernmental agreements.1 A PBL arrangement is not synonymous with Contractor Logistics Support (CLS). CLS signifies the “who” of providing support, not the “how” of the business model. CLS is support provided by a contractor, whether the arrangement is structured around Warfighter outcomes with associated incentives or not. PBL arrangements, on the other hand, are tied to Warfighter outcomes and integrate the various product support activities (e.g., supply support, sustaining engineering, maintenance, etc.) of the supply chain with appropriate incentives and metrics. In addition, PBL focuses on combining best practices of both Government and industry. Policy and Guidance Overview 1.2. PBL has been the preferred sustainment strategy since the 2001 Quadrennial Defense Review (QDR) stating, “DoD will implement PBL to compress the supply chain and improve readiness for major weapons systems and commodities.” Since then, it has been both DoD policy2 and a strategic priority to increase the use of performance-based arrangements to deliver product support solutions3 that satisfy Warfighter requirements. The policies governing these strategies have gone through several iterations since 2001, but the intent has remained the same: to provide life cycle product support that delivers needed reliability and availability at a reduced cost while complying with directives, such as inventory accountability within a Government Accountable Property System of Record, and maximizing the use of existing Government-owned inventory when purchasing through a PBL. A detailed listing of the Product Support and PBL policies, guidance, and tools can be found at: https://acc.dau.mil/productsupport and https://acc.dau.mil/pbl. History of PBL 1.3. PBL in Commercial Industry 1.3.1. System and subsystem4 PBL strategies have been around for many years in commercial aviation. In these strategies, often referred to as “Power by the Hour,5” the customer pays the Product Support Provider (PSP) for a specified target level (system, subsystem, or component) of availability; this availability is measured as a percent value or the number of hours in an operational period, and the payment is based on usage. The provider incurs whatever costs are necessary to deliver the specified performance outcome. Similar strategies were successfully implemented in the heavy construction equipment sector. As the DoD considered the merits of 1 PBL description from the ASD L&MR “Performance-Based Logistics Comprehensive Guidance” Memorandum DTD 22 Nov 13 2DoDI 5000.02 3 A product support solution is the implementation of a product support strategy 4 System, subsystem, and component definitions can be found in the PSM Guidebook at https://acc.dau.mil/psm-guidebook 5Rolls-Royce Corporation
  • 10. PBL Guidebook Section 1: Background 9 adopting PBL, it determined the practices proven in commercial aviation were extensible to a broad range of hardware and software-intensive weapons systems. PBL Origins in DoD 1.3.2. PBL in DoD can be traced back to 1999, specifically to a collaborative approach adopted by Lockheed Martin and the Air Force to deliver support for the F-117 Nighthawk stealth ground-attack aircraft after the Base Realignment and Closure (BRAC) of the Sacramento Air Logistics Center (Geary & Vitasek, 2008). The Services originally implemented PBL to improve system readiness. More recently, PBL has been implemented to deliver needed reliability and availability, reduce total cost, and encourage and reward innovative cost reduction initiatives. An Analysis of PBL Effectiveness 1.3.3. ASD (L&MR) chartered a study in the fall of 2010 to analyze the impact of PBL on Life Cycle Costs (LCC), as compared to non-PBL sustainment arrangements. The “Proof Point” study6 concluded that, when properly structured7 and executed, PBL arrangements reduce the Services’ cost per unit-of-performance while simultaneously driving up system, subsystem, or component readiness. The study further estimated that an average annual cost savings or avoidance of 5-20 percent is possible for programs with generally sound adherence to the PBL tenets. As with any complex acquisition and/or sustainment strategy, there are certain desired characteristics necessary to drive optimal outcomes. For PBL, these characteristics are commonly referred to as the “tenets” of PBL. In Table 1, the Tenets of PBL are shown. Tenets of PBL Description Tenets Tied to Arrangements 1. Acquire clearly defined Warfighter-relevant outcomes, not just sustainment services or replacement equipment 2. Use measurable and manageable metrics that accurately assess the product support provider’s performance against delivery of targeted Warfighter outcomes 3. Provide significant incentives to the support provider that are tied to the achievement of the outcomes (for aspects of performance that are within their control) 4. Firm Fixed Price (FFP) contracts are generally the preferred contract type (Fixed Price Incentive Firm (FPIF) and Cost Plus Incentive Fee (CPIF) may be effective) 5. Provide sufficient contract length for the product support provider to recoup investments on improved product (e.g., Mean Time Between Failure (MTBF) and sustainment processes (e.g., manufacturing capabilities) Tenets Tied to Organization 6. PBL knowledge and resources are maintained for the Government team and product support providers 7. Leadership champions the effort throughout their organization(s) 8. Everyone with a vested interest in the outcome is involved 9. Supply chain activities are aligned to the desired PBL outcome versus disparate internal goals 10. Risk management is shared between the Government, customer, and support provider Table 1: Tenets of PBL8 6 “Proof Point” PBL Study summary and briefing slides can be found at: https://acc.dau.mil/CommunityBrowser.aspx?id=550259&lang=en-US 7 “Properly structured” refers to alignment with the PBL tenets 8Based on original research done by the University of Tennessee for USAF. See Appendix A for additional information.
  • 11. PBL Guidebook Section 1: Background 10 Table 2 and Figure 1 display the empirical findings from the “Proof Point” study, providing compelling evidence of the impact of performance-based sustainment on both cost and performance. Empirical Findings • Twenty of 21 programs studied experienced performance improvements, including three with very limited adherence to the generally accepted PBL tenets. o The 21st program’s declining performance resulted from a part failing more than it was forecast; this situation was unrelated to the PBL arrangement and would have occurred in a non-PBL arrangement as well. • Of the 21 programs, 15 had at least moderate9 tenet adherence (where the cost impact was determinable with certainty) and experienced both cost and performance improvements. • Three programs with very limited tenet adherence experienced cost increases. o None of the three programs were structured to deliver savings. Table 2: Empirical Findings Figure 1: Proof Point Results This empirical evidence provides a compelling case that performance-based sustainment is both a successful and robust strategy. Realizing both cost and performance savings requires a program 9 Moderate: “of medium quantity, extent, or amount”
  • 12. PBL Guidebook Section 1: Background 11 to achieve only moderate tenet adherence. For the programs with moderate tenet adherence, savings ranged from the low single digits to 27 percent. In general, the stronger the tenet adherence, the greater savings realized. These facts support the estimated 5–20 percent savings (or cost avoidance) range. The empirical evidence also illustrates that calling an arrangement “performance-based” in the absence of at least moderate adherence to the tenets will not guarantee success. PBL arrangements also contribute to other cost avoidance effects not quantified in the study’s findings. For example, one program determined that with the higher platform availability of its PBL-maintained aircraft, it could reduce the number of required aircraft, resulting in a 10 percent decrease in procurement costs and a savings of hundreds of millions of dollars. Another program avoided almost a billion-dollar depot facilitation cost through a PBL arrangement by utilizing existing commercial capability versus establishing public sector facilities.10 Another program experienced a dramatic decline in cannibalizations, duplicate ordering, and more expensive transportation modes, as its subsystem availability approached 100 percent after PBL implementation. The study—through its quantifiable and nonquantifiable results—demonstrates that performance-based product support strategies contribute to cost savings for DoD when structured and executed properly. There are examples of past PBL arrangements that did not deliver the anticipated cost or availability improvements, but these PBLs were the result of poor execution, rather than an indication of a flaw in the PBL plan. In sum, performance-based product support strategies that are properly managed deliver cost and availability improvements within the DoD environment. How Performance-Based Arrangements Work 1.4. The PBL strategy works by incentivizing desired outcomes across the product life cycle, from design through sustainment to retirement. Those individuals responsible for designing the system, crafting the strategy, and fulfilling the requirement must have an understanding of the business model and the perspectives of the Warfighter and the provider. Under the traditional transactional product support model, where the Government purchases parts or maintenance services from a commercial PSP (Contractor) when a repair is needed, the Contractor is not incentivized to reduce the need for repairs and repair parts. When equipment fails or is overhauled, the provider charges the Services for repair or replacement on a transaction-by-transaction basis. With transactional sustainment, the provider’s revenue and workload increase as equipment failures increase. This model creates a fundamental product support misalignment for DoD; PBL arrangements address this misalignment. When commercial providers are paid for performance, not per transaction, their profits are directly impacted in a negative way by any additional costs they incur in delivering contractual requirements. In a PBL arrangement, a commercial provider is incentivized to reduce both the number of repairs and the cost of the parts and labor used in the repair process. Commercial providers are incentivized to reduce system downtime in PBL arrangements because the contract specifies it or their profit is increased by reducing their cost. 10 Avoidance of depot facilitation may not be possible if required by 10 USC 2464 Core repair capability
  • 13. PBL Guidebook Section 1: Background 12 Public providers respond to a different set of incentives than commercial industry. While commercial industry is driven by profit, Return on Invested Capital (ROIC), and a guaranteed revenue stream, public providers are driven by increased workload and additional labor at the depots. However, since Program Offices (PO) also like to see a decrease in required repairs (i.e., work), the incentives must be established to satisfy both of these goals. Monetary incentives for shop performance may be used; however, the funds must come from the organic Command as the OEM Product Support Integrator (PSI) is prohibited from bonuses or other monetary incentives to the public PSP as part of a Public Private Partnership (PPP). Industry is Driven by Profit, Return on Invested Capital, Long-Term 1.4.1. Revenue Stream, and Risk When the PSI or PSP is a commercial business, it is important to understand the factors that influence and motivate its behavior. Industry, accountable to shareholders, competes to provide goods and services in the marketplace, balancing business risks and the potential for profit with providing a sound return on investment to shareholders. Since a strong business relationship is one of the foundational elements of successful performance-based arrangements, it is important to understand how industry works from a corporate and individual perspective. This understanding will facilitate the development of incentives that will best motivate the necessary behaviors for desired performance outcomes. As the owners and originators of DoD sustainment arrangements, the Services have significant, often exclusive, control over where the work is performed. It is important to note that transitioning to a PBL arrangement with a commercial business does not automatically result in all work being performed by the commercial provider. Options for where work may be performed when transitioning to a PBL arrangement include, but are not limited to: • Work previously performed at a Government activity continues to be performed by Government workers • Work previously performed at a Government activity is transitioned to a commercial repair facility • Work previously performed in a commercial activity transitions to a Government activity • Work previously performed in a commercial activity continues to be performed by the commercial provider • The work previously split between a Government and commercial activity is realigned according to the provisions of the PBL arrangement As noted above, transitioning to a PBL arrangement can result in the Government making a deliberate decision to award a contract to a commercial provider where touch labor is moved to the commercial provider. It can also result in repair work currently being performed by a commercial provider being transitioned to a Government activity. Depending on the circumstances, outsourcing maintenance work to a commercial entity may be the right answer for the Warfighter, military service, taxpayer, and commercial company. Often, however, transitioning work to the commercial PBL provider is not the right answer for the aforementioned entities. Understanding why and when having the commercial PBL provider execute all work may not be the optimal solution requires an understanding of the business goals
  • 14. PBL Guidebook Section 1: Background 13 commercial firms attempt to optimize. Table 3 below highlights three key goals commercial businesses are driven to optimize. Business Goals Commercial Firms Attempt to Optimize Profit: The mandate for companies in capitalist economies is to make a profit for its owners (shareholders). Assured Revenue Streams: In the commercial Aerospace and Defense industry, Wall Street and money markets reward companies with steadily growing or steady revenue over companies with greater variability of revenue, and therefore, greater uncertainty. Return on Invested Capital (ROIC): A key measure of a commercial firm’s success is the efficiency with which it converts shareholder assets into profit. The fewer capital assets required to generate a given level of profit, the better the ROIC. Table 3: Commercial Firms’ Business Goals Understanding that profit and ROIC are core industry behavior drivers is key to understanding where businesses prefer repair work be performed. Companies optimize their profits by having maintenance and repair work performed where they can get the required level of product quality at the lowest cost. Sometimes quality work can most profitably be performed in the commercial providers’ plants. Sometimes quality work can be most profitably performed in Government activities where labor costs are lower than industry plants. In these cases, the industry PBL providers, through PPP arrangements, outsource touch labor back to the Service. With respect to ROIC, PPPs also provide industry an opportunity to use Government facilities thereby avoiding the capital investments (i.e., infrastructure) required to perform some or all of the touch labor. PPPs can facilitate higher ROICs for the commercial providers and cause them to leave work in a Government facility or move work performed in a commercial plant into a Government activity. Government benefits from these PPPs because they gain access to industry processes, equipment, and sources of supply, which improves both their capability and capacity. It is essential that commercial PSIs and PSPs retain the opportunity to realize profitability commensurate with the risks embedded in fixed price-type contracts. These efforts often demand up-front financial investments in reliability, maintainability, and repair process improvements. The commercial PSP needs an appropriate base Period of Performance (PoP) in order to recoup its investment (this will be discussed further in step 10). The magnitude of investment — and consequently, the appropriate PoP — depends upon the scope and complexity of the individual program, as well as the operational environment of the weapon system. Many PBL contracts are implemented on systems, subsystems, or components experiencing declining performance, decreased availability, and/or rising sustainment costs. These trends require proactive action and time to identify, correct, and reverse. A PSI or PSP will assume cost and performance risks to accomplish these objectives, and they may need multiple years to recoup these investments.
  • 15. PBL Guidebook Section 1: Background 14 Both organic and commercial providers are driven primarily by the mandate to optimize the long-term health of the organization. Commercial providers often strive to optimize long-term revenue and profits; while the organic provider is often motivated to retain workload, capitalize on existing Government infrastructure, and utilize and build upon resident expertise. A long-term arrangement offers industry the certainty and confidence to invest in the system to achieve future savings and offers the organic PSP a business case to invest in infrastructure and workforce improvements. Opportunities that provide stable revenue streams and consistent workloads are viewed as attractive to both commercial and organic organizations, even though the motivations and benefits may differ. From industry’s point of view, profit targets in a business arrangement are directly related to the level of risk. Business risks take various forms, including technical and financial risks, and incentives that mitigate these risks are appealing. Incentive types include: longer contract lengths that provide time for the PSI/PSP to recoup investments; targeted financial incentives (such as fees) tied to specific, achievable performance outcomes; and optimal award term periods linked to performance. PBL arrangements are not limited to fixed price-type contracts. Successful PBL plans have been implemented with CPIF contracts, which may be the more appropriate arrangement when the risk cannot be reasonably quantified or the cost of transferring risk to the PSI or PSP is more than the Government will accept. It is important to note that with cost plus-type arrangements, there is no inherent incentive for the provider to lower their costs since all of their costs are covered and lowering them has no impact on profit. Organic PBLs need to implement Memorandums of Agreement (MOAs) that incorporate appropriate incentives and metrics. The key to successful PBLs is using incentives to elicit desired behavior and outcomes from the PSI/PSP, in spite of the guaranteed cost reimbursement. Performance-based arrangements provide industry the flexibility to determine how to deliver quality service and performance outcomes for their Government counterparts with an acceptable level of profit and risk. In the context of PBL arrangements, industry will ‘compete’ within their own organization in order to cut costs and increase profit, and will typically do so by: • Optimizing processes, thereby reducing inefficiency and the associated costs to satisfy a logistics demand • Improving the quality of the product (e.g., reliability), thereby reducing overall demand and the cost to deliver the desired performance Both approaches can result in reduced cost of support and savings to DoD and increased profits to the provider. Aligning the Interests of Government and Industry 1.5. Because of the nature of the market for weapons systems, both the suppliers and the customers are vulnerable to each other. The contractors depend on the DoD for a substantial portion of their business, while the DoD depends on this specialized group of industry providers (weapons, telecommunications, information, etc.) to support the Warfighters. This relationship is simultaneously cooperative and adversarial. Performance-based product support is successful in this environment because it aligns the interests of the Contractor and the Government, creating
  • 16. PBL Guidebook Section 1: Background 15 ‘internal competition11’ that ultimately saves money for the taxpayer while focusing on support to the Warfighters. The Government’s interest is to procure quality products and services at a fair and reasonable price, while industry is primarily interested in meeting its fiduciary responsibility to shareholders by maximizing profits. In the end, when structured and executed properly, performance-based product support arrangements (PSA) deliver increased or equivalent levels of availability to the Warfighter at lower cost per unit of performance (e.g., cost/operating hour). Further, at contract renewal, a new-cost basis is used to further reduce the cost to the Government, allowing the Government to benefit from the improvements made by the PSI or PSP in product and process. The PSI and PSP benefit by keeping the increased profits (either in whole or part) that come from lowering their cost to deliver. The PSI/PSP also benefits by stabilizing their revenue stream with longer-term arrangements and by leveraging Government facilities/work force versus their own invested capital. Product Support Business Model and PBL: An Enabling Function across a 1.6. Program/Product Life Cycle As stated in the PSM Guidebook, “the PM is assigned Life Cycle Management responsibility and is accountable for the implementation, management, and oversight of all activities associated with development, production, sustainment, and disposal of a system across its life cycle. The PM has the responsibility to develop an appropriate sustainment strategy to achieve effective and affordable operational readiness consistent with the Warfighter resources allocated to that objective.” PBL is a strategy for the PM to affordably and effectively satisfy Warfighter requirements (e.g., reliability, availability) and reduce Operating and Support (O&S) cost. Congress12 directed a PSM be assigned to each major weapon system to assist the PM with this responsibility. The PSM, a key leadership position in the PO, leads the development, implementation, and top-level integration and management of all sources of support to meet Warfighter sustainment and readiness requirements. The Product Support Business Model (PSBM) was developed to assist the PM and PSM, who must be tightly aligned, with the numerous supportability considerations and trade-offs that take place during the development and fielding of a weapon system. The PSBM defines the hierarchical framework and methodology through which the planning, development, implementation, management, and execution of product support for a weapon system component, subsystem, or platform will be accomplished over the life cycle. The model seeks to balance weapon system availability with the most affordable and predictable total ownership cost. Performance-based product support is a mechanism for accomplishing this task in a manner that shares performance risk between the Government and commercial product support provider(s). A properly designed PBL arrangement will align the provider’s and Government’s goals through the proper application of incentives. In Figure 2, the PSBM shows that alignment. 11 “Internal Competition” refers to a company being motivated to improve their product quality (reliability) and the efficiency of their processes to increase their profit. This is the same type of pressure that comes from external competition in the marketplace. 12 10 U.S.C. § 2337
  • 17. PBL Guidebook Section 1: Background 16 Figure 2: Product Support Business Model Decisions made during the development phases impact the ability to execute PBL arrangements after fielding. During the development phases, there are two main product support considerations for the PM/PSM along with the Systems Engineer: 1) influence the design for supportability and 2) design and develop the support system. The optimal approach is to include supportability and life cycle cost considerations at program inception (or before). This inclusion ensures that the attributes of the weapon system have been designed to minimize the need for logistics resources, reducing O&S costs. It also ensures that the acquisition strategy and the Life Cycle Sustainment Plan (LCSP) will address the technical and product support data needed to promote competition and other sources of supply during sustainment, keeping a downward pressure on the cost of support. For instance, sustainment managers implementing repair contracts for weapon system components should collaborate with all applicable stakeholders to incorporate the arrangement into the Weapon Systems LCSP (to include common and unique components). A notional Generic Subsystem (GSS) is discussed throughout the Guidebook to allow the reader to conceptually apply the detailed steps of developing and implementing a PBL arrangement. The developmental GSS (pre-milestone C) considerations differ from those of the fielded GSS (post-milestone C); thus, considerations for both types of GSS will be discussed in Section Two. In Figure 3, the product life cycle and the developmental and fielded GSS scenarios are shown.
  • 18. PBL Guidebook Section 1: Background 17 Figure 3: Program/Product Life Cycle and GSS Figure 3 depicts a hardware intensive program, as captured in Model 1 of DoDI 5000.02. This is the classic model that has existed in some form in all previous editions of instruction and is the starting point for most military weapon systems. For software-intensive or accelerated programs, Hybrid Model A or Models 2-4 may be more appropriate, and the phasing of the activities discussed below will need to be tailored appropriately. Materiel Solution Analysis 1.6.1. The Materiel Solution Analysis phase provides the first significant opportunity to influence the supportability and affordability of weapon systems by balancing Warfighter requirements and desired operational capabilities with support and cost considerations. The Analysis of Alternatives (AoA) is completed at this time, which includes a comparison of the life cycle support approaches and costs. Suitability attributes (reflected in metrics such as Materiel Availability, Reliability, O&S cost, and other sustainment metrics) that are required to support the Warfighter should be evaluated in requirements trade-offs, along with performance characteristics (such as speed, range, and lethality for hardware and speed, agility and scalability for software). A failure to do so can result in a solution that creates unaffordable demands for resources during operations and sustainment. In Table 4, the key considerations that support performance-based solutions are highlighted. 20 to 50+ years
  • 19. PBL Guidebook Section 1: Background 18 Key Considerations That Support PBL Strategies and Arrangements • Work with the Warfighter to establish sustainment requirements that are specific and measurable at program initiation. • Identify and quantify O&S cost and readiness drivers early, and pursue opportunities to mitigate via system design and sustainment alternatives. • Influence design for reliability, maintainability, prognostics and diagnostics, and special requirements for hardware (e.g., corrosion control), plus modularity, reusability, and testability for software. • Promote standardized (common) systems, components, spare parts, and support equipment. This enables the greatest flexibility and competition for PBL arrangements in sustainment. • Produce a product support intellectual property strategy, including ownership needs as part of the acquisition strategy being developed for a Milestone A decision. This enables multiple provider and system/subsystem options for PBL. • Promote standard and stable manufacturing/factory floor processes that could be used in the depot, as well as production activities. • Promote structured, consistent processes for software development and sustainment activities based on standard maturity models. This enables the greatest flexibility and competition for PBL support solutions. • Ensure the broad product support strategy requirements are aligned with the Warfighter’s requirements. • Search within and outside of Service for existing support solutions that will satisfy Warfighter requirements and reduce support costs. Table 4: PBL Key Considerations13 Technology Maturation and Risk Reduction 1.6.2. During the Technology Maturation and Risk Reduction phase, supportability design features (e.g., reliability, maintainability) are incorporated in the overall design specifications, as reflected in the system requirements review (SRR) and preliminary design review (PDR). This phase is critical for establishing the life cycle costs of the program. Maintenance and logistics support planning are coordinated with design (levels of maintenance, repair skills, support equipment, etc.). Suitability (supportability) attributes should be incorporated and reflected in the support system designs, including Low Observable (LO) maintenance, ease of removing and replacing components, and other human/systems interface considerations. The Reliability, Availability, and Maintainability Cost (RAM-C) rationale approach is integrated within the systems engineering process. Continued analysis refines the conceptual support strategies that were previously developed into an integrated preliminary product support solution. Core and other depot requirements are determined and included in the support solution. Lastly, the Intellectual Property (IP) required to implement a PBL strategy should be identified and included in the system’s IP strategy (as a part of the overall acquisition strategy). 13 Compilation from OSD Guidance, DAU learning aids and Subject Matter Experts input
  • 20. PBL Guidebook Section 1: Background 19 In sum, technical, cost, and schedule risks associated with hardware and software development must be managed throughout the program’s life cycle and will be an important topic at all decision points and milestones. Engineering and Manufacturing Development 1.6.3. Engineering and Manufacturing Development (EMD) completes all needed hardware and software detailed design, systemically retires or mitigates any open risks, builds and tests prototypes or first articles to verify compliance with capability requirements, and prepares for production or deployment. This phase includes the establishment of the initial product baseline for all configuration items. One of the PM/PSM’s objectives in the EMD phase is ensuring the program develops an integrated product support (IPS) solution that meets readiness requirements, Materiel Availability (AM) and Materiel Reliability (RM), while taking advantage of Should Cost14 opportunities to reduce projected O&S costs. Trade-offs between supportability and other design constraints (weight, size, bandwidth, etc.) result in maturing design within the budget and schedule. The product support models used for inventory planning, manpower planning, training, planning, etc., are updated with actual versus estimated data as it becomes available during this phase of development. Reliability growth success/issues are assessed and adjustments to the product support solution are made to accommodate projected demand for logistics resources. It is critical to have robust testing to ensure reliability requirements are being met. As the design matures, the trade space for sustainment solutions narrows and the sustainment strategy becomes more refined. For this reason, it is extremely important to consider future PBLs during weapon system development. PBL considerations should be part of the Production/Quality Assurance (QA) process since repair processes (included in the PBL) are impacted by production build decisions. Production and Deployment 1.6.4. During Operational Test and Evaluation (OT&E)/Production (Low-Rate Initial Production (LRIP) and Full-Rate Production (FRP))/Deployment phases, issues identified through various tests, demonstrations, and other evaluation techniques are addressed and remediation plans are executed. LRIP for MAIS programs and other software systems is typically limited deployment or limited fielding. As products are fielded and logistics demand can be reasonably forecasted, performance-based arrangements can be implemented. Early in this phase, shorter-term cost-type arrangements may be appropriate until sufficient cost data and technical data on failure modes and rates and field reliability data are accumulated in conjunction with design stability. Later arrangements may use a combination of fixed-price contracts with incentives and other considerations as design matures, tailoring the contract type to the appropriate level of design maturity and stability. Longer-term fixed price-type arrangements that incentivize continuous process and product improvement at a reduced cost are appropriate with a reasonable ability to forecast demand, and assess risk and cost impacts. PPPs are an excellent way to leverage the best of Government and commercial expertise. The commercial PSI or PSP provides lean repair processes, a responsive supply chain for bit/piece parts, and sustaining engineering. The public sector provides a skilled workforce at very competitive labor rates and repair and transportation assets. Once fielded, the performance-based solution and associated arrangements are measured against their ability to meet planned AM, RM, O&S cost, and other sustainment metrics required to support the Warfighter. 14 Discussion of “Should Cost” can be found in Better Buying Power 2.0 at http://bbp.dau.mil/bbp2focus.html
  • 21. PBL Guidebook Section 1: Background 20 Operations and Support 1.6.5. The Operations and Support phase of a system or product life cycle is the longest phase of the life cycle and generates the largest portion of LCC—approximately 60–75 percent depending on the weapon system category—even though the ability to influence LCC is reduced at this point. The ability to implement and execute performance-based arrangements provides the greatest opportunity to positively impact LCCs while satisfying Warfighter requirements. Software support considerations are uniquely different that those of hardware support.15 Hardware support activities are typically dominated by preventive and corrective maintenance. When software fails, the software engineer does not replace the offending code with an identical piece of code, but rather must modify the code to provide the needed functionality. Software modification is undertaken to defect corrections, address policy or doctrine, ensure safety, enable interoperability, reflect hardware changes, accommodate technology insertion, and incorporate functional changes. While hardware improvements are incorporated for these reasons as well, as stated above, they do not represent the routine reason for repair. Software support costs include the update, maintenance and modification, integration, and configuration management of software. The respective costs of operating and maintaining the Software Support Environment (SSE) (the associated computer/peripheral equipment and associated software dedicated to performing software maintenance) and the cost to conduct all testing of the software are also be included. Other costs may include licensing fees for commercial software and accreditation of processes and facilities. The identification and establishment of Software Support Activity (SSA) is often the first step in the preparation of post-production software support. The SSA typically assumes the role of providing post-deployment life cycle support for modifications or upgrades made to a system’s software following the system’s initial fielding. The SSA can be an organic or commercial activity or a mixture of both, and is often established via performance-based arrangements. Table 5 displays circumstances where PBL arrangements should be considered. PBL arrangement(s) should be considered under the following circumstances: Issue: System availability or derivative subrequirement for subsystem or component is consistently below the required threshold Opportunity: Part demand and/or labor hour requirements have achieved a level of predictability post-fielding that supports consistency of pricing in the market of potential product support providers Opportunity: Number of potential product support providers is sufficiently large to serve as a competitive market, or leverage16 exists to structure internal competitive pressure in a limited or sole-source situation 15 NAVAIR Software Logistics Primer Version 1.0 DTD August 2008 (https://acc.dau.mil/CommunityBrowser.aspx?id=203465) 16 The government is often in a position to structure the terms of an arrangement to increase product quality and process efficiency even in the absence of a competitive marketplace
  • 22. PBL Guidebook Section 1: Background 21 Opportunity: Sufficient operational life remains (typically five to seven years) in the product as an attractive capital investment opportunity for potential providers Opportunity: Common subsystems or components among platforms and/or Services that, when combined, improve the Government’s negotiating leverage and offer industry the opportunity to benefit from scale economies Opportunity: Actual sustainment costs exceed programed resources, life cycle cost estimates, or should cost management efforts indicate an opportunity to lower the cost of required performance Table 5: When to Pursue a Change in Product Support Strategy Product support solution performance is continuously monitored by the PSM during the Operations and Support phase, and provider performance is measured with metrics commensurate with the delegated responsibility. Technical and product data delivered as part of the product support solution facilitate this process and provide the PM/PSM the opportunity to reallocate resources and/or recompete aspects of the support solution as appropriate.
  • 23. PBL Guidebook Section 2: Standard and Repeatable Processes for PBL 22 2. Standard and Repeatable Processes (S&RP) for PBL A gap identified by DoD through the course of the OSD-chartered PBL study (Proof Point) was the need for standardized repeatable processes to facilitate effective performance-based PSAs. The processes and procedures described herein are intended to fill that gap. Users are reminded that PBL arrangements are not “one size fits all,” and the development processes should be tailored to the specific needs of their program as appropriate. This document will assist the Program Office in the creation, management, renegotiation, and/or resolicitation of performance- based arrangements, realizing that this process may involve more rigor than current transactional arrangements. The S&RP follows the 12-Step Product Support Strategy Process Model found in the PSM Guidebook. The PBL Guidebook provides complementary information on specific activities within each of the existing 12-Step processes and focuses on the “how” regarding PBL arrangement development and execution. The 12-Step model is a repeatable process that facilitates the successful accomplishment of these activities. The model should not be seen as rigid, but instead as flexible to support the unique needs of individual programs. The steps may be performed in a different order, or they may be repeated or deleted depending on the life cycle phase and program requirements. Figure 4 illustrates the 12-Step Product Support Strategy Process Model. This model provides the framework for the S&RP. Figure 4. The DoD Product Support Strategy Process Model17 17 PSM Guidebook (April, 2011)
  • 24. PBL Guidebook Section 2: Standard and Repeatable Processes for PBL 23 Throughout this section, a notional Generic Subsystem (GSS) is used to illustrate in practical terms the content of the preceding associated step. In the GSS use case, the PBL strategy is being considered after fielding, which is a common practice. However, guidance on developing PBL strategies during the development phase(s) of a program is also addressed throughout the document (See blue “Developmental System Consideration” boxes at the end of each step). While consideration of PBL arrangements throughout the life cycle is appropriate, consideration early in development provides the program with the greatest latitude to achieve the required performance at lower cost during sustainment.
  • 25. PBL Guidebook Section 2: Step 1 Integrate Warfighter Requirements & Support 24 Step 1. Integrate Warfighter Requirements & Support 2.1. Introduction 2.1.1. When considering a sustainment strategy, the Program Office team (for Major Defense Acquisition Programs (MDAP) and Major Automated Information Systems (MAIS) should always start in the same place: identifying Warfighter requirements. The objective of product support is to execute a sustainment strategy that delivers affordable readiness, defined as providing mission capability to the Warfighter at the lowest possible cost to the taxpayer. The first step in developing a product support strategy is to identify the operational requirements for the system being supported— even if the PSM is considering a PBL at the subsystem or component level that utilizes a decomposition of AM or AO as the assigned metric. Step 1 is particularly important when structuring a performance-based logistics arrangement, as the outcome will be derived from Warfighter requirements. In order to properly align the objectives of the PO and the PSI and PSP, it is crucial to understand the Warfighter’s requirements for system performance. In most cases, the Warfighter’s requirement will be some form of availability and reliability allocated by the program to the system, subsystem, or component level. The Joint Requirements Oversight Council (JROC) requires a sustainment Key Performance Parameter (KPP) for all Acquisition Category (ACAT) I and select ACAT II programs. The Sustainment KPP consists of two elements: AM and AO. JROC also requires two sustainment Key System Attributes: Reliability and O&S Cost. More information is available in the Joint Capabilities Integration Development System (JCIDS) Manual and the Defense Acquisition Guidebook. Table 6 lists the life cycle sustainment requirements. Key Life Cycle Sustainment Requirements Sustainment Key Performance Parameter (KPP) Materiel Availability (AM) AM is the measure of the percentage of the total inventory of a system operationally capable, based on materiel condition, to perform an assigned mission. This can be expressed as the number of operationally available end items/total population. This metric is not applicable to nonmateriel solutions.18 Operational Availability (AO) AO is the measure of the percentage of time that a system or group of systems within a unit are operationally capable to perform an assigned mission and can be expressed as uptime/(uptime + downtime). Sustainment Key System Attributes (KSA) Reliability RM is a measure of the probability that the system will perform without failure over a specific interval, under specified conditions. More than one reliability metric may be specified for a system as appropriate. 18 A Nonmateriel Solution changes doctrine, organization, training, materiel, leadership and education, personnel, facilities, or policy (including all human systems integration domains) to satisfy identified functional capabilities. The materiel portion is restricted to commercial or nondevelopmental items, which may be purchased commercially, or by purchasing more systems from an existing materiel program.
  • 26. PBL Guidebook Section 2: Step 1 Integrate Warfighter Requirements & Support 25 Operating& Support (O&S) Cost Total O&S costs associated with achieving AM. Table 6: JCIDS Sustainment Requirements How is AM related to AO? As shown in Figure 5, AO is typically a subset of AM. AO is measured as a snapshot, the number of assets that are mission capable assigned to a unit at a given point in time; while AM reflects the total inventory of a system at a given point in time from placement into operational service through the planned end-of-service life. AM is typically the appropriate metric for expressing the Warfighter’s product support requirements. Figure 5: Relationship between AO and AM Process 2.1.2. As stated in the interim version of DoDI 5000.02 (2013), “the Program Manager will deploy the product support package and monitor its performance according to the Life Cycle Sustainment Plan (LCSP)…a successful program meets the sustainment performance requirements, remains affordable, and continues to seek cost reductions by applying “should cost” management and other techniques…doing so requires close coordination with the war fighting sponsor (i.e., user), resource sponsors, and materiel enterprise stake holders, along with effective management of support arrangements and contracts.” The PM/PSM is responsible for communicating the Warfighter requirements to the PSI/PSPs and determining the appropriate method for allocating the requirements in PBL arrangements. Warfighter requirements are set by the operational commands or Service requirements offices through the JCIDS process and formalized in the JCDIS requirements documents. How the PM will address them may be further articulated in the arrangmeent between the PM and the Warfighter command(s). If the sustainment objective for the platform or end item has not already been explicitly documented, the platform-level PSM should work with the Warfighter to establish an arrangement that designates the top-level sustainment outcome and supporting metrics as appropriate.
  • 27. PBL Guidebook Section 2: Step 1 Integrate Warfighter Requirements & Support 26 The requirements and associated metrics should be defined during the Material Solution Analysis (MSA) phase and ultimately documented in the Capability Development Document (CDD). The PM, with the service requirements officer, may negotiate revisions to the requirements as the system design and sustainment strategy matures. An Integrated Data Environment (IDE) is a useful tool in tracking and managing requirements as the program design evolves. The PM and PSM should review and revalidate the requirements and threshold values with the operational commands to identify the threshold value for this metric (e.g., AM of 85%). Revalidation is particularly important when test data and operational performance data become available. Conclusion 2.1.3. The PM/PSM should coordinate with Warfighter representatives to ensure product support requirements are identified/documented and threshold values are established/updated. Identifying Warfighter requirements is the first step toward establishing a PBL arrangement. Many PBL arrangements are executed at the subsystem or component level, and the system-level requirement should be decomposed to lower-level metrics appropriate for the level of responsibility and risk assigned to the PSI and PSP. These are the metrics that will be included in the PBL arrangement and the outcomes of these arrangements must be linked to the overall system-level requirements. Concepts in Action: GSS Use Case 2.1.4. The PM for GSS has decided to investigate if a PBL arrangement may help in achieving the sustainment strategy for the subsystem. After reviewing the material in Section 1, the PM is ready to proceed with the first step: identifying Warfighter requirements. The GSS is installed on a larger platform, and the sustainment requirements for the GSS are derived from the operational requirements for this platform. The platform has an Operational Availability (AO) target of 90%, as determined by the units for the platform. Based on the failure rates of the GSS and the size of the inventory, the PSM has calculated that the AM requirement for the GSS is 85%. The current inventory of complete GSS assemblies exceeds the fleet size of the platform end item. As long as 85% of the inventory is operationally capable, the system-level AO target of 90% can be met. In addition, the GSS is on average responsible for less than one percent of the Non-Mission Capable (NMC) end items. If the GSS were a significant readiness driver for the end item, the PSM may have considered a higher AM target. It is sometimes difficult to link the availability requirements for an individual subsystem to the platform-level requirements, but with the right data (i.e., data that indicate how the subsystem is impacting system availability) and in cooperation with the platform-level PSM (if different from the subsystem PSM), these metrics can be derived. Step 1: Developmental System Considerations For pre-production systems, the sustainment requirements are defined during the Material Solution Analysis (MSA) phase and ultimately documented in the Capability Development Document. It is important that the sustainment strategy is carefully examined, and the design and contract needs are specified before Milestone B to preserve the greatest latitude after Milestone C. Among the areas requiring close review are the intellectual property strategy, cost/reliability trade-offs, performance, obsolescence, and logistics footprint. The Government’s options for commercial competition and stand-up of organic capability is contingent upon securing the relevant technical data, license agreements, software documentation, software, and any other applicable intellectual property.
  • 28. PBL Guidebook Section 2: Step 2 Form the Product Support Management IPT 27 Step 2. Form the Product Support Management IPT 2.2. Introduction 2.2.1. The second step of the 12-Step process is for the PSM to leverage the subject matter expertise within the PO, supplemented by PBL experts in the supply chain and user organizations, to form a Product Support Management IPT (PSMIPT). The PSMIPT is a collaborative working body comprising key program staff and stakeholders whose purpose is to develop a product support solution. The PSM is responsible to the PM for the management and oversight of life cycle product support for the materiel system and software, and the PSM must establish and lead the PSMIPT to ensure its collective input, expertise, and support are leveraged to address the multitude of required supportability tasks. There are various disciplines represented within the PSMIPT, including Life Cycle Logistics, Engineering, Finance, Contracting, Legal, and individuals from other functional groups specific to the program and life cycle needs. For software intensive programs, it is critical to embed software representatives early in the program to ensure software-unique management issues are addressed. Representatives of the PSMIPT will collaborate to deliver an integrated, affordable product support package that includes appropriate arrangements, both organic and commercial. The PSM maintains the PSMIPT throughout the program life cycle, as this body will be tasked with supporting the PSM in defining, developing, and implementing the product support strategy. The PSMIPT will also support the PM and PSM in preparing for milestone reviews and Independent Logistics Assessments (ILA). PSMs should ensure that members possess appropriate PBL expertise to help maximize opportunities for performance-based arrangements in the program’s support strategy. Process 2.2.2. The PSMIPT is led by the PSM and should include all appropriate stakeholders, including Warfighter representatives. The team may consist of both Government and commercial functional experts. It is crucial that all members are able to work collaboratively, regardless of their organizational alignment or sustainment preferences and objectives. The core PSMIPT members are responsible for assisting the PSM with planning, developing, and implementing the product support strategy, and overseeing the product support performance. Additional stakeholders and subject matter experts (SME) involved in sustainment will be consulted as their expertise is required. In Figure 6, a typical PSMIPT is shown, with the suggested core team outlined in blue.
  • 29. PBL Guidebook Section 2: Step 2 Form the Product Support Management IPT 28 Figure 6. Product Support Management IPT19 The composition of a structured PSMIPT drives the success of pre-execution efforts such as the issuance of contracts with industry or establishment of intragovernmental Memorandums of Understanding (MOU) or MOA. The team also ensures the proper transition into ongoing performance management activities. After the PSMIPT is assembled, the members should determine their goals, develop Plans of Action and Milestones (POA&M), and obtain adequate resources. Adequate funding can be among the most challenging issues the PSMIPT must manage when implementing a PBL arrangement. A best practice that can mitigate funding constraints to PBL implementation is for the PSMIPT to include representatives from the Service resource sponsor and the materiel command responsible for managing Operations and Maintenance (O&M) funding for the fielded system. These representatives can inform the team on planning factors driving the choice of funding mechanism (e.g., direct appropriation, working capital fund) and appropriation type (e.g., Procurement, O&M). 19 PSM Guidebook (April, 2011) section 4 PBL Leading Practice(s) Leverage PBL expertise and lessons learned from other Program Offices with similar systems, PBL Award Winners, and PBL SMEs within DoD.
  • 30. PBL Guidebook Section 2: Step 2 Form the Product Support Management IPT 29 The PSM should develop a PSMIPT charter, which outlines the activities, roles, responsibilities, key deliverables, initial implementation project plan, and an executive summary review schedule. The charter should also include the names, contact information, alternates, and expected time commitments from the participants. See Appendix B for a sample PSMIPT charter. The PSMIPT should be included among the management groups listed in the LCSP. Table 7 lists the principles for establishing the PSMIPT. PSMIPT Principles • When establishing the PSMIPT, the PSM should: o Streamline the membership to include only relevant stakeholders and SMEs. Add or remove members as necessary to ensure the right mix of expertise is available and utilized when needed. o Ensure the team members have a life-cycle perspective of cost, risk, and benefits. o Facilitate buy-in from all team members by soliciting open and honest communication and developing trust and mutual respect among members. o Ensure that Non-Disclosure Agreements (NDA) are in place for any contracted advisory assistance that will be part of the IPT. NDAs are particularly important when the program expects the OEM or other vendors to provide proprietary data. • The team should focus on life-cycle management, involving sustainment in all aspects of the product life cycle. This includes recommending potential design changes that facilitate application of PBL strategies to meet requirements and reduce costs. Table 7: PSMIPT Principles Throughout each of the 12 steps, the PSMIPT should periodically review the status and risks in developing the LCSP and associated arrangement. Summaries of these reviews should be used to inform the PSM and brief the PM on the IPT’s progress. Detailed discussion on required expertise and training for the team is provided in Appendix C. Conclusion 2.2.3. The result of Step 2 should be a cohesive product support team that is fully trained on PBL fundamentals and has a thorough understanding of the benefits associated with an outcome-based product support strategy. Concepts in Action: GSS Use Case 2.2.4. The PSM for the GSS assembled the PSMIPT with the representatives listed in Figure 6, including a representative from a program who successfully implemented a PBL arrangement on a similar subsystem arrangement. The PSM conducted a baseline survey (see example in Appendix C) to determine the experience level of each team member. Only one team member had previously implemented a PBL arrangement. Some members had taken Step 2: Developmental System Considerations The PM/PSM should engage engineering and sustainment SMEs who can estimate the impact of sustainment cost and performance. The team might use system modeling/simulation or an evaluation of similar deployed systems to estimate the performance and cost of the system when it reaches sustainment. A thorough evaluation of the impact of engineering design trade-offs on the sustainment strategy will inform the PSMIPT regarding the magnitude of constraints it will face in developing PBL arrangements.
  • 31. PBL Guidebook Section 2: Step 2 Form the Product Support Management IPT 30 DAU’s course on performance-based logistics (LOG 235). The PSM encouraged the team members to read OSD guidance and the DoD Business Case Analysis (BCA) Guidebook in preparation for the knowledge transfer workshop. The PSM hosted a kickoff session for all of the PSMIPT members where the objectives, timeline, roles, and responsibilities for the PBL implementation were outlined.
  • 32. PBL Guidebook Section 2: Step 3 Baseline the System 31 Step 3. Baseline the System 2.3. Introduction 2.3.1. This step assesses the “As-Is” product support strategy, plan, and arrangements and determines if further analysis is warranted to change the plan from its current baseline. The “As-Is” analysis identifies possible impediments and improvement opportunities. This step is conducted in three phases: data gathering, data review and analysis, and recommendation generation. This step is intended to be a quick assessment designed to give the program insight as to whether an alternative performance-based strategy is feasible and if more detailed analysis should be conducted. Part of this step will include evaluating data in the Product Support Package. This assessment provides sufficient decision-making information to determine if an investment in more detailed analysis is warranted. For a new system, establishing an initial baseline requires engineering and supportability data. The initial baseline should be established at Milestone A; however, this may only be possible at a higher level of the hardware or software description. The program’s confidence in the assessment is limited by its ability to allocate performance measures lower than major subsystems (e.g., structure, propulsion, and mission equipment). During the earlier life cycle phases, analogous data from similar systems are required to project the system’s baseline. As the program advances to later milestones, additional data will be available from systems engineering and product support analyses (e.g., the Reliability, Maintainability, and Diagnostics predictions, Failure Mode, Effects & Criticality Analysis (FMECA), Failure Reporting and Corrective Action System (FRACAS), Level of Repair Analysis (LORA), Maintenance Task Analysis (MTA), Reliability-Centered Maintenance (RCM) analysis, and Reliability, Availability, and Maintainability (RAM) and LCC analyses). For fielded systems, this step begins with the inventory of assets and services that will be considered among the PBL arrangement alternatives. The PSMIPT should scope the diagnostic to an appropriate level (system, subsystem, components), potentially spanning multiple programs or even Services. The PSMIPT should also consider the product support elements that should be included in the alternatives. This step produces a recommendation for continued analysis based upon the feasibility of, and the potential benefit from, a change in strategy. Additionally, this recommendation will include whether a system, subsystem, or component-level PBL arrangement is most appropriate. If the result of the diagnostic indicates that an alternative strategy with performance-based arrangement(s) can maintain or improve performance, and PBL Leading Practice If a program is in development, data availability will evolve as the platform progresses through its life cycle and should be given appropriate attention when available. This process includes replacing estimates with actual data or refining estimates that resulted from test and operational experiences. PBL Leading Practice(s) Potential PBL arrangement candidates for fielded programs may have the following characteristics: legacy systems with poor reliability, system availability, obsolescence issues, and increasing repair costs.
  • 33. PBL Guidebook Section 2: Step 3 Baseline the System 32 reduce costs for the program, a decision to proceed with more detailed analysis (if needed) to evaluate performance-based alternatives will be made by the PM. Process 2.3.2. The PSMIPT, along with the representatives of the materiel command as appropriate, should consider the questions in Table 8. The answers to these questions will provide the team with an initial understanding of the opportunities for improvement to the baseline. Factors Initial questions that inform potential benefit Cost • How many systems, subsystems, or components under consideration are in the system (e.g., 256 F117 engines inducted per year)? • What will it cost to field new infrastructure (organic or commercial) or to modify the current infrastructure? • How much does the system cost (specifically the replacement cost of the system or subsystem)? • What is the projected annual spending to support the system (i.e., does the annual spend support time required to analyze alternatives)? • Is the number of potential product support providers sufficient to serve as a competitive market, or does leverage exist to structure internal competitive pressure in a limited or sole-source situation? • Have part demand and/or labor hour requirements achieved a level of predictability post-fielding that support consistency of pricing in the market of potential product support providers? • Are there common subsystems or components among platforms and/or Services that, when combined, improve the Government’s negotiating leverage and offer industry the opportunity to benefit from scale economies? • Is there an opportunity to lower the sustainment cost to achieve the required operational performance? Readiness • Is the system availability or the derivative requirement for subsystem or component consistently below or projected to be below the required threshold? • How are the systems, subsystems, or components in question being supported today? Other factors • Is there sufficient operational life remaining (typically five to seven years) in the product to warrant a change to the support solution and be an attractive investment opportunity for potential providers? • Are there any planned upgrades, service life extension programs, or overhauls? • How is the PO organized? Where do logistics, maintenance, finance, and contracting competencies fit within the PO? Table 8: Initial Questions for Cost, Readiness, and Other Factors Phase 1: Data Gathering 2.3.2.1. Data gathering begins with the development of a data collection plan. The data collection plan lists the needed information. The information gathered will help the team understand the current
  • 34. PBL Guidebook Section 2: Step 3 Baseline the System 33 system readiness and the overall product support strategy to provide a foundation for analysis. This phase includes interviews with appropriate stakeholders and an analysis of the product support policy and other supporting documentation. The plan does not have to be elaborate or complex, but should be comprehensive. The complexity will be dependent on the program, including its life cycle stage. It can be as simple as a two-page outline. The data collection plan should include the data source to establish accountability and improve the accuracy and the traceability of the data collected for any necessary follow ups. The PSMIPT should ensure that the data is accurate, timely, and relevant to the Alternatives being assessed. The data collection plan should categorize the needed data using the following priorities: The team should document each meeting, interview, and received data, so individuals not present can easily access and understand the findings. The data should be placed in a central location for all members to access. Some of the data generated and analyzed will be done by a contractor, while other data may be generated/analyzed by the Government. Data delivered under contract should contain markings to indicate if there are any restrictions to the Government’s ability to use, modify, reproduce, release, perform, display, or disclose that data. These markings must be reviewed, challenged, and/or corrected when appropriate. Not all data needs to be obtained prior to commencing the next phase. The team should continue to monitor the data received throughout phases 1 and 2, and follow up to ensure remaining data are received before the completion of phase 2. Table 9 details the work required to complete the Data Gathering phase. Activity Description Identify the Data/ Documentation Required to Conduct the Baseline the System Step Identify required and useful current and historical data to develop a full understanding of the program or, if in the design phase, any analogous program’s current state. Examples of pertinent data include: • Remaining useful life • Number of assets in inventory • Historic/projected sustainment spend • Current/historic projected readiness levels • Current/historic sustainment strategy • Current/historic configuration management procedures Priority 1: Necessary to begin the analysis Priority 2: Necessary to complete the analysis Priority 3: Beneficial to develop a more robust analysis, but not essential
  • 35. PBL Guidebook Section 2: Step 3 Baseline the System 34 For new systems data sources include: • Reliability, Maintainability, and Diagnostics predictions • Failure Mode, Effects, and Criticality Analysis (FMECA) • Failure Reporting and Corrective Action System (FRACAS) • Level of Repair Analysis (LORA) • Maintenance Task Analysis (MTA) • Reliability-Centered Maintenance (RCM) analysis • Reliability, Availability, and Maintainability (RAM) and Life Cycle Cost (LCC) analyses Develop a Data Collection Plan20 Priorities for data collection may be: • Priority 1 – data necessary to develop an initial understanding of the situation and help prepare users for interviews • Priority 2 – data necessary to complete the baseline step • Priority 3 – data that would benefit the robustness of the baseline, but is not necessary Execute Data Collection Plan • Request, collect, organize, and review the documentation • Prepare for and schedule interview(s) • Meet with stakeholders to document the existing processes for procurement, maintenance/repair, and overhaul Perform Initial Interviews Meet with stakeholders to obtain input on the current state of the sustainment strategy Verify Required Information has Been Gathered Perform a reconciliation of obtained documents, prioritize/remove documents accordingly, and make additional requests for data as necessary Extract/Summarize Key Details Summarize the key information for each document and interview to facilitate analysis Table 9: Phase 1: Data-Gathering Activities Phase 2. Data review and analysis. 2.3.2.2. This phase consists of a top-level analysis to determine the need for further analysis. The PO should work with stakeholders to determine material flow relationships, cycle times, labor requirements, and other process elements using existing process maps. The process map will help the team visualize the entire supply chain and will enable the PSM IPT to find high-level opportunities to improve the product support strategy. The process map should include the specific activities involved in the supply chain, including supply support, maintenance, repair, and overhaul or other IPS elements as appropriate. If no process maps have been created in the past or they are insufficient in detail or scope, the PO may choose to develop or augment process maps of the current (and desired future) state. If a detailed process map has already been documented, then stakeholders should meet to review and validate it. 20 The data collection plan is a working document for use by the PSMIPT and is not intended to be a formal program plan.
  • 36. PBL Guidebook Section 2: Step 3 Baseline the System 35 Table 10 details the work required to complete the Data Review and Analysis phase. Activity Description Evaluate Data Collected Relative to Other Factors Assess the data collected to determine if a reduction in cost or increase in readiness may be possible through the introduction of a performance-based arrangement. Ensure access to technical data is included in the top-level assessment, as a change in sustainment strategy will be impacted by restrictions (or a lack thereof). Analyze Feasibility Perform a feasibility check for the likelihood of PBL implementation. Analyze Timing From the data collected and interviews performed, decide if the program is ready to transition to a new PSA at this time or in the future. Estimate Cost Savings and Performance Improvements Determine if significant costs savings and/or readiness improvements can be achieved through a change in the PSA. Table 10: Phase 2: Data Review and Analysis Process Steps Factor suggestions for the analysis are included below. They are not meant to be prescriptive or a “one-size-fits-all” aggregation of data needs for diagnostic purposes. These product support elements are listed because they are routinely where most of the O&S costs occur. However, each program should determine which IPS elements are the drivers for their program/product and thus need to be evaluated. In Table 11, the key considerations for impacting readiness and cost are shown. Factors Key Considerations Maintenance Planning and Management 1. Is the current maintenance planning and management strategy satisfying Warfighter requirements? 2. Can the maintenance process (fault reporting, transportation, workload management, etc.) be made more efficient? 3. Are there any substantial delays in the repair process? 4. Can sustainment planning and demand forecasting be more accurate and efficient through the introduction of performance incentives? Supply Support 1. Is the supply support strategy satisfying Warfighter requirements? 2. Can the supporting supply chains be made more efficient through the introduction of performance incentives? 3. Are there any substantial delays in the procurement process for spare parts or new units? 4. Are there significant inventory build-ups at any stage in the supply chain due to overproduction or quality issues? 5. Are there any Diminished Manufacturing Sources and Material Shortage (DMSMS) concerns?
  • 37. PBL Guidebook Section 2: Step 3 Baseline the System 36 Market Space for Sustainment Providers 1. What is the current competitive landscape for product support providers? For suppliers of new and repair parts? Are there alternate organic sources (i.e., from another location or another Service)? 2. Does the organic workforce have access to applicable technical data for repair? 3. What is the scope of the opportunity? Funding Mechanism 1. Does the available funding mechanism (e.g.,Working Capital Fund (WCF), Operations and Maintenance (O&M) funding) allow for a long-term performance-based arrangement? 2. If not, what other funding mechanisms may be available? Stakeholder Alignment and PBL Capabilities 1. Organic PBL Commitment: Is there support from leadership and/or from the PO? 2. Organic PBL Capability: Are the requisite knowledge and skills present? Are there sufficient resources available for implementation? 3. Commercial PBL Commitment: Is there interest from the current/potential PSP/PSI, OEM, or other commercial firms? 4. Commercial PBL Capability: Are the requisite knowledge and skills present? Are there sufficient resources available for implementation? 5. Trust and Transparency: Is there significant trust and transparency among key stakeholders? 6. Are there PPP opportunities available between potential organic and commercial support providers? Timing 1. Stage in life cycle: Is it the right time for a change in sustainment strategy? Is there sufficient remaining service life for a transition to be worthwhile? 2. What is the state of emerging technology? 3. Existing contracts: Are there any conflicting contractual arrangements? 4. Operating environment: Is change feasible under projected Operational Tempo (OPTEMPO)? Program-Specific Considerations 1. Are there any program-specific barriers or major opportunities? Table 11: Factors to Consider when Assessing Readiness and Cost An expansion of the key considerations can be found in Appendix E. Phase 3: Recommendation Generation 2.3.2.3. The Recommendation Generation phase synthesizes the net evaluation of all factors to produce recommendations regarding the feasibility and potential opportunities. The team should review the opportunities identified in Phase 2. Then, a weighting and scoring of data should be performed based on the criteria’s level of importance to the program. The results from this analysis should be used to inform further data collection and to identify any points requiring
  • 38. PBL Guidebook Section 2: Step 3 Baseline the System 37 clarification before making a final determination of feasibility. The feasibility analysis will generate two possible recommendations: a PBL arrangement is feasible or not. In those cases where a performance-based logistics arrangement(s) is found to be a viable strategy, a more detailed analysis may be required. If pursuing a performance-based arrangement is deemed the inappropriate course of action (CoA), the PM/PSM should still ensure their current plan is designed to support the Warfighter requirements at the lowest possible costs, and document their decisions in the LCSP and other documentation as appropriate. The PSMIPT should consider making specific recommendations to guide additional analysis. A best practice when generating a recommendation is to consider and identify CoA and determine the degree that a more detailed analysis is warranted to support the product support strategy decisions. Table 12 provides a high-level view of requirements for Phase 3. Process Step Description Review the Description of the Program Review the description of the program to provide context and verify a common understanding. Review Performance Requirements for Current State If performance requirements exist, review the requirements and the current state of the program (e.g., metrics, sustainment costs) relative to the requirements. If performance requirements are absent, provide initial performance requirements as part of the recommendation. Review Phase 2 Analysis Review the current product support strategy and show the benefits and disadvantages based on the findings. Create a Recommendation Generate product support analysis recommendations and obtain a decision from the Decision Authority for the development and evaluation of product support alternatives. Table 12: Phase 3 Recommendation Generation Process Steps Conclusion 2.3.3. The end of this step will conclude with a “Go/No-Go” recommendation for continued analysis based upon the feasibility of, and the potential benefit from, a change in sustainment strategy to a PBL arrangement. The PO should review the opportunities in cost savings and readiness improvements that a PBL strategy would provide and should explore potential alternatives in Steps 5 and 6. Concepts in Action: 2.3.4. GSS Use Case The PSM identified the necessary information using the data-gathering Step 3: Developmental System Considerations For new programs, the baseline step should include an examination of the cost to support the replaced systems. If there is no antecedent system, LCC estimates should be used. The following data may be considered: • Reliability, maintainability, and diagnostics predictions • Failure Modes Effects and Criticality Analysis (FMECA) • Failure Reporting and Corrective Action System (FRACAS) • Level of Repair Analysis (LORA) • Maintenance Task Analysis (MTA) • Reliability-Centered Maintenance (RCM) analysis • Reliability, Availability, and Maintainability (RAM) and Life Cycle Cost (LCC) analyses