
Recommended
Recommended
More Related Content
Similar to Ch05 P24 Build a Model Spring 1, 201372212Chapter 5. Ch 05 P24 B.docx
Similar to Ch05 P24 Build a Model Spring 1, 201372212Chapter 5. Ch 05 P24 B.docx (13)
More from tidwellveronique
More from tidwellveronique (20)
Recently uploaded
Recently uploaded (20)
Ch05 P24 Build a Model Spring 1, 201372212Chapter 5. Ch 05 P24 B.docx
- 1. Ch05 P24 Build a Model Spring 1, 20137/22/12Chapter 5. Ch 05 P24 Build a ModelExcept for charts and answers that must be written, only Excel formulas that use cell references or functions will be accepted for credit. Numeric answers in cells will not be accepted.A 20-year, 8% semiannual coupon bond with a par value of $1,000 may be called in 5 years at a call price of $1,040. The bond sells for $1,100. (Assume that the bond has just been issued.)Basic Input Data:Years to maturity:20Periods per year:2Periods to maturity:Coupon rate:8%Par value:$1,000Periodic payment:Current price$1,100Call price:$1,040Years till callable:5Periods till callable:a. What is the bond's yield to maturity?Periodic YTM =Annualized Nominal YTM = Hint: This is a nominal rate, not the effective rate. Nominal rates are generally quoted.b. What is the bond's current yield?Current yield = Hint: Write formula in words.Current yield =/ Hint: Cell formulas should refer to Input SectionCurrent yield =(Answer)c. What is the bond's capital gain or loss yield?Cap. Gain/loss yield =- Hint: Write formula in words.Cap. Gain/loss yield =- Hint: Cell formulas should refer to Input SectionCap. Gain/loss yield =(Answer)Note that this is an economic loss, not a loss for tax purposes.d. What is the bond's yield to call?Here we can again use the Rate function, but with data related to the call.Peridodic YTC =Annualized Nominal YTC =This is a nominal rate, not the effective rate. Nominal rates are generally quoted.The YTC is lower than the YTM because if the bond is called, the buyer will lose the difference between the call price and the current price in just 4 years, and that loss will offset much of the interest imcome. Note too that the bond is likely to be called and replaced, hence that the YTC will probably be earned.NOW ANSWER THE FOLLOWING NEW QUESTIONS:e. How would the price of the bond be affected by changing the going market interest rate? (Hint: Conduct a sensitivity analysis of price to changes in the going market interest rate for the bond.
- 2. Assume that the bond will be called if and only if the going rate of interest falls below the coupon rate. That is an oversimplification, but assume it anyway for purposes of this problem.)Nominal market rate, r:8%Value of bond if it's not called:Value of bond if it's called: The bond would not be called unless r<coupon.We can use the two valuation formulas to find values under different r's, in a 2-output data table, and then use an IFstatement to determine which value is appropriate:Value of Bond If:Actual value,Not calledCalledconsideringRate, r$0.00$0.00call likehood:0%$0.00$0.00$0.002%$0.00$0.00$0.004%$0.00$0.00$ 0.006%$0.00$0.00$0.008%$0.00$0.00$0.0010%$0.00$0.00$0.0 012%$0.00$0.00$0.0014%$0.00$0.00$0.0016%$0.00$0.00$0.00 f. Now assume the date is 10/25/2010. Assume further that a 12%, 10-year bond was issued on 7/1/2010, pays interest semiannually (January 1 and July 1), and sells for $1,100. Use your spreadsheet to find the bond’s yield.Refer to this chapter's Tool Kit for information about how to use Excel's bond valuation functions. The model finds the price of a bond, but the procedures for finding the yield are similar. Begin by setting up the input data as shown below:Basic info:Settlement (today)MaturityCoupon rateCurrent price (% of par)Redemption (% of par value)Frequency (for semiannual)Basis (360 or 365 day year)Yield to Maturity:Hint: Use the Yield function. For dates, either refer to cells in Basic Info above, or enter the date in quotes, such as "10/25/2010". Sheet27/22/12 Chapter4/11/10Chapter 5. Tool Kit for Bonds, Bond Valuation, and Interest RatesThe value of any financial asset is the present value of the asset's expected future cash flows. The key inputs are (1) the expected cash flows and (2) the appropriate discount rate, given the bond's risk, maturity, and other characteristics. The model developed here analyzes bonds in various ways.BOND VALUATION (Section 5.3)A bond has a 15-year maturity, a 10% annual coupon, and a $1,000 par value. The
- 3. required rate of return (or the yield to maturity) on the bond is 10%, given its risk, maturity, liquidity, and other rates in the economy. What is a fair value for the bond, i.e., its market price?First, we list the key features of the bond as "model inputs":Years to Mat:15Coupon rate:10%Annual Pmt:$100Par value = FV:$1,000Required return, rd:10%The easiest way to solve this problem is to use Excel's PV function. Click fx, then financial, then PV. Then fill inthe menu items as shown in our snapshot in the screen shown just below.Value of bond =$1,000.00Thus, this bond sells at its par value. That situation always exists if the goingrate is equal to the coupon rate.The PV function can only be used if the payments are constant, but that is normally the case for bonds.Bond Prices on Actual DatesThus far we have evaluated bonds assuming that we are at the beginning of an interest payment period. This is correct for new issues, but it is generally not correct for outstanding bonds. However, Excel has several date and time functions, and a bond valuation function that uses the calendar, so we can get exact valuations on any given date.Here is the data for MicroDrive's bond as of the day it was issued.Settlement date (day on which you find bond price) =1/5/11Maturity date =1/5/26Coupon rate =10.00%Required return, rd =10.00%Redemption (100 means the bond pays 100% of its face value at maturity) =100Frequency (# payments per year) =1Basis (1 is for actual number of days in month and year)1Click on fx on the formula bar (or click Insert and then Function). This gives you the "Insert Function" dialog box. To find a bond's price, use the PRICE function (found in the "Financial" category of the "Insert Function dialog box). The PRICE function returns the price per $100 dollars of face value.Using PRICE function with inputs that are cell references:Value of bond based on $100 face value =$100.00Value of bond in dollars based on $1,000 face value =$1,000.00Using the PRICE function with inputs that are not cell references:Value of bond based on $100 face value ==PRICE(DATE(2011,1,5),DATE(2026,1,5),10%,10%,100,1,1) Value of bond based on $100 face value =100.000Value of
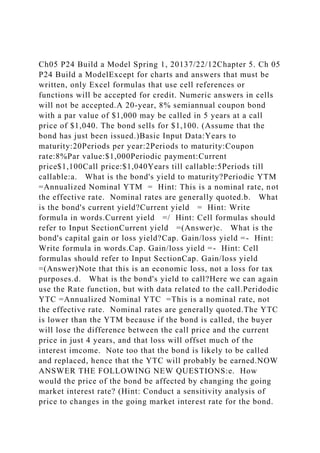
- 4. bond in dollars based on $1,000 face value =$1,000.00Interest Rate Changes and Bond PricesSuppose the going interest rate changed from 10%, falling to 5% or rising to 15%. How would those changes affect the value of the bond?We could simply go to the input data section shown above, change the value for r from 10% to 5% and then 15%, and observe the changed values. An alternative is to set up a data table to show the bond's value at a range of rates, i.e., to show the bond's sensitivity to changes in interest rates. This is done below, and the values at 5% and 15% are boldfaced.Bond ValueTo make the data table, first type the headings, then type the rates in cells A89:A93, and then put the formula =B41 in cell B88, then select the range A88:B93. Then click Data, What-IF-Analysis, and then Table to get the menu. The input data are in a column, so put the cursor on column and enter C20 the place where the going rate is inputted. Click OK to complete the operation and get the table.Going rate, r:$1,0000%$2,500.005%$1,518.9810%$1,000.0015%$707.6320 %$532.45We can use the data table to construct a graph that shows the bond's sensitivity to changing rates.CHANGES IN BOND VALUES OVER TIME (Section 5.4)What happens to a bond price over time? To set up this problem, we will enter the different interest rates, and use the array of cash flows above. The following example operates under the precept that the bond is issued at par ($1,000) in year 0. From this point, the example sets three conditions for interest rates to follow: interest rates stay constant at 10%, interest rates fall to 5%, or interest rates rise to 15%. Then the price of the bond over the fifteen years of its life is determined for each of the scenarios.Suppose interest rates rose to 15% or fell to 5% immediately after the bond was issued, and they remained at the new level for the next 15 years. What would happen to the price of the bond over time?We could set up data tables to get the data for this problem, but instead we simply inserted the PV formula into the following matrix to calculate the value of the bond over time. Note that the formula takes the interest rate from the column heads, and the value of
- 5. N from the left column. Note that the N = 0 values for the 5% and 15% rates are consistent with the results in the data table above. We can also plot the data, as shown in the graph below.Value of Bond in Given Year:N5%10%15%0$1,519$1,000$7081$1,495$1,000$7142$1,4 70$1,000$7213$1,443$1,000$7294$1,415$1,000$7385$1,386$1, 000$7496$1,355$1,000$7617$1,323$1,000$7768$1,289$1,000$ 7929$1,254$1,000$81110$1,216$1,000$83211$1,177$1,000$85 712$1,136$1,000$88613$1,093$1,000$91914$1,048$1,000$957 15$1,000$1,000$1,000If rates fall, the bond goes to a premium, but it moves toward par as maturity approaches. The reverse hold if rates rise and the bond sells at a discount. If the going rate remains equal to the coupon rate, the bond will continue to sell at par. Note that the above graph assumes that interest rates stay constant after the initial change. That is most unlikely--interest rates fluctuate, and so do the prices of outstanding bonds.Market rate =5%NBond PriceReturn Due to Coupon PaymentReturn Due to Price ChangeTotal Return0$1,518.981$1,494.936.58%- 1.58%5.00%2$1,469.686.69%-1.69%5.00%3$1,443.166.80%- 1.80%5.00%4$1,415.326.93%-1.93%5.00%5$1,386.097.07%- 2.07%5.00%6$1,355.397.21%-2.21%5.00%7$1,323.167.38%- 2.38%5.00%8$1,289.327.56%-2.56%5.00%9$1,253.787.76%- 2.76%5.00%10$1,216.477.98%-2.98%5.00%11$1,177.308.22%- 3.22%5.00%12$1,136.168.49%-3.49%5.00%13$1,092.978.80%- 3.80%5.00%14$1,047.629.15%-4.15%5.00%15$1,000.009.55%- 4.55%5.00%Market rate =10%NBond PriceReturn Due to Coupon PaymentReturn Due to Price ChangeTotal Return0$1,0001$1,00010.00%-0.00%10.00%2$1,00010.00%- 0.00%10.00%3$1,00010.00%0.00%10.00%4$1,00010.00%- 0.00%10.00%5$1,00010.00%0.00%10.00%6$1,00010.00%- 0.00%10.00%7$1,00010.00%0.00%10.00%8$1,00010.00%0.00 %10.00%9$1,00010.00%0.00%10.00%10$1,00010.00%0.00%10 .00%11$1,00010.00%- 0.00%10.00%12$1,00010.00%0.00%10.00%13$1,00010.00%0.0 0%10.00%14$1,00010.00%-
- 6. 0.00%10.00%15$1,00010.00%0.00%10.00%Market rate =15%NBond PriceReturn Due to Coupon PaymentReturn Due to Price ChangeTotal Return0$707.631$713.7814.13%0.87%15.00%2$720.8414.01%0 .99%15.00%3$728.9713.87%1.13%15.00%4$738.3113.72%1.28 %15.00%5$749.0613.54%1.46%15.00%6$761.4213.35%1.65%1 5.00%7$775.6313.13%1.87%15.00%8$791.9812.89%2.11%15.0 0%9$810.7812.63%2.37%15.00%10$832.3912.33%2.67%15.00 %11$857.2512.01%2.99%15.00%12$885.8411.67%3.33%15.00 %13$918.7111.29%3.71%15.00%14$956.5210.88%4.12%15.00 %15$1,000.0010.45%4.55%15.00%BONDS WITH SEMIANNUAL COUPONS (Section 5.5)Since most bonds pay interest semiannually, we now look at the valuation of semiannual bonds. We must make three modifications to our original valuation model: (1) divide the coupon payment by 2, (2) multiply the years to maturity by 2, and (3) divide the nominal interest rate by 2.Problem: What is the price of a 15- year, 10% semi-annual coupon, $1,000 par value bond if the nominal rate (the YTM) is 5%? The bond is not callable.Use the Rate function with adjusted data to solve the problem.Periods to maturity = 15*2 =30 Christopher Buzzard: N=30, because of semi-annual compounding (15*2 = 30).Coupon rate:10%Semiannual pmt = $100/2 =$50.00 Bart Kreps: PMT=$50, because of semiannual payments (100 ÷ 2) = 50 PV =$1,523.26Current price:$1,000.00Periodic rate = 5%/2 =2.5% Christopher Buzzard: I=2.5%, because of semi-annual compounding (5%/2 = 2.5%).Note that the bond is now more valuable, because interest payments come in faster.BOND YIELDS (Section 5.6)Yield to MaturityThe YTM is defined as the rate of return that will be earned if a bond makes all
- 7. scheduled payments and is held to maturity. The YTM is the same as the total rate of return discussed in the chapter, and it can also be interpreted as the "promised rate of return," or the return to investors if all promised payments are made. The YTM for a bond that sells at par consists entirely of an interest yield. However, if the bond sells at any price other than its par value, the YTM consists of the interest yield together with a positive or negative capital gains yield. The YTM can be determined by solving the bond value formula for I. However, an easier method for finding it is to use Excel's Rate function. Since the price of a bond is simply the sum of the present values of its cash flows, so we can use the time value of money techniques to solve these problems.Problem: Suppose that you are offered a 14-year, 10% annual coupon, $1,000 par value bond at a price of $1,494.93. What is the Yield to Maturity of the bond?Use the Rate function to solve the problem.Years to Mat:14Coupon rate:10%Annual Pmt:$100.00Going rate, r =YTM:5.00%Current price:$1,494.93Par value = FV:$1,000.00The yield-to-maturity is the same as the expected rate of return only if (1) the probability of default is zero, and (2) the bond can not be called. If there is any chance of default, then there is a chance some payments may not be made. In this case, the expected rate of return will be less than the promised yield-to-maturity.Finding the Yield to Maturity on Actual DatesThus far we have evaluated bonds assuming that we are at the beginning of an interest payment period. This is correct for new issues, but it is generally not correct for outstanding bonds. However, Excel has a function that uses the actual calendar when finding yields. Consider the bond above, with 14 years until maturity. Suppose the actual current date is 1/5/2012, so the bond matures on 1/5/2026.Here is the data for the bond.Settlement date (day on which you find bond price) =01/05/12Maturity date =01/05/26Coupon rate =10.00%Price = bond price per $100 par value =$149.49Redemption (100 means the bond pays 100% of its face value at maturity) =100Frequency (# payments per year) =1Basis (1 is for actual
- 8. number of days in month and year)1Using the YIELD function with inputs that are cell references:Yield to maturity =5.0%Yield to CallThe yield to call is the rate of return investors will receive if their bonds are called. If the issuer has the right to call the bonds, and if interest rates fall, then it would be logical for the issuer to call the bonds and replace them with new bonds that carry a lower coupon. The yield to call (YTC) is found similarly to the YTM. The same formula is used, but years to maturity is replaced with years to call, and the maturity value is replaced with the call price.Problem: Suppose you purchase a 15-year, 10% annual coupon, $1,000 par value bond with a call provision after 10 years at a call price of $1,100. One year later, interest rates have fallen from 10% to 5% causing the value of the bond to rise to $1,494.93. What is the bond's YTC? Note that this is the same bond as in the previous question, but now we assume it can be called.Use the Rate function to solve the problem.Years to call:9 Christopher Buzzard: N is equal to 9, because the bond can be called 10 years after issuance and one year has already gone by.Coupon rate:10%Annual Pmt:$100.00Rate = I = YTC =4.21%Current price:$1,494.93Call price = FV$1,100.00Par value$1,000.00This bond's YTM is 5%, but its YTC is only 4.21%. Which would an investor be more likely to actually earn?This company could call the old bonds, which pay $100 per year, and replace them with bonds that pay somewhere in the vicinity of $50 (or maybe even only $42.10) per year. It would want to save that money, so it would in all likelihood call the bonds. In that case, investors would earn the YTC, so the YTC is the expected return on the bonds.Current YieldThe current yield is the annual interest payment divided by the bond's current price. The current yield provides information regarding the amount of cash income that a bond will generate in a given year. However, it does not account for any capital gains or losses that will be realized fi the bond is held to maturity or call. Problem: What is the current yield on a
- 9. $1,000 par value, 10% annual coupon bond that is currently selling for$985?Simply divide the annual interest payment by the price of the bond. Even if the bond made semiannual payments, we would still use the annual interest.Par value$1,000.00Coupon rate:10%Current Yield =10.15%Annual Pmt:$100.00Current price:$985.00The current yield provides information on a bond's cash return, but it gives no indication of the bond's total return. To see this, consider a zero coupon bond. Since zeros pay no coupon, the current yield is zero because there is no interest income. However, the zero appreciates through time, and its total return clearly exceeds zero.THE DETERMINANTS OF MARKET INTEREST RATES (Section 5.7)Quoted market interest rate = rd = r* + IP + DRP + LP + MRPr* =Real risk-free rate of interestIP =Inflation premiumDRP =Default risk premiumLP =Liquidity premiumMRP =Maturity risk premiumTHE REAL RISK-FREE RATE OF INTEREST, r* (Section 5.8)r* = Real risk-free rate of interestr* = Yield on short-term (1-year) U.S. Treasury Inflation-Protected Security (TIPS)r* = 1.54%(March 2009)THE INFLATION PREMIUM (IP) (Section 5.9)Maturity5 Years20 YearsNon-indexed U.S. Treasury Bond1.91%3.93%TIPS1.41%2.44%Inflation premium0.50%1.49%THE NOMINAL, OR QUOTED, RISK- FREE RATE OF INTEREST, rRF (Section 5.10)Nominal, or quoted, rate = rd = rRF + DRP + LP + MRPTHE DEFAULT RISK PREMIUM (DRP) (Section 5.11)Table 5-1Rating AgencyaPercent defaulting within:bMedian RatioscPercent upgraded or downgraded in 2008:bS&P and FitchMoody’s1 year5 yearsReturn on capitalTotal debt/Total capitalDownUpYieldd(1)(2)(3)(4)(5)(6)(7)(8)(9)Investment grade bonds:AAAAaa0.000.0027.6012.4013.60NA5.50AAAa00.12728 .321.805.62AA0.10.617.537.581.85.79BBBBaa0.32.913.442.56. 42.67.53Junk bonds:BBBa1.48.211.353.715.16.811.62BB1.89.28.775.910.85.6 13.7CCCCaa22.336.93.2113.526.18.726.3Notes: aThe ratings
- 10. agencies also use “modifiers” for bonds rated below triple-A. S&P and Fitch use a plus and minus system; thus, A+ designates the strongest A-rated bonds and A– the weakest. Moody’s uses a 1, 2, or 3 designation, with 1 denoting the strongest and 3 the weakest; thus, within the double-A category, Aa1 is the best, Aa2 is average, and Aa3 is the weakest.bDefault data are from Fitch Ratings Global Corporate Finance 2008 Transition and Default Study, March 5, 2009: see http://www.fitchratings.com/corporate/reports/report_frame.cfm ?rpt_id=428182.cMedian ratios are from Standard & Poor’s 2006 Corporate Ratings Criteria, April 23, 2007: see http://www2.standardandpoors.com/spf/pdf/fixedincome/Corpor ate_Ratings_2006.pdf.dComposite yields for AAA, AA, and A bonds can be found at http://finance.yahoo.com/bonds/composite_bond_rates. Representative yields for BBB, BB, B, and CCC bonds can be found using the bond screener at http://screen.yahoo.com/bonds. .html.Bond spreads are the difference between the yield on a bond and the yield on some other bond of the same maturity.For a bond with good liquidity, its spread relative to a T-bond of similar maturity is a good estmat of the default risk premium.Figure 5-3: Bond SpreadsData for chart to rightDATEAAA - T-bondBAA - T-bond2009-022.405.212009- 012.535.622008-122.636.012008-112.595.682008- 102.475.072008-091.963.622008-081.753.262008- 071.663.152008-061.582.972008-051.693.052008- 041.873.292008-032.003.382008-021.793.082008- 011.592.802007-121.392.552007-111.292.252007- 101.131.952007-091.222.072007-081.121.982007- 070.731.652007-060.691.602007-050.721.642007- 040.781.702007-030.741.712007-020.671.562007- 010.641.582006-120.761.662006-110.731.602006- 100.781.692006-090.791.712006-080.801.712006- 070.761.672006-060.781.67THE LIQUIDITY PREMIUM (LP) (Section 5.12)2006-050.841.642006-040.851.69A differential of at least 2 percentage points (and perhaps up to 4 or 5 percentage
- 11. points) exists between the least liquid and the most liquid financial assets of similar default risk and maturity. 2006- 030.811.692006-020.781.702006-010.871.822005- 120.901.85THE MATURITY RISK PREMIUM (MRP) (Section 5.13)2005-110.881.852005-100.891.84Bonds are exposed to interest rate risk and reinvestment rate risk. The net effect is the maturity risk premium.2005-090.931.832005- 080.831.70Interest Rate Risk2005-070.881.772005- 060.961.86Interest Rate Risk is the risk of a decline in a bond's price due to an increase in interest rates. Price sensitivity to interest rates is greater (1) the longer the maturity and (2) the smaller the coupon payment. Thus, if two bonds have the same coupon, the bond with the longer maturity will have more interest rate sensitivity, and if two bonds have the same maturity, the one with the smaller coupon payment will have more interest rate sensitivity.2005-051.011.872005- 040.991.712005-030.901.562005-021.031.652005- 011.141.80Compare the interest rate risk of two bonds, both of which have a 10% annual coupon and a $1,000 face value. The first bond matures in 1 year, the second in 25 years.2004- 121.241.922004-111.332.012004-101.372.11Use the PV function, along with a two variable Data Table, to show the bonds' price sensitivity.2004-091.332.14Coupon rate:10%2004- 081.372.18Payment$100.002004-071.322.12Par value$1,000.002004-061.282.05Maturity12004- 051.322.03Going rate = r = YTM10%2004-041.382.112004- 031.502.28Value of bond:$1,000.002004-021.422.192004- 011.392.292003-121.352.33Value of the Bond Under Different Conditions2003-111.352.36Going rate, rYears to Maturity2003- 101.412.44$1,000.001252003- 091.452.520%$1,100.00$3,500.002003- 081.432.565%$1,047.62$1,704.702003- 071.512.6410%$1,000.00$1,000.002003- 061.642.8615%$956.52$676.792003- 051.652.8120%$916.67$505.242003- 041.782.8925%$880.00$402.272003-032.083.142003-
- 12. 022.053.16Figure 5-42003-012.123.302002-122.183.422002- 112.263.572002-102.383.792002-092.283.532002- 082.113.322002-071.883.252002-061.703.022002- 051.592.932002-041.552.822002-031.532.832002- 021.602.982002-011.512.832001-121.682.962001- 112.323.162001-102.463.342001-092.443.302001- 082.052.882001-071.892.732001-061.902.692001- 051.902.682001-042.062.932001-032.092.952001- 022.002.772001-011.992.772000-121.972.782000- 111.732.562000-101.812.60THE TERM STRUCTURE OF INTEREST RATES (Section 5.14)2000-091.822.552000- 081.722.43The term structure describes the relationship between long-term and short-term interest rates. Graphically, this relationship can be shown in what is known as the yield curve. In practice, the yield curve is relatively easy to obtain. It is published daily in the Wall Street Journal and can be accessed through the internet, via www. bloomberg.com. However, the "building block approach" to generating a yield curve is more complicated. We will see that later when we build our own yield curve.2000-071.602.302000-061.572.382000- 051.552.462000-041.652.412000-031.422.112000- 021.161.77Before jumping into the creation of our own yield curve, let's look at some historical interest rate data and draw some historical yield curves. 2000-011.121.671999- 121.271.911999-111.332.12Maturity (yrs)Mar-80Feb-00Mar- 091999-101.442.270.515.0%6.0%0.4%1999- 091.472.28114.0%6.2%0.6%1999- 081.462.21513.5%6.7%1.7%1999- 071.402.161012.8%6.7%2.7%1999- 061.332.123012.3%6.3%3.7%1999-051.392.181999- 041.462.30From this data, we can plot three line graphs. Each line graph represents the U.S. Treasury yield curve at a1999- 031.392.30different point in time.1999-021.402.391999- 011.522.57Figure 5-5. U.S. Treasury Bond Interest Rates on Different Dates Interest Rate Sensitivity
- 13. 0.0 0.05 0.1 0.15 0.2 2500.0 1518.98290190903 1000.0 707.6314950684456 532.4527357594372 Price of Bond Over Time Rate Drops to 5% 0.0 1.0 2.0 3.0 4.0 5.0 6.0 7.0 8.0 9.0 10.0 11.0 12.0 13.0 14.0 15.0 1518.98290190903 1494.932047004481 1469.678649354705 1443.16258182244 1415.320710913562 1386.086746459241 1355.391083782203 1323.160637971313 1289.318669869878 1253.784603363372 1216.473833531541 1177.297525208118 1136.162401468524 1092.97052154195 1047.619047619047 1000.0 Rate Stays at 10% 0.0 1.0 2.0 3.0 4.0 5.0 6.0 7.0 8.0 9.0 10.0 11.0 12.0 13.0 14.0 15.0 1000.0 1000.0 999.9999999999999 1000.0 999.9999999999999 1000.0 999.9999999999999 1000.0 1000.0 1000.0 1000.0 1000.0 1000.0 1000.0 999.9999999999999 1000.0 Rate Rises to 15% 0.0 1.0 2.0 3.0 4.0 5.0 6.0 7.0 8.0 9.0 10.0 11.0 12.0 13.0 14.0 15.0 707.6314950684456 713.7762193287123 720.8426522280192 728.969050062222 738.3144075715553 749.0615687072888 761.420804013382 775.6339246153892 791.9790133076975 810.775865303852 832.3922450994299 857.2510818643444 885.8387441439962 918.7145557655954 956.5217391304349 1000.0 Mar-80 0.5 1.0 5.0 10.0 30.0 0.15 0.14 0.135 0.128
- 14. 0.123 Feb-00 0.5 1.0 5.0 10.0 30.0 0.004 0.006 0.0169 0.0268 0.0369 Feb-05 0.5 1.0 5.0 10.0 30.0 0.0598 0.0619 0.0674 0.0668 0.0631 Years to Maturity Interest Rate (%) 1-Year 0.05 0.1 0.15 0.2 0.25 1047.619047619047 999.9999999999999 956.5217391304349 916.6666666666667 880.0 25-Year 0.05 0.1 0.15 0.2 0.25 1704.697228302238 999.9999999999999 676.792545736493 505.241298005198 402.2667359117775 Interest Rate, rd Bond Value ($) 39845.0 39814.0 39783.0 39753.0 39722.0 39692.0 39661.0 39630.0 39600.0 39569.0 39539.0 39508.0 39479.0 39448.0 39417.0 39387.0 39356.0 39326.0 39295.0 39264.0 39234.0 39203.0 39173.0 39142.0 39114.0 39083.0 39052.0 39022.0 38991.0 38961.0 38930.0 38899.0 38869.0 38838.0 38808.0 38777.0 38749.0 38718.0 38687.0 38657.0 38626.0 38596.0 38565.0 38534.0 38504.0 38473.0 38443.0 38412.0 38384.0 38353.0 38322.0 38292.0 38261.0 38231.0 38200.0 38169.0 38139.0 38108.0 38078.0 38047.0 38018.0 37987.0 37956.0 37926.0 37895.0 37865.0 37834.0 37803.0 37773.0 37742.0 37712.0
- 15. 37681.0 37653.0 37622.0 37591.0 37561.0 37530.0 37500.0 37469.0 37438.0 37408.0 37377.0 37347.0 37316.0 37288.0 37257.0 37226.0 37196.0 37165.0 37135.0 37104.0 37073.0 37043.0 37012.0 36982.0 36951.0 36923.0 36892.0 36861.0 36831.0 36800.0 36770.0 36739.0 36708.0 36678.0 36647.0 36617.0 36586.0 36557.0 36526.0 36495.0 36465.0 36434.0 36404.0 36373.0 36342.0 36312.0 36281.0 36251.0 36220.0 36192.0 36161.0 2.4 2.53 2.63 2.59 2.47 1.96 1.75 1.66 1.58 1.69 1.87 2.0 1.79 1.59 1.39 1.29 1.13 1.22 1.12 0.73 0.69 0.72 0.779999999999999 0.74 0.67 0.64 0.760000000000001 0.73 0.779999999999999 0.79 0.8 0.76 0.779999999999999 0.84 0.85 0.81 0.779999999999999 0.87 0.9 0.88 0.89 0.93 0.83 0.88 0.96 1.01 0.99 0.9 1.03 1.14 1.24 1.33 1.37 1.33 1.37 1.32 1.28 1.32 1.38 1.5 1.42 1.39 1.35 1.35 1.41 1.45 1.43 1.51 1.64 1.65 1.78 2.08 2.05 2.12 2.18 2.26 2.38 2.28 2.11 1.88 1.7 1.59 1.55 1.53 1.6 1.51 1.68 2.32 2.46 2.44 2.05 1.89 1.9 1.9 2.06 2.09 2.0 1.99 1.97 1.73 1.81 1.82 1.72 1.6 1.57 1.55 1.65 1.42 1.16 1.12 1.27 1.33 1.44 1.47 1.46 1.4 1.33 1.39 1.46 1.39 1.4 1.52 39845.0 39814.0 39783.0 39753.0 39722.0 39692.0 39661.0 39630.0 39600.0 39569.0 39539.0 39508.0 39479.0 39448.0 39417.0 39387.0 39356.0 39326.0 39295.0 39264.0 39234.0 39203.0 39173.0 39142.0 39114.0 39083.0 39052.0 39022.0 38991.0 38961.0 38930.0 38899.0 38869.0 38838.0 38808.0 38777.0 38749.0 38718.0 38687.0 38657.0 38626.0 38596.0 38565.0 38534.0 38504.0 38473.0 38443.0 38412.0 38384.0 38353.0 38322.0 38292.0 38261.0 38231.0 38200.0 38169.0 38139.0 38108.0 38078.0 38047.0 38018.0 37987.0 37956.0 37926.0 37895.0
- 16. 37865.0 37834.0 37803.0 37773.0 37742.0 37712.0 37681.0 37653.0 37622.0 37591.0 37561.0 37530.0 37500.0 37469.0 37438.0 37408.0 37377.0 37347.0 37316.0 37288.0 37257.0 37226.0 37196.0 37165.0 37135.0 37104.0 37073.0 37043.0 37012.0 36982.0 36951.0 36923.0 36892.0 36861.0 36831.0 36800.0 36770.0 36739.0 36708.0 36678.0 36647.0 36617.0 36586.0 36557.0 36526.0 36495.0 36465.0 36434.0 36404.0 36373.0 36342.0 36312.0 36281.0 36251.0 36220.0 36192.0 36161.0 5.21 5.62 6.01 5.68 5.07 3.62 3.26 3.15 2.97 3.05 3.29 3.38 3.08 2.8 2.55 2.25 1.95 2.07 1.98 1.65 1.6 1.64 1.7 1.71 1.56 1.58 1.66 1.6 1.69 1.71 1.71 1.67 1.67 1.64 1.69 1.69 1.7 1.82 1.85 1.85 1.84 1.83 1.7 1.77 1.86 1.87 1.71 1.56 1.65 1.8 1.92 2.01 2.11 2.14 2.18 2.12 2.05 2.03 2.11 2.28 2.19 2.29 2.33 2.36 2.44 2.52 2.56 2.64 2.86 2.81 2.89 3.14 3.16 3.3 3.42 3.57 3.79 3.53 3.32 3.25 3.02 2.93 2.82 2.83 2.98 2.83 2.96 3.16 3.34 3.3 2.88 2.73 2.69 2.68 2.93 2.95 2.77 2.77 2.78 2.56 2.6 2.55 2.43 2.3 2.38 2.46 2.41 2.11 1.77 1.67 1.91 2.12 2.27 2.28 2.21 2.16 2.12 2.18 2.3 2.3 2.39 2.57 Spread (%) Interest Rate Sensitivity 0.0 0.05 0.1 0.15 0.2 2500.0 1518.98290190903 1000.0 707.6314950684456 532.4527357594372 Price of Bond Over Time Rate Drops to 5% 0.0 1.0 2.0 3.0 4.0 5.0 6.0 7.0
- 17. 8.0 9.0 10.0 11.0 12.0 13.0 14.0 15.0 1518.98290190903 1494.932047004481 1469.678649354705 1443.16258182244 1415.320710913562 1386.086746459241 1355.391083782203 1323.160637971313 1289.318669869878 1253.784603363372 1216.473833531541 1177.297525208118 1136.162401468524 1092.97052154195 1047.619047619047 1000.0 Rate Stays at 10% 0.0 1.0 2.0 3.0 4.0 5.0 6.0 7.0 8.0 9.0 10.0 11.0 12.0 13.0 14.0 15.0 1000.0 1000.0 999.9999999999999 1000.0 999.9999999999999 1000.0 999.9999999999999 1000.0 1000.0 1000.0 1000.0 1000.0 1000.0 1000.0 999.9999999999999 1000.0 Rate Rises to 15% 0.0 1.0 2.0 3.0 4.0 5.0 6.0 7.0 8.0 9.0 10.0 11.0 12.0 13.0 14.0 15.0 707.6314950684456 713.7762193287123 720.8426522280192 728.969050062222 738.3144075715553 749.0615687072888 761.420804013382 775.6339246153892 791.9790133076975 810.775865303852 832.3922450994299 857.2510818643444 885.8387441439962 918.7145557655954 956.5217391304349 1000.0 Mar-80 0.5 1.0 5.0 10.0 30.0 0.15 0.14 0.135 0.128 0.123 Feb-00 0.5 1.0 5.0 10.0 30.0 0.004 0.006 0.0169 0.0268 0.0369 Feb-05 0.5 1.0 5.0 10.0 30.0 0.0598 0.0619 0.0674 0.0668 0.0631 Years to Maturity Interest Rate
- 18. (%) 1-Year 0.05 0.1 0.15 0.2 0.25 1047.619047619047 999.9999999999999 956.5217391304349 916.6666666666667 880.0 25-Year 0.05 0.1 0.15 0.2 0.25 1704.697228302238 999.9999999999999 676.792545736493 505.241298005198 402.2667359117775 Interest Rate, rd Bond Value ($) 39845.0 39814.0 39783.0 39753.0 39722.0 39692.0 39661.0 39630.0 39600.0 39569.0 39539.0 39508.0 39479.0 39448.0 39417.0 39387.0 39356.0 39326.0 39295.0 39264.0 39234.0 39203.0 39173.0 39142.0 39114.0 39083.0 39052.0 39022.0 38991.0 38961.0 38930.0 38899.0 38869.0 38838.0 38808.0 38777.0 38749.0 38718.0 38687.0 38657.0 38626.0 38596.0 38565.0 38534.0 38504.0 38473.0 38443.0 38412.0 38384.0 38353.0 38322.0 38292.0 38261.0 38231.0 38200.0 38169.0 38139.0 38108.0 38078.0 38047.0 38018.0 37987.0 37956.0 37926.0 37895.0 37865.0 37834.0 37803.0 37773.0 37742.0 37712.0 37681.0 37653.0 37622.0 37591.0 37561.0 37530.0 37500.0 37469.0 37438.0 37408.0 37377.0 37347.0 37316.0 37288.0 37257.0 37226.0 37196.0 37165.0 37135.0 37104.0 37073.0 37043.0 37012.0 36982.0 36951.0 36923.0 36892.0 36861.0 36831.0 36800.0 36770.0 36739.0 36708.0 36678.0 36647.0
- 19. 36617.0 36586.0 36557.0 36526.0 36495.0 36465.0 36434.0 36404.0 36373.0 36342.0 36312.0 36281.0 36251.0 36220.0 36192.0 36161.0 2.4 2.53 2.63 2.59 2.47 1.96 1.75 1.66 1.58 1.69 1.87 2.0 1.79 1.59 1.39 1.29 1.13 1.22 1.12 0.73 0.69 0.72 0.779999999999999 0.74 0.67 0.64 0.760000000000001 0.73 0.779999999999999 0.79 0.8 0.76 0.779999999999999 0.84 0.85 0.81 0.779999999999999 0.87 0.9 0.88 0.89 0.93 0.83 0.88 0.96 1.01 0.99 0.9 1.03 1.14 1.24 1.33 1.37 1.33 1.37 1.32 1.28 1.32 1.38 1.5 1.42 1.39 1.35 1.35 1.41 1.45 1.43 1.51 1.64 1.65 1.78 2.08 2.05 2.12 2.18 2.26 2.38 2.28 2.11 1.88 1.7 1.59 1.55 1.53 1.6 1.51 1.68 2.32 2.46 2.44 2.05 1.89 1.9 1.9 2.06 2.09 2.0 1.99 1.97 1.73 1.81 1.82 1.72 1.6 1.57 1.55 1.65 1.42 1.16 1.12 1.27 1.33 1.44 1.47 1.46 1.4 1.33 1.39 1.46 1.39 1.4 1.52 39845.0 39814.0 39783.0 39753.0 39722.0 39692.0 39661.0 39630.0 39600.0 39569.0 39539.0 39508.0 39479.0 39448.0 39417.0 39387.0 39356.0 39326.0 39295.0 39264.0 39234.0 39203.0 39173.0 39142.0 39114.0 39083.0 39052.0 39022.0 38991.0 38961.0 38930.0 38899.0 38869.0 38838.0 38808.0 38777.0 38749.0 38718.0 38687.0 38657.0 38626.0 38596.0 38565.0 38534.0 38504.0 38473.0 38443.0 38412.0 38384.0 38353.0 38322.0 38292.0 38261.0 38231.0 38200.0 38169.0 38139.0 38108.0 38078.0 38047.0 38018.0 37987.0 37956.0 37926.0 37895.0 37865.0 37834.0 37803.0 37773.0 37742.0 37712.0 37681.0 37653.0 37622.0 37591.0 37561.0 37530.0 37500.0 37469.0 37438.0 37408.0 37377.0 37347.0 37316.0 37288.0 37257.0 37226.0 37196.0 37165.0 37135.0 37104.0 37073.0 37043.0 37012.0 36982.0 36951.0 36923.0 36892.0 36861.0 36831.0
- 20. 36800.0 36770.0 36739.0 36708.0 36678.0 36647.0 36617.0 36586.0 36557.0 36526.0 36495.0 36465.0 36434.0 36404.0 36373.0 36342.0 36312.0 36281.0 36251.0 36220.0 36192.0 36161.0 5.21 5.62 6.01 5.68 5.07 3.62 3.26 3.15 2.97 3.05 3.29 3.38 3.08 2.8 2.55 2.25 1.95 2.07 1.98 1.65 1.6 1.64 1.7 1.71 1.56 1.58 1.66 1.6 1.69 1.71 1.71 1.67 1.67 1.64 1.69 1.69 1.7 1.82 1.85 1.85 1.84 1.83 1.7 1.77 1.86 1.87 1.71 1.56 1.65 1.8 1.92 2.01 2.11 2.14 2.18 2.12 2.05 2.03 2.11 2.28 2.19 2.29 2.33 2.36 2.44 2.52 2.56 2.64 2.86 2.81 2.89 3.14 3.16 3.3 3.42 3.57 3.79 3.53 3.32 3.25 3.02 2.93 2.82 2.83 2.98 2.83 2.96 3.16 3.34 3.3 2.88 2.73 2.69 2.68 2.93 2.95 2.77 2.77 2.78 2.56 2.6 2.55 2.43 2.3 2.38 2.46 2.41 2.11 1.77 1.67 1.91 2.12 2.27 2.28 2.21 2.16 2.12 2.18 2.3 2.3 2.39 2.57 Spread (%) Interest Rate Sensitivity 0.0 0.05 0.1 0.15 0.2 2500.0 1518.98290190903 1000.0 707.6314950684456 532.4527357594372 Price of Bond Over Time Rate Drops to 5% 0.0 1.0 2.0 3.0 4.0 5.0 6.0 7.0 8.0 9.0 10.0 11.0 12.0 13.0 14.0 15.0 1518.98290190903 1494.932047004481 1469.678649354705 1443.16258182244 1415.320710913562 1386.086746459241 1355.391083782203 1323.160637971313 1289.318669869878 1253.784603363372 1216.473833531541 1177.297525208118
- 21. 1136.162401468524 1092.97052154195 1047.619047619047 1000.0 Rate Stays at 10% 0.0 1.0 2.0 3.0 4.0 5.0 6.0 7.0 8.0 9.0 10.0 11.0 12.0 13.0 14.0 15.0 1000.0 1000.0 999.9999999999999 1000.0 999.9999999999999 1000.0 999.9999999999999 1000.0 1000.0 1000.0 1000.0 1000.0 1000.0 1000.0 999.9999999999999 1000.0 Rate Rises to 15% 0.0 1.0 2.0 3.0 4.0 5.0 6.0 7.0 8.0 9.0 10.0 11.0 12.0 13.0 14.0 15.0 707.6314950684456 713.7762193287123 720.8426522280192 728.969050062222 738.3144075715553 749.0615687072888 761.420804013382 775.6339246153892 791.9790133076975 810.775865303852 832.3922450994299 857.2510818643444 885.8387441439962 918.7145557655954 956.5217391304349 1000.0 Mar-80 0.5 1.0 5.0 10.0 30.0 0.15 0.14 0.135 0.128 0.123 Feb-00 0.5 1.0 5.0 10.0 30.0 0.004 0.006 0.0169 0.0268 0.0369 Feb-05 0.5 1.0 5.0 10.0 30.0 0.0598 0.0619 0.0674 0.0668 0.0631 Years to Maturity Interest Rate (%) 1-Year 0.05 0.1 0.15 0.2 0.25 1047.619047619047 999.9999999999999 956.5217391304349 916.6666666666667 880.0 25-Year 0.05 0.1 0.15 0.2 0.25 1704.697228302238 999.9999999999999
- 22. 676.792545736493 505.241298005198 402.2667359117775 Interest Rate, rd Bond Value ($) 39845.0 39814.0 39783.0 39753.0 39722.0 39692.0 39661.0 39630.0 39600.0 39569.0 39539.0 39508.0 39479.0 39448.0 39417.0 39387.0 39356.0 39326.0 39295.0 39264.0 39234.0 39203.0 39173.0 39142.0 39114.0 39083.0 39052.0 39022.0 38991.0 38961.0 38930.0 38899.0 38869.0 38838.0 38808.0 38777.0 38749.0 38718.0 38687.0 38657.0 38626.0 38596.0 38565.0 38534.0 38504.0 38473.0 38443.0 38412.0 38384.0 38353.0 38322.0 38292.0 38261.0 38231.0 38200.0 38169.0 38139.0 38108.0 38078.0 38047.0 38018.0 37987.0 37956.0 37926.0 37895.0 37865.0 37834.0 37803.0 37773.0 37742.0 37712.0 37681.0 37653.0 37622.0 37591.0 37561.0 37530.0 37500.0 37469.0 37438.0 37408.0 37377.0 37347.0 37316.0 37288.0 37257.0 37226.0 37196.0 37165.0 37135.0 37104.0 37073.0 37043.0 37012.0 36982.0 36951.0 36923.0 36892.0 36861.0 36831.0 36800.0 36770.0 36739.0 36708.0 36678.0 36647.0 36617.0 36586.0 36557.0 36526.0 36495.0 36465.0 36434.0 36404.0 36373.0 36342.0 36312.0 36281.0 36251.0 36220.0 36192.0 36161.0 2.4 2.53 2.63 2.59 2.47 1.96 1.75 1.66 1.58 1.69 1.87 2.0 1.79 1.59 1.39 1.29 1.13 1.22 1.12 0.73 0.69 0.72 0.779999999999999 0.74 0.67 0.64 0.760000000000001 0.73 0.779999999999999 0.79 0.8
- 23. 0.76 0.779999999999999 0.84 0.85 0.81 0.779999999999999 0.87 0.9 0.88 0.89 0.93 0.83 0.88 0.96 1.01 0.99 0.9 1.03 1.14 1.24 1.33 1.37 1.33 1.37 1.32 1.28 1.32 1.38 1.5 1.42 1.39 1.35 1.35 1.41 1.45 1.43 1.51 1.64 1.65 1.78 2.08 2.05 2.12 2.18 2.26 2.38 2.28 2.11 1.88 1.7 1.59 1.55 1.53 1.6 1.51 1.68 2.32 2.46 2.44 2.05 1.89 1.9 1.9 2.06 2.09 2.0 1.99 1.97 1.73 1.81 1.82 1.72 1.6 1.57 1.55 1.65 1.42 1.16 1.12 1.27 1.33 1.44 1.47 1.46 1.4 1.33 1.39 1.46 1.39 1.4 1.52 39845.0 39814.0 39783.0 39753.0 39722.0 39692.0 39661.0 39630.0 39600.0 39569.0 39539.0 39508.0 39479.0 39448.0 39417.0 39387.0 39356.0 39326.0 39295.0 39264.0 39234.0 39203.0 39173.0 39142.0 39114.0 39083.0 39052.0 39022.0 38991.0 38961.0 38930.0 38899.0 38869.0 38838.0 38808.0 38777.0 38749.0 38718.0 38687.0 38657.0 38626.0 38596.0 38565.0 38534.0 38504.0 38473.0 38443.0 38412.0 38384.0 38353.0 38322.0 38292.0 38261.0 38231.0 38200.0 38169.0 38139.0 38108.0 38078.0 38047.0 38018.0 37987.0 37956.0 37926.0 37895.0 37865.0 37834.0 37803.0 37773.0 37742.0 37712.0 37681.0 37653.0 37622.0 37591.0 37561.0 37530.0 37500.0 37469.0 37438.0 37408.0 37377.0 37347.0 37316.0 37288.0 37257.0 37226.0 37196.0 37165.0 37135.0 37104.0 37073.0 37043.0 37012.0 36982.0 36951.0 36923.0 36892.0 36861.0 36831.0 36800.0 36770.0 36739.0 36708.0 36678.0 36647.0 36617.0 36586.0 36557.0 36526.0 36495.0 36465.0 36434.0 36404.0 36373.0 36342.0 36312.0 36281.0 36251.0 36220.0 36192.0 36161.0 5.21 5.62 6.01 5.68 5.07 3.62 3.26 3.15 2.97 3.05 3.29 3.38 3.08 2.8 2.55 2.25 1.95 2.07 1.98 1.65 1.6 1.64 1.7 1.71 1.56 1.58 1.66 1.6 1.69
- 24. 1.71 1.71 1.67 1.67 1.64 1.69 1.69 1.7 1.82 1.85 1.85 1.84 1.83 1.7 1.77 1.86 1.87 1.71 1.56 1.65 1.8 1.92 2.01 2.11 2.14 2.18 2.12 2.05 2.03 2.11 2.28 2.19 2.29 2.33 2.36 2.44 2.52 2.56 2.64 2.86 2.81 2.89 3.14 3.16 3.3 3.42 3.57 3.79 3.53 3.32 3.25 3.02 2.93 2.82 2.83 2.98 2.83 2.96 3.16 3.34 3.3 2.88 2.73 2.69 2.68 2.93 2.95 2.77 2.77 2.78 2.56 2.6 2.55 2.43 2.3 2.38 2.46 2.41 2.11 1.77 1.67 1.91 2.12 2.27 2.28 2.21 2.16 2.12 2.18 2.3 2.3 2.39 2.57 Spread (%) Interest Rate Sensitivity 0.0 0.05 0.1 0.15 0.2 2500.0 1518.98290190903 1000.0 707.6314950684456 532.4527357594372 Price of Bond Over Time Rate Drops to 5% 0.0 1.0 2.0 3.0 4.0 5.0 6.0 7.0 8.0 9.0 10.0 11.0 12.0 13.0 14.0 15.0 1518.98290190903 1494.932047004481 1469.678649354705 1443.16258182244 1415.320710913562 1386.086746459241 1355.391083782203 1323.160637971313 1289.318669869878 1253.784603363372 1216.473833531541 1177.297525208118 1136.162401468524 1092.97052154195 1047.619047619047 1000.0 Rate Stays at 10% 0.0 1.0 2.0 3.0 4.0 5.0 6.0 7.0 8.0 9.0 10.0 11.0 12.0 13.0 14.0 15.0 1000.0 1000.0 999.9999999999999 1000.0 999.9999999999999 1000.0 999.9999999999999 1000.0 1000.0 1000.0 1000.0 1000.0 1000.0 1000.0 999.9999999999999 1000.0
- 25. Rate Rises to 15% 0.0 1.0 2.0 3.0 4.0 5.0 6.0 7.0 8.0 9.0 10.0 11.0 12.0 13.0 14.0 15.0 707.6314950684456 713.7762193287123 720.8426522280192 728.969050062222 738.3144075715553 749.0615687072888 761.420804013382 775.6339246153892 791.9790133076975 810.775865303852 832.3922450994299 857.2510818643444 885.8387441439962 918.7145557655954 956.5217391304349 1000.0 Mar-80 0.5 1.0 5.0 10.0 30.0 0.15 0.14 0.135 0.128 0.123 Feb-00 0.5 1.0 5.0 10.0 30.0 0.004 0.006 0.0169 0.0268 0.0369 Feb-05 0.5 1.0 5.0 10.0 30.0 0.0598 0.0619 0.0674 0.0668 0.0631 Years to Maturity Interest Rate (%) 1-Year 0.05 0.1 0.15 0.2 0.25 1047.619047619047 999.9999999999999 956.5217391304349 916.6666666666667 880.0 25-Year 0.05 0.1 0.15 0.2 0.25 1704.697228302238 999.9999999999999 676.792545736493 505.241298005198 402.2667359117775 Interest Rate, rd Bond Value ($)
- 26. 39845.0 39814.0 39783.0 39753.0 39722.0 39692.0 39661.0 39630.0 39600.0 39569.0 39539.0 39508.0 39479.0 39448.0 39417.0 39387.0 39356.0 39326.0 39295.0 39264.0 39234.0 39203.0 39173.0 39142.0 39114.0 39083.0 39052.0 39022.0 38991.0 38961.0 38930.0 38899.0 38869.0 38838.0 38808.0 38777.0 38749.0 38718.0 38687.0 38657.0 38626.0 38596.0 38565.0 38534.0 38504.0 38473.0 38443.0 38412.0 38384.0 38353.0 38322.0 38292.0 38261.0 38231.0 38200.0 38169.0 38139.0 38108.0 38078.0 38047.0 38018.0 37987.0 37956.0 37926.0 37895.0 37865.0 37834.0 37803.0 37773.0 37742.0 37712.0 37681.0 37653.0 37622.0 37591.0 37561.0 37530.0 37500.0 37469.0 37438.0 37408.0 37377.0 37347.0 37316.0 37288.0 37257.0 37226.0 37196.0 37165.0 37135.0 37104.0 37073.0 37043.0 37012.0 36982.0 36951.0 36923.0 36892.0 36861.0 36831.0 36800.0 36770.0 36739.0 36708.0 36678.0 36647.0 36617.0 36586.0 36557.0 36526.0 36495.0 36465.0 36434.0 36404.0 36373.0 36342.0 36312.0 36281.0 36251.0 36220.0 36192.0 36161.0 2.4 2.53 2.63 2.59 2.47 1.96 1.75 1.66 1.58 1.69 1.87 2.0 1.79 1.59 1.39 1.29 1.13 1.22 1.12 0.73 0.69 0.72 0.779999999999999 0.74 0.67 0.64 0.760000000000001 0.73 0.779999999999999 0.79 0.8 0.76 0.779999999999999 0.84 0.85 0.81 0.779999999999999 0.87 0.9 0.88 0.89 0.93 0.83 0.88 0.96 1.01 0.99 0.9 1.03 1.14 1.24 1.33 1.37 1.33 1.37 1.32 1.28 1.32 1.38 1.5 1.42 1.39 1.35 1.35 1.41 1.45 1.43 1.51 1.64 1.65 1.78 2.08 2.05 2.12 2.18 2.26 2.38 2.28 2.11 1.88 1.7 1.59 1.55 1.53 1.6 1.51 1.68 2.32 2.46 2.44 2.05 1.89 1.9 1.9 2.06 2.09 2.0 1.99 1.97
- 27. 1.73 1.81 1.82 1.72 1.6 1.57 1.55 1.65 1.42 1.16 1.12 1.27 1.33 1.44 1.47 1.46 1.4 1.33 1.39 1.46 1.39 1.4 1.52 39845.0 39814.0 39783.0 39753.0 39722.0 39692.0 39661.0 39630.0 39600.0 39569.0 39539.0 39508.0 39479.0 39448.0 39417.0 39387.0 39356.0 39326.0 39295.0 39264.0 39234.0 39203.0 39173.0 39142.0 39114.0 39083.0 39052.0 39022.0 38991.0 38961.0 38930.0 38899.0 38869.0 38838.0 38808.0 38777.0 38749.0 38718.0 38687.0 38657.0 38626.0 38596.0 38565.0 38534.0 38504.0 38473.0 38443.0 38412.0 38384.0 38353.0 38322.0 38292.0 38261.0 38231.0 38200.0 38169.0 38139.0 38108.0 38078.0 38047.0 38018.0 37987.0 37956.0 37926.0 37895.0 37865.0 37834.0 37803.0 37773.0 37742.0 37712.0 37681.0 37653.0 37622.0 37591.0 37561.0 37530.0 37500.0 37469.0 37438.0 37408.0 37377.0 37347.0 37316.0 37288.0 37257.0 37226.0 37196.0 37165.0 37135.0 37104.0 37073.0 37043.0 37012.0 36982.0 36951.0 36923.0 36892.0 36861.0 36831.0 36800.0 36770.0 36739.0 36708.0 36678.0 36647.0 36617.0 36586.0 36557.0 36526.0 36495.0 36465.0 36434.0 36404.0 36373.0 36342.0 36312.0 36281.0 36251.0 36220.0 36192.0 36161.0 5.21 5.62 6.01 5.68 5.07 3.62 3.26 3.15 2.97 3.05 3.29 3.38 3.08 2.8 2.55 2.25 1.95 2.07 1.98 1.65 1.6 1.64 1.7 1.71 1.56 1.58 1.66 1.6 1.69 1.71 1.71 1.67 1.67 1.64 1.69 1.69 1.7 1.82 1.85 1.85 1.84 1.83 1.7 1.77 1.86 1.87 1.71 1.56 1.65 1.8 1.92 2.01 2.11 2.14 2.18 2.12 2.05 2.03 2.11 2.28 2.19 2.29 2.33 2.36 2.44 2.52 2.56 2.64 2.86 2.81 2.89 3.14 3.16 3.3 3.42 3.57 3.79 3.53 3.32 3.25 3.02 2.93 2.82 2.83 2.98 2.83 2.96 3.16 3.34 3.3 2.88 2.73 2.69 2.68 2.93 2.95 2.77 2.77 2.78 2.56 2.6 2.55 2.43 2.3 2.38 2.46
- 28. 2.41 2.11 1.77 1.67 1.91 2.12 2.27 2.28 2.21 2.16 2.12 2.18 2.3 2.3 2.39 2.57 Spread (%) Interest Rate Sensitivity 0.0 0.05 0.1 0.15 0.2 2500.0 1518.98290190903 1000.0 707.6314950684456 532.4527357594372 Price of Bond Over Time Rate Drops to 5% 0.0 1.0 2.0 3.0 4.0 5.0 6.0 7.0 8.0 9.0 10.0 11.0 12.0 13.0 14.0 15.0 1518.98290190903 1494.932047004481 1469.678649354705 1443.16258182244 1415.320710913562 1386.086746459241 1355.391083782203 1323.160637971313 1289.318669869878 1253.784603363372 1216.473833531541 1177.297525208118 1136.162401468524 1092.97052154195 1047.619047619047 1000.0 Rate Stays at 10% 0.0 1.0 2.0 3.0 4.0 5.0 6.0 7.0 8.0 9.0 10.0 11.0 12.0 13.0 14.0 15.0 1000.0 1000.0 999.9999999999999 1000.0 999.9999999999999 1000.0 999.9999999999999 1000.0 1000.0 1000.0 1000.0 1000.0 1000.0 1000.0 999.9999999999999 1000.0 Rate Rises to 15% 0.0 1.0 2.0 3.0 4.0 5.0 6.0 7.0 8.0 9.0 10.0 11.0 12.0 13.0 14.0 15.0 707.6314950684456 713.7762193287123 720.8426522280192 728.969050062222 738.3144075715553 749.0615687072888 761.420804013382 775.6339246153892 791.9790133076975 810.775865303852
- 29. 832.3922450994299 857.2510818643444 885.8387441439962 918.7145557655954 956.5217391304349 1000.0 Mar-80 0.5 1.0 5.0 10.0 30.0 0.15 0.14 0.135 0.128 0.123 Feb-00 0.5 1.0 5.0 10.0 30.0 0.004 0.006 0.0169 0.0268 0.0369 Feb-05 0.5 1.0 5.0 10.0 30.0 0.0598 0.0619 0.0674 0.0668 0.0631 Years to Maturity Interest Rate (%) 1-Year 0.05 0.1 0.15 0.2 0.25 1047.619047619047 999.9999999999999 956.5217391304349 916.6666666666667 880.0 25-Year 0.05 0.1 0.15 0.2 0.25 1704.697228302238 999.9999999999999 676.792545736493 505.241298005198 402.2667359117775 Interest Rate, rd Bond Value ($) 39845.0 39814.0 39783.0 39753.0 39722.0 39692.0 39661.0 39630.0 39600.0 39569.0 39539.0 39508.0 39479.0 39448.0 39417.0 39387.0 39356.0 39326.0 39295.0 39264.0 39234.0 39203.0 39173.0 39142.0 39114.0 39083.0 39052.0 39022.0 38991.0 38961.0 38930.0
- 30. 38899.0 38869.0 38838.0 38808.0 38777.0 38749.0 38718.0 38687.0 38657.0 38626.0 38596.0 38565.0 38534.0 38504.0 38473.0 38443.0 38412.0 38384.0 38353.0 38322.0 38292.0 38261.0 38231.0 38200.0 38169.0 38139.0 38108.0 38078.0 38047.0 38018.0 37987.0 37956.0 37926.0 37895.0 37865.0 37834.0 37803.0 37773.0 37742.0 37712.0 37681.0 37653.0 37622.0 37591.0 37561.0 37530.0 37500.0 37469.0 37438.0 37408.0 37377.0 37347.0 37316.0 37288.0 37257.0 37226.0 37196.0 37165.0 37135.0 37104.0 37073.0 37043.0 37012.0 36982.0 36951.0 36923.0 36892.0 36861.0 36831.0 36800.0 36770.0 36739.0 36708.0 36678.0 36647.0 36617.0 36586.0 36557.0 36526.0 36495.0 36465.0 36434.0 36404.0 36373.0 36342.0 36312.0 36281.0 36251.0 36220.0 36192.0 36161.0 2.4 2.53 2.63 2.59 2.47 1.96 1.75 1.66 1.58 1.69 1.87 2.0 1.79 1.59 1.39 1.29 1.13 1.22 1.12 0.73 0.69 0.72 0.779999999999999 0.74 0.67 0.64 0.760000000000001 0.73 0.779999999999999 0.79 0.8 0.76 0.779999999999999 0.84 0.85 0.81 0.779999999999999 0.87 0.9 0.88 0.89 0.93 0.83 0.88 0.96 1.01 0.99 0.9 1.03 1.14 1.24 1.33 1.37 1.33 1.37 1.32 1.28 1.32 1.38 1.5 1.42 1.39 1.35 1.35 1.41 1.45 1.43 1.51 1.64 1.65 1.78 2.08 2.05 2.12 2.18 2.26 2.38 2.28 2.11 1.88 1.7 1.59 1.55 1.53 1.6 1.51 1.68 2.32 2.46 2.44 2.05 1.89 1.9 1.9 2.06 2.09 2.0 1.99 1.97 1.73 1.81 1.82 1.72 1.6 1.57 1.55 1.65 1.42 1.16 1.12 1.27 1.33 1.44 1.47 1.46 1.4 1.33 1.39 1.46 1.39 1.4 1.52 39845.0 39814.0 39783.0 39753.0 39722.0 39692.0 39661.0 39630.0 39600.0 39569.0 39539.0 39508.0 39479.0 39448.0 39417.0 39387.0 39356.0 39326.0 39295.0 39264.0 39234.0 39203.0 39173.0 39142.0 39114.0
- 31. 39083.0 39052.0 39022.0 38991.0 38961.0 38930.0 38899.0 38869.0 38838.0 38808.0 38777.0 38749.0 38718.0 38687.0 38657.0 38626.0 38596.0 38565.0 38534.0 38504.0 38473.0 38443.0 38412.0 38384.0 38353.0 38322.0 38292.0 38261.0 38231.0 38200.0 38169.0 38139.0 38108.0 38078.0 38047.0 38018.0 37987.0 37956.0 37926.0 37895.0 37865.0 37834.0 37803.0 37773.0 37742.0 37712.0 37681.0 37653.0 37622.0 37591.0 37561.0 37530.0 37500.0 37469.0 37438.0 37408.0 37377.0 37347.0 37316.0 37288.0 37257.0 37226.0 37196.0 37165.0 37135.0 37104.0 37073.0 37043.0 37012.0 36982.0 36951.0 36923.0 36892.0 36861.0 36831.0 36800.0 36770.0 36739.0 36708.0 36678.0 36647.0 36617.0 36586.0 36557.0 36526.0 36495.0 36465.0 36434.0 36404.0 36373.0 36342.0 36312.0 36281.0 36251.0 36220.0 36192.0 36161.0 5.21 5.62 6.01 5.68 5.07 3.62 3.26 3.15 2.97 3.05 3.29 3.38 3.08 2.8 2.55 2.25 1.95 2.07 1.98 1.65 1.6 1.64 1.7 1.71 1.56 1.58 1.66 1.6 1.69 1.71 1.71 1.67 1.67 1.64 1.69 1.69 1.7 1.82 1.85 1.85 1.84 1.83 1.7 1.77 1.86 1.87 1.71 1.56 1.65 1.8 1.92 2.01 2.11 2.14 2.18 2.12 2.05 2.03 2.11 2.28 2.19 2.29 2.33 2.36 2.44 2.52 2.56 2.64 2.86 2.81 2.89 3.14 3.16 3.3 3.42 3.57 3.79 3.53 3.32 3.25 3.02 2.93 2.82 2.83 2.98 2.83 2.96 3.16 3.34 3.3 2.88 2.73 2.69 2.68 2.93 2.95 2.77 2.77 2.78 2.56 2.6 2.55 2.43 2.3 2.38 2.46 2.41 2.11 1.77 1.67 1.91 2.12 2.27 2.28 2.21 2.16 2.12 2.18 2.3 2.3 2.39 2.57 Spread (%)
- 32. Interest Rate Sensitivity 0.0 0.05 0.1 0.15 0.2 2500.0 1518.98290190903 1000.0 707.6314950684456 532.4527357594372 Price of Bond Over Time Rate Drops to 5% 0.0 1.0 2.0 3.0 4.0 5.0 6.0 7.0 8.0 9.0 10.0 11.0 12.0 13.0 14.0 15.0 1518.98290190903 1494.932047004481 1469.678649354705 1443.16258182244 1415.320710913562 1386.086746459241 1355.391083782203 1323.160637971313 1289.318669869878 1253.784603363372 1216.473833531541 1177.297525208118 1136.162401468524 1092.97052154195 1047.619047619047 1000.0 Rate Stays at 10% 0.0 1.0 2.0 3.0 4.0 5.0 6.0 7.0 8.0 9.0 10.0 11.0 12.0 13.0 14.0 15.0 1000.0 1000.0 999.9999999999999 1000.0 999.9999999999999 1000.0 999.9999999999999 1000.0 1000.0 1000.0 1000.0 1000.0 1000.0 1000.0 999.9999999999999 1000.0 Rate Rises to 15% 0.0 1.0 2.0 3.0 4.0 5.0 6.0 7.0 8.0 9.0 10.0 11.0 12.0 13.0 14.0 15.0 707.6314950684456 713.7762193287123 720.8426522280192 728.969050062222 738.3144075715553 749.0615687072888 761.420804013382 775.6339246153892 791.9790133076975 810.775865303852 832.3922450994299 857.2510818643444 885.8387441439962 918.7145557655954 956.5217391304349 1000.0
- 33. Mar-80 0.5 1.0 5.0 10.0 30.0 0.15 0.14 0.135 0.128 0.123 Feb-00 0.5 1.0 5.0 10.0 30.0 0.004 0.006 0.0169 0.0268 0.0369 Feb-05 0.5 1.0 5.0 10.0 30.0 0.0598 0.0619 0.0674 0.0668 0.0631 Years to Maturity Interest Rate (%) 1-Year 0.05 0.1 0.15 0.2 0.25 1047.619047619047 999.9999999999999 956.5217391304349 916.6666666666667 880.0 25-Year 0.05 0.1 0.15 0.2 0.25 1704.697228302238 999.9999999999999 676.792545736493 505.241298005198 402.2667359117775 Interest Rate, rd Bond Value ($) 39845.0 39814.0 39783.0 39753.0 39722.0 39692.0 39661.0 39630.0 39600.0 39569.0 39539.0 39508.0 39479.0 39448.0 39417.0 39387.0 39356.0 39326.0 39295.0 39264.0 39234.0 39203.0 39173.0 39142.0 39114.0 39083.0 39052.0 39022.0 38991.0 38961.0 38930.0 38899.0 38869.0 38838.0 38808.0 38777.0 38749.0 38718.0 38687.0 38657.0 38626.0 38596.0 38565.0 38534.0 38504.0 38473.0 38443.0 38412.0 38384.0 38353.0 38322.0 38292.0 38261.0 38231.0 38200.0 38169.0 38139.0 38108.0 38078.0 38047.0 38018.0 37987.0 37956.0 37926.0 37895.0 37865.0
- 34. 37834.0 37803.0 37773.0 37742.0 37712.0 37681.0 37653.0 37622.0 37591.0 37561.0 37530.0 37500.0 37469.0 37438.0 37408.0 37377.0 37347.0 37316.0 37288.0 37257.0 37226.0 37196.0 37165.0 37135.0 37104.0 37073.0 37043.0 37012.0 36982.0 36951.0 36923.0 36892.0 36861.0 36831.0 36800.0 36770.0 36739.0 36708.0 36678.0 36647.0 36617.0 36586.0 36557.0 36526.0 36495.0 36465.0 36434.0 36404.0 36373.0 36342.0 36312.0 36281.0 36251.0 36220.0 36192.0 36161.0 2.4 2.53 2.63 2.59 2.47 1.96 1.75 1.66 1.58 1.69 1.87 2.0 1.79 1.59 1.39 1.29 1.13 1.22 1.12 0.73 0.69 0.72 0.779999999999999 0.74 0.67 0.64 0.760000000000001 0.73 0.779999999999999 0.79 0.8 0.76 0.779999999999999 0.84 0.85 0.81 0.779999999999999 0.87 0.9 0.88 0.89 0.93 0.83 0.88 0.96 1.01 0.99 0.9 1.03 1.14 1.24 1.33 1.37 1.33 1.37 1.32 1.28 1.32 1.38 1.5 1.42 1.39 1.35 1.35 1.41 1.45 1.43 1.51 1.64 1.65 1.78 2.08 2.05 2.12 2.18 2.26 2.38 2.28 2.11 1.88 1.7 1.59 1.55 1.53 1.6 1.51 1.68 2.32 2.46 2.44 2.05 1.89 1.9 1.9 2.06 2.09 2.0 1.99 1.97 1.73 1.81 1.82 1.72 1.6 1.57 1.55 1.65 1.42 1.16 1.12 1.27 1.33 1.44 1.47 1.46 1.4 1.33 1.39 1.46 1.39 1.4 1.52 39845.0 39814.0 39783.0 39753.0 39722.0 39692.0 39661.0 39630.0 39600.0 39569.0 39539.0 39508.0 39479.0 39448.0 39417.0 39387.0 39356.0 39326.0 39295.0 39264.0 39234.0 39203.0 39173.0 39142.0 39114.0 39083.0 39052.0 39022.0 38991.0 38961.0 38930.0 38899.0 38869.0 38838.0 38808.0 38777.0 38749.0 38718.0 38687.0 38657.0 38626.0 38596.0 38565.0 38534.0 38504.0 38473.0 38443.0 38412.0 38384.0 38353.0 38322.0 38292.0 38261.0 38231.0 38200.0 38169.0 38139.0 38108.0 38078.0 38047.0
- 35. 38018.0 37987.0 37956.0 37926.0 37895.0 37865.0 37834.0 37803.0 37773.0 37742.0 37712.0 37681.0 37653.0 37622.0 37591.0 37561.0 37530.0 37500.0 37469.0 37438.0 37408.0 37377.0 37347.0 37316.0 37288.0 37257.0 37226.0 37196.0 37165.0 37135.0 37104.0 37073.0 37043.0 37012.0 36982.0 36951.0 36923.0 36892.0 36861.0 36831.0 36800.0 36770.0 36739.0 36708.0 36678.0 36647.0 36617.0 36586.0 36557.0 36526.0 36495.0 36465.0 36434.0 36404.0 36373.0 36342.0 36312.0 36281.0 36251.0 36220.0 36192.0 36161.0 5.21 5.62 6.01 5.68 5.07 3.62 3.26 3.15 2.97 3.05 3.29 3.38 3.08 2.8 2.55 2.25 1.95 2.07 1.98 1.65 1.6 1.64 1.7 1.71 1.56 1.58 1.66 1.6 1.69 1.71 1.71 1.67 1.67 1.64 1.69 1.69 1.7 1.82 1.85 1.85 1.84 1.83 1.7 1.77 1.86 1.87 1.71 1.56 1.65 1.8 1.92 2.01 2.11 2.14 2.18 2.12 2.05 2.03 2.11 2.28 2.19 2.29 2.33 2.36 2.44 2.52 2.56 2.64 2.86 2.81 2.89 3.14 3.16 3.3 3.42 3.57 3.79 3.53 3.32 3.25 3.02 2.93 2.82 2.83 2.98 2.83 2.96 3.16 3.34 3.3 2.88 2.73 2.69 2.68 2.93 2.95 2.77 2.77 2.78 2.56 2.6 2.55 2.43 2.3 2.38 2.46 2.41 2.11 1.77 1.67 1.91 2.12 2.27 2.28 2.21 2.16 2.12 2.18 2.3 2.3 2.39 2.57 Spread (%) Interest Rate Sensitivity 0.0 0.05 0.1 0.15 0.2 2500.0 1518.98290190903 1000.0 707.6314950684456 532.4527357594372 Price of Bond Over Time
- 36. Rate Drops to 5% 0.0 1.0 2.0 3.0 4.0 5.0 6.0 7.0 8.0 9.0 10.0 11.0 12.0 13.0 14.0 15.0 1518.98290190903 1494.932047004481 1469.678649354705 1443.16258182244 1415.320710913562 1386.086746459241 1355.391083782203 1323.160637971313 1289.318669869878 1253.784603363372 1216.473833531541 1177.297525208118 1136.162401468524 1092.97052154195 1047.619047619047 1000.0 Rate Stays at 10% 0.0 1.0 2.0 3.0 4.0 5.0 6.0 7.0 8.0 9.0 10.0 11.0 12.0 13.0 14.0 15.0 1000.0 1000.0 999.9999999999999 1000.0 999.9999999999999 1000.0 999.9999999999999 1000.0 1000.0 1000.0 1000.0 1000.0 1000.0 1000.0 999.9999999999999 1000.0 Rate Rises to 15% 0.0 1.0 2.0 3.0 4.0 5.0 6.0 7.0 8.0 9.0 10.0 11.0 12.0 13.0 14.0 15.0 707.6314950684456 713.7762193287123 720.8426522280192 728.969050062222 738.3144075715553 749.0615687072888 761.420804013382 775.6339246153892 791.9790133076975 810.775865303852 832.3922450994299 857.2510818643444 885.8387441439962 918.7145557655954 956.5217391304349 1000.0 Mar-80 0.5 1.0 5.0 10.0 30.0 0.15 0.14 0.135 0.128 0.123 Feb-00 0.5 1.0 5.0 10.0 30.0 0.004 0.006 0.0169 0.0268 0.0369 Feb-05 0.5 1.0 5.0 10.0 30.0 0.0598 0.0619 0.0674 0.0668 0.0631 Years to Maturity
- 37. Interest Rate (%) 1-Year 0.05 0.1 0.15 0.2 0.25 1047.619047619047 999.9999999999999 956.5217391304349 916.6666666666667 880.0 25-Year 0.05 0.1 0.15 0.2 0.25 1704.697228302238 999.9999999999999 676.792545736493 505.241298005198 402.2667359117775 Interest Rate, rd Bond Value ($) 39845.0 39814.0 39783.0 39753.0 39722.0 39692.0 39661.0 39630.0 39600.0 39569.0 39539.0 39508.0 39479.0 39448.0 39417.0 39387.0 39356.0 39326.0 39295.0 39264.0 39234.0 39203.0 39173.0 39142.0 39114.0 39083.0 39052.0 39022.0 38991.0 38961.0 38930.0 38899.0 38869.0 38838.0 38808.0 38777.0 38749.0 38718.0 38687.0 38657.0 38626.0 38596.0 38565.0 38534.0 38504.0 38473.0 38443.0 38412.0 38384.0 38353.0 38322.0 38292.0 38261.0 38231.0 38200.0 38169.0 38139.0 38108.0 38078.0 38047.0 38018.0 37987.0 37956.0 37926.0 37895.0 37865.0 37834.0 37803.0 37773.0 37742.0 37712.0 37681.0 37653.0 37622.0 37591.0 37561.0 37530.0 37500.0 37469.0 37438.0 37408.0 37377.0 37347.0 37316.0 37288.0 37257.0 37226.0 37196.0 37165.0 37135.0 37104.0 37073.0 37043.0 37012.0 36982.0 36951.0 36923.0 36892.0 36861.0 36831.0 36800.0
- 38. 36770.0 36739.0 36708.0 36678.0 36647.0 36617.0 36586.0 36557.0 36526.0 36495.0 36465.0 36434.0 36404.0 36373.0 36342.0 36312.0 36281.0 36251.0 36220.0 36192.0 36161.0 2.4 2.53 2.63 2.59 2.47 1.96 1.75 1.66 1.58 1.69 1.87 2.0 1.79 1.59 1.39 1.29 1.13 1.22 1.12 0.73 0.69 0.72 0.779999999999999 0.74 0.67 0.64 0.760000000000001 0.73 0.779999999999999 0.79 0.8 0.76 0.779999999999999 0.84 0.85 0.81 0.779999999999999 0.87 0.9 0.88 0.89 0.93 0.83 0.88 0.96 1.01 0.99 0.9 1.03 1.14 1.24 1.33 1.37 1.33 1.37 1.32 1.28 1.32 1.38 1.5 1.42 1.39 1.35 1.35 1.41 1.45 1.43 1.51 1.64 1.65 1.78 2.08 2.05 2.12 2.18 2.26 2.38 2.28 2.11 1.88 1.7 1.59 1.55 1.53 1.6 1.51 1.68 2.32 2.46 2.44 2.05 1.89 1.9 1.9 2.06 2.09 2.0 1.99 1.97 1.73 1.81 1.82 1.72 1.6 1.57 1.55 1.65 1.42 1.16 1.12 1.27 1.33 1.44 1.47 1.46 1.4 1.33 1.39 1.46 1.39 1.4 1.52 39845.0 39814.0 39783.0 39753.0 39722.0 39692.0 39661.0 39630.0 39600.0 39569.0 39539.0 39508.0 39479.0 39448.0 39417.0 39387.0 39356.0 39326.0 39295.0 39264.0 39234.0 39203.0 39173.0 39142.0 39114.0 39083.0 39052.0 39022.0 38991.0 38961.0 38930.0 38899.0 38869.0 38838.0 38808.0 38777.0 38749.0 38718.0 38687.0 38657.0 38626.0 38596.0 38565.0 38534.0 38504.0 38473.0 38443.0 38412.0 38384.0 38353.0 38322.0 38292.0 38261.0 38231.0 38200.0 38169.0 38139.0 38108.0 38078.0 38047.0 38018.0 37987.0 37956.0 37926.0 37895.0 37865.0 37834.0 37803.0 37773.0 37742.0 37712.0 37681.0 37653.0 37622.0 37591.0 37561.0 37530.0 37500.0 37469.0 37438.0 37408.0 37377.0 37347.0 37316.0 37288.0 37257.0 37226.0 37196.0 37165.0 37135.0 37104.0 37073.0 37043.0 37012.0 36982.0
- 39. 36951.0 36923.0 36892.0 36861.0 36831.0 36800.0 36770.0 36739.0 36708.0 36678.0 36647.0 36617.0 36586.0 36557.0 36526.0 36495.0 36465.0 36434.0 36404.0 36373.0 36342.0 36312.0 36281.0 36251.0 36220.0 36192.0 36161.0 5.21 5.62 6.01 5.68 5.07 3.62 3.26 3.15 2.97 3.05 3.29 3.38 3.08 2.8 2.55 2.25 1.95 2.07 1.98 1.65 1.6 1.64 1.7 1.71 1.56 1.58 1.66 1.6 1.69 1.71 1.71 1.67 1.67 1.64 1.69 1.69 1.7 1.82 1.85 1.85 1.84 1.83 1.7 1.77 1.86 1.87 1.71 1.56 1.65 1.8 1.92 2.01 2.11 2.14 2.18 2.12 2.05 2.03 2.11 2.28 2.19 2.29 2.33 2.36 2.44 2.52 2.56 2.64 2.86 2.81 2.89 3.14 3.16 3.3 3.42 3.57 3.79 3.53 3.32 3.25 3.02 2.93 2.82 2.83 2.98 2.83 2.96 3.16 3.34 3.3 2.88 2.73 2.69 2.68 2.93 2.95 2.77 2.77 2.78 2.56 2.6 2.55 2.43 2.3 2.38 2.46 2.41 2.11 1.77 1.67 1.91 2.12 2.27 2.28 2.21 2.16 2.12 2.18 2.3 2.3 2.39 2.57 Spread (%) Interest Rate Sensitivity 0.0 0.05 0.1 0.15 0.2 2500.0 1518.98290190903 1000.0 707.6314950684456 532.4527357594372 Price of Bond Over Time Rate Drops to 5% 0.0 1.0 2.0 3.0 4.0 5.0 6.0 7.0 8.0 9.0 10.0 11.0 12.0 13.0 14.0 15.0 1518.98290190903 1494.932047004481 1469.678649354705 1443.16258182244 1415.320710913562 1386.086746459241 1355.391083782203 1323.160637971313 1289.318669869878 1253.784603363372
- 40. 1216.473833531541 1177.297525208118 1136.162401468524 1092.97052154195 1047.619047619047 1000.0 Rate Stays at 10% 0.0 1.0 2.0 3.0 4.0 5.0 6.0 7.0 8.0 9.0 10.0 11.0 12.0 13.0 14.0 15.0 1000.0 1000.0 999.9999999999999 1000.0 999.9999999999999 1000.0 999.9999999999999 1000.0 1000.0 1000.0 1000.0 1000.0 1000.0 1000.0 999.9999999999999 1000.0 Rate Rises to 15% 0.0 1.0 2.0 3.0 4.0 5.0 6.0 7.0 8.0 9.0 10.0 11.0 12.0 13.0 14.0 15.0 707.6314950684456 713.7762193287123 720.8426522280192 728.969050062222 738.3144075715553 749.0615687072888 761.420804013382 775.6339246153892 791.9790133076975 810.775865303852 832.3922450994299 857.2510818643444 885.8387441439962 918.7145557655954 956.5217391304349 1000.0 Mar-80 0.5 1.0 5.0 10.0 30.0 0.15 0.14 0.135 0.128 0.123 Feb-00 0.5 1.0 5.0 10.0 30.0 0.004 0.006 0.0169 0.0268 0.0369 Feb-05 0.5 1.0 5.0 10.0 30.0 0.0598 0.0619 0.0674 0.0668 0.0631 Years to Maturity Interest Rate (%) 1-Year 0.05 0.1 0.15 0.2 0.25 1047.619047619047 999.9999999999999 956.5217391304349 916.6666666666667 880.0 25-Year 0.05 0.1 0.15
- 41. 0.2 0.25 1704.697228302238 999.9999999999999 676.792545736493 505.241298005198 402.2667359117775 Interest Rate, rd Bond Value ($) 39845.0 39814.0 39783.0 39753.0 39722.0 39692.0 39661.0 39630.0 39600.0 39569.0 39539.0 39508.0 39479.0 39448.0 39417.0 39387.0 39356.0 39326.0 39295.0 39264.0 39234.0 39203.0 39173.0 39142.0 39114.0 39083.0 39052.0 39022.0 38991.0 38961.0 38930.0 38899.0 38869.0 38838.0 38808.0 38777.0 38749.0 38718.0 38687.0 38657.0 38626.0 38596.0 38565.0 38534.0 38504.0 38473.0 38443.0 38412.0 38384.0 38353.0 38322.0 38292.0 38261.0 38231.0 38200.0 38169.0 38139.0 38108.0 38078.0 38047.0 38018.0 37987.0 37956.0 37926.0 37895.0 37865.0 37834.0 37803.0 37773.0 37742.0 37712.0 37681.0 37653.0 37622.0 37591.0 37561.0 37530.0 37500.0 37469.0 37438.0 37408.0 37377.0 37347.0 37316.0 37288.0 37257.0 37226.0 37196.0 37165.0 37135.0 37104.0 37073.0 37043.0 37012.0 36982.0 36951.0 36923.0 36892.0 36861.0 36831.0 36800.0 36770.0 36739.0 36708.0 36678.0 36647.0 36617.0 36586.0 36557.0 36526.0 36495.0 36465.0 36434.0 36404.0 36373.0 36342.0 36312.0 36281.0 36251.0 36220.0 36192.0 36161.0 2.4 2.53 2.63 2.59 2.47 1.96 1.75 1.66 1.58 1.69 1.87 2.0 1.79 1.59 1.39 1.29 1.13 1.22 1.12 0.73 0.69 0.72 0.779999999999999 0.74 0.67 0.64
- 42. 0.760000000000001 0.73 0.779999999999999 0.79 0.8 0.76 0.779999999999999 0.84 0.85 0.81 0.779999999999999 0.87 0.9 0.88 0.89 0.93 0.83 0.88 0.96 1.01 0.99 0.9 1.03 1.14 1.24 1.33 1.37 1.33 1.37 1.32 1.28 1.32 1.38 1.5 1.42 1.39 1.35 1.35 1.41 1.45 1.43 1.51 1.64 1.65 1.78 2.08 2.05 2.12 2.18 2.26 2.38 2.28 2.11 1.88 1.7 1.59 1.55 1.53 1.6 1.51 1.68 2.32 2.46 2.44 2.05 1.89 1.9 1.9 2.06 2.09 2.0 1.99 1.97 1.73 1.81 1.82 1.72 1.6 1.57 1.55 1.65 1.42 1.16 1.12 1.27 1.33 1.44 1.47 1.46 1.4 1.33 1.39 1.46 1.39 1.4 1.52 39845.0 39814.0 39783.0 39753.0 39722.0 39692.0 39661.0 39630.0 39600.0 39569.0 39539.0 39508.0 39479.0 39448.0 39417.0 39387.0 39356.0 39326.0 39295.0 39264.0 39234.0 39203.0 39173.0 39142.0 39114.0 39083.0 39052.0 39022.0 38991.0 38961.0 38930.0 38899.0 38869.0 38838.0 38808.0 38777.0 38749.0 38718.0 38687.0 38657.0 38626.0 38596.0 38565.0 38534.0 38504.0 38473.0 38443.0 38412.0 38384.0 38353.0 38322.0 38292.0 38261.0 38231.0 38200.0 38169.0 38139.0 38108.0 38078.0 38047.0 38018.0 37987.0 37956.0 37926.0 37895.0 37865.0 37834.0 37803.0 37773.0 37742.0 37712.0 37681.0 37653.0 37622.0 37591.0 37561.0 37530.0 37500.0 37469.0 37438.0 37408.0 37377.0 37347.0 37316.0 37288.0 37257.0 37226.0 37196.0 37165.0 37135.0 37104.0 37073.0 37043.0 37012.0 36982.0 36951.0 36923.0 36892.0 36861.0 36831.0 36800.0 36770.0 36739.0 36708.0 36678.0 36647.0 36617.0 36586.0 36557.0 36526.0 36495.0 36465.0 36434.0 36404.0 36373.0 36342.0 36312.0 36281.0 36251.0 36220.0 36192.0 36161.0 5.21 5.62 6.01 5.68 5.07 3.62 3.26 3.15 2.97 3.05 3.29 3.38 3.08 2.8 2.55 2.25 1.95 2.07
- 43. 1.98 1.65 1.6 1.64 1.7 1.71 1.56 1.58 1.66 1.6 1.69 1.71 1.71 1.67 1.67 1.64 1.69 1.69 1.7 1.82 1.85 1.85 1.84 1.83 1.7 1.77 1.86 1.87 1.71 1.56 1.65 1.8 1.92 2.01 2.11 2.14 2.18 2.12 2.05 2.03 2.11 2.28 2.19 2.29 2.33 2.36 2.44 2.52 2.56 2.64 2.86 2.81 2.89 3.14 3.16 3.3 3.42 3.57 3.79 3.53 3.32 3.25 3.02 2.93 2.82 2.83 2.98 2.83 2.96 3.16 3.34 3.3 2.88 2.73 2.69 2.68 2.93 2.95 2.77 2.77 2.78 2.56 2.6 2.55 2.43 2.3 2.38 2.46 2.41 2.11 1.77 1.67 1.91 2.12 2.27 2.28 2.21 2.16 2.12 2.18 2.3 2.3 2.39 2.57 Spread (%) Yield Curve for March 1980 Interest Rate Sensitivity 0.0 0.05 0.1 0.15 0.2 2500.0 1518.98290190903 1000.0 707.6314950684456 532.4527357594372 Price of Bond Over Time Rate Drops to 5% 0.0 1.0 2.0 3.0 4.0 5.0 6.0 7.0 8.0 9.0 10.0 11.0 12.0 13.0 14.0 15.0 1518.98290190903 1494.932047004481 1469.678649354705 1443.16258182244 1415.320710913562 1386.086746459241 1355.391083782203 1323.160637971313 1289.318669869878 1253.784603363372 1216.473833531541 1177.297525208118 1136.162401468524 1092.97052154195 1047.619047619047 1000.0 Rate Stays at 10% 0.0 1.0 2.0 3.0 4.0 5.0 6.0 7.0 8.0 9.0 10.0 11.0 12.0 13.0 14.0 15.0 1000.0 1000.0 999.9999999999999 1000.0 999.9999999999999 1000.0
- 44. 999.9999999999999 1000.0 1000.0 1000.0 1000.0 1000.0 1000.0 1000.0 999.9999999999999 1000.0 Rate Rises to 15% 0.0 1.0 2.0 3.0 4.0 5.0 6.0 7.0 8.0 9.0 10.0 11.0 12.0 13.0 14.0 15.0 707.6314950684456 713.7762193287123 720.8426522280192 728.969050062222 738.3144075715553 749.0615687072888 761.420804013382 775.6339246153892 791.9790133076975 810.775865303852 832.3922450994299 857.2510818643444 885.8387441439962 918.7145557655954 956.5217391304349 1000.0 Mar-80 0.5 1.0 5.0 10.0 30.0 0.15 0.14 0.135 0.128 0.123 Feb-00 0.5 1.0 5.0 10.0 30.0 0.004 0.006 0.0169 0.0268 0.0369 Feb-05 0.5 1.0 5.0 10.0 30.0 0.0598 0.0619 0.0674 0.0668 0.0631 Years to Maturity Interest Rate (%) 1-Year 0.05 0.1 0.15 0.2 0.25 1047.619047619047 999.9999999999999 956.5217391304349 916.6666666666667 880.0 25-Year 0.05 0.1 0.15 0.2 0.25 1704.697228302238 999.9999999999999 676.792545736493 505.241298005198 402.2667359117775 Interest Rate, rd Bond Value
- 45. ($) 39845.0 39814.0 39783.0 39753.0 39722.0 39692.0 39661.0 39630.0 39600.0 39569.0 39539.0 39508.0 39479.0 39448.0 39417.0 39387.0 39356.0 39326.0 39295.0 39264.0 39234.0 39203.0 39173.0 39142.0 39114.0 39083.0 39052.0 39022.0 38991.0 38961.0 38930.0 38899.0 38869.0 38838.0 38808.0 38777.0 38749.0 38718.0 38687.0 38657.0 38626.0 38596.0 38565.0 38534.0 38504.0 38473.0 38443.0 38412.0 38384.0 38353.0 38322.0 38292.0 38261.0 38231.0 38200.0 38169.0 38139.0 38108.0 38078.0 38047.0 38018.0 37987.0 37956.0 37926.0 37895.0 37865.0 37834.0 37803.0 37773.0 37742.0 37712.0 37681.0 37653.0 37622.0 37591.0 37561.0 37530.0 37500.0 37469.0 37438.0 37408.0 37377.0 37347.0 37316.0 37288.0 37257.0 37226.0 37196.0 37165.0 37135.0 37104.0 37073.0 37043.0 37012.0 36982.0 36951.0 36923.0 36892.0 36861.0 36831.0 36800.0 36770.0 36739.0 36708.0 36678.0 36647.0 36617.0 36586.0 36557.0 36526.0 36495.0 36465.0 36434.0 36404.0 36373.0 36342.0 36312.0 36281.0 36251.0 36220.0 36192.0 36161.0 2.4 2.53 2.63 2.59 2.47 1.96 1.75 1.66 1.58 1.69 1.87 2.0 1.79 1.59 1.39 1.29 1.13 1.22 1.12 0.73 0.69 0.72 0.779999999999999 0.74 0.67 0.64 0.760000000000001 0.73 0.779999999999999 0.79 0.8 0.76 0.779999999999999 0.84 0.85 0.81 0.779999999999999 0.87 0.9 0.88 0.89 0.93 0.83 0.88 0.96 1.01 0.99 0.9 1.03 1.14 1.24 1.33 1.37 1.33 1.37 1.32 1.28 1.32 1.38 1.5 1.42 1.39 1.35 1.35 1.41 1.45 1.43 1.51 1.64 1.65 1.78 2.08 2.05 2.12 2.18 2.26 2.38
- 46. 2.28 2.11 1.88 1.7 1.59 1.55 1.53 1.6 1.51 1.68 2.32 2.46 2.44 2.05 1.89 1.9 1.9 2.06 2.09 2.0 1.99 1.97 1.73 1.81 1.82 1.72 1.6 1.57 1.55 1.65 1.42 1.16 1.12 1.27 1.33 1.44 1.47 1.46 1.4 1.33 1.39 1.46 1.39 1.4 1.52 39845.0 39814.0 39783.0 39753.0 39722.0 39692.0 39661.0 39630.0 39600.0 39569.0 39539.0 39508.0 39479.0 39448.0 39417.0 39387.0 39356.0 39326.0 39295.0 39264.0 39234.0 39203.0 39173.0 39142.0 39114.0 39083.0 39052.0 39022.0 38991.0 38961.0 38930.0 38899.0 38869.0 38838.0 38808.0 38777.0 38749.0 38718.0 38687.0 38657.0 38626.0 38596.0 38565.0 38534.0 38504.0 38473.0 38443.0 38412.0 38384.0 38353.0 38322.0 38292.0 38261.0 38231.0 38200.0 38169.0 38139.0 38108.0 38078.0 38047.0 38018.0 37987.0 37956.0 37926.0 37895.0 37865.0 37834.0 37803.0 37773.0 37742.0 37712.0 37681.0 37653.0 37622.0 37591.0 37561.0 37530.0 37500.0 37469.0 37438.0 37408.0 37377.0 37347.0 37316.0 37288.0 37257.0 37226.0 37196.0 37165.0 37135.0 37104.0 37073.0 37043.0 37012.0 36982.0 36951.0 36923.0 36892.0 36861.0 36831.0 36800.0 36770.0 36739.0 36708.0 36678.0 36647.0 36617.0 36586.0 36557.0 36526.0 36495.0 36465.0 36434.0 36404.0 36373.0 36342.0 36312.0 36281.0 36251.0 36220.0 36192.0 36161.0 5.21 5.62 6.01 5.68 5.07 3.62 3.26 3.15 2.97 3.05 3.29 3.38 3.08 2.8 2.55 2.25 1.95 2.07 1.98 1.65 1.6 1.64 1.7 1.71 1.56 1.58 1.66 1.6 1.69 1.71 1.71 1.67 1.67 1.64 1.69 1.69 1.7 1.82 1.85 1.85 1.84 1.83 1.7 1.77 1.86 1.87 1.71 1.56 1.65 1.8 1.92 2.01 2.11 2.14 2.18 2.12 2.05 2.03 2.11 2.28 2.19 2.29 2.33 2.36 2.44 2.52 2.56 2.64 2.86 2.81 2.89 3.14 3.16 3.3 3.42 3.57 3.79 3.53 3.32 3.25 3.02 2.93 2.82 2.83
- 47. 2.98 2.83 2.96 3.16 3.34 3.3 2.88 2.73 2.69 2.68 2.93 2.95 2.77 2.77 2.78 2.56 2.6 2.55 2.43 2.3 2.38 2.46 2.41 2.11 1.77 1.67 1.91 2.12 2.27 2.28 2.21 2.16 2.12 2.18 2.3 2.3 2.39 2.57 Spread (%) Yield Curve for February 2000 Interest Rate Sensitivity 0.0 0.05 0.1 0.15 0.2 2500.0 1518.98290190903 1000.0 707.6314950684456 532.4527357594372 Price of Bond Over Time Rate Drops to 5% 0.0 1.0 2.0 3.0 4.0 5.0 6.0 7.0 8.0 9.0 10.0 11.0 12.0 13.0 14.0 15.0 1518.98290190903 1494.932047004481 1469.678649354705 1443.16258182244 1415.320710913562 1386.086746459241 1355.391083782203 1323.160637971313 1289.318669869878 1253.784603363372 1216.473833531541 1177.297525208118 1136.162401468524 1092.97052154195 1047.619047619047 1000.0 Rate Stays at 10% 0.0 1.0 2.0 3.0 4.0 5.0 6.0 7.0 8.0 9.0 10.0 11.0 12.0 13.0 14.0 15.0 1000.0 1000.0 999.9999999999999 1000.0 999.9999999999999 1000.0 999.9999999999999 1000.0 1000.0 1000.0 1000.0 1000.0 1000.0 1000.0 999.9999999999999 1000.0 Rate Rises to 15% 0.0 1.0 2.0 3.0 4.0 5.0 6.0 7.0 8.0 9.0 10.0 11.0 12.0 13.0 14.0 15.0 707.6314950684456 713.7762193287123 720.8426522280192 728.969050062222
- 48. 738.3144075715553 749.0615687072888 761.420804013382 775.6339246153892 791.9790133076975 810.775865303852 832.3922450994299 857.2510818643444 885.8387441439962 918.7145557655954 956.5217391304349 1000.0 Mar-80 0.5 1.0 5.0 10.0 30.0 0.15 0.14 0.135 0.128 0.123 Feb-00 0.5 1.0 5.0 10.0 30.0 0.004 0.006 0.0169 0.0268 0.0369 Feb-05 0.5 1.0 5.0 10.0 30.0 0.0598 0.0619 0.0674 0.0668 0.0631 Years to Maturity Interest Rate (%) 1-Year 0.05 0.1 0.15 0.2 0.25 1047.619047619047 999.9999999999999 956.5217391304349 916.6666666666667 880.0 25-Year 0.05 0.1 0.15 0.2 0.25 1704.697228302238 999.9999999999999 676.792545736493 505.241298005198 402.2667359117775 Interest Rate, rd Bond Value ($) 39845.0 39814.0 39783.0 39753.0 39722.0 39692.0 39661.0 39630.0 39600.0 39569.0 39539.0 39508.0 39479.0 39448.0 39417.0 39387.0
- 49. 39356.0 39326.0 39295.0 39264.0 39234.0 39203.0 39173.0 39142.0 39114.0 39083.0 39052.0 39022.0 38991.0 38961.0 38930.0 38899.0 38869.0 38838.0 38808.0 38777.0 38749.0 38718.0 38687.0 38657.0 38626.0 38596.0 38565.0 38534.0 38504.0 38473.0 38443.0 38412.0 38384.0 38353.0 38322.0 38292.0 38261.0 38231.0 38200.0 38169.0 38139.0 38108.0 38078.0 38047.0 38018.0 37987.0 37956.0 37926.0 37895.0 37865.0 37834.0 37803.0 37773.0 37742.0 37712.0 37681.0 37653.0 37622.0 37591.0 37561.0 37530.0 37500.0 37469.0 37438.0 37408.0 37377.0 37347.0 37316.0 37288.0 37257.0 37226.0 37196.0 37165.0 37135.0 37104.0 37073.0 37043.0 37012.0 36982.0 36951.0 36923.0 36892.0 36861.0 36831.0 36800.0 36770.0 36739.0 36708.0 36678.0 36647.0 36617.0 36586.0 36557.0 36526.0 36495.0 36465.0 36434.0 36404.0 36373.0 36342.0 36312.0 36281.0 36251.0 36220.0 36192.0 36161.0 2.4 2.53 2.63 2.59 2.47 1.96 1.75 1.66 1.58 1.69 1.87 2.0 1.79 1.59 1.39 1.29 1.13 1.22 1.12 0.73 0.69 0.72 0.779999999999999 0.74 0.67 0.64 0.760000000000001 0.73 0.779999999999999 0.79 0.8 0.76 0.779999999999999 0.84 0.85 0.81 0.779999999999999 0.87 0.9 0.88 0.89 0.93 0.83 0.88 0.96 1.01 0.99 0.9 1.03 1.14 1.24 1.33 1.37 1.33 1.37 1.32 1.28 1.32 1.38 1.5 1.42 1.39 1.35 1.35 1.41 1.45 1.43 1.51 1.64 1.65 1.78 2.08 2.05 2.12 2.18 2.26 2.38 2.28 2.11 1.88 1.7 1.59 1.55 1.53 1.6 1.51 1.68 2.32 2.46 2.44 2.05 1.89 1.9 1.9 2.06 2.09 2.0 1.99 1.97 1.73 1.81 1.82 1.72 1.6 1.57 1.55 1.65 1.42 1.16 1.12 1.27 1.33 1.44 1.47 1.46 1.4 1.33 1.39 1.46 1.39 1.4 1.52 39845.0 39814.0 39783.0 39753.0 39722.0 39692.0 39661.0 39630.0 39600.0 39569.0
- 50. 39539.0 39508.0 39479.0 39448.0 39417.0 39387.0 39356.0 39326.0 39295.0 39264.0 39234.0 39203.0 39173.0 39142.0 39114.0 39083.0 39052.0 39022.0 38991.0 38961.0 38930.0 38899.0 38869.0 38838.0 38808.0 38777.0 38749.0 38718.0 38687.0 38657.0 38626.0 38596.0 38565.0 38534.0 38504.0 38473.0 38443.0 38412.0 38384.0 38353.0 38322.0 38292.0 38261.0 38231.0 38200.0 38169.0 38139.0 38108.0 38078.0 38047.0 38018.0 37987.0 37956.0 37926.0 37895.0 37865.0 37834.0 37803.0 37773.0 37742.0 37712.0 37681.0 37653.0 37622.0 37591.0 37561.0 37530.0 37500.0 37469.0 37438.0 37408.0 37377.0 37347.0 37316.0 37288.0 37257.0 37226.0 37196.0 37165.0 37135.0 37104.0 37073.0 37043.0 37012.0 36982.0 36951.0 36923.0 36892.0 36861.0 36831.0 36800.0 36770.0 36739.0 36708.0 36678.0 36647.0 36617.0 36586.0 36557.0 36526.0 36495.0 36465.0 36434.0 36404.0 36373.0 36342.0 36312.0 36281.0 36251.0 36220.0 36192.0 36161.0 5.21 5.62 6.01 5.68 5.07 3.62 3.26 3.15 2.97 3.05 3.29 3.38 3.08 2.8 2.55 2.25 1.95 2.07 1.98 1.65 1.6 1.64 1.7 1.71 1.56 1.58 1.66 1.6 1.69 1.71 1.71 1.67 1.67 1.64 1.69 1.69 1.7 1.82 1.85 1.85 1.84 1.83 1.7 1.77 1.86 1.87 1.71 1.56 1.65 1.8 1.92 2.01 2.11 2.14 2.18 2.12 2.05 2.03 2.11 2.28 2.19 2.29 2.33 2.36 2.44 2.52 2.56 2.64 2.86 2.81 2.89 3.14 3.16 3.3 3.42 3.57 3.79 3.53 3.32 3.25 3.02 2.93 2.82 2.83 2.98 2.83 2.96 3.16 3.34 3.3 2.88 2.73 2.69 2.68 2.93 2.95 2.77 2.77 2.78 2.56 2.6 2.55 2.43 2.3 2.38 2.46 2.41 2.11 1.77 1.67 1.91 2.12 2.27 2.28 2.21 2.16 2.12 2.18 2.3 2.3 2.39 2.57 Spread
- 51. (%) Yield Curve for March 2009 Interest Rate Sensitivity 0.0 0.05 0.1 0.15 0.2 2500.0 1518.98290190903 1000.0 707.6314950684456 532.4527357594372 Price of Bond Over Time Rate Drops to 5% 0.0 1.0 2.0 3.0 4.0 5.0 6.0 7.0 8.0 9.0 10.0 11.0 12.0 13.0 14.0 15.0 1518.98290190903 1494.932047004481 1469.678649354705 1443.16258182244 1415.320710913562 1386.086746459241 1355.391083782203 1323.160637971313 1289.318669869878 1253.784603363372 1216.473833531541 1177.297525208118 1136.162401468524 1092.97052154195 1047.619047619047 1000.0 Rate Stays at 10% 0.0 1.0 2.0 3.0 4.0 5.0 6.0 7.0 8.0 9.0 10.0 11.0 12.0 13.0 14.0 15.0 1000.0 1000.0 999.9999999999999 1000.0 999.9999999999999 1000.0 999.9999999999999 1000.0 1000.0 1000.0 1000.0 1000.0 1000.0 1000.0 999.9999999999999 1000.0 Rate Rises to 15% 0.0 1.0 2.0 3.0 4.0 5.0 6.0 7.0 8.0 9.0 10.0 11.0 12.0 13.0 14.0 15.0 707.6314950684456 713.7762193287123 720.8426522280192 728.969050062222 738.3144075715553 749.0615687072888 761.420804013382 775.6339246153892 791.9790133076975 810.775865303852 832.3922450994299 857.2510818643444 885.8387441439962 918.7145557655954 956.5217391304349 1000.0
- 52. Mar-80 0.5 1.0 5.0 10.0 30.0 0.15 0.14 0.135 0.128 0.123 Feb-00 0.5 1.0 5.0 10.0 30.0 0.004 0.006 0.0169 0.0268 0.0369 Feb-05 0.5 1.0 5.0 10.0 30.0 0.0598 0.0619 0.0674 0.0668 0.0631 Years to Maturity Interest Rate (%) 1-Year 0.05 0.1 0.15 0.2 0.25 1047.619047619047 999.9999999999999 956.5217391304349 916.6666666666667 880.0 25-Year 0.05 0.1 0.15 0.2 0.25 1704.697228302238 999.9999999999999 676.792545736493 505.241298005198 402.2667359117775 Interest Rate, rd Bond Value ($) 39845.0 39814.0 39783.0 39753.0 39722.0 39692.0 39661.0 39630.0 39600.0 39569.0 39539.0 39508.0 39479.0 39448.0 39417.0 39387.0 39356.0 39326.0 39295.0 39264.0 39234.0 39203.0 39173.0 39142.0 39114.0 39083.0 39052.0 39022.0 38991.0 38961.0 38930.0 38899.0 38869.0 38838.0 38808.0 38777.0 38749.0 38718.0 38687.0 38657.0 38626.0 38596.0 38565.0 38534.0 38504.0 38473.0
- 53. 38443.0 38412.0 38384.0 38353.0 38322.0 38292.0 38261.0 38231.0 38200.0 38169.0 38139.0 38108.0 38078.0 38047.0 38018.0 37987.0 37956.0 37926.0 37895.0 37865.0 37834.0 37803.0 37773.0 37742.0 37712.0 37681.0 37653.0 37622.0 37591.0 37561.0 37530.0 37500.0 37469.0 37438.0 37408.0 37377.0 37347.0 37316.0 37288.0 37257.0 37226.0 37196.0 37165.0 37135.0 37104.0 37073.0 37043.0 37012.0 36982.0 36951.0 36923.0 36892.0 36861.0 36831.0 36800.0 36770.0 36739.0 36708.0 36678.0 36647.0 36617.0 36586.0 36557.0 36526.0 36495.0 36465.0 36434.0 36404.0 36373.0 36342.0 36312.0 36281.0 36251.0 36220.0 36192.0 36161.0 2.4 2.53 2.63 2.59 2.47 1.96 1.75 1.66 1.58 1.69 1.87 2.0 1.79 1.59 1.39 1.29 1.13 1.22 1.12 0.73 0.69 0.72 0.779999999999999 0.74 0.67 0.64 0.760000000000001 0.73 0.779999999999999 0.79 0.8 0.76 0.779999999999999 0.84 0.85 0.81 0.779999999999999 0.87 0.9 0.88 0.89 0.93 0.83 0.88 0.96 1.01 0.99 0.9 1.03 1.14 1.24 1.33 1.37 1.33 1.37 1.32 1.28 1.32 1.38 1.5 1.42 1.39 1.35 1.35 1.41 1.45 1.43 1.51 1.64 1.65 1.78 2.08 2.05 2.12 2.18 2.26 2.38 2.28 2.11 1.88 1.7 1.59 1.55 1.53 1.6 1.51 1.68 2.32 2.46 2.44 2.05 1.89 1.9 1.9 2.06 2.09 2.0 1.99 1.97 1.73 1.81 1.82 1.72 1.6 1.57 1.55 1.65 1.42 1.16 1.12 1.27 1.33 1.44 1.47 1.46 1.4 1.33 1.39 1.46 1.39 1.4 1.52 39845.0 39814.0 39783.0 39753.0 39722.0 39692.0 39661.0 39630.0 39600.0 39569.0 39539.0 39508.0 39479.0 39448.0 39417.0 39387.0 39356.0 39326.0 39295.0 39264.0 39234.0 39203.0 39173.0 39142.0 39114.0 39083.0 39052.0 39022.0 38991.0 38961.0 38930.0 38899.0 38869.0 38838.0 38808.0 38777.0 38749.0 38718.0 38687.0 38657.0
- 54. 38626.0 38596.0 38565.0 38534.0 38504.0 38473.0 38443.0 38412.0 38384.0 38353.0 38322.0 38292.0 38261.0 38231.0 38200.0 38169.0 38139.0 38108.0 38078.0 38047.0 38018.0 37987.0 37956.0 37926.0 37895.0 37865.0 37834.0 37803.0 37773.0 37742.0 37712.0 37681.0 37653.0 37622.0 37591.0 37561.0 37530.0 37500.0 37469.0 37438.0 37408.0 37377.0 37347.0 37316.0 37288.0 37257.0 37226.0 37196.0 37165.0 37135.0 37104.0 37073.0 37043.0 37012.0 36982.0 36951.0 36923.0 36892.0 36861.0 36831.0 36800.0 36770.0 36739.0 36708.0 36678.0 36647.0 36617.0 36586.0 36557.0 36526.0 36495.0 36465.0 36434.0 36404.0 36373.0 36342.0 36312.0 36281.0 36251.0 36220.0 36192.0 36161.0 5.21 5.62 6.01 5.68 5.07 3.62 3.26 3.15 2.97 3.05 3.29 3.38 3.08 2.8 2.55 2.25 1.95 2.07 1.98 1.65 1.6 1.64 1.7 1.71 1.56 1.58 1.66 1.6 1.69 1.71 1.71 1.67 1.67 1.64 1.69 1.69 1.7 1.82 1.85 1.85 1.84 1.83 1.7 1.77 1.86 1.87 1.71 1.56 1.65 1.8 1.92 2.01 2.11 2.14 2.18 2.12 2.05 2.03 2.11 2.28 2.19 2.29 2.33 2.36 2.44 2.52 2.56 2.64 2.86 2.81 2.89 3.14 3.16 3.3 3.42 3.57 3.79 3.53 3.32 3.25 3.02 2.93 2.82 2.83 2.98 2.83 2.96 3.16 3.34 3.3 2.88 2.73 2.69 2.68 2.93 2.95 2.77 2.77 2.78 2.56 2.6 2.55 2.43 2.3 2.38 2.46 2.41 2.11 1.77 1.67 1.91 2.12 2.27 2.28 2.21 2.16 2.12 2.18 2.3 2.3 2.39 2.57 Spread (%) Interest Rate Sensitivity 0.0 0.05 0.1 0.15 0.2 2500.0 1518.98290190903 1000.0 707.6314950684456 532.4527357594372
- 55. Price of Bond Over Time Rate Drops to 5% 0.0 1.0 2.0 3.0 4.0 5.0 6.0 7.0 8.0 9.0 10.0 11.0 12.0 13.0 14.0 15.0 1518.98290190903 1494.932047004481 1469.678649354705 1443.16258182244 1415.320710913562 1386.086746459241 1355.391083782203 1323.160637971313 1289.318669869878 1253.784603363372 1216.473833531541 1177.297525208118 1136.162401468524 1092.97052154195 1047.619047619047 1000.0 Rate Stays at 10% 0.0 1.0 2.0 3.0 4.0 5.0 6.0 7.0 8.0 9.0 10.0 11.0 12.0 13.0 14.0 15.0 1000.0 1000.0 999.9999999999999 1000.0 999.9999999999999 1000.0 999.9999999999999 1000.0 1000.0 1000.0 1000.0 1000.0 1000.0 1000.0 999.9999999999999 1000.0 Rate Rises to 15% 0.0 1.0 2.0 3.0 4.0 5.0 6.0 7.0 8.0 9.0 10.0 11.0 12.0 13.0 14.0 15.0 707.6314950684456 713.7762193287123 720.8426522280192 728.969050062222 738.3144075715553 749.0615687072888 761.420804013382 775.6339246153892 791.9790133076975 810.775865303852 832.3922450994299 857.2510818643444 885.8387441439962 918.7145557655954 956.5217391304349 1000.0 Mar-80 0.5 1.0 5.0 10.0 30.0 0.15 0.14 0.135 0.128 0.123 Feb-00 0.5 1.0 5.0 10.0 30.0 0.004 0.006 0.0169 0.0268 0.0369 Feb-05 0.5
- 56. 1.0 5.0 10.0 30.0 0.0598 0.0619 0.0674 0.0668 0.0631 Years to Maturity Interest Rate (%) 1-Year 0.05 0.1 0.15 0.2 0.25 1047.619047619047 999.9999999999999 956.5217391304349 916.6666666666667 880.0 25-Year 0.05 0.1 0.15 0.2 0.25 1704.697228302238 999.9999999999999 676.792545736493 505.241298005198 402.2667359117775 Interest Rate, rd Bond Value ($) 39845.0 39814.0 39783.0 39753.0 39722.0 39692.0 39661.0 39630.0 39600.0 39569.0 39539.0 39508.0 39479.0 39448.0 39417.0 39387.0 39356.0 39326.0 39295.0 39264.0 39234.0 39203.0 39173.0 39142.0 39114.0 39083.0 39052.0 39022.0 38991.0 38961.0 38930.0 38899.0 38869.0 38838.0 38808.0 38777.0 38749.0 38718.0 38687.0 38657.0 38626.0 38596.0 38565.0 38534.0 38504.0 38473.0 38443.0 38412.0 38384.0 38353.0 38322.0 38292.0 38261.0 38231.0 38200.0 38169.0 38139.0 38108.0 38078.0 38047.0 38018.0 37987.0 37956.0 37926.0 37895.0 37865.0 37834.0 37803.0 37773.0 37742.0 37712.0 37681.0 37653.0 37622.0 37591.0 37561.0 37530.0 37500.0 37469.0 37438.0 37408.0
- 57. 37377.0 37347.0 37316.0 37288.0 37257.0 37226.0 37196.0 37165.0 37135.0 37104.0 37073.0 37043.0 37012.0 36982.0 36951.0 36923.0 36892.0 36861.0 36831.0 36800.0 36770.0 36739.0 36708.0 36678.0 36647.0 36617.0 36586.0 36557.0 36526.0 36495.0 36465.0 36434.0 36404.0 36373.0 36342.0 36312.0 36281.0 36251.0 36220.0 36192.0 36161.0 2.4 2.53 2.63 2.59 2.47 1.96 1.75 1.66 1.58 1.69 1.87 2.0 1.79 1.59 1.39 1.29 1.13 1.22 1.12 0.73 0.69 0.72 0.779999999999999 0.74 0.67 0.64 0.760000000000001 0.73 0.779999999999999 0.79 0.8 0.76 0.779999999999999 0.84 0.85 0.81 0.779999999999999 0.87 0.9 0.88 0.89 0.93 0.83 0.88 0.96 1.01 0.99 0.9 1.03 1.14 1.24 1.33 1.37 1.33 1.37 1.32 1.28 1.32 1.38 1.5 1.42 1.39 1.35 1.35 1.41 1.45 1.43 1.51 1.64 1.65 1.78 2.08 2.05 2.12 2.18 2.26 2.38 2.28 2.11 1.88 1.7 1.59 1.55 1.53 1.6 1.51 1.68 2.32 2.46 2.44 2.05 1.89 1.9 1.9 2.06 2.09 2.0 1.99 1.97 1.73 1.81 1.82 1.72 1.6 1.57 1.55 1.65 1.42 1.16 1.12 1.27 1.33 1.44 1.47 1.46 1.4 1.33 1.39 1.46 1.39 1.4 1.52 39845.0 39814.0 39783.0 39753.0 39722.0 39692.0 39661.0 39630.0 39600.0 39569.0 39539.0 39508.0 39479.0 39448.0 39417.0 39387.0 39356.0 39326.0 39295.0 39264.0 39234.0 39203.0 39173.0 39142.0 39114.0 39083.0 39052.0 39022.0 38991.0 38961.0 38930.0 38899.0 38869.0 38838.0 38808.0 38777.0 38749.0 38718.0 38687.0 38657.0 38626.0 38596.0 38565.0 38534.0 38504.0 38473.0 38443.0 38412.0 38384.0 38353.0 38322.0 38292.0 38261.0 38231.0 38200.0 38169.0 38139.0 38108.0 38078.0 38047.0 38018.0 37987.0 37956.0 37926.0 37895.0 37865.0 37834.0 37803.0 37773.0 37742.0 37712.0 37681.0 37653.0 37622.0 37591.0
- 58. 37561.0 37530.0 37500.0 37469.0 37438.0 37408.0 37377.0 37347.0 37316.0 37288.0 37257.0 37226.0 37196.0 37165.0 37135.0 37104.0 37073.0 37043.0 37012.0 36982.0 36951.0 36923.0 36892.0 36861.0 36831.0 36800.0 36770.0 36739.0 36708.0 36678.0 36647.0 36617.0 36586.0 36557.0 36526.0 36495.0 36465.0 36434.0 36404.0 36373.0 36342.0 36312.0 36281.0 36251.0 36220.0 36192.0 36161.0 5.21 5.62 6.01 5.68 5.07 3.62 3.26 3.15 2.97 3.05 3.29 3.38 3.08 2.8 2.55 2.25 1.95 2.07 1.98 1.65 1.6 1.64 1.7 1.71 1.56 1.58 1.66 1.6 1.69 1.71 1.71 1.67 1.67 1.64 1.69 1.69 1.7 1.82 1.85 1.85 1.84 1.83 1.7 1.77 1.86 1.87 1.71 1.56 1.65 1.8 1.92 2.01 2.11 2.14 2.18 2.12 2.05 2.03 2.11 2.28 2.19 2.29 2.33 2.36 2.44 2.52 2.56 2.64 2.86 2.81 2.89 3.14 3.16 3.3 3.42 3.57 3.79 3.53 3.32 3.25 3.02 2.93 2.82 2.83 2.98 2.83 2.96 3.16 3.34 3.3 2.88 2.73 2.69 2.68 2.93 2.95 2.77 2.77 2.78 2.56 2.6 2.55 2.43 2.3 2.38 2.46 2.41 2.11 1.77 1.67 1.91 2.12 2.27 2.28 2.21 2.16 2.12 2.18 2.3 2.3 2.39 2.57 Spread (%) Interest Rate Sensitivity 0.0 0.05 0.1 0.15 0.2 2500.0 1518.98290190903 1000.0 707.6314950684456 532.4527357594372 Price of Bond Over Time Rate Drops to 5% 0.0 1.0 2.0 3.0 4.0 5.0 6.0 7.0 8.0 9.0 10.0 11.0 12.0 13.0 14.0 15.0 1518.98290190903 1494.932047004481
- 59. 1469.678649354705 1443.16258182244 1415.320710913562 1386.086746459241 1355.391083782203 1323.160637971313 1289.318669869878 1253.784603363372 1216.473833531541 1177.297525208118 1136.162401468524 1092.97052154195 1047.619047619047 1000.0 Rate Stays at 10% 0.0 1.0 2.0 3.0 4.0 5.0 6.0 7.0 8.0 9.0 10.0 11.0 12.0 13.0 14.0 15.0 1000.0 1000.0 999.9999999999999 1000.0 999.9999999999999 1000.0 999.9999999999999 1000.0 1000.0 1000.0 1000.0 1000.0 1000.0 1000.0 999.9999999999999 1000.0 Rate Rises to 15% 0.0 1.0 2.0 3.0 4.0 5.0 6.0 7.0 8.0 9.0 10.0 11.0 12.0 13.0 14.0 15.0 707.6314950684456 713.7762193287123 720.8426522280192 728.969050062222 738.3144075715553 749.0615687072888 761.420804013382 775.6339246153892 791.9790133076975 810.775865303852 832.3922450994299 857.2510818643444 885.8387441439962 918.7145557655954 956.5217391304349 1000.0 Mar-80 0.5 1.0 5.0 10.0 30.0 0.15 0.14 0.135 0.128 0.123 Feb-00 0.5 1.0 5.0 10.0 30.0 0.004 0.006 0.0169 0.0268 0.0369 Feb-05 0.5 1.0 5.0 10.0 30.0 0.0598 0.0619 0.0674 0.0668 0.0631 Years to Maturity Interest Rate (%)
- 60. 1-Year 0.05 0.1 0.15 0.2 0.25 1047.619047619047 999.9999999999999 956.5217391304349 916.6666666666667 880.0 25-Year 0.05 0.1 0.15 0.2 0.25 1704.697228302238 999.9999999999999 676.792545736493 505.241298005198 402.2667359117775 Interest Rate, rd Bond Value ($) 39845.0 39814.0 39783.0 39753.0 39722.0 39692.0 39661.0 39630.0 39600.0 39569.0 39539.0 39508.0 39479.0 39448.0 39417.0 39387.0 39356.0 39326.0 39295.0 39264.0 39234.0 39203.0 39173.0 39142.0 39114.0 39083.0 39052.0 39022.0 38991.0 38961.0 38930.0 38899.0 38869.0 38838.0 38808.0 38777.0 38749.0 38718.0 38687.0 38657.0 38626.0 38596.0 38565.0 38534.0 38504.0 38473.0 38443.0 38412.0 38384.0 38353.0 38322.0 38292.0 38261.0 38231.0 38200.0 38169.0 38139.0 38108.0 38078.0 38047.0 38018.0 37987.0 37956.0 37926.0 37895.0 37865.0 37834.0 37803.0 37773.0 37742.0 37712.0 37681.0 37653.0 37622.0 37591.0 37561.0 37530.0 37500.0 37469.0 37438.0 37408.0 37377.0 37347.0 37316.0 37288.0 37257.0 37226.0 37196.0 37165.0 37135.0 37104.0 37073.0 37043.0 37012.0 36982.0 36951.0 36923.0 36892.0 36861.0 36831.0 36800.0 36770.0 36739.0 36708.0 36678.0 36647.0 36617.0 36586.0 36557.0 36526.0 36495.0 36465.0 36434.0 36404.0 36373.0 36342.0
- 61. 36312.0 36281.0 36251.0 36220.0 36192.0 36161.0 2.4 2.53 2.63 2.59 2.47 1.96 1.75 1.66 1.58 1.69 1.87 2.0 1.79 1.59 1.39 1.29 1.13 1.22 1.12 0.73 0.69 0.72 0.779999999999999 0.74 0.67 0.64 0.760000000000001 0.73 0.779999999999999 0.79 0.8 0.76 0.779999999999999 0.84 0.85 0.81 0.779999999999999 0.87 0.9 0.88 0.89 0.93 0.83 0.88 0.96 1.01 0.99 0.9 1.03 1.14 1.24 1.33 1.37 1.33 1.37 1.32 1.28 1.32 1.38 1.5 1.42 1.39 1.35 1.35 1.41 1.45 1.43 1.51 1.64 1.65 1.78 2.08 2.05 2.12 2.18 2.26 2.38 2.28 2.11 1.88 1.7 1.59 1.55 1.53 1.6 1.51 1.68 2.32 2.46 2.44 2.05 1.89 1.9 1.9 2.06 2.09 2.0 1.99 1.97 1.73 1.81 1.82 1.72 1.6 1.57 1.55 1.65 1.42 1.16 1.12 1.27 1.33 1.44 1.47 1.46 1.4 1.33 1.39 1.46 1.39 1.4 1.52 39845.0 39814.0 39783.0 39753.0 39722.0 39692.0 39661.0 39630.0 39600.0 39569.0 39539.0 39508.0 39479.0 39448.0 39417.0 39387.0 39356.0 39326.0 39295.0 39264.0 39234.0 39203.0 39173.0 39142.0 39114.0 39083.0 39052.0 39022.0 38991.0 38961.0 38930.0 38899.0 38869.0 38838.0 38808.0 38777.0 38749.0 38718.0 38687.0 38657.0 38626.0 38596.0 38565.0 38534.0 38504.0 38473.0 38443.0 38412.0 38384.0 38353.0 38322.0 38292.0 38261.0 38231.0 38200.0 38169.0 38139.0 38108.0 38078.0 38047.0 38018.0 37987.0 37956.0 37926.0 37895.0 37865.0 37834.0 37803.0 37773.0 37742.0 37712.0 37681.0 37653.0 37622.0 37591.0 37561.0 37530.0 37500.0 37469.0 37438.0 37408.0 37377.0 37347.0 37316.0 37288.0 37257.0 37226.0 37196.0 37165.0 37135.0 37104.0 37073.0 37043.0 37012.0 36982.0 36951.0 36923.0 36892.0 36861.0 36831.0 36800.0 36770.0 36739.0 36708.0 36678.0 36647.0 36617.0 36586.0 36557.0 36526.0
- 62. 36495.0 36465.0 36434.0 36404.0 36373.0 36342.0 36312.0 36281.0 36251.0 36220.0 36192.0 36161.0 5.21 5.62 6.01 5.68 5.07 3.62 3.26 3.15 2.97 3.05 3.29 3.38 3.08 2.8 2.55 2.25 1.95 2.07 1.98 1.65 1.6 1.64 1.7 1.71 1.56 1.58 1.66 1.6 1.69 1.71 1.71 1.67 1.67 1.64 1.69 1.69 1.7 1.82 1.85 1.85 1.84 1.83 1.7 1.77 1.86 1.87 1.71 1.56 1.65 1.8 1.92 2.01 2.11 2.14 2.18 2.12 2.05 2.03 2.11 2.28 2.19 2.29 2.33 2.36 2.44 2.52 2.56 2.64 2.86 2.81 2.89 3.14 3.16 3.3 3.42 3.57 3.79 3.53 3.32 3.25 3.02 2.93 2.82 2.83 2.98 2.83 2.96 3.16 3.34 3.3 2.88 2.73 2.69 2.68 2.93 2.95 2.77 2.77 2.78 2.56 2.6 2.55 2.43 2.3 2.38 2.46 2.41 2.11 1.77 1.67 1.91 2.12 2.27 2.28 2.21 2.16 2.12 2.18 2.3 2.3 2.39 2.57 Spread (%) Interest Rate Sensitivity 0.0 0.05 0.1 0.15 0.2 2500.0 1518.98290190903 1000.0 707.6314950684456 532.4527357594372 Price of Bond Over Time Rate Drops to 5% 0.0 1.0 2.0 3.0 4.0 5.0 6.0 7.0 8.0 9.0 10.0 11.0 12.0 13.0 14.0 15.0 1518.98290190903 1494.932047004481 1469.678649354705 1443.16258182244 1415.320710913562 1386.086746459241 1355.391083782203 1323.160637971313 1289.318669869878 1253.784603363372 1216.473833531541 1177.297525208118 1136.162401468524 1092.97052154195 1047.619047619047 1000.0 Rate Stays at 10% 0.0
- 63. 1.0 2.0 3.0 4.0 5.0 6.0 7.0 8.0 9.0 10.0 11.0 12.0 13.0 14.0 15.0 1000.0 1000.0 999.9999999999999 1000.0 999.9999999999999 1000.0 999.9999999999999 1000.0 1000.0 1000.0 1000.0 1000.0 1000.0 1000.0 999.9999999999999 1000.0 Rate Rises to 15% 0.0 1.0 2.0 3.0 4.0 5.0 6.0 7.0 8.0 9.0 10.0 11.0 12.0 13.0 14.0 15.0 707.6314950684456 713.7762193287123 720.8426522280192 728.969050062222 738.3144075715553 749.0615687072888 761.420804013382 775.6339246153892 791.9790133076975 810.775865303852 832.3922450994299 857.2510818643444 885.8387441439962 918.7145557655954 956.5217391304349 1000.0 Mar-80 0.5 1.0 5.0 10.0 30.0 0.15 0.14 0.135 0.128 0.123 Feb-00 0.5 1.0 5.0 10.0 30.0 0.004 0.006 0.0169 0.0268 0.0369 Feb-05 0.5 1.0 5.0 10.0 30.0 0.0598 0.0619 0.0674 0.0668 0.0631 Years to Maturity Interest Rate (%) 1-Year 0.05 0.1 0.15 0.2 0.25 1047.619047619047 999.9999999999999 956.5217391304349 916.6666666666667 880.0 25-Year 0.05 0.1 0.15 0.2 0.25 1704.697228302238 999.9999999999999 676.792545736493 505.241298005198 402.2667359117775
- 64. Interest Rate, rd Bond Value ($) 39845.0 39814.0 39783.0 39753.0 39722.0 39692.0 39661.0 39630.0 39600.0 39569.0 39539.0 39508.0 39479.0 39448.0 39417.0 39387.0 39356.0 39326.0 39295.0 39264.0 39234.0 39203.0 39173.0 39142.0 39114.0 39083.0 39052.0 39022.0 38991.0 38961.0 38930.0 38899.0 38869.0 38838.0 38808.0 38777.0 38749.0 38718.0 38687.0 38657.0 38626.0 38596.0 38565.0 38534.0 38504.0 38473.0 38443.0 38412.0 38384.0 38353.0 38322.0 38292.0 38261.0 38231.0 38200.0 38169.0 38139.0 38108.0 38078.0 38047.0 38018.0 37987.0 37956.0 37926.0 37895.0 37865.0 37834.0 37803.0 37773.0 37742.0 37712.0 37681.0 37653.0 37622.0 37591.0 37561.0 37530.0 37500.0 37469.0 37438.0 37408.0 37377.0 37347.0 37316.0 37288.0 37257.0 37226.0 37196.0 37165.0 37135.0 37104.0 37073.0 37043.0 37012.0 36982.0 36951.0 36923.0 36892.0 36861.0 36831.0 36800.0 36770.0 36739.0 36708.0 36678.0 36647.0 36617.0 36586.0 36557.0 36526.0 36495.0 36465.0 36434.0 36404.0 36373.0 36342.0 36312.0 36281.0 36251.0 36220.0 36192.0 36161.0 2.4 2.53 2.63 2.59 2.47 1.96 1.75 1.66 1.58 1.69 1.87 2.0 1.79 1.59 1.39 1.29 1.13 1.22 1.12 0.73 0.69 0.72 0.779999999999999 0.74 0.67 0.64 0.760000000000001 0.73 0.779999999999999 0.79 0.8 0.76 0.779999999999999 0.84 0.85 0.81 0.779999999999999 0.87 0.9 0.88 0.89 0.93 0.83 0.88
- 65. 0.96 1.01 0.99 0.9 1.03 1.14 1.24 1.33 1.37 1.33 1.37 1.32 1.28 1.32 1.38 1.5 1.42 1.39 1.35 1.35 1.41 1.45 1.43 1.51 1.64 1.65 1.78 2.08 2.05 2.12 2.18 2.26 2.38 2.28 2.11 1.88 1.7 1.59 1.55 1.53 1.6 1.51 1.68 2.32 2.46 2.44 2.05 1.89 1.9 1.9 2.06 2.09 2.0 1.99 1.97 1.73 1.81 1.82 1.72 1.6 1.57 1.55 1.65 1.42 1.16 1.12 1.27 1.33 1.44 1.47 1.46 1.4 1.33 1.39 1.46 1.39 1.4 1.52 39845.0 39814.0 39783.0 39753.0 39722.0 39692.0 39661.0 39630.0 39600.0 39569.0 39539.0 39508.0 39479.0 39448.0 39417.0 39387.0 39356.0 39326.0 39295.0 39264.0 39234.0 39203.0 39173.0 39142.0 39114.0 39083.0 39052.0 39022.0 38991.0 38961.0 38930.0 38899.0 38869.0 38838.0 38808.0 38777.0 38749.0 38718.0 38687.0 38657.0 38626.0 38596.0 38565.0 38534.0 38504.0 38473.0 38443.0 38412.0 38384.0 38353.0 38322.0 38292.0 38261.0 38231.0 38200.0 38169.0 38139.0 38108.0 38078.0 38047.0 38018.0 37987.0 37956.0 37926.0 37895.0 37865.0 37834.0 37803.0 37773.0 37742.0 37712.0 37681.0 37653.0 37622.0 37591.0 37561.0 37530.0 37500.0 37469.0 37438.0 37408.0 37377.0 37347.0 37316.0 37288.0 37257.0 37226.0 37196.0 37165.0 37135.0 37104.0 37073.0 37043.0 37012.0 36982.0 36951.0 36923.0 36892.0 36861.0 36831.0 36800.0 36770.0 36739.0 36708.0 36678.0 36647.0 36617.0 36586.0 36557.0 36526.0 36495.0 36465.0 36434.0 36404.0 36373.0 36342.0 36312.0 36281.0 36251.0 36220.0 36192.0 36161.0 5.21 5.62 6.01 5.68 5.07 3.62 3.26 3.15 2.97 3.05 3.29 3.38 3.08 2.8 2.55 2.25 1.95 2.07 1.98 1.65 1.6 1.64 1.7 1.71 1.56 1.58 1.66 1.6 1.69 1.71 1.71 1.67 1.67 1.64 1.69 1.69 1.7 1.82 1.85 1.85 1.84 1.83 1.7 1.77 1.86 1.87 1.71 1.56 1.65 1.8 1.92
- 66. 2.01 2.11 2.14 2.18 2.12 2.05 2.03 2.11 2.28 2.19 2.29 2.33 2.36 2.44 2.52 2.56 2.64 2.86 2.81 2.89 3.14 3.16 3.3 3.42 3.57 3.79 3.53 3.32 3.25 3.02 2.93 2.82 2.83 2.98 2.83 2.96 3.16 3.34 3.3 2.88 2.73 2.69 2.68 2.93 2.95 2.77 2.77 2.78 2.56 2.6 2.55 2.43 2.3 2.38 2.46 2.41 2.11 1.77 1.67 1.91 2.12 2.27 2.28 2.21 2.16 2.12 2.18 2.3 2.3 2.39 2.57 Spread (%) Interest Rate Sensitivity 0.0 0.05 0.1 0.15 0.2 2500.0 1518.98290190903 1000.0 707.6314950684456 532.4527357594372 Price of Bond Over Time Rate Drops to 5% 0.0 1.0 2.0 3.0 4.0 5.0 6.0 7.0 8.0 9.0 10.0 11.0 12.0 13.0 14.0 15.0 1518.98290190903 1494.932047004481 1469.678649354705 1443.16258182244 1415.320710913562 1386.086746459241 1355.391083782203 1323.160637971313 1289.318669869878 1253.784603363372 1216.473833531541 1177.297525208118 1136.162401468524 1092.97052154195 1047.619047619047 1000.0 Rate Stays at 10% 0.0 1.0 2.0 3.0 4.0 5.0 6.0 7.0 8.0 9.0 10.0 11.0 12.0 13.0 14.0 15.0 1000.0 1000.0 999.9999999999999 1000.0 999.9999999999999 1000.0 999.9999999999999 1000.0 1000.0 1000.0 1000.0 1000.0 1000.0 1000.0 999.9999999999999 1000.0 Rate Rises to 15% 0.0 1.0 2.0 3.0 4.0 5.0 6.0 7.0 8.0 9.0 10.0 11.0 12.0 13.0 14.0 15.0
- 67. 707.6314950684456 713.7762193287123 720.8426522280192 728.969050062222 738.3144075715553 749.0615687072888 761.420804013382 775.6339246153892 791.9790133076975 810.775865303852 832.3922450994299 857.2510818643444 885.8387441439962 918.7145557655954 956.5217391304349 1000.0 Mar-80 0.5 1.0 5.0 10.0 30.0 0.15 0.14 0.135 0.128 0.123 Feb-00 0.5 1.0 5.0 10.0 30.0 0.004 0.006 0.0169 0.0268 0.0369 Feb-05 0.5 1.0 5.0 10.0 30.0 0.0598 0.0619 0.0674 0.0668 0.0631 Years to Maturity Interest Rate (%) 1-Year 0.05 0.1 0.15 0.2 0.25 1047.619047619047 999.9999999999999 956.5217391304349 916.6666666666667 880.0 25-Year 0.05 0.1 0.15 0.2 0.25 1704.697228302238 999.9999999999999 676.792545736493 505.241298005198 402.2667359117775 Interest Rate, rd Bond Value ($) 39845.0 39814.0 39783.0 39753.0 39722.0 39692.0
- 68. 39661.0 39630.0 39600.0 39569.0 39539.0 39508.0 39479.0 39448.0 39417.0 39387.0 39356.0 39326.0 39295.0 39264.0 39234.0 39203.0 39173.0 39142.0 39114.0 39083.0 39052.0 39022.0 38991.0 38961.0 38930.0 38899.0 38869.0 38838.0 38808.0 38777.0 38749.0 38718.0 38687.0 38657.0 38626.0 38596.0 38565.0 38534.0 38504.0 38473.0 38443.0 38412.0 38384.0 38353.0 38322.0 38292.0 38261.0 38231.0 38200.0 38169.0 38139.0 38108.0 38078.0 38047.0 38018.0 37987.0 37956.0 37926.0 37895.0 37865.0 37834.0 37803.0 37773.0 37742.0 37712.0 37681.0 37653.0 37622.0 37591.0 37561.0 37530.0 37500.0 37469.0 37438.0 37408.0 37377.0 37347.0 37316.0 37288.0 37257.0 37226.0 37196.0 37165.0 37135.0 37104.0 37073.0 37043.0 37012.0 36982.0 36951.0 36923.0 36892.0 36861.0 36831.0 36800.0 36770.0 36739.0 36708.0 36678.0 36647.0 36617.0 36586.0 36557.0 36526.0 36495.0 36465.0 36434.0 36404.0 36373.0 36342.0 36312.0 36281.0 36251.0 36220.0 36192.0 36161.0 2.4 2.53 2.63 2.59 2.47 1.96 1.75 1.66 1.58 1.69 1.87 2.0 1.79 1.59 1.39 1.29 1.13 1.22 1.12 0.73 0.69 0.72 0.779999999999999 0.74 0.67 0.64 0.760000000000001 0.73 0.779999999999999 0.79 0.8 0.76 0.779999999999999 0.84 0.85 0.81 0.779999999999999 0.87 0.9 0.88 0.89 0.93 0.83 0.88 0.96 1.01 0.99 0.9 1.03 1.14 1.24 1.33 1.37 1.33 1.37 1.32 1.28 1.32 1.38 1.5 1.42 1.39 1.35 1.35 1.41 1.45 1.43 1.51 1.64 1.65 1.78 2.08 2.05 2.12 2.18 2.26 2.38 2.28 2.11 1.88 1.7 1.59 1.55 1.53 1.6 1.51 1.68 2.32 2.46 2.44 2.05 1.89 1.9 1.9 2.06 2.09 2.0 1.99 1.97 1.73 1.81 1.82 1.72 1.6 1.57 1.55 1.65 1.42 1.16 1.12 1.27 1.33 1.44 1.47 1.46 1.4 1.33 1.39 1.46 1.39 1.4
- 69. 1.52 39845.0 39814.0 39783.0 39753.0 39722.0 39692.0 39661.0 39630.0 39600.0 39569.0 39539.0 39508.0 39479.0 39448.0 39417.0 39387.0 39356.0 39326.0 39295.0 39264.0 39234.0 39203.0 39173.0 39142.0 39114.0 39083.0 39052.0 39022.0 38991.0 38961.0 38930.0 38899.0 38869.0 38838.0 38808.0 38777.0 38749.0 38718.0 38687.0 38657.0 38626.0 38596.0 38565.0 38534.0 38504.0 38473.0 38443.0 38412.0 38384.0 38353.0 38322.0 38292.0 38261.0 38231.0 38200.0 38169.0 38139.0 38108.0 38078.0 38047.0 38018.0 37987.0 37956.0 37926.0 37895.0 37865.0 37834.0 37803.0 37773.0 37742.0 37712.0 37681.0 37653.0 37622.0 37591.0 37561.0 37530.0 37500.0 37469.0 37438.0 37408.0 37377.0 37347.0 37316.0 37288.0 37257.0 37226.0 37196.0 37165.0 37135.0 37104.0 37073.0 37043.0 37012.0 36982.0 36951.0 36923.0 36892.0 36861.0 36831.0 36800.0 36770.0 36739.0 36708.0 36678.0 36647.0 36617.0 36586.0 36557.0 36526.0 36495.0 36465.0 36434.0 36404.0 36373.0 36342.0 36312.0 36281.0 36251.0 36220.0 36192.0 36161.0 5.21 5.62 6.01 5.68 5.07 3.62 3.26 3.15 2.97 3.05 3.29 3.38 3.08 2.8 2.55 2.25 1.95 2.07 1.98 1.65 1.6 1.64 1.7 1.71 1.56 1.58 1.66 1.6 1.69 1.71 1.71 1.67 1.67 1.64 1.69 1.69 1.7 1.82 1.85 1.85 1.84 1.83 1.7 1.77 1.86 1.87 1.71 1.56 1.65 1.8 1.92 2.01 2.11 2.14 2.18 2.12 2.05 2.03 2.11 2.28 2.19 2.29 2.33 2.36 2.44 2.52 2.56 2.64 2.86 2.81 2.89 3.14 3.16 3.3 3.42 3.57 3.79 3.53 3.32 3.25 3.02 2.93 2.82 2.83 2.98 2.83 2.96 3.16 3.34 3.3 2.88 2.73 2.69 2.68 2.93 2.95 2.77 2.77 2.78 2.56 2.6 2.55 2.43 2.3 2.38 2.46 2.41 2.11 1.77 1.67 1.91 2.12 2.27 2.28 2.21 2.16 2.12 2.18 2.3 2.3 2.39 2.57
- 70. Spread (%) Interest Rate Sensitivity 0.0 0.05 0.1 0.15 0.2 2500.0 1518.98290190903 1000.0 707.6314950684456 532.4527357594372 Price of Bond Over Time Rate Drops to 5% 0.0 1.0 2.0 3.0 4.0 5.0 6.0 7.0 8.0 9.0 10.0 11.0 12.0 13.0 14.0 15.0 1518.98290190903 1494.932047004481 1469.678649354705 1443.16258182244 1415.320710913562 1386.086746459241 1355.391083782203 1323.160637971313 1289.318669869878 1253.784603363372 1216.473833531541 1177.297525208118 1136.162401468524 1092.97052154195 1047.619047619047 1000.0 Rate Stays at 10% 0.0 1.0 2.0 3.0 4.0 5.0 6.0 7.0 8.0 9.0 10.0 11.0 12.0 13.0 14.0 15.0 1000.0 1000.0 999.9999999999999 1000.0 999.9999999999999 1000.0 999.9999999999999 1000.0 1000.0 1000.0 1000.0 1000.0 1000.0 1000.0 999.9999999999999 1000.0 Rate Rises to 15% 0.0 1.0 2.0 3.0 4.0 5.0 6.0 7.0 8.0 9.0 10.0 11.0 12.0 13.0 14.0 15.0 707.6314950684456 713.7762193287123 720.8426522280192 728.969050062222 738.3144075715553 749.0615687072888 761.420804013382 775.6339246153892 791.9790133076975 810.775865303852 832.3922450994299 857.2510818643444 885.8387441439962 918.7145557655954
- 71. 956.5217391304349 1000.0 Mar-80 0.5 1.0 5.0 10.0 30.0 0.15 0.14 0.135 0.128 0.123 Feb-00 0.5 1.0 5.0 10.0 30.0 0.004 0.006 0.0169 0.0268 0.0369 Feb-05 0.5 1.0 5.0 10.0 30.0 0.0598 0.0619 0.0674 0.0668 0.0631 Years to Maturity Interest Rate (%) 1-Year 0.05 0.1 0.15 0.2 0.25 1047.619047619047 999.9999999999999 956.5217391304349 916.6666666666667 880.0 25-Year 0.05 0.1 0.15 0.2 0.25 1704.697228302238 999.9999999999999 676.792545736493 505.241298005198 402.2667359117775 Interest Rate, rd Bond Value ($) 39845.0 39814.0 39783.0 39753.0 39722.0 39692.0 39661.0 39630.0 39600.0 39569.0 39539.0 39508.0 39479.0 39448.0 39417.0 39387.0 39356.0 39326.0 39295.0 39264.0 39234.0 39203.0 39173.0 39142.0 39114.0 39083.0 39052.0 39022.0 38991.0 38961.0 38930.0 38899.0 38869.0 38838.0 38808.0 38777.0 38749.0 38718.0 38687.0 38657.0 38626.0
- 72. 38596.0 38565.0 38534.0 38504.0 38473.0 38443.0 38412.0 38384.0 38353.0 38322.0 38292.0 38261.0 38231.0 38200.0 38169.0 38139.0 38108.0 38078.0 38047.0 38018.0 37987.0 37956.0 37926.0 37895.0 37865.0 37834.0 37803.0 37773.0 37742.0 37712.0 37681.0 37653.0 37622.0 37591.0 37561.0 37530.0 37500.0 37469.0 37438.0 37408.0 37377.0 37347.0 37316.0 37288.0 37257.0 37226.0 37196.0 37165.0 37135.0 37104.0 37073.0 37043.0 37012.0 36982.0 36951.0 36923.0 36892.0 36861.0 36831.0 36800.0 36770.0 36739.0 36708.0 36678.0 36647.0 36617.0 36586.0 36557.0 36526.0 36495.0 36465.0 36434.0 36404.0 36373.0 36342.0 36312.0 36281.0 36251.0 36220.0 36192.0 36161.0 2.4 2.53 2.63 2.59 2.47 1.96 1.75 1.66 1.58 1.69 1.87 2.0 1.79 1.59 1.39 1.29 1.13 1.22 1.12 0.73 0.69 0.72 0.779999999999999 0.74 0.67 0.64 0.760000000000001 0.73 0.779999999999999 0.79 0.8 0.76 0.779999999999999 0.84 0.85 0.81 0.779999999999999 0.87 0.9 0.88 0.89 0.93 0.83 0.88 0.96 1.01 0.99 0.9 1.03 1.14 1.24 1.33 1.37 1.33 1.37 1.32 1.28 1.32 1.38 1.5 1.42 1.39 1.35 1.35 1.41 1.45 1.43 1.51 1.64 1.65 1.78 2.08 2.05 2.12 2.18 2.26 2.38 2.28 2.11 1.88 1.7 1.59 1.55 1.53 1.6 1.51 1.68 2.32 2.46 2.44 2.05 1.89 1.9 1.9 2.06 2.09 2.0 1.99 1.97 1.73 1.81 1.82 1.72 1.6 1.57 1.55 1.65 1.42 1.16 1.12 1.27 1.33 1.44 1.47 1.46 1.4 1.33 1.39 1.46 1.39 1.4 1.52 39845.0 39814.0 39783.0 39753.0 39722.0 39692.0 39661.0 39630.0 39600.0 39569.0 39539.0 39508.0 39479.0 39448.0 39417.0 39387.0 39356.0 39326.0 39295.0 39264.0 39234.0 39203.0 39173.0 39142.0 39114.0 39083.0 39052.0 39022.0 38991.0 38961.0 38930.0 38899.0 38869.0 38838.0 38808.0