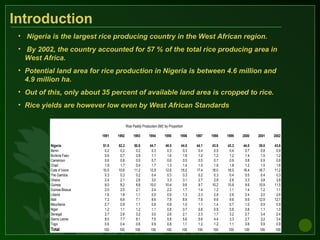
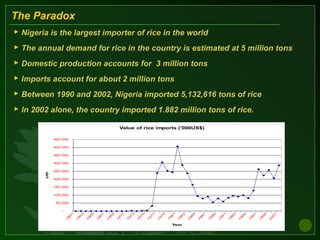
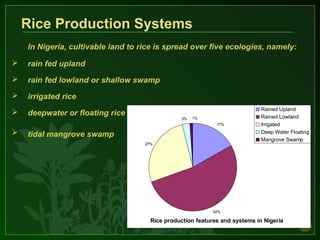
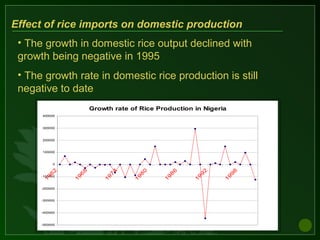
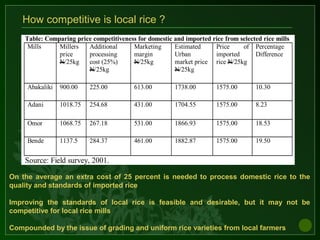
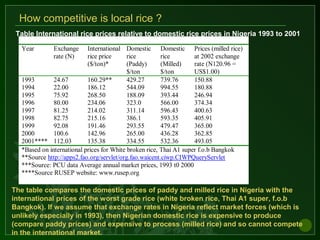
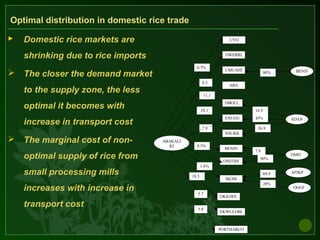
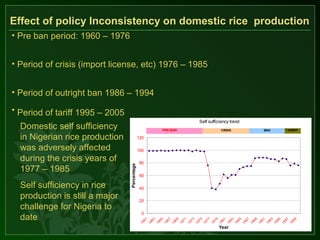
Impact of Trade on Domestic Rice
Production and the challenge of Self-
sufficiency in Nigeria
Chuma Ezedinma
Integrated Cassava Project
International Institute of TropicalInternational Institute of Tropical
AgricultureAgriculture
Rice Paddy Production (Mt)' by Proportion
1991 1992 1993 1994 1995 1996 1997 1998 1999 2000 2001 2002
Nigeria 51.5 52.2 50.8 44.7 48.0 44.5 44.1 43.9 43.3 44.0 38.0 43.6
Benin 0.2 0.2 0.2 0.3 0.3 0.3 0.4 0.5 0.4 0.7 0.8 0.9
Burkina Faso 0.6 0.7 0.9 1.1 1.4 1.6 1.2 1.2 1.2 1.4 1.5 1.2
Cameroon 0.6 0.8 0.5 0.7 0.6 0.5 0.5 0.7 0.9 0.8 0.9 0.8
Chad 1.9 1.7 0.4 1.7 1.3 1.4 1.5 1.6 1.8 1.2 1.5 1.6
Cote d' Ivoire 10.5 10.6 11.2 12.9 12.6 16.2 17.4 16.0 16.0 16.4 16.7 11.2
The Gambia 0.3 0.3 0.2 0.4 0.3 0.3 0.2 0.3 0.4 0.5 0.4 0.3
Ghana 2.4 2.1 2.6 3.0 3.3 3.1 2.7 2.6 2.8 3.3 3.8 3.8
Guinea 8.0 8.2 8.8 10.0 10.4 9.6 9.7 10.2 10.8 9.9 10.9 11.5
Guinea-Bissua 2.0 2.0 2.1 2.4 2.2 1.7 1.4 1.2 1.1 1.4 1.2 1.1
Liberia 1.6 1.8 1.1 0.9 0.9 1.3 2.3 2.8 2.6 2.4 2.0 2.6
Mali 7.3 6.6 7.1 8.6 7.8 8.9 7.8 9.6 9.6 9.9 12.9 12.7
Mauritania 0.7 0.8 1.1 0.8 0.9 1.0 1.1 1.4 0.7 1.0 0.9 0.9
Niger 1.2 1.1 1.2 1.1 0.8 0.7 0.8 0.8 0.8 0.8 1.1 1.0
Senegal 2.7 2.8 3.2 3.0 2.6 2.1 2.3 1.7 3.2 2.7 3.4 2.4
Sierra Leone 8.0 7.7 8.1 7.5 5.8 5.6 5.6 4.4 3.3 2.7 3.2 3.4
Togo 0.6 0.4 0.6 0.9 0.8 1.1 1.2 1.2 1.1 0.8 0.9 0.9
Total 100 100 100 100 100 100 100 100 100 100 100 100
• Nigeria is the largest rice producing country in the West African region.
• By 2002, the country accounted for 57 % of the total rice producing area in
West Africa.
• Potential land area for rice production in Nigeria is between 4.6 million and
4.9 million ha.
• Out of this, only about 35 percent of available land area is cropped to rice.
• Rice yields are however low even by West African Standards
Introduction
The Paradox
 Nigeria is the largest importer of rice in the world
 The annual demand for rice in the country is estimated at 5 million tons
 Domestic production accounts for 3 million tons
 Imports account for about 2 million tons
 Between 1990 and 2002, Nigeria imported 5,132,616 tons of rice
 In 2002 alone, the country imported 1.882 million tons of rice.
Value of rice imports ('000US$)
-
50,000
100,000
150,000
200,000
250,000
300,000
350,000
400,000
450,000
1
9
6
1
1
9
6
3
1
9
6
5
1
9
6
7
1
9
6
9
1
9
7
1
1
9
7
3
1
9
7
5
1
9
7
7
1
9
7
9
1
9
8
1
1
9
8
3
1
9
8
5
1
9
8
7
1
9
8
9
1
9
9
1
1
9
9
3
1
9
9
5
1
9
9
7
1
9
9
9
2
0
0
1
Year
US$
Objectives
 Describe the effect of rice trade (imports) on domestic rice
production and marketing
 Assess the competitiveness of domestic rice relative to
imported rice in Nigeria
 Assess the effect of policy inconsistency on rice production
 Determine the optimal efficiency of local rice mills
Primary sources:
Field level survey involving small scale
mills, rural and urban markets in north and
south of Nigeria
Secondary sources:
IITA and other Libraries, internet
Methodology
Rice Production Systems
In Nigeria, cultivable land to rice is spread over five ecologies, namely:
 rain fed upland
 rain fed lowland or shallow swamp
 irrigated rice
 deepwater or floating rice and
 tidal mangrove swamp
Rice production features and systems in Nigeria
17%
52%
27%
3% 1%
Rained Upland
Rained Lowland
Irrigated
Deep Water Floating
Mangrove Swamp
Major Rice producing
States:
Kaduna - 22 %,
Niger - 16%
Benue - 10%
Taraba - 7%
In geopolitical terms rice is produced mainly in the central region of Nigeria
Rice Output in Nigeria by Zones (2000)
23%
15%
47%
10%
5%
Northwest
Northeast
Northcentral
Southeast
Southwest
Effect of rice trade (imports) on domestic rice production and marketing
The proportion of local rice available in Nigerian markets is far less than that
of imported rice
Table: Market share of foreign rice to local rice in selected urban markets.
Urban
market
Local rice
volume (tons)
Foreign rice
volume (tons)
Total volume
(tons)
Percent of
foreign rice
Enugu 2270.00 5935.80 8205.80 72.33
Umuahia 417.00 14202.90 14619.90 97.14
Owerri 1786.90 15493.40 17280.30 89.60
Uyo 290.70 887.00 1177.70 75.53
Port Harcourt 442.90 26306.50 26749.40 98.34
Onitsha 4284.90 157600.00 161884.90 97.35
Calabar 321.00 790.10 1111.10 71.11
Aba 847.97 23177.10 24025.07 96.47
Source: Field survey, 2001.
Effect of rice trade (imports) on domestic rice production and marketing
Capacity utilisation in selected rice processing mills
Location Capacityutilisation (%)
Abakiliki 7.06
Afikpo 40.27
Adani 20.46
Omor 60.36
Ogoja 8.89
Bende 5.41
• The small rice processing mills are the most dominant in Nigeria
• Low effective capacity utilisation in small rice mills
Three types of rice
processing mills
Traditional/hand
Small rice mills
Large rice mills
Effect of rice trade (imports) on domestic rice production and marketing
Nassarawa
Afikpo
Abakaliki
Adani
Benue
Gombe
Taraba
20%30%
15%
30%
15%
30%
20%
15%
Figure External sources of paddy rice to Abakaliki, Adani and Afikpo rice mills.
Loss of rural farm labour to urban migration
Rise in intra regional trade
Effect of rice imports on domestic production
Growth rate of Rice Production in Nigeria
-500000
-400000
-300000
-200000
-100000
0
100000
200000
300000
400000
1
9
6
2
1
9
6
8
1
9
7
4
1
9
8
0
1
9
8
6
1
9
9
2
1
9
9
8
• The growth in domestic rice output declined with
growth being negative in 1995
• The growth rate in domestic rice production is still
negative to date
How competitive is local rice ?
Table: Comparing price competitiveness for domestic and imported rice from selected rice mills
Mills Millers
price
N/25kg
Additional
processing
cost (25%)
N/25kg
Marketing
margin
N/25kg
Estimated
Urban
market price
N/25kg
Price of
imported
rice N/25kg
Percentage
Difference
Abakaliki 900.00 225.00 613.00 1738.00 1575.00 10.30
Adani 1018.75 254.68 431.00 1704.55 1575.00 8.23
Omor 1068.75 267.18 531.00 1866.93 1575.00 18.53
Bende 1137.5 284.37 461.00 1882.87 1575.00 19.50
Source: Field survey, 2001.
On the average an extra cost of 25 percent is needed to process domestic rice to the
quality and standards of imported rice
Improving the standards of local rice is feasible and desirable, but it may not be
competitive for local rice mills
Compounded by the issue of grading and uniform rice varieties from local farmers
Table International rice prices relative to domestic rice prices in Nigeria 1993 to 2001
Year Exchange
rate (N)
International
rice price
($/ton)*
Domestic
rice
(Paddy)
$/ton
Domestic
rice
(Milled)
$/ton
Prices (milled rice)
at 2002 exchange
rate (N120.96 =
US$1.00)
1993 24.67 160.29** 429.27 739.76 150.88
1994 22.00 186.12 544.09 994.55 180.88
1995 75.92 268.50 188.09 393.44 246.94
1996 80.00 234.06 323.0 566.00 374.34
1997 81.25 214.02 311.14 596.43 400.63
1998 82.75 215.16 386.1 593.35 405.91
1999 92.08 191.46 293.55 479.47 365.00
2000 100.6 142.96 265.00 436.28 362.85
2001**** 112.03 135.38 334.55 532.36 493.05
*Based on international prices for White broken rice, Thai A1 super f.o.b Bangkok
**Source http://apps2.fao.org/servlet/org.fao.waicent.ciwp.CIWPQueryServlet
***Source: PCU data Average annual market prices, 1993 t0 2000
****Source RUSEP website: www.rusep.org
How competitive is local rice ?
The table compares the domestic prices of paddy and milled rice in Nigeria with the
international prices of the worst grade rice (white broken rice, Thai A1 super, f.o.b
Bangkok). If we assume that exchange rates in Nigeria reflect market forces (which is
unlikely especially in 1993), then Nigerian domestic rice is expensive to produce
(compare paddy prices) and expensive to process (milled rice) and so cannot compete
in the international market.
Optimal distribution in domestic rice trade
 Domestic rice markets are
shrinking due to rice imports
 The closer the demand market
to the supply zone, the less
optimal it becomes with
increase in transport cost
 The marginal cost of non-
optimal supply of rice from
small processing mills
increases with increase in
transport cost
ABAKALI
KI
UYO
OWERRI
UMUAHI
A
ENUGU
ABA
OBOLL
O
NSUKK
A
BENIN
ONITSH
A
IKOM
OKIGWE
PORTHARCO
UT
OGOJ
A
AFIKP
O
OMO
R
ADAN
I
BEND
E
80%
16.9
%
36.9
%
45%
7.9
%
90%
69.9
%
20%
EKWULOBI
A
0.7%
0.3
%
11.1
%
29.1
%
7.9
%
8.5%
1.6%
18.5
%
5.7
%
5.8
%
Effect of policy Inconsistency on domestic rice production
Self sufficiency trend
0
20
40
60
80
100
120
1961
1963
1965
1967
1969
1971
1973
1975
1977
1979
1981
1983
1985
1987
1989
1991
1993
1995
1997
1999
Year
Percentage
PRE-BAN CRISIS BAN TARRIFF
• Pre ban period: 1960 – 1976
• Period of crisis (import license, etc) 1976 – 1985
• Period of outright ban 1986 – 1994
• Period of tariff 1995 – 2005
Domestic self sufficiency
in Nigerian rice production
was adversely affected
during the crisis years of
1977 – 1985
Self sufficiency in rice
production is still a major
challenge for Nigeria to
date
Conclusions
 The demand for local rice in Nigeria is far less than the
demand for imported rice
 Local rice production costs are high and uncompetitive
 Improving the post harvest quality of domestic rice is
critical but can only be achieved if production costs are
low
 Local transport costs for rice output are sticky
downwards at least in nominal terms
Policy Interventions
 Intensify rice production and increase on-farm yield to
reduce production costs
 Improve quality and standard of rice and reduce post
harvest losses
 Facilitate rural enterprises and businesses especially in
small mills to sustain productivity, incomes and
employment
 Strengthen human and institutional capacities to produce,
process and market rice competitively in Nigeria
Thank you

Chuma.e.nigeria.pres.ppt

  • 2.
    Impact of Tradeon Domestic Rice Production and the challenge of Self- sufficiency in Nigeria Chuma Ezedinma Integrated Cassava Project International Institute of TropicalInternational Institute of Tropical AgricultureAgriculture
  • 3.
    Rice Paddy Production(Mt)' by Proportion 1991 1992 1993 1994 1995 1996 1997 1998 1999 2000 2001 2002 Nigeria 51.5 52.2 50.8 44.7 48.0 44.5 44.1 43.9 43.3 44.0 38.0 43.6 Benin 0.2 0.2 0.2 0.3 0.3 0.3 0.4 0.5 0.4 0.7 0.8 0.9 Burkina Faso 0.6 0.7 0.9 1.1 1.4 1.6 1.2 1.2 1.2 1.4 1.5 1.2 Cameroon 0.6 0.8 0.5 0.7 0.6 0.5 0.5 0.7 0.9 0.8 0.9 0.8 Chad 1.9 1.7 0.4 1.7 1.3 1.4 1.5 1.6 1.8 1.2 1.5 1.6 Cote d' Ivoire 10.5 10.6 11.2 12.9 12.6 16.2 17.4 16.0 16.0 16.4 16.7 11.2 The Gambia 0.3 0.3 0.2 0.4 0.3 0.3 0.2 0.3 0.4 0.5 0.4 0.3 Ghana 2.4 2.1 2.6 3.0 3.3 3.1 2.7 2.6 2.8 3.3 3.8 3.8 Guinea 8.0 8.2 8.8 10.0 10.4 9.6 9.7 10.2 10.8 9.9 10.9 11.5 Guinea-Bissua 2.0 2.0 2.1 2.4 2.2 1.7 1.4 1.2 1.1 1.4 1.2 1.1 Liberia 1.6 1.8 1.1 0.9 0.9 1.3 2.3 2.8 2.6 2.4 2.0 2.6 Mali 7.3 6.6 7.1 8.6 7.8 8.9 7.8 9.6 9.6 9.9 12.9 12.7 Mauritania 0.7 0.8 1.1 0.8 0.9 1.0 1.1 1.4 0.7 1.0 0.9 0.9 Niger 1.2 1.1 1.2 1.1 0.8 0.7 0.8 0.8 0.8 0.8 1.1 1.0 Senegal 2.7 2.8 3.2 3.0 2.6 2.1 2.3 1.7 3.2 2.7 3.4 2.4 Sierra Leone 8.0 7.7 8.1 7.5 5.8 5.6 5.6 4.4 3.3 2.7 3.2 3.4 Togo 0.6 0.4 0.6 0.9 0.8 1.1 1.2 1.2 1.1 0.8 0.9 0.9 Total 100 100 100 100 100 100 100 100 100 100 100 100 • Nigeria is the largest rice producing country in the West African region. • By 2002, the country accounted for 57 % of the total rice producing area in West Africa. • Potential land area for rice production in Nigeria is between 4.6 million and 4.9 million ha. • Out of this, only about 35 percent of available land area is cropped to rice. • Rice yields are however low even by West African Standards Introduction
  • 4.
    The Paradox  Nigeriais the largest importer of rice in the world  The annual demand for rice in the country is estimated at 5 million tons  Domestic production accounts for 3 million tons  Imports account for about 2 million tons  Between 1990 and 2002, Nigeria imported 5,132,616 tons of rice  In 2002 alone, the country imported 1.882 million tons of rice. Value of rice imports ('000US$) - 50,000 100,000 150,000 200,000 250,000 300,000 350,000 400,000 450,000 1 9 6 1 1 9 6 3 1 9 6 5 1 9 6 7 1 9 6 9 1 9 7 1 1 9 7 3 1 9 7 5 1 9 7 7 1 9 7 9 1 9 8 1 1 9 8 3 1 9 8 5 1 9 8 7 1 9 8 9 1 9 9 1 1 9 9 3 1 9 9 5 1 9 9 7 1 9 9 9 2 0 0 1 Year US$
  • 5.
    Objectives  Describe theeffect of rice trade (imports) on domestic rice production and marketing  Assess the competitiveness of domestic rice relative to imported rice in Nigeria  Assess the effect of policy inconsistency on rice production  Determine the optimal efficiency of local rice mills
  • 6.
    Primary sources: Field levelsurvey involving small scale mills, rural and urban markets in north and south of Nigeria Secondary sources: IITA and other Libraries, internet Methodology
  • 7.
    Rice Production Systems InNigeria, cultivable land to rice is spread over five ecologies, namely:  rain fed upland  rain fed lowland or shallow swamp  irrigated rice  deepwater or floating rice and  tidal mangrove swamp Rice production features and systems in Nigeria 17% 52% 27% 3% 1% Rained Upland Rained Lowland Irrigated Deep Water Floating Mangrove Swamp
  • 8.
    Major Rice producing States: Kaduna- 22 %, Niger - 16% Benue - 10% Taraba - 7% In geopolitical terms rice is produced mainly in the central region of Nigeria Rice Output in Nigeria by Zones (2000) 23% 15% 47% 10% 5% Northwest Northeast Northcentral Southeast Southwest
  • 9.
    Effect of ricetrade (imports) on domestic rice production and marketing The proportion of local rice available in Nigerian markets is far less than that of imported rice Table: Market share of foreign rice to local rice in selected urban markets. Urban market Local rice volume (tons) Foreign rice volume (tons) Total volume (tons) Percent of foreign rice Enugu 2270.00 5935.80 8205.80 72.33 Umuahia 417.00 14202.90 14619.90 97.14 Owerri 1786.90 15493.40 17280.30 89.60 Uyo 290.70 887.00 1177.70 75.53 Port Harcourt 442.90 26306.50 26749.40 98.34 Onitsha 4284.90 157600.00 161884.90 97.35 Calabar 321.00 790.10 1111.10 71.11 Aba 847.97 23177.10 24025.07 96.47 Source: Field survey, 2001.
  • 10.
    Effect of ricetrade (imports) on domestic rice production and marketing Capacity utilisation in selected rice processing mills Location Capacityutilisation (%) Abakiliki 7.06 Afikpo 40.27 Adani 20.46 Omor 60.36 Ogoja 8.89 Bende 5.41 • The small rice processing mills are the most dominant in Nigeria • Low effective capacity utilisation in small rice mills Three types of rice processing mills Traditional/hand Small rice mills Large rice mills
  • 11.
    Effect of ricetrade (imports) on domestic rice production and marketing Nassarawa Afikpo Abakaliki Adani Benue Gombe Taraba 20%30% 15% 30% 15% 30% 20% 15% Figure External sources of paddy rice to Abakaliki, Adani and Afikpo rice mills. Loss of rural farm labour to urban migration Rise in intra regional trade
  • 12.
    Effect of riceimports on domestic production Growth rate of Rice Production in Nigeria -500000 -400000 -300000 -200000 -100000 0 100000 200000 300000 400000 1 9 6 2 1 9 6 8 1 9 7 4 1 9 8 0 1 9 8 6 1 9 9 2 1 9 9 8 • The growth in domestic rice output declined with growth being negative in 1995 • The growth rate in domestic rice production is still negative to date
  • 13.
    How competitive islocal rice ? Table: Comparing price competitiveness for domestic and imported rice from selected rice mills Mills Millers price N/25kg Additional processing cost (25%) N/25kg Marketing margin N/25kg Estimated Urban market price N/25kg Price of imported rice N/25kg Percentage Difference Abakaliki 900.00 225.00 613.00 1738.00 1575.00 10.30 Adani 1018.75 254.68 431.00 1704.55 1575.00 8.23 Omor 1068.75 267.18 531.00 1866.93 1575.00 18.53 Bende 1137.5 284.37 461.00 1882.87 1575.00 19.50 Source: Field survey, 2001. On the average an extra cost of 25 percent is needed to process domestic rice to the quality and standards of imported rice Improving the standards of local rice is feasible and desirable, but it may not be competitive for local rice mills Compounded by the issue of grading and uniform rice varieties from local farmers
  • 14.
    Table International riceprices relative to domestic rice prices in Nigeria 1993 to 2001 Year Exchange rate (N) International rice price ($/ton)* Domestic rice (Paddy) $/ton Domestic rice (Milled) $/ton Prices (milled rice) at 2002 exchange rate (N120.96 = US$1.00) 1993 24.67 160.29** 429.27 739.76 150.88 1994 22.00 186.12 544.09 994.55 180.88 1995 75.92 268.50 188.09 393.44 246.94 1996 80.00 234.06 323.0 566.00 374.34 1997 81.25 214.02 311.14 596.43 400.63 1998 82.75 215.16 386.1 593.35 405.91 1999 92.08 191.46 293.55 479.47 365.00 2000 100.6 142.96 265.00 436.28 362.85 2001**** 112.03 135.38 334.55 532.36 493.05 *Based on international prices for White broken rice, Thai A1 super f.o.b Bangkok **Source http://apps2.fao.org/servlet/org.fao.waicent.ciwp.CIWPQueryServlet ***Source: PCU data Average annual market prices, 1993 t0 2000 ****Source RUSEP website: www.rusep.org How competitive is local rice ? The table compares the domestic prices of paddy and milled rice in Nigeria with the international prices of the worst grade rice (white broken rice, Thai A1 super, f.o.b Bangkok). If we assume that exchange rates in Nigeria reflect market forces (which is unlikely especially in 1993), then Nigerian domestic rice is expensive to produce (compare paddy prices) and expensive to process (milled rice) and so cannot compete in the international market.
  • 15.
    Optimal distribution indomestic rice trade  Domestic rice markets are shrinking due to rice imports  The closer the demand market to the supply zone, the less optimal it becomes with increase in transport cost  The marginal cost of non- optimal supply of rice from small processing mills increases with increase in transport cost ABAKALI KI UYO OWERRI UMUAHI A ENUGU ABA OBOLL O NSUKK A BENIN ONITSH A IKOM OKIGWE PORTHARCO UT OGOJ A AFIKP O OMO R ADAN I BEND E 80% 16.9 % 36.9 % 45% 7.9 % 90% 69.9 % 20% EKWULOBI A 0.7% 0.3 % 11.1 % 29.1 % 7.9 % 8.5% 1.6% 18.5 % 5.7 % 5.8 %
  • 16.
    Effect of policyInconsistency on domestic rice production Self sufficiency trend 0 20 40 60 80 100 120 1961 1963 1965 1967 1969 1971 1973 1975 1977 1979 1981 1983 1985 1987 1989 1991 1993 1995 1997 1999 Year Percentage PRE-BAN CRISIS BAN TARRIFF • Pre ban period: 1960 – 1976 • Period of crisis (import license, etc) 1976 – 1985 • Period of outright ban 1986 – 1994 • Period of tariff 1995 – 2005 Domestic self sufficiency in Nigerian rice production was adversely affected during the crisis years of 1977 – 1985 Self sufficiency in rice production is still a major challenge for Nigeria to date
  • 17.
    Conclusions  The demandfor local rice in Nigeria is far less than the demand for imported rice  Local rice production costs are high and uncompetitive  Improving the post harvest quality of domestic rice is critical but can only be achieved if production costs are low  Local transport costs for rice output are sticky downwards at least in nominal terms
  • 18.
    Policy Interventions  Intensifyrice production and increase on-farm yield to reduce production costs  Improve quality and standard of rice and reduce post harvest losses  Facilitate rural enterprises and businesses especially in small mills to sustain productivity, incomes and employment  Strengthen human and institutional capacities to produce, process and market rice competitively in Nigeria
  • 19.

Editor's Notes

  • #4 The challenge to transform cassava into a more competitive crop is not an easy one. One of the aspects in which CLAYUCA is working is on the adaptation of mechanized practices that have been developed by the very efficient cassava production systems prevailing in South Brazil. Prototypes for planting and harvesting cassava are now available. CLAYUCA imported and validated them now under Colombian conditions. Very important economies are obtained when these mechanized systems are implemented. In planting operations