
Recommended
More Related Content
What's hot
What's hot (20)
Similar to Indian Energy Exchange Ltd report
Similar to Indian Energy Exchange Ltd report (20)
More from tdjariwala
Recently uploaded
Recently uploaded (20)
Indian Energy Exchange Ltd report
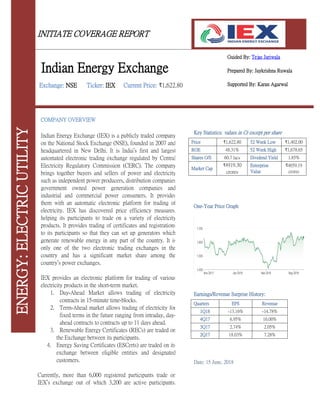
- 1. INITIATE COVERAGE REPORT Guided By: Tejas Jariwala Prepared By: Jaykrishna Ruwala Supported By: Karan Agarwal Key Statistics: values in Cr except per share Price ₹1,622.80 52 Week Low ₹1,402.00 ROE 48.31% 52 Week High ₹1,678.65 Shares O/S 60.7 lacs Dividend Yield 1.85% Market Cap ₹4919.30 crores Enterprise Value ₹4659.19 crores One-Year Price Graph Earnings/Revenue Surprise History: Quarters EPS Revenue 1Q18 -13.16% -14.78% 4Q17 6.95% 16.00% 3Q17 2.74% 2.05% 2Q17 18.03% 7.28% Date: 15 June, 2018 COMPANY OVERVIEW Indian Energy Exchange (IEX) is a publicly traded company on the National Stock Exchange (NSE), founded in 2007 and headquartered in New Delhi. It is India’s first and largest automated electronic trading exchange regulated by Central Electricity Regulatory Commission (CERC). The company brings together buyers and sellers of power and electricity such as independent power producers, distribution companies, government owned power generation companies and industrial and commercial power consumers. It provides them with an automatic electronic platform for trading of electricity. IEX has discovered price efficiency measures, helping its participants to trade on a variety of electricity products. It provides trading of certificates and registrations to its participants so that they can set up generators which generate renewable energy in any part of the country. It is only one of the two electronic trading exchanges in the country and has a significant market share among the country’s power exchanges. IEX provides an electronic platform for trading of various electricity products in the short-term market. 1. Day-Ahead Market allows trading of electricity contracts in 15-minute time-blocks. 2. Term-Ahead market allows trading of electricity for fixed terms in the future ranging from intraday, day- ahead contracts to contracts up to 11 days ahead. 3. Renewable Energy Certificates (RECs) are traded on the Exchange between its participants. 4. Energy Saving Certificates (ESCerts) are traded on its exchange between eligible entities and designated customers. Currently, more than 6,000 registered participants trade on IEX’s exchange out of which 3,200 are active participants. ENERGY:ELECTRICUTILITY Indian Energy Exchange Exchange: NSE Ticker: IEX Current Price: ₹1,622.80
- 2. T e m p l e U n i v e r s i t y I n v e s t m e n t A s s o c i a t i o n : T h e F o x F u n d Page 2 Over 4,500 participants were eligible for trading electricity contracts on the Day-Ahead and Term-Ahead Markets and over 4,000 participants were eligible for trading RECs. Participants who are eligible to trade on the Exchange are situated across 29 states and 5 union territories in India. These participants consist of 50 Distribution Companies (DISCOMs), over 400 electricity generators as well as over 3,900 open access customers. INVESTMENT THESIS High Market Share in the Power Trading Market Indian Energy Exchange is India’s premier electricity trading exchange for trading of electricity products in the country, as per the traded contract volumes in financial year 2017. Started in June 2008, IEX is the first and largest power trading exchange in India and has a strong foothold in this sector. It is evident with the current market share that it enjoys in the short-term trading market. The Day-Ahead Market segment possesses 99.4% of market share. The Term- Ahead Market owns 67.9% market share whereas the REC market has a 71.2% market share. Since DISCOMs are benefitting from the government-implemented scheme, UDAY, by reducing their overall power-procurement cost, it enables them to explore power exchanges in search of power requirements. Open access customers are also likely to purchase power from the short-term market to optimize their power procurement cost as power exchanges have low tariffs. This is expected to add growth to the DAM and TAM markets. RECs were launched in order to make renewable energy sources available to such areas in the country where there were no renewable energy sources for obligated entities to meet their renewable purchase obligation (RPO) requirements. The Ministry of Power has set an RPO target of 17% by 2019, out of which 6.75% should come from solar and the remaining 10.25% should come from non-solar. RECs would help firms and obligated entities to meet this ambitious target and in turn, facilitate its own growth. Current electricity market share of power markets in India is 3% which is expected to increase to 9% in 2022. If IEX maintains its current market share in the coming years, it will benefit from this rise and will contribute towards its revenue.
- 3. T e m p l e U n i v e r s i t y I n v e s t m e n t A s s o c i a t i o n : T h e F o x F u n d Page 3 Efficient Price Discovery and Variety of Products The company’s online platform promotes efficient price discovery measures and provides the participants on the Exchange the flexibility to trade in a variety of electricity products. This price discovery was made possible using the double-sided closed auction bidding process to determine the market clearing price. Because of price discovery, the short-term market witnessed a transformation from traders to exchanges over the years. Energy exchanges have also been becoming more popular as a way to trade due to the transparency of the trading process and the price discovery measures. The proportion of energy traded over its power exchanges grew from 23.8% to 30.4% of the short-term market between the financial year 2013 and the financial year 2016 and was 34.2% for the eleven months ended February 28, 2017, according to the CERC. Introduction of power exchanges has also led to a decline in Deviation Settlement Mechanisms (DSMs). It has over 3,800 registered clients, 300 private generators and more than 3,300 industrial electricity consumers. It is virtually debt-free, having no short-term or long-term borrowings. There is a lot of flexibility available for participants to trade on the Exchange as the variety of products as well as the volume of electricity is so vast. This helps participants to meet their requirements and manage their portfolios more easily. They can bid for a quantum of electricity as low as 0.1 MW. This helps to cater to any number of participants’ demands in the short-term electricity market. High Scalability in terms of Technology IEX is highly scalable because of its trading platform which enables the company to meet anticipated user growth as and when demand increases. It is currently operating in India and has plans to expand into neighboring countries such as Nepal, Bhutan, Bangladesh etc. The country is currently divided into 13 price areas whereas the capacity for the company’s Exchange is 30 price areas even after the proposed expansion plan. This would help enlarge the customer base and the number of participants trading on the Exchange. Considering the volume of electricity traded in such exchanges of other countries, it
- 4. T e m p l e U n i v e r s i t y I n v e s t m e n t A s s o c i a t i o n : T h e F o x F u n d Page 4 averages around the range of 30%-70% whereas it is less than 5% in India. This leaves a lot of room to grow for India’s power exchanges in order to converge with the global level. In the next five years, peak demand for power in India is estimated to grow at a 7.3% CAGR. There is a lot of potential for growth in technological aspects and taking into account that the company has a strong foothold in this sector, it is highly feasible to say that it will maintain its dominance in the coming years. Strong Financials IEX has a cash-rich balance sheet and is debt-free, having no short-term or long-term borrowings. Being an asset light company, it has realized strong and steady return ratios. It has had sound ROE in the past 3 years averaging around 36% and stable RoCE averaging around 48%. It has maintained consistent operating margins and net margins averaging around the range of 70-75% and 48-50% respectively in the past 5 years. The company has recently been paying out most of its earnings as dividends, following its policy of keeping its dividend payouts at or over 50% of net profits. In the financial year ended 31 March 2017, its dividend payout ratio was 80.1%, a 40% increase from financial year ended 31 March, 2016. IEX’s dividend per share has risen at a 4-year CAGR of 96.8%, showing an increase of 57.89% YoY from ₹19.00 in financial year 2016 to ₹30.00 in financial year 2017. The company’s dividend yield for the financial year ended 2017 is 1.84%. It has a good dividend track record and has consistently declared dividends for the last five years. RISKS: 1. Heavy Dependence on Information Technology: IEX’s Exchange depends on the performance and continuing availability of the technology and software that bolster the company’s electronic trading platform. Although the company has currently implemented a security framework to prevent and detect system intrusions and implement internal and external security tools, audits and regular updates to its systems
- 5. T e m p l e U n i v e r s i t y I n v e s t m e n t A s s o c i a t i o n : T h e F o x F u n d Page 5 that are designed to manage redundancy and to reduce the risk of system disruptions, such systems and facilities may prove inadequate or improperly administered. If the technology, systems or software licensed were to malfunction or its third-party or in-house technology specialists were to fail to perform, it may have an immediate and negative impact on the Exchange and may have an adverse effect on its trading volumes, business, financial condition, results of operations and prospects. Heavy trading on its online platform during peak trading times or times of unusual market volatility may cause its systems to operate slowly or even to fail for certain periods of time. The company may face interruptions in operations due to insufficient system capacity or power supply, which may adversely affect trading volumes on the Exchange. Any failure that causes an interruption to its services or reduces its responsiveness, including failures caused by participant error or misuse of its platform and systems, may harm its reputation and have an adverse effect on its business, financial condition, results of operations and prospects. 2. Reliance on Limited Number of Clients: IEX depends on a limited number of clients for a significant portion of power traded on its Exchange, which makes up most of the revenue from operations in the Day-Ahead Market. This is also expected to be the case in the foreseeable future with a limited client base comprising most of the revenue. The company’s top ten participants comprised 30.6%, 29.7% and 23.5% of the total revenue in the Day-Ahead Market for the financial years ended 2015, 2016 and 2017 respectively. Its revenue from Day-Ahead Market operations for the financial year 2017 was approximately 25%. Any loss or withdrawal of a major participant from the company’s exchange may result in a decline in the revenue and the volume of power traded. This may, in turn, affect the company’s financial positions and future prospects. 3. Expansion and Introduction of New Products and Services remains a Huge Risk: IEX is under heavy regulation of its operation by the CERC and relevant government authorities. Whenever a new type of contract or product is made available for trade on the company’s Exchange, it must be reviewed and approved by the CERC and has to comply with the business rules laid down by the CERC. Even if the company wants to expand into new areas and markets outside India, it has to seek approval and regulatory support by the CERC. Furthermore, new markets outside India have different market conditions and participant preferences than India which the company may face difficulty competing with. The volume of power traded also needs to reach the expected volume, which also takes time. Introduction of new products and services would require a large amount of money and time to be invested in it which may or may not receive CERC approval. Even if these products were approved, their success in the markets cannot be guaranteed and if they turn out to be unsuccessful, it may adversely impact the company’s result from operations and financial condition. 4. Competition from Existing Players and New Entrants: Despite having a 94.8% market share in the power market, high competition in the future always remains a risk as there are no restrictions for initiating a power exchange. This might bring in new companies in the market.
- 6. T e m p l e U n i v e r s i t y I n v e s t m e n t A s s o c i a t i o n : T h e F o x F u n d Page 6 Competition may emerge in various kinds of ways such as competitive pricing, higher market liquidity, new products, technological innovations and a better and reliable online trading platform. If, in order to tackle such competition, IEX reduces its prices, it may severely affect its margins. As for existing companies, Power Exchange India Limited, traders and the DEEP portal launched by the Ministry of Power brings competition to IEX. Along with the above-mentioned measures, they can also expand their network, achieve greater economies of scale and take advantage of growth opportunities such as acquisitions to intensify competition in the power market. SEGMENTS OVERVIEW IEX has four products namely, Day-Ahead Market, Term-Ahead Market, Renewable Energy Certificates and Energy Saving Certificates. These are also its four reportable segments. 1. Day-Ahead Market (DAM): Day-Ahead Market is a nationwide electronic trading platform for physical delivery of electricity which works as 15-minute time-blocks of 24 hours of the next day starting from midnight. It uses a double sided closed auction bidding process to determine the price and quantum of electricity. The intersection point between the aggregated sale and purchase curves is used to define the Market Clearing Price or MCP. Bids can be submitted either in a single order or in block orders. The minimum bidding amount is Re. 1 for 1 MW and the minimum price and volume step is 0.1p*0.1MW. DAM Trading Process: Source: Iexindia.com 2. Term-Ahead Market (TAM): Term-Ahead Market provides a variety of products allowing participants to buy/sell electricity on a term basis for a duration of up to 11 days ahead. The products under term-ahead market include intraday, day-ahead contingency, daily and weekly contracts to help participants manage their electricity portfolios for different time periods:
- 7. T e m p l e U n i v e r s i t y I n v e s t m e n t A s s o c i a t i o n : T h e F o x F u n d Page 7 a. Intraday Contracts: This is a continuous trading process which allows participants to trade power for the same day on an hourly basis. b. Day-Ahead Contingency: This is a continuous trading process which allows participants to trade power for an entire day on an hourly basis and one day ahead of trading. This takes place right after the Day- Ahead Market auction ends for the day. c. Daily Contracts: This is a continuous trading process which allows participants to trade power for an entire day at any given time. d. Weekly Contracts: This is an Open Auction trading process which allows participants to trade power for an entire week. TAM Characteristics: Source: Iexindia.com The following table shows a forecast of total volume traded on the short-term market: Source: IEX DRHP The above chart indicates that the electricity volumes to be traded on power exchanges is predicted to increase to 8.9% of the total generation from conventional sources by financial year 2022 from approximately 3.5% during the financial year 2017.
- 8. T e m p l e U n i v e r s i t y I n v e s t m e n t A s s o c i a t i o n : T h e F o x F u n d Page 8 3. Renewable Energy Certificates (REC): Renewable Energy Certificates is aimed at providing renewable energy sources to state utilities and obligated entities, including states which do not have the necessary conditions for renewable energy. Under this, a generator can generate renewable energy in any part of the country. One REC represents 1 MWh of energy generated from energy sources. The two types of RECs are solar certificates for energy generated through solar power and non-solar certificates for energy generated through other sources of renewable energy than solar. RECs are traded to and between eligible, obligated, and voluntary entities on the Exchange. Source: Iexindia.com The above chart shows that electricity is generated by renewable power generation companies which is then moved forward in two ways. The first way is giving electricity to transmission companies to be transmitted across their specified areas in exchange for a cost equivalent. The second way is the one where power exchanges like IEX come in. The renewable power generating companies sell RECs to IEX in exchange for a cost equivalent which is then bought by obligated entities to fulfill their RPOs via IEX’s trading platform. These entities pay the cost equivalent to IEX. 4. Energy Saving Certificates (ESCerts): Energy Saving Certificates are a relatively new segment as it was launched in September, 2017. It is a part of the PAT (Perform, Achieve, Trade) system introduced by the Bureau of Energy Efficiency’s objective of National Mission on Enhanced Energy Efficiency. Under this, targets are set for designated customers which are to be met in a period of 3 years. Designated Customers who achieve or over-achieve the targets will be eligible to sell ESCerts and underachievers can purchase ESCerts on the company’s Exchange. By launching this segment, IEX allows its participants and Designated Customers to trade ESCerts on its online Exchange.
- 9. T e m p l e U n i v e r s i t y I n v e s t m e n t A s s o c i a t i o n : T h e F o x F u n d Page 9 ESCerts Trading Procedure: Source: Iexindia.com
- 10. T e m p l e U n i v e r s i t y I n v e s t m e n t A s s o c i a t i o n : T h e F o x F u n d Page 10 INDUSTRY OVERVIEW Power Sector in India: The Indian power sector is undergoing a slow and steady turn around with the government placing greater thrust on aspects such as: Renewable energy generation especially solar energy; Distribution reforms through UDAY to enhance operational efficiency and restore financial viability of the distribution companies; Electricity supply on 24x7 basis; development of transmission infrastructure and last but not the least increased availability of domestic coal to thermal power plants leading to reduced reliance on imported coal. As per statistics from the Central Electricity Authority (CEA), during the last five years, installed capacity has increased at CAGR of 13% from 199 GW to 327 GW, while the peak demand met has increased only at 4.1% and energy availability has grown at 7%. IEX’s present installed capacity could have possibly generated more than 1700 BUs while actual generation this fiscal, according to CEA, was only 1160 BUs. These statistics imply that the company is now having surplus power scenario. Electricity Production in India: Even as India is the third-largest electricity producer in the world, the country’s need for energy is increasing as a result of economic growth and modernization over the past several years. India’s per capita electricity consumption has grown from 631.4 kilowatt-hour (kWh) in the financial year 2006 to 1075 kWh in the financial year 2016, an increase of 70.2% in 10 years. Between 2006 and 2017, India’s peak demand increased at a CAGR of 5.0% to reach 159.5 gigawatts (“GW”); the installed power generation increased from 124 GW to 327 GW at a CAGR of 9.2% during the period. Further, the latest draft National Electricity Plan 2016 projects peak demand of 235 GW at the end of the financial year 2022. India’s electric production stood at 1,160.1 BU in FY17, a growth of over 4.72% over the previous fiscal year. Electricity production stood at 611.3 BU between April-September 2017. The electricity
- 11. T e m p l e U n i v e r s i t y I n v e s t m e n t A s s o c i a t i o n : T h e F o x F u n d Page 11 production in India grew at a CAGR of 7.03% over FY10-FY17. A total of 13,872 villages out of 18,452 un-electrified villages in India have been electrified up to June 30, 2017 as part of the target to electrify all villages by May 1, 2018. The 12th Five Year Plan projects that total domestic energy production would reach 844 million tonnes of oil equivalent (MTOE) by 2021-22. FINANCIALS Revenue Total revenue increased by 18.6% to ₹237.42 crore for the financial year 2017 from ₹200.14 crore for the financial year 2016, due to an increase in the company’s revenue from operations and other income. Revenue from operations increased by 16.5% to ₹203.91 crore for the financial year 2017 from ₹175.03 crore for the financial year 2016, due to an increase in revenue from transaction fees by 18.9% to₹177.76 crore for the financial year 2017 from ₹149.45 crore for the financial year 2016; An increase in revenue from annual subscription fees by 1.8% to ₹25.20 crore for the financial year 2017 from ₹24.76 crore for the financial year 2016 and an increase in admission, processing and transfer fees by 16.7% to ₹0.95 crore for the financial year 2017 from ₹0.82 crore for the financial year 2016. The growth in transaction fees was due to an increase in transaction volumes of electricity contracts traded on the company’s Exchange and an increase in transaction volumes of RECs traded on the Exchange. Other income increased by 33.4% to ₹33.51 crore for the financial year 2017 from ₹25.11 crore for the financial year 2016, primarily due to the change in the company’s investment strategy from investing into dividend option (tax exempted income) mutual funds to growth option mutual funds (taxable income) and hence the recognition of returns on gross basis (pre-tax) from net basis (tax exempt), and an increase in total amount of investments made, partially offset by a decrease in interest rates. Expenses Employee benefits: IEX’s employee benefits expenses increased by 10.4% to ₹15.57 crore for the financial year 2017 from₹14.11 crore for the financial year 2016, primarily as a result of an increase in salaries and bonus to ₹14.03 crore for the financial year 2017 from ₹12.890 crore for the financial year 2016, due to an increase in the number of its employees, together with increments in salaries paid to its employees. It had 85 employees as of March 31, 2017 as compared to 74 employees as of March 31, 2016. Technology expenses: IEX’s technology expenses increased by 15.9% to ₹23.42 crore for the financial year 2017 from ₹20.20 crore for the financial year 2016, primarily on account of payment of higher variable fees due to higher trading volumes to a software vendor consistent with the growth of the business.
- 12. T e m p l e U n i v e r s i t y I n v e s t m e n t A s s o c i a t i o n : T h e F o x F u n d Page 12 Finance costs: IEX’s finance costs decreased by 51.1% from ₹0.27 crore for the financial year 2016 to ₹0.13 crore for the financial year 2017, primarily on account of a decrease in other interest of ₹0.11 crore for the financial year 2017 from₹0.25 crore for the financial year 2016, towards interest paid to tax authorities in India in connection with its advance income tax obligations. Depreciation and amortization: IEX’s Its depreciation and amortization expenses increased by 2.0% to ₹3.46 crore for the financial year 2017 from ₹3.39 crore for the financial year 2016, as amortization of intangible fixed assets increased to₹1.89 crore for the financial year 2017 from ₹1.85 crore for the financial year 2016 and depreciation on tangible fixed assets increased to ₹1.57 crore for the financial year 2017 from ₹1.54 crore for the financial year 2016, primarily due to an increase in its asset base. Other operating expenses: IEX’s other operating expenses increased by 39.1% to ₹21.63 crore for the financial year 2017 from ₹15.54 crore for the financial year 2016, primarily on account of: 1. An increase in legal and professional fees paid to ₹7.19 crore for the financial year 2017 from ₹3.34 crore for the financial year 2016, as a result of payments made for several non-recurring consultancy services received in the financial year 2017 and legal services towards arbitration proceedings in connection with a perpetual software license agreement; and 2. An increase in corporate social responsibility expenses to ₹2.07 crore for the financial year 2017 from ₹0.17 crore for the financial year 2016 under its CSR policy. Margins Operating Margin: IEX’s operating margin for the financial year ended 2017 contracted 0.3% YoY from 73.26% in financial year 2016 to 72.95% in financial year 2017. This was due to the increase in the total revenue of the company being higher than the increase in the operating profits. However, the company has maintained high operating margins in the past 5 years in the range of 72-76%. Net Margin:
- 13. T e m p l e U n i v e r s i t y I n v e s t m e n t A s s o c i a t i o n : T h e F o x F u n d Page 13 IEX’s net margin for the financial year ended 2017 also contracted 2.3% YoY from 50.13% in financial year 2016 to 47.83% in financial year 2017. Even though profits for the year were up by 13%, the net margin resulted in a decline due to the total revenue of the company increasing at a higher rate than the profits. Net margin for the past 5 years has been maintained in the range on 47%-52%. Earnings IEX’s earnings per share for the financial year ended was ₹37.84, indicating a 14% increase from financial year ended 2016 with earnings per share amount of ₹33.18. It has shown a consistent growth over the past 5 years, averaging around ₹30-₹33. The company’s earnings have risen at a four-year CAGR of 12.2%. Given the current price to earnings ratio of 35.69 times, the company’s price/earnings to growth ratio is evaluated to be 2.93. This signifies that market expectation in terms of growth in this company is higher than the consensus estimate. Ratio Analysis: Valuation Ratios: Return Ratios: P/E: IEX’s current Price to Earnings ratio is 44.1 times, which reduced 5.8 times from fiscal year 2016. This is higher than the market average P/E of 20-25 times and shows that investors can anticipate higher growth from this company in the future. ROE: IEX’s ROE in fiscal year 2017 is 41.6%, an increase of 2.3% from fiscal year 2016. This indicates that the company has a strong ability to generate profits from the investments put in by the shareholders. P/B: IEX’s current Price to Book ratio is 18.2 times, showing a meagre decline of 0.3 times from fiscal year 2016. However, it has been consistent in the range of 18-20 times in the past 4 years. ROCE: IEX’s ROCE in fiscal year 2017 is 51.2%, which shows an expansion of 3.5% from fiscal year 16. This shows that a significant amount of profit can be invested back into the company for the benefit of the shareholders. EV/EBITDA: IEX’s EV/EBITDA ratio is 31.5x, which is a contraction of 5.6x from fiscal year 2016. This shows that the company is overvalued. ROA: IEX’s ROA in fiscal year 2017 is 21%, which is a 3% reduction from fiscal year 2016. This shows that the application of funds is put to proper use in order to increase the percentage of profits. Profit & Loss:
- 14. T e m p l e U n i v e r s i t y I n v e s t m e n t A s s o c i a t i o n : T h e F o x F u n d Page 14 Balance Sheet: Cash Flow Statement:
- 15. T e m p l e U n i v e r s i t y I n v e s t m e n t A s s o c i a t i o n : T h e F o x F u n d Page 15 VALUATION Peer Group Analysis Power Exchange India Limited (PXIL): Launched in late 2008 as a private company, Power Exchange India Limited is India’s first institutionally promoted power exchange which provides an electronic trading platform to trade Indian electricity futures contracts. It is also regulated by the Central Electricity Regulatory Commission (CERC) and its major stakeholders and promoters are two of India’s major trading exchanges, namely the National Stock Exchange of India (NSEI) and the National Commodity & Derivatives Exchange (NCDEX). Its products include Day-Ahead Spot Market, Day-Ahead Contingency and Weekly contracts and its services include trading of Renewable Energy Certificates (RECs). Its members consist of inter-state generators, distribution licensees, state generating stations, open access consumers and electricity traders. It makes up the remaining 5% market share in the power market and is the sole competitor of IEX. Source: Powerline.net.in
- 16. T e m p l e U n i v e r s i t y I n v e s t m e n t A s s o c i a t i o n : T h e F o x F u n d Page 16 MANAGEMENT Mr. Satyanarayan Goel - Managing Director and Chief Executive Officer Satyanarayan Goel was appointed as the Managing Director and Chief Executive Officer of our Company with effect from January 21, 2014. He holds a bachelor’s degree of science in electrical engineering from the Sambalpur University, Burla and a master’s degree of business administration from the University of Delhi, New Delhi. He has over 38 years of professional experience in power sector. Before joining IEX, he was the director of marketing and operations at PFS. Prior to working with PFS, he was associated with NTPC Limited for 29 years and retired as an executive director (fuel security). He has been associated with IEX since October 16, 2012 when he was appointed as a Nominee Director of the Company for PFS. Mr. Rajesh Kumar Mediratta - Director (Business Development) Rajesh Kumar Mediratta was appointed as the vice president – special projects at Multi Commodity Exchange of India Limited on March 12, 2007 and his services were confirmed in IEX with effect from September 12, 2007. He holds a bachelor’s degree of mechanical engineering from the Rani Durgavati Vishwadvidyalaya, Jabalpur and a degree of Master of Business Administration from the Indira Gandhi National Open University, New Delhi. He has 29 years of experience in the power sector. Prior to joining IEX, he worked as an assistant director with the Central Electricity Authority and later with the Power Grid Corporation of India Limited as chief manager. He has to his credit several papers on power markets, commercial mechanism, power system operations and settlement systems presented at international and national conferences. Mr. Vineet Harlalka - CFO & Company Secretary Vineet Harlalka was appointed as the Company Secretary of IEX with effect from January 16, 2010 and as the Chief Financial Officer of the Company with effect from May 9, 2014 and as Compliance Officer with effect from May 30, 2017. He holds a bachelor’s degree of commerce from the University of Delhi, New Delhi and has been admitted as an associate of the Institute of Chartered Accountants of India and the Institute of Company Secretaries of India. He has over 13 years of experience in the field of finance, taxation, and treasury, secretarial and accounting practice. Prior to joining IEX, he has worked with New Holland Fiat (India) Private Limited. Dr. Pareshnath Paul - Chief Technology Officer Pareshnath Paul was appointed as chief technological officer with effect from April 17, 2017. He holds a bachelor’s degree of technology in chemical engineering from the Jadavpur University, Kolkata. He holds a master’s degree of technology in chemical engineering and a Doctor of Philosophy from the Indian Institute of Technology, Kharagpur. He has over 21 years of experience in software, information technology and technology delivery. Prior to joining IEX, he worked at NSEIT Limited as the chief delivery officer (senior vice- president). He has also worked with Mphasis Limited as delivery leader and with Melstar Information Technologies Limited as vice-president (delivery). He also served as head of technology of Bells Controls Limited where he contributed towards the development of the software division of Bells Controls Limited which resulted in the formation of Bells Softech Limited.
- 17. T e m p l e U n i v e r s i t y I n v e s t m e n t A s s o c i a t i o n : T h e F o x F u n d Page 17 APPENDIX Exhibit I: IEX’s Financials Snapshot Source: Ace Analyser
- 18. T e m p l e U n i v e r s i t y I n v e s t m e n t A s s o c i a t i o n : T h e F o x F u n d Page 18 Conclusion: IEX has a strong foothold in the power market, enjoying over 90% market share since the past 5 years. It has a cash-rich balance sheet, has no debt and pays out more than 50% of its earnings as dividends. The company’s online trading platform has a larger capacity in terms of participants and volume of electricity transactions traded than the current figures. As compared, to power exchanges of other countries, it has a lot of room for growth as it can come up with new and unventured products such as Forward and Futures market, Ancillary Services market, Capacity market, Financial Transmission rights etc. Since volume of electricity traded in India on power exchanges is less than 5% as compared to other countries who have volumes of 30%-70%, IEX is an emerging company with almost the entire market share in this sector. And given that the peak demand for power is most likely to increase in the coming years, IEX is bound to benefit from these macroeconomic factors in the future. Disclaimer: This report is prepared strictly for educational purpose by Jainam Share Consultants Pvt. Ltd. and should not be used as an investment guide. The forward-looking statements contained are simply author’s opinions. GLOSSARY: 1. DAM: Day-Ahead Market, a segment of IEX 2. TAM: Term-Ahead Market, a segment of IEX 3. REC: Renewable Energy Certificate, a segment of IEX 4. ESCerts: Energy Saving Certificates, a segment of IEX 5. RPO: Renewable Purchase Obligation, it is an obligation imposed by the central government or the law on obligated entities to purchase “green” attributes of electricity, i.e. renewable energy certificates from the power market. 6. CERC: Central Electricity Regulatory Commission, power regulatory body of India. 7. DSM: Deviation Settlement Mechanisms, a mechanism implemented when buyers or sellers of electricity fail to meet their buying or selling commitments. 8. MW: Mega Watt, 1 MW = 1 million Watts of electricity. 9. GW: Giga Watt, 1 GW = 1000 MW 10. BU: Billion Units 11. MU: Million Units 12. CEA: Central Electricity Authority 13. kWh: Kilo Watt hours, kWh = kW (power) X hours (time)