Downloaded 133 times


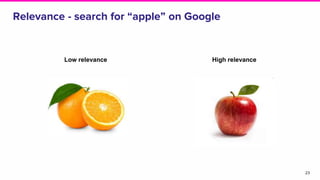
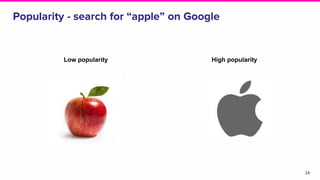
![Striking the balance
25
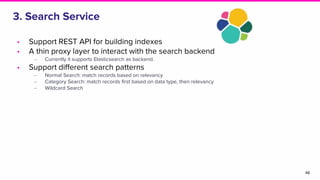
Relevance Popularity
● Names, Descriptions, Tags, [owners, frequent
users]
● Querying activity
● Dashboarding
● Different weights for automated vs adhoc
querying](https://image.slidesharecdn.com/stratasf-amundsenpresentation-190323051100/85/Strata-sf-Amundsen-presentation-24-320.jpg)


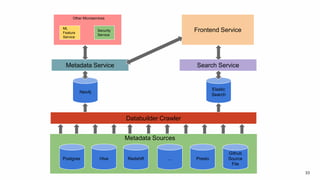


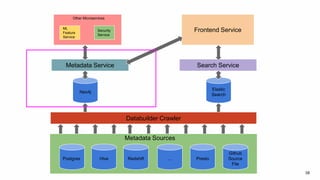
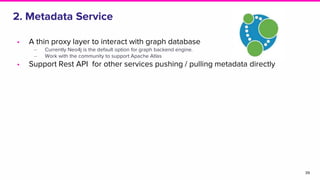
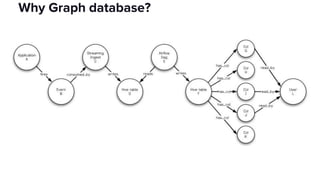
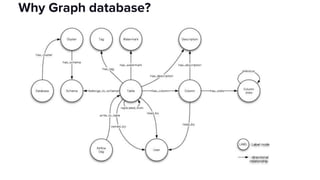

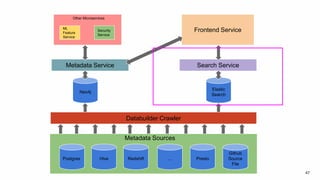


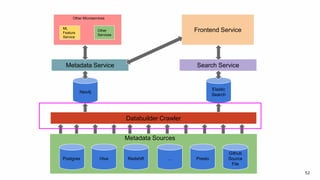


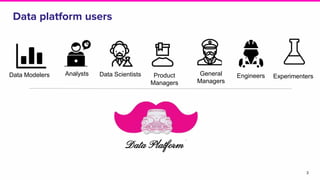
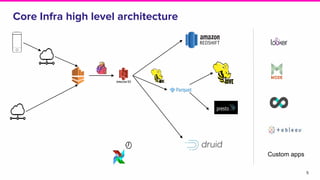
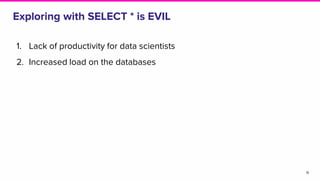
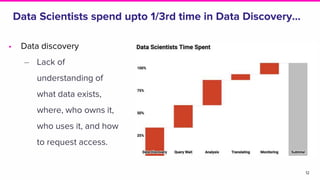
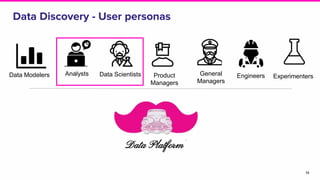
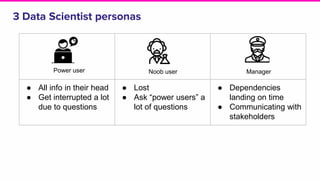
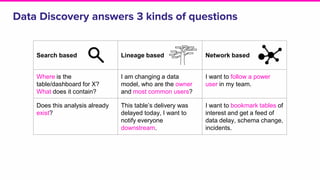
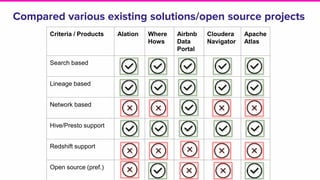
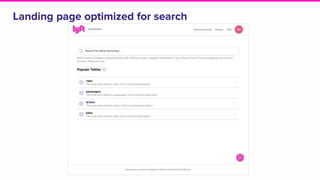
The document discusses the challenges of data discovery at Lyft, highlighting the inefficiencies faced by data scientists and the need for effective data management tools. It introduces Amundsen, a data discovery platform that improves data search, lineage, and network understanding by centralizing metadata and utilizing graph databases. The document concludes with an overview of Amundsen’s architecture and its impact on productivity for data professionals at Lyft.


![[DataCon.TW 2017] Data Lake: centralize in on-prem vs. decentralize on cloud](https://cdn.slidesharecdn.com/ss_thumbnails/datalake-onprem-vs-oncloud-datacon-v3-20170930-171002041256-thumbnail.jpg?width=640&height=640&fit=bounds)


![The Evolution of Metadata: LinkedIn's Story [Strata NYC 2019]](https://cdn.slidesharecdn.com/ss_thumbnails/metadatajourneylinkedinstratapublic-190930045839-thumbnail.jpg?width=640&height=640&fit=bounds)


![[Strata NYC 2019] Turning big data into knowledge: Managing metadata and data...](https://cdn.slidesharecdn.com/ss_thumbnails/dkpstratanyc2019presentation-191004091826-thumbnail.jpg?width=640&height=640&fit=bounds)