SlideShare a Scribd company logo
1 of 12
Download to read offline
05. Financial Concepts:
Ratio Analysis
A financial ratio is a relationship of two values of financial statements. Ratios basically
are mathematical expressions, which are calculated to derive certain conclusion. The
ratio may be expressed as number of times, proportion or percentage. There are
number of ratios, but which to consider for a particular type of analysis is left to the
personal judgement of the analyst. As a matter of fact, all the ratios are for different
purposes and have different objectives.
Uses of Ratios.
Sr. No.
1 Ratios offer help in intra firm comparisons, industry comparison and also
for inter-firm comparison.
2 Financial position of the entity can be studied.
Limitations & problems of Ratio analysis:
Sr. No. Limitations
1 Ratios are based on financial statements, so contain almost all of the
deficiencies of those accounts.
2 Some ratios are open for manipulation and need to be interpreted with care.
E.g. stock levels may be kept artificially low at year-end, creating an
impression of high efficiency in this area.
3 Inter-firm comparisons are faced with the problem that different
organizations might use rather different accounting policies. E.g.
depreciation methods etc.
4 Detailed knowledge of a company’s markets is seldom obtainable from the
published accounts, but is extremely important for assessing future
profitability.
5 Ratios are useful when comparing similar organizations operating under
similar conditions. Comparisons with different types of organizations can
be misleading.
6 There is a real danger that ratio analysis can lead to conclusions, which are
over-simplified. e.g. high current ratio.
Types of Ratios.
Sr. No. Type of Ratio Various ratios
1 Turnover Ratios Debtors, Creditors, Inventory
2 Liquidity Ratios Current, Acid test
3 Profitability Ratios Gross profit, Net profit
4 Solvency Ratios Debt Equity, Interest coverage, DSCR
2
Sr. No. Ratios Formula / Interpretation
1.0 Turnover Ratios:
1.1 Debtors Turnover
Ratio
Average Debtors x 365 divided by Sales.
Average Collection period.
1.2 Creditors Turnover
Ratio.
Average Creditors x 365 divided by Credit purchases.
Average payment period.
1.3 Inventory Turnover
Ratio.
Average inventory x 365 divided by material cost
Holding period of stock
Sr. No. Ratios Formula / Interpretation
2.0 Liquidity Ratios:
2.1 Current Ratio Current Assets / Current Liabilities.
2.2 Acid Test Ratio Quick Assets / Quick liabilities.
Sr. No. Ratios Formula / Interpretation
3.0 Profitability Ratios:
3.1 Gross Profit Ratio Gross profit / Net sales x 100
3.2 Net Profit Ratio Net profit / Net sales x 100
3.3 Material cost ratio Material cost / Net sales x 100
3.4 Expenses Ratios Expenses / Net sales x 100
3.5 Return on Capital PBIT / Capital employed x 100
3.6 Return on
Proprietor’s Funds
PAT / Proprietor’s Funds
Sr. No. Ratios Formula / Interpretation
4.0 Solvency Ratios:
4.1 Debt Equity Ratio Total outside debt / Equity or Shareholders’ funds.
4.2 Proprietary Ratio Proprietor’s funds /Total Assets x 100
4.3 Interest coverage
Ratio
PBIT / Fixed interest charges
4.4 Debt coverage Ratio PATID / (Interest + Repayment installments)
Notes Ratio Components
1 Average debtors Opening debtors + Closing debtors divided by 2
2 Current assets Stock + debtors + cash & bank balance + loans &
advances + Prepaid expenses
3 Current liabilities Creditors + BP + O/S expenses + IT payable +
Dividend payable + Bank overdraft ( not if
permanent)
4 Quick Assets Current Assets less ( Stock + prepaid expenses)
5 Quick Liabilities. Current liabilities less Bank overdraft
6 Gross Profit Sales less material cost.
3
7 Net Profit Sales less all expenses + any other income.
8 Debt Long term loans + debentures + Bank overdraft
9 Equity Equity share capital + Preference share capital +Free
Reserves – (Accumulated losses + deferred revenue
expenditure) = Net worth = Proprietor’s funds.
10 PBIT Profit before Tax + interest.
11 PATID Profit after Tax + Interest + Depreciation. = Annual
cash flow.
12 PAT Profit less I. Tax.
13 Capital employed Net Fixed Assets + Current assets less Current
liabilities.
Interpretation of various Ratios:
Sr. no. Ratio
1.0 Turnover Ratios:
1.1 Debtors Turnover Ratio: This ratio measures the average number of day’s
credit given to debtors. It helps to assess the efficiency of the debt collection
department. Debt collection period should be kept as low as possible,
consistent with maintaining customer goodwill and market trend.
1.2 Creditors Turnover Ratio: This ratio measures the average number of days
credit is exploited from suppliers. Credit given by suppliers depends on
various factors such as demand & supply position of material, industry
trends, competition etc.
1.3 Inventory Turnover Ratio: This ratio measures the average number of days
for which stock is held. It helps to assess the efficiency of stock utilization.
Various factors affect the stock level held by the organization such as
product, production-seasonal or otherwise, demand pattern, competition,
funds availability etc.
2.0 Liquidity Ratios:
2.1 Current Ratio: This ratio is concerned with the assessment of an
organization's ability to meet its short-term obligations. The ratio must be
high enough for safety. However, high current assets do not normally lead to
high profits in themselves, so the usual trade-off between risk and return
exists. Industry norm is 2:1
2.2 Acid Test Ratio: This ratio is also concerned with short-term liquidity. In a
sense it is more appropriate measure since liquid assets represent the source
of funds from which current liabilities will probably be met.
Industry norm is 1:1
3.0 Profitability Ratios:
3.1 Gross Profit Ratio: GP / Margin on sales
3.2 Net Profit Ratio: Net profit on sales. It indicates organization's ability to
generate profits from sales.
3.3 Material cost ratio: Material cost to sales
3.4 Expenses Ratios: Expenses to sales.
3.5 Return on Capital: This ratio is expressed as a percentage. Generally higher
the return the better.
4
3.6 Return on Proprietor’s Funds: This ratio provides a measure of the
percentage return on the investment made by the owners.
4.0 Solvency Ratios:
4.1 Debt Equity Ratio: This ratio is concerned with establishing the relationship
between external and internal long-term financing. The use of long-term debt
in the capital structure has both advantages and disadvantages, and in
practice the level of debt actually existing is the result of a balancing process.
The main advantage of debt is that it provides an opportunity for greater
returns to shareholders. Industry norm is 2:1
4.2 Proprietary Ratio: It measures the owner's contribution of funds.
4.3 Interest coverage Ratio: This ratio measures the safety available to Bank for
recovery of interest. Industry norm is 2:1
4.4 Debt coverage Ratio: This ratio measures the safety available to Bank for
recovery of interest & loan installment. Industry norm is 2.5 : 1
Other Ratios:
6.1 Employees Ratios:
Sales per employee: Sales / staff strength
Sales generation: Sales / salaries & wages
Profit per employee: PBT / staff strength
Profit generation: PBT / salaries & wages
Remuneration level: Salaries & wages / staff strength
6.2 Shareholder's Ratios:
Earnings per share: PAT less Pref. Dividend / number of shares
Dividend per share: Dividend / Number of shares
Dividend pay out ratio: Dividend / Earnings per share
Dividend yield: Dividend per share / Market price per share
Book value per share: Ordinary shareholder's equity / number of
shares
Price-earnings ratio: Market price per share / Earnings per share.
5
Funds Flow Statement
One of the most fundamental objectives of business is to make a profit. Long run survival
requires that the business must be able to deal with any possible liquidity problems which
arise in the short term. Basically any business must be concerned with making a profit and
maintaining a solvent financial position.
Objectives of Funds Flow statement:
1. An analysis of the flow of liquid funds can be very useful in making decisions concerning
liquidity.
2. A full understanding of a business's affairs requires the identification of the changes or
movements in assets, liabilities and capital for a year, and the resultant effect on liquid
resources. A profit & loss account or balance sheet does not specifically disclose this
information.
3. To show the manner in which the operations have been financed, and how the financial
resources have been used.
4. They provide useful guide to creditors & lenders.
5. Various ways to improve the net working capital position can be decided.
6. It focuses attention on resources available for capital investment.
7. It is useful in deciding how fixed assets should be financed.
8. It is useful in planning the retirement of debt.
It is now necessary to understand the Balance Sheet in a different way. E.g. Long term
and short term Funds and its application.
Liabilities Assets
Long Term Long Term
Equity Share Capital
Pref. Share Capital
Reserves & Surplus
Debentures
Term Loan
Long term unsecured loans
Fixed Assets
Investments
6
Short Term Short Term
Bank CC
Creditors
Provisions
Stock
Debtors
Cash & Bank balances
Loans & Advances
Ideally Funds Flow statement should reveal transfer of Long Term Funds to Short Term
Use.
If Short-Term Funds are transferred to Long Term Use, it will indicate that Bank's funds
have been diverted for Long Term Use. This is not the healthy financial practice, as the
firm will always face the liquidity crises.
The effect of increase / decrease in current assets and current liabilities on working
capital is shown below:
1. Working capital means difference between current assets and current liabilities.
2. Increase in current assets leads to increase in working capital.
3. Decrease in current assets leads to decrease in working capital.
4. Increase in current liabilities leads to decrease in working capital.
5. Decrease in current liabilities leads to increase in working capital.
The various stages in preparing Funds Flow statement are listed below.
1. To prepare statement of increase / decrease in Balance sheet figures.
2. To prepare statement of changes in working capital statement.
3. To prepare Fund Flow Statement.
7
Cost of Capital
Rs’000 % Before Tax After Tax Weighted
Avg. Cost
% % %
1 2 3 4 5=4
Less 30%
6=3x5
Capital 6000 30 20.0 6.00
Loans 14000 70 15 10.5 7.35
Total 20000 100 13.35
Before Tax = 13.35 divided by 0.70 = 19.07 % (IT @ 30 %)
Rs’000
PBIT 19.07 % of 20000 3814
Less: Interest 15 % on 14000 2100
PBT 1714
Less: Income Tax 30 % on 17.14 514
PAT 1200
Dividend 20 % on 6000 1200
Retained earnings -------
8
Internal Generation: PAT +Depreciation
Balance Sheet
31-03-2008 Liabilities 31-03-2009 31-03-2008 Assets 31-03-2009
2000 Capital 2000 1000 Machinery 900
----- Profit 400 ---- Debtors ---
1000 Bank bal. 1500
2000 Total 2400 2000 Total 2400
Profit & Loss A/C
31-03-2008 Expenditure 31-03-2009 31-03-2008 Income 31-03-2009
------ Purchases 800 ----- Sales 1500
------ Expenses 200
------- Depreciation 100
----- Profit 400
----- Total 1500 ------ Total 1500
Bank A/C
Capital 2000 Machinery 1000
Balance as on 31-03-2008 1000
Total 2000 Total 2000
Opening balance 1000 Purchases 800
Debtors 1500 Expenses 200
Balance as on 31-03-2009 1500
Total 2500 Total 2500
Note: Creditors & Debtors ---Nil
Funds Flow Statement for the year 2008-09
Profit 400 Increase in Bank balance 500
Add: Depreciation 100
Internal Generation 500
Total 500 Total 500
Note: Internal Generation = PAT +Depreciation. In other words cash is generated in the
business to the extent of Internal Generation. This example was compiled to demonstrate this
fact. In actual situation this surplus cash gets utilized for addition to Fixed Assets, increase in
working capital, repayment of loans etc.
9
Break Even Analysis
Introduction
Break-even analysis is used to plan the profit & production.
Break-even analysis evaluates and compares the fixed costs and variable costs.
This is no profit or no loss situation.
Use of Break even analysis
To study the effect of CVP ratio.
To know the effect of changes in sales mix.
To determine the volume of sales to earn targeted profits.
To decide to enhance the production of profitable products or to reduce /discontinue the
production of low profitable or loss making products.
Assumptions on Break-even point.
The following assumptions are such which are true and valid in certain set of circumstances
up to a certain level.
All costs are divisible into fixed and variable.
All fixed costs remain constant at all levels of output within the installed capacity.
The variable costs vary along with production.
The selling price is assumed to be constant.
The volume of production influences the cost.
There is synchronization between production and sales, which would help deciding the
break-even point.
Break even point
The break-even point may be termed as that point of sales volume at which the total income
is equal to total costs.
It is a point of sale and production where there is no profit no loss.
BEP can be decided in terms of units and as well as in monetary terms.
Any production or sales below this point results into loss or any production or sales beyond
this, yields profit.
10
Definitions
Variable Costs:
(Direct materials, direct labor and variable overheads) will be incurred in direct proportion to
the level of production.
Fixed Costs:
Most overheads are time-based and remain constant, or fixed, regardless of the level of
production.
Total Costs:
Total costs at any level pf production are obtained by adding the fixed costs to the variable
costs.
Formula of BEP
BEP in units = Total fixed costs
---------------------------------------------
Sales price less variable cost per unit
= Total fixed costs divided by contribution per unit.
Formula of BEP
BEP in Sales value= Fixed costs x Sales
---------------------------
Sales Less Variable cost
Example
Sales 6000 units
Sales price per unit Rs. 60=00
Variable cost per unit Rs.40=00
Fixed costs Rs. 40000=00
11
BEP in units
Fixed costs Rs.40000=00
Contribution per unit Rs. 20=00 (Rs.60=00 less Rs.40=00)
BEP in units 40000 divided by 20 = 2000 units.
2000 x Rs. 60=00 = Rs. 120,000
BEP in Sales Value
Fixed costs Rs. 40000=00
Sales Rs. 360,000=00
Variable costs Rs. 240,000=00
BEP in sales value 40000 x 360,000 divided by 120,000=Rs.120000/-
Margin of safety
Margin of safety = Sales less Breakeven Sales.
MOS=6000 – 2000 = 4000 / 66.7 %
Conclusion: Even if Sales decrease by 66.7 %, unit will not incur loss.
Conclusion
BEP Analysis will help the Banker in appraisal of actual / projected performance of the
borrower. It also acts as sensitivity analysis tool to judge the projected performance.
It will play supporting role to DSCR.
12

More Related Content

What's hot (20)

Financial ratio analysis
Financial ratio analysisFinancial ratio analysis
Financial ratio analysis
 
15030141102
1503014110215030141102
15030141102
 
Liquidity ratios
Liquidity ratiosLiquidity ratios
Liquidity ratios
 
Ratio analysis
Ratio analysisRatio analysis
Ratio analysis
 
Liquidity ratio By- Deepak Madan (M.com, B.ed)
Liquidity ratio By- Deepak Madan (M.com, B.ed)Liquidity ratio By- Deepak Madan (M.com, B.ed)
Liquidity ratio By- Deepak Madan (M.com, B.ed)
 
Ratio Analysis
Ratio AnalysisRatio Analysis
Ratio Analysis
 
Ratio Analysis
Ratio AnalysisRatio Analysis
Ratio Analysis
 
Accounting ratios
Accounting ratiosAccounting ratios
Accounting ratios
 
Liquidity Ratio | Accounting
Liquidity Ratio | AccountingLiquidity Ratio | Accounting
Liquidity Ratio | Accounting
 
Investment Valuation Ratios
Investment Valuation RatiosInvestment Valuation Ratios
Investment Valuation Ratios
 
Debt equity ratio
Debt equity ratioDebt equity ratio
Debt equity ratio
 
Ratio analysis
Ratio analysisRatio analysis
Ratio analysis
 
Solvency ratio analysis
Solvency ratio analysisSolvency ratio analysis
Solvency ratio analysis
 
Ratio analysis
Ratio analysis Ratio analysis
Ratio analysis
 
Ratio Analysis Presentation
Ratio Analysis PresentationRatio Analysis Presentation
Ratio Analysis Presentation
 
Performance Ratio Analysis and Management Effectiveness
Performance Ratio Analysis and Management EffectivenessPerformance Ratio Analysis and Management Effectiveness
Performance Ratio Analysis and Management Effectiveness
 
Ratio download
Ratio downloadRatio download
Ratio download
 
Introduction to ratio analysis
Introduction to ratio analysisIntroduction to ratio analysis
Introduction to ratio analysis
 
Ratio analysis
Ratio analysisRatio analysis
Ratio analysis
 
Www
WwwWww
Www
 

Similar to 05 financial concepts

Bm Unit 3.6 Ratio Analysis
Bm Unit 3.6 Ratio AnalysisBm Unit 3.6 Ratio Analysis
Bm Unit 3.6 Ratio AnalysisMr. D. .
 
Financial ratios and their use in understanding Financial Statements
Financial ratios and their use in understanding Financial StatementsFinancial ratios and their use in understanding Financial Statements
Financial ratios and their use in understanding Financial StatementsPranav Dedhia
 
Ratio analysis mf h
Ratio analysis mf hRatio analysis mf h
Ratio analysis mf hmhoque71
 
9 and 10 Financial Analysis.ppt
9 and 10 Financial Analysis.ppt9 and 10 Financial Analysis.ppt
9 and 10 Financial Analysis.pptVbsReddy2
 
Ratio Analysis and financial performance
Ratio Analysis and financial performanceRatio Analysis and financial performance
Ratio Analysis and financial performanceYaarbailee1
 
Prepare a witten financial analysis. .This should include calculation.pdf
Prepare a witten financial analysis. .This should include calculation.pdfPrepare a witten financial analysis. .This should include calculation.pdf
Prepare a witten financial analysis. .This should include calculation.pdfarrowit1
 
Chapter 6_Interpretation of Financial Statement
Chapter 6_Interpretation of Financial StatementChapter 6_Interpretation of Financial Statement
Chapter 6_Interpretation of Financial StatementPresana1
 
Business analysis ppt babasab patil
Business analysis ppt babasab patil Business analysis ppt babasab patil
Business analysis ppt babasab patil Babasab Patil
 
Ratio Analysis By- Ravi Thakur From CMD
Ratio Analysis By- Ravi Thakur From CMD Ratio Analysis By- Ravi Thakur From CMD
Ratio Analysis By- Ravi Thakur From CMD Ravi Thakur
 
Business analysis ppt
Business analysis ppt Business analysis ppt
Business analysis ppt Babasab Patil
 
Financial interpretations with models & formats (unit 2)
Financial interpretations with models & formats (unit 2)Financial interpretations with models & formats (unit 2)
Financial interpretations with models & formats (unit 2)Sas_Bala
 
Financial interpretations with models & formats (unit 2)
Financial interpretations with models & formats (unit 2)Financial interpretations with models & formats (unit 2)
Financial interpretations with models & formats (unit 2)finance1rkh
 
Financial-Analysis-and-Planning-Ratio-Analysis.pdf
Financial-Analysis-and-Planning-Ratio-Analysis.pdfFinancial-Analysis-and-Planning-Ratio-Analysis.pdf
Financial-Analysis-and-Planning-Ratio-Analysis.pdfSimranUtreja
 
Ratio AnalysisFinancial ratios can be used to examine various as.docx
Ratio AnalysisFinancial ratios can be used to examine various as.docxRatio AnalysisFinancial ratios can be used to examine various as.docx
Ratio AnalysisFinancial ratios can be used to examine various as.docxcatheryncouper
 
Financial statement analysis
Financial statement analysisFinancial statement analysis
Financial statement analysisNikhiliit
 
Steps to basic_company_financial_analysis
Steps to basic_company_financial_analysisSteps to basic_company_financial_analysis
Steps to basic_company_financial_analysisIbrahim Hussain
 

Similar to 05 financial concepts (20)

Bm Unit 3.6 Ratio Analysis
Bm Unit 3.6 Ratio AnalysisBm Unit 3.6 Ratio Analysis
Bm Unit 3.6 Ratio Analysis
 
Financial ratios and their use in understanding Financial Statements
Financial ratios and their use in understanding Financial StatementsFinancial ratios and their use in understanding Financial Statements
Financial ratios and their use in understanding Financial Statements
 
Ratio analysis mf h
Ratio analysis mf hRatio analysis mf h
Ratio analysis mf h
 
9 and 10 Financial Analysis.ppt
9 and 10 Financial Analysis.ppt9 and 10 Financial Analysis.ppt
9 and 10 Financial Analysis.ppt
 
Ratio Analysis and financial performance
Ratio Analysis and financial performanceRatio Analysis and financial performance
Ratio Analysis and financial performance
 
Prepare a witten financial analysis. .This should include calculation.pdf
Prepare a witten financial analysis. .This should include calculation.pdfPrepare a witten financial analysis. .This should include calculation.pdf
Prepare a witten financial analysis. .This should include calculation.pdf
 
Chapter 6_Interpretation of Financial Statement
Chapter 6_Interpretation of Financial StatementChapter 6_Interpretation of Financial Statement
Chapter 6_Interpretation of Financial Statement
 
Business analysis ppt babasab patil
Business analysis ppt babasab patil Business analysis ppt babasab patil
Business analysis ppt babasab patil
 
L05 ratio analysis
L05 ratio analysisL05 ratio analysis
L05 ratio analysis
 
Ratio analysis1
Ratio analysis1Ratio analysis1
Ratio analysis1
 
Ratio Analysis By- Ravi Thakur From CMD
Ratio Analysis By- Ravi Thakur From CMD Ratio Analysis By- Ravi Thakur From CMD
Ratio Analysis By- Ravi Thakur From CMD
 
Business analysis ppt
Business analysis ppt Business analysis ppt
Business analysis ppt
 
Financial interpretations with models & formats (unit 2)
Financial interpretations with models & formats (unit 2)Financial interpretations with models & formats (unit 2)
Financial interpretations with models & formats (unit 2)
 
Financial ratios
Financial ratiosFinancial ratios
Financial ratios
 
Financial interpretations with models & formats (unit 2)
Financial interpretations with models & formats (unit 2)Financial interpretations with models & formats (unit 2)
Financial interpretations with models & formats (unit 2)
 
Financial-Analysis-and-Planning-Ratio-Analysis.pdf
Financial-Analysis-and-Planning-Ratio-Analysis.pdfFinancial-Analysis-and-Planning-Ratio-Analysis.pdf
Financial-Analysis-and-Planning-Ratio-Analysis.pdf
 
Ratio AnalysisFinancial ratios can be used to examine various as.docx
Ratio AnalysisFinancial ratios can be used to examine various as.docxRatio AnalysisFinancial ratios can be used to examine various as.docx
Ratio AnalysisFinancial ratios can be used to examine various as.docx
 
Financial statement analysis
Financial statement analysisFinancial statement analysis
Financial statement analysis
 
Steps to basic_company_financial_analysis
Steps to basic_company_financial_analysisSteps to basic_company_financial_analysis
Steps to basic_company_financial_analysis
 
frsa_MINI PROJECT.ppt
frsa_MINI PROJECT.pptfrsa_MINI PROJECT.ppt
frsa_MINI PROJECT.ppt
 

More from spandane

691) Click.. Article aims to outline the process for taking various decisions...
691) Click.. Article aims to outline the process for taking various decisions...691) Click.. Article aims to outline the process for taking various decisions...
691) Click.. Article aims to outline the process for taking various decisions...spandane
 
777) Right and Wrong..Stray thoughts on various matters such as life perspect...
777) Right and Wrong..Stray thoughts on various matters such as life perspect...777) Right and Wrong..Stray thoughts on various matters such as life perspect...
777) Right and Wrong..Stray thoughts on various matters such as life perspect...spandane
 
92) Clapping Therapy, 200-400 claps every day.pdf
92) Clapping Therapy, 200-400 claps every day.pdf92) Clapping Therapy, 200-400 claps every day.pdf
92) Clapping Therapy, 200-400 claps every day.pdfspandane
 
179) Tichi Goshta, माधुरी शानबाग / नव चैतन्य प्रकाशन.pdf
179) Tichi Goshta, माधुरी शानबाग / नव चैतन्य प्रकाशन.pdf179) Tichi Goshta, माधुरी शानबाग / नव चैतन्य प्रकाशन.pdf
179) Tichi Goshta, माधुरी शानबाग / नव चैतन्य प्रकाशन.pdfspandane
 
723) CAR Article is about how to face life by following simple principles.pdf
723) CAR Article is about how to face life by following simple principles.pdf723) CAR Article is about how to face life by following simple principles.pdf
723) CAR Article is about how to face life by following simple principles.pdfspandane
 
712) Khant - Regret, Article about missing friends and my life.pdf
712) Khant - Regret, Article about missing friends and my life.pdf712) Khant - Regret, Article about missing friends and my life.pdf
712) Khant - Regret, Article about missing friends and my life.pdfspandane
 
797) Olakhane , ओळखणे, information, knowledge, recognition .pdf
797) Olakhane , ओळखणे, information, knowledge, recognition .pdf797) Olakhane , ओळखणे, information, knowledge, recognition .pdf
797) Olakhane , ओळखणे, information, knowledge, recognition .pdfspandane
 
19) Senior Citizen, major, old age, exit.pdf
19) Senior Citizen, major, old age, exit.pdf19) Senior Citizen, major, old age, exit.pdf
19) Senior Citizen, major, old age, exit.pdfspandane
 
179) Tichi Goshta, society, women, moral.pdf
179) Tichi Goshta, society, women, moral.pdf179) Tichi Goshta, society, women, moral.pdf
179) Tichi Goshta, society, women, moral.pdfspandane
 
782) Suvichar - Management, random thoughts, reflections.pdf
782) Suvichar  - Management, random thoughts, reflections.pdf782) Suvichar  - Management, random thoughts, reflections.pdf
782) Suvichar - Management, random thoughts, reflections.pdfspandane
 
802) Mental Thoughts. mind, vibration.pdf
802) Mental Thoughts. mind, vibration.pdf802) Mental Thoughts. mind, vibration.pdf
802) Mental Thoughts. mind, vibration.pdfspandane
 
92) Clapping Therapy, health, therapy, well beingpdf
92) Clapping Therapy, health, therapy, well beingpdf92) Clapping Therapy, health, therapy, well beingpdf
92) Clapping Therapy, health, therapy, well beingpdfspandane
 
23) Nocturia. Is it a kidney disease or heart distdf
23) Nocturia. Is it a kidney disease or heart distdf23) Nocturia. Is it a kidney disease or heart distdf
23) Nocturia. Is it a kidney disease or heart distdfspandane
 
Karneeti Part 528 - Personal Budget before National Budget - By CA Umesh Shar...
Karneeti Part 528 - Personal Budget before National Budget - By CA Umesh Shar...Karneeti Part 528 - Personal Budget before National Budget - By CA Umesh Shar...
Karneeti Part 528 - Personal Budget before National Budget - By CA Umesh Shar...spandane
 
Crisis Management.ppt
Crisis Management.pptCrisis Management.ppt
Crisis Management.pptspandane
 
Event Management of Marriage.pdf
Event Management of Marriage.pdfEvent Management of Marriage.pdf
Event Management of Marriage.pdfspandane
 
764) My Hero.pdf
764) My Hero.pdf764) My Hero.pdf
764) My Hero.pdfspandane
 
Karneeti Part 500 - 500 & 50th GST - By CA Umesh Sharma.pdf
Karneeti Part 500 - 500 & 50th GST - By CA Umesh Sharma.pdfKarneeti Part 500 - 500 & 50th GST - By CA Umesh Sharma.pdf
Karneeti Part 500 - 500 & 50th GST - By CA Umesh Sharma.pdfspandane
 
16-07-2023 तेजीचा वारू चौखुर .pdf
16-07-2023 तेजीचा वारू चौखुर .pdf16-07-2023 तेजीचा वारू चौखुर .pdf
16-07-2023 तेजीचा वारू चौखुर .pdfspandane
 
57-Happy man'sshirt.pdf
57-Happy man'sshirt.pdf57-Happy man'sshirt.pdf
57-Happy man'sshirt.pdfspandane
 

More from spandane (20)

691) Click.. Article aims to outline the process for taking various decisions...
691) Click.. Article aims to outline the process for taking various decisions...691) Click.. Article aims to outline the process for taking various decisions...
691) Click.. Article aims to outline the process for taking various decisions...
 
777) Right and Wrong..Stray thoughts on various matters such as life perspect...
777) Right and Wrong..Stray thoughts on various matters such as life perspect...777) Right and Wrong..Stray thoughts on various matters such as life perspect...
777) Right and Wrong..Stray thoughts on various matters such as life perspect...
 
92) Clapping Therapy, 200-400 claps every day.pdf
92) Clapping Therapy, 200-400 claps every day.pdf92) Clapping Therapy, 200-400 claps every day.pdf
92) Clapping Therapy, 200-400 claps every day.pdf
 
179) Tichi Goshta, माधुरी शानबाग / नव चैतन्य प्रकाशन.pdf
179) Tichi Goshta, माधुरी शानबाग / नव चैतन्य प्रकाशन.pdf179) Tichi Goshta, माधुरी शानबाग / नव चैतन्य प्रकाशन.pdf
179) Tichi Goshta, माधुरी शानबाग / नव चैतन्य प्रकाशन.pdf
 
723) CAR Article is about how to face life by following simple principles.pdf
723) CAR Article is about how to face life by following simple principles.pdf723) CAR Article is about how to face life by following simple principles.pdf
723) CAR Article is about how to face life by following simple principles.pdf
 
712) Khant - Regret, Article about missing friends and my life.pdf
712) Khant - Regret, Article about missing friends and my life.pdf712) Khant - Regret, Article about missing friends and my life.pdf
712) Khant - Regret, Article about missing friends and my life.pdf
 
797) Olakhane , ओळखणे, information, knowledge, recognition .pdf
797) Olakhane , ओळखणे, information, knowledge, recognition .pdf797) Olakhane , ओळखणे, information, knowledge, recognition .pdf
797) Olakhane , ओळखणे, information, knowledge, recognition .pdf
 
19) Senior Citizen, major, old age, exit.pdf
19) Senior Citizen, major, old age, exit.pdf19) Senior Citizen, major, old age, exit.pdf
19) Senior Citizen, major, old age, exit.pdf
 
179) Tichi Goshta, society, women, moral.pdf
179) Tichi Goshta, society, women, moral.pdf179) Tichi Goshta, society, women, moral.pdf
179) Tichi Goshta, society, women, moral.pdf
 
782) Suvichar - Management, random thoughts, reflections.pdf
782) Suvichar  - Management, random thoughts, reflections.pdf782) Suvichar  - Management, random thoughts, reflections.pdf
782) Suvichar - Management, random thoughts, reflections.pdf
 
802) Mental Thoughts. mind, vibration.pdf
802) Mental Thoughts. mind, vibration.pdf802) Mental Thoughts. mind, vibration.pdf
802) Mental Thoughts. mind, vibration.pdf
 
92) Clapping Therapy, health, therapy, well beingpdf
92) Clapping Therapy, health, therapy, well beingpdf92) Clapping Therapy, health, therapy, well beingpdf
92) Clapping Therapy, health, therapy, well beingpdf
 
23) Nocturia. Is it a kidney disease or heart distdf
23) Nocturia. Is it a kidney disease or heart distdf23) Nocturia. Is it a kidney disease or heart distdf
23) Nocturia. Is it a kidney disease or heart distdf
 
Karneeti Part 528 - Personal Budget before National Budget - By CA Umesh Shar...
Karneeti Part 528 - Personal Budget before National Budget - By CA Umesh Shar...Karneeti Part 528 - Personal Budget before National Budget - By CA Umesh Shar...
Karneeti Part 528 - Personal Budget before National Budget - By CA Umesh Shar...
 
Crisis Management.ppt
Crisis Management.pptCrisis Management.ppt
Crisis Management.ppt
 
Event Management of Marriage.pdf
Event Management of Marriage.pdfEvent Management of Marriage.pdf
Event Management of Marriage.pdf
 
764) My Hero.pdf
764) My Hero.pdf764) My Hero.pdf
764) My Hero.pdf
 
Karneeti Part 500 - 500 & 50th GST - By CA Umesh Sharma.pdf
Karneeti Part 500 - 500 & 50th GST - By CA Umesh Sharma.pdfKarneeti Part 500 - 500 & 50th GST - By CA Umesh Sharma.pdf
Karneeti Part 500 - 500 & 50th GST - By CA Umesh Sharma.pdf
 
16-07-2023 तेजीचा वारू चौखुर .pdf
16-07-2023 तेजीचा वारू चौखुर .pdf16-07-2023 तेजीचा वारू चौखुर .pdf
16-07-2023 तेजीचा वारू चौखुर .pdf
 
57-Happy man'sshirt.pdf
57-Happy man'sshirt.pdf57-Happy man'sshirt.pdf
57-Happy man'sshirt.pdf
 

Recently uploaded

VIP Kolkata Call Girl Rajarhat 👉 8250192130 Available With Room
VIP Kolkata Call Girl Rajarhat 👉 8250192130  Available With RoomVIP Kolkata Call Girl Rajarhat 👉 8250192130  Available With Room
VIP Kolkata Call Girl Rajarhat 👉 8250192130 Available With Roomdivyansh0kumar0
 
Unlocking Productivity and Personal Growth through the Importance-Urgency Matrix
Unlocking Productivity and Personal Growth through the Importance-Urgency MatrixUnlocking Productivity and Personal Growth through the Importance-Urgency Matrix
Unlocking Productivity and Personal Growth through the Importance-Urgency MatrixCIToolkit
 
ANIn Gurugram April 2024 |Can Agile and AI work together? by Pramodkumar Shri...
ANIn Gurugram April 2024 |Can Agile and AI work together? by Pramodkumar Shri...ANIn Gurugram April 2024 |Can Agile and AI work together? by Pramodkumar Shri...
ANIn Gurugram April 2024 |Can Agile and AI work together? by Pramodkumar Shri...AgileNetwork
 
Beyond the Five Whys: Exploring the Hierarchical Causes with the Why-Why Diagram
Beyond the Five Whys: Exploring the Hierarchical Causes with the Why-Why DiagramBeyond the Five Whys: Exploring the Hierarchical Causes with the Why-Why Diagram
Beyond the Five Whys: Exploring the Hierarchical Causes with the Why-Why DiagramCIToolkit
 
Measuring True Process Yield using Robust Yield Metrics
Measuring True Process Yield using Robust Yield MetricsMeasuring True Process Yield using Robust Yield Metrics
Measuring True Process Yield using Robust Yield MetricsCIToolkit
 
Simplifying Complexity: How the Four-Field Matrix Reshapes Thinking
Simplifying Complexity: How the Four-Field Matrix Reshapes ThinkingSimplifying Complexity: How the Four-Field Matrix Reshapes Thinking
Simplifying Complexity: How the Four-Field Matrix Reshapes ThinkingCIToolkit
 
Farmer Representative Organization in Lucknow | Rashtriya Kisan Manch
Farmer Representative Organization in Lucknow | Rashtriya Kisan ManchFarmer Representative Organization in Lucknow | Rashtriya Kisan Manch
Farmer Representative Organization in Lucknow | Rashtriya Kisan ManchRashtriya Kisan Manch
 
LPC Operations Review PowerPoint | Operations Review
LPC Operations Review PowerPoint | Operations ReviewLPC Operations Review PowerPoint | Operations Review
LPC Operations Review PowerPoint | Operations Reviewthomas851723
 
Introduction to LPC - Facility Design And Re-Engineering
Introduction to LPC - Facility Design And Re-EngineeringIntroduction to LPC - Facility Design And Re-Engineering
Introduction to LPC - Facility Design And Re-Engineeringthomas851723
 
Fifteenth Finance Commission Presentation
Fifteenth Finance Commission PresentationFifteenth Finance Commission Presentation
Fifteenth Finance Commission Presentationmintusiprd
 
Pooja Mehta 9167673311, Trusted Call Girls In NAVI MUMBAI Cash On Payment , V...
Pooja Mehta 9167673311, Trusted Call Girls In NAVI MUMBAI Cash On Payment , V...Pooja Mehta 9167673311, Trusted Call Girls In NAVI MUMBAI Cash On Payment , V...
Pooja Mehta 9167673311, Trusted Call Girls In NAVI MUMBAI Cash On Payment , V...Pooja Nehwal
 
LPC Warehouse Management System For Clients In The Business Sector
LPC Warehouse Management System For Clients In The Business SectorLPC Warehouse Management System For Clients In The Business Sector
LPC Warehouse Management System For Clients In The Business Sectorthomas851723
 
Call Us🔝⇛+91-97111🔝47426 Call In girls Munirka (DELHI)
Call Us🔝⇛+91-97111🔝47426 Call In girls Munirka (DELHI)Call Us🔝⇛+91-97111🔝47426 Call In girls Munirka (DELHI)
Call Us🔝⇛+91-97111🔝47426 Call In girls Munirka (DELHI)jennyeacort
 
原版1:1复刻密西西比大学毕业证Mississippi毕业证留信学历认证
原版1:1复刻密西西比大学毕业证Mississippi毕业证留信学历认证原版1:1复刻密西西比大学毕业证Mississippi毕业证留信学历认证
原版1:1复刻密西西比大学毕业证Mississippi毕业证留信学历认证jdkhjh
 
Reflecting, turning experience into insight
Reflecting, turning experience into insightReflecting, turning experience into insight
Reflecting, turning experience into insightWayne Abrahams
 
Board Diversity Initiaive Launch Presentation
Board Diversity Initiaive Launch PresentationBoard Diversity Initiaive Launch Presentation
Board Diversity Initiaive Launch Presentationcraig524401
 

Recently uploaded (17)

VIP Kolkata Call Girl Rajarhat 👉 8250192130 Available With Room
VIP Kolkata Call Girl Rajarhat 👉 8250192130  Available With RoomVIP Kolkata Call Girl Rajarhat 👉 8250192130  Available With Room
VIP Kolkata Call Girl Rajarhat 👉 8250192130 Available With Room
 
Unlocking Productivity and Personal Growth through the Importance-Urgency Matrix
Unlocking Productivity and Personal Growth through the Importance-Urgency MatrixUnlocking Productivity and Personal Growth through the Importance-Urgency Matrix
Unlocking Productivity and Personal Growth through the Importance-Urgency Matrix
 
ANIn Gurugram April 2024 |Can Agile and AI work together? by Pramodkumar Shri...
ANIn Gurugram April 2024 |Can Agile and AI work together? by Pramodkumar Shri...ANIn Gurugram April 2024 |Can Agile and AI work together? by Pramodkumar Shri...
ANIn Gurugram April 2024 |Can Agile and AI work together? by Pramodkumar Shri...
 
Beyond the Five Whys: Exploring the Hierarchical Causes with the Why-Why Diagram
Beyond the Five Whys: Exploring the Hierarchical Causes with the Why-Why DiagramBeyond the Five Whys: Exploring the Hierarchical Causes with the Why-Why Diagram
Beyond the Five Whys: Exploring the Hierarchical Causes with the Why-Why Diagram
 
Measuring True Process Yield using Robust Yield Metrics
Measuring True Process Yield using Robust Yield MetricsMeasuring True Process Yield using Robust Yield Metrics
Measuring True Process Yield using Robust Yield Metrics
 
Simplifying Complexity: How the Four-Field Matrix Reshapes Thinking
Simplifying Complexity: How the Four-Field Matrix Reshapes ThinkingSimplifying Complexity: How the Four-Field Matrix Reshapes Thinking
Simplifying Complexity: How the Four-Field Matrix Reshapes Thinking
 
Farmer Representative Organization in Lucknow | Rashtriya Kisan Manch
Farmer Representative Organization in Lucknow | Rashtriya Kisan ManchFarmer Representative Organization in Lucknow | Rashtriya Kisan Manch
Farmer Representative Organization in Lucknow | Rashtriya Kisan Manch
 
LPC Operations Review PowerPoint | Operations Review
LPC Operations Review PowerPoint | Operations ReviewLPC Operations Review PowerPoint | Operations Review
LPC Operations Review PowerPoint | Operations Review
 
Introduction to LPC - Facility Design And Re-Engineering
Introduction to LPC - Facility Design And Re-EngineeringIntroduction to LPC - Facility Design And Re-Engineering
Introduction to LPC - Facility Design And Re-Engineering
 
Fifteenth Finance Commission Presentation
Fifteenth Finance Commission PresentationFifteenth Finance Commission Presentation
Fifteenth Finance Commission Presentation
 
Pooja Mehta 9167673311, Trusted Call Girls In NAVI MUMBAI Cash On Payment , V...
Pooja Mehta 9167673311, Trusted Call Girls In NAVI MUMBAI Cash On Payment , V...Pooja Mehta 9167673311, Trusted Call Girls In NAVI MUMBAI Cash On Payment , V...
Pooja Mehta 9167673311, Trusted Call Girls In NAVI MUMBAI Cash On Payment , V...
 
LPC Warehouse Management System For Clients In The Business Sector
LPC Warehouse Management System For Clients In The Business SectorLPC Warehouse Management System For Clients In The Business Sector
LPC Warehouse Management System For Clients In The Business Sector
 
Call Us🔝⇛+91-97111🔝47426 Call In girls Munirka (DELHI)
Call Us🔝⇛+91-97111🔝47426 Call In girls Munirka (DELHI)Call Us🔝⇛+91-97111🔝47426 Call In girls Munirka (DELHI)
Call Us🔝⇛+91-97111🔝47426 Call In girls Munirka (DELHI)
 
原版1:1复刻密西西比大学毕业证Mississippi毕业证留信学历认证
原版1:1复刻密西西比大学毕业证Mississippi毕业证留信学历认证原版1:1复刻密西西比大学毕业证Mississippi毕业证留信学历认证
原版1:1复刻密西西比大学毕业证Mississippi毕业证留信学历认证
 
Reflecting, turning experience into insight
Reflecting, turning experience into insightReflecting, turning experience into insight
Reflecting, turning experience into insight
 
Board Diversity Initiaive Launch Presentation
Board Diversity Initiaive Launch PresentationBoard Diversity Initiaive Launch Presentation
Board Diversity Initiaive Launch Presentation
 
sauth delhi call girls in Defence Colony🔝 9953056974 🔝 escort Service
sauth delhi call girls in Defence Colony🔝 9953056974 🔝 escort Servicesauth delhi call girls in Defence Colony🔝 9953056974 🔝 escort Service
sauth delhi call girls in Defence Colony🔝 9953056974 🔝 escort Service
 

05 financial concepts

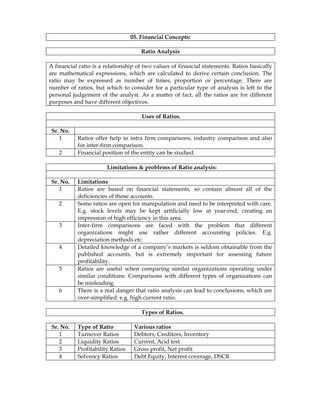
  • 1. 05. Financial Concepts: Ratio Analysis A financial ratio is a relationship of two values of financial statements. Ratios basically are mathematical expressions, which are calculated to derive certain conclusion. The ratio may be expressed as number of times, proportion or percentage. There are number of ratios, but which to consider for a particular type of analysis is left to the personal judgement of the analyst. As a matter of fact, all the ratios are for different purposes and have different objectives. Uses of Ratios. Sr. No. 1 Ratios offer help in intra firm comparisons, industry comparison and also for inter-firm comparison. 2 Financial position of the entity can be studied. Limitations & problems of Ratio analysis: Sr. No. Limitations 1 Ratios are based on financial statements, so contain almost all of the deficiencies of those accounts. 2 Some ratios are open for manipulation and need to be interpreted with care. E.g. stock levels may be kept artificially low at year-end, creating an impression of high efficiency in this area. 3 Inter-firm comparisons are faced with the problem that different organizations might use rather different accounting policies. E.g. depreciation methods etc. 4 Detailed knowledge of a company’s markets is seldom obtainable from the published accounts, but is extremely important for assessing future profitability. 5 Ratios are useful when comparing similar organizations operating under similar conditions. Comparisons with different types of organizations can be misleading. 6 There is a real danger that ratio analysis can lead to conclusions, which are over-simplified. e.g. high current ratio. Types of Ratios. Sr. No. Type of Ratio Various ratios 1 Turnover Ratios Debtors, Creditors, Inventory 2 Liquidity Ratios Current, Acid test 3 Profitability Ratios Gross profit, Net profit 4 Solvency Ratios Debt Equity, Interest coverage, DSCR
  • 2. 2 Sr. No. Ratios Formula / Interpretation 1.0 Turnover Ratios: 1.1 Debtors Turnover Ratio Average Debtors x 365 divided by Sales. Average Collection period. 1.2 Creditors Turnover Ratio. Average Creditors x 365 divided by Credit purchases. Average payment period. 1.3 Inventory Turnover Ratio. Average inventory x 365 divided by material cost Holding period of stock Sr. No. Ratios Formula / Interpretation 2.0 Liquidity Ratios: 2.1 Current Ratio Current Assets / Current Liabilities. 2.2 Acid Test Ratio Quick Assets / Quick liabilities. Sr. No. Ratios Formula / Interpretation 3.0 Profitability Ratios: 3.1 Gross Profit Ratio Gross profit / Net sales x 100 3.2 Net Profit Ratio Net profit / Net sales x 100 3.3 Material cost ratio Material cost / Net sales x 100 3.4 Expenses Ratios Expenses / Net sales x 100 3.5 Return on Capital PBIT / Capital employed x 100 3.6 Return on Proprietor’s Funds PAT / Proprietor’s Funds Sr. No. Ratios Formula / Interpretation 4.0 Solvency Ratios: 4.1 Debt Equity Ratio Total outside debt / Equity or Shareholders’ funds. 4.2 Proprietary Ratio Proprietor’s funds /Total Assets x 100 4.3 Interest coverage Ratio PBIT / Fixed interest charges 4.4 Debt coverage Ratio PATID / (Interest + Repayment installments) Notes Ratio Components 1 Average debtors Opening debtors + Closing debtors divided by 2 2 Current assets Stock + debtors + cash & bank balance + loans & advances + Prepaid expenses 3 Current liabilities Creditors + BP + O/S expenses + IT payable + Dividend payable + Bank overdraft ( not if permanent) 4 Quick Assets Current Assets less ( Stock + prepaid expenses) 5 Quick Liabilities. Current liabilities less Bank overdraft 6 Gross Profit Sales less material cost.
  • 3. 3 7 Net Profit Sales less all expenses + any other income. 8 Debt Long term loans + debentures + Bank overdraft 9 Equity Equity share capital + Preference share capital +Free Reserves – (Accumulated losses + deferred revenue expenditure) = Net worth = Proprietor’s funds. 10 PBIT Profit before Tax + interest. 11 PATID Profit after Tax + Interest + Depreciation. = Annual cash flow. 12 PAT Profit less I. Tax. 13 Capital employed Net Fixed Assets + Current assets less Current liabilities. Interpretation of various Ratios: Sr. no. Ratio 1.0 Turnover Ratios: 1.1 Debtors Turnover Ratio: This ratio measures the average number of day’s credit given to debtors. It helps to assess the efficiency of the debt collection department. Debt collection period should be kept as low as possible, consistent with maintaining customer goodwill and market trend. 1.2 Creditors Turnover Ratio: This ratio measures the average number of days credit is exploited from suppliers. Credit given by suppliers depends on various factors such as demand & supply position of material, industry trends, competition etc. 1.3 Inventory Turnover Ratio: This ratio measures the average number of days for which stock is held. It helps to assess the efficiency of stock utilization. Various factors affect the stock level held by the organization such as product, production-seasonal or otherwise, demand pattern, competition, funds availability etc. 2.0 Liquidity Ratios: 2.1 Current Ratio: This ratio is concerned with the assessment of an organization's ability to meet its short-term obligations. The ratio must be high enough for safety. However, high current assets do not normally lead to high profits in themselves, so the usual trade-off between risk and return exists. Industry norm is 2:1 2.2 Acid Test Ratio: This ratio is also concerned with short-term liquidity. In a sense it is more appropriate measure since liquid assets represent the source of funds from which current liabilities will probably be met. Industry norm is 1:1 3.0 Profitability Ratios: 3.1 Gross Profit Ratio: GP / Margin on sales 3.2 Net Profit Ratio: Net profit on sales. It indicates organization's ability to generate profits from sales. 3.3 Material cost ratio: Material cost to sales 3.4 Expenses Ratios: Expenses to sales. 3.5 Return on Capital: This ratio is expressed as a percentage. Generally higher the return the better.
  • 4. 4 3.6 Return on Proprietor’s Funds: This ratio provides a measure of the percentage return on the investment made by the owners. 4.0 Solvency Ratios: 4.1 Debt Equity Ratio: This ratio is concerned with establishing the relationship between external and internal long-term financing. The use of long-term debt in the capital structure has both advantages and disadvantages, and in practice the level of debt actually existing is the result of a balancing process. The main advantage of debt is that it provides an opportunity for greater returns to shareholders. Industry norm is 2:1 4.2 Proprietary Ratio: It measures the owner's contribution of funds. 4.3 Interest coverage Ratio: This ratio measures the safety available to Bank for recovery of interest. Industry norm is 2:1 4.4 Debt coverage Ratio: This ratio measures the safety available to Bank for recovery of interest & loan installment. Industry norm is 2.5 : 1 Other Ratios: 6.1 Employees Ratios: Sales per employee: Sales / staff strength Sales generation: Sales / salaries & wages Profit per employee: PBT / staff strength Profit generation: PBT / salaries & wages Remuneration level: Salaries & wages / staff strength 6.2 Shareholder's Ratios: Earnings per share: PAT less Pref. Dividend / number of shares Dividend per share: Dividend / Number of shares Dividend pay out ratio: Dividend / Earnings per share Dividend yield: Dividend per share / Market price per share Book value per share: Ordinary shareholder's equity / number of shares Price-earnings ratio: Market price per share / Earnings per share.
  • 5. 5 Funds Flow Statement One of the most fundamental objectives of business is to make a profit. Long run survival requires that the business must be able to deal with any possible liquidity problems which arise in the short term. Basically any business must be concerned with making a profit and maintaining a solvent financial position. Objectives of Funds Flow statement: 1. An analysis of the flow of liquid funds can be very useful in making decisions concerning liquidity. 2. A full understanding of a business's affairs requires the identification of the changes or movements in assets, liabilities and capital for a year, and the resultant effect on liquid resources. A profit & loss account or balance sheet does not specifically disclose this information. 3. To show the manner in which the operations have been financed, and how the financial resources have been used. 4. They provide useful guide to creditors & lenders. 5. Various ways to improve the net working capital position can be decided. 6. It focuses attention on resources available for capital investment. 7. It is useful in deciding how fixed assets should be financed. 8. It is useful in planning the retirement of debt. It is now necessary to understand the Balance Sheet in a different way. E.g. Long term and short term Funds and its application. Liabilities Assets Long Term Long Term Equity Share Capital Pref. Share Capital Reserves & Surplus Debentures Term Loan Long term unsecured loans Fixed Assets Investments
  • 6. 6 Short Term Short Term Bank CC Creditors Provisions Stock Debtors Cash & Bank balances Loans & Advances Ideally Funds Flow statement should reveal transfer of Long Term Funds to Short Term Use. If Short-Term Funds are transferred to Long Term Use, it will indicate that Bank's funds have been diverted for Long Term Use. This is not the healthy financial practice, as the firm will always face the liquidity crises. The effect of increase / decrease in current assets and current liabilities on working capital is shown below: 1. Working capital means difference between current assets and current liabilities. 2. Increase in current assets leads to increase in working capital. 3. Decrease in current assets leads to decrease in working capital. 4. Increase in current liabilities leads to decrease in working capital. 5. Decrease in current liabilities leads to increase in working capital. The various stages in preparing Funds Flow statement are listed below. 1. To prepare statement of increase / decrease in Balance sheet figures. 2. To prepare statement of changes in working capital statement. 3. To prepare Fund Flow Statement.
  • 7. 7 Cost of Capital Rs’000 % Before Tax After Tax Weighted Avg. Cost % % % 1 2 3 4 5=4 Less 30% 6=3x5 Capital 6000 30 20.0 6.00 Loans 14000 70 15 10.5 7.35 Total 20000 100 13.35 Before Tax = 13.35 divided by 0.70 = 19.07 % (IT @ 30 %) Rs’000 PBIT 19.07 % of 20000 3814 Less: Interest 15 % on 14000 2100 PBT 1714 Less: Income Tax 30 % on 17.14 514 PAT 1200 Dividend 20 % on 6000 1200 Retained earnings -------
  • 8. 8 Internal Generation: PAT +Depreciation Balance Sheet 31-03-2008 Liabilities 31-03-2009 31-03-2008 Assets 31-03-2009 2000 Capital 2000 1000 Machinery 900 ----- Profit 400 ---- Debtors --- 1000 Bank bal. 1500 2000 Total 2400 2000 Total 2400 Profit & Loss A/C 31-03-2008 Expenditure 31-03-2009 31-03-2008 Income 31-03-2009 ------ Purchases 800 ----- Sales 1500 ------ Expenses 200 ------- Depreciation 100 ----- Profit 400 ----- Total 1500 ------ Total 1500 Bank A/C Capital 2000 Machinery 1000 Balance as on 31-03-2008 1000 Total 2000 Total 2000 Opening balance 1000 Purchases 800 Debtors 1500 Expenses 200 Balance as on 31-03-2009 1500 Total 2500 Total 2500 Note: Creditors & Debtors ---Nil Funds Flow Statement for the year 2008-09 Profit 400 Increase in Bank balance 500 Add: Depreciation 100 Internal Generation 500 Total 500 Total 500 Note: Internal Generation = PAT +Depreciation. In other words cash is generated in the business to the extent of Internal Generation. This example was compiled to demonstrate this fact. In actual situation this surplus cash gets utilized for addition to Fixed Assets, increase in working capital, repayment of loans etc.
  • 9. 9 Break Even Analysis Introduction Break-even analysis is used to plan the profit & production. Break-even analysis evaluates and compares the fixed costs and variable costs. This is no profit or no loss situation. Use of Break even analysis To study the effect of CVP ratio. To know the effect of changes in sales mix. To determine the volume of sales to earn targeted profits. To decide to enhance the production of profitable products or to reduce /discontinue the production of low profitable or loss making products. Assumptions on Break-even point. The following assumptions are such which are true and valid in certain set of circumstances up to a certain level. All costs are divisible into fixed and variable. All fixed costs remain constant at all levels of output within the installed capacity. The variable costs vary along with production. The selling price is assumed to be constant. The volume of production influences the cost. There is synchronization between production and sales, which would help deciding the break-even point. Break even point The break-even point may be termed as that point of sales volume at which the total income is equal to total costs. It is a point of sale and production where there is no profit no loss. BEP can be decided in terms of units and as well as in monetary terms. Any production or sales below this point results into loss or any production or sales beyond this, yields profit.
  • 10. 10 Definitions Variable Costs: (Direct materials, direct labor and variable overheads) will be incurred in direct proportion to the level of production. Fixed Costs: Most overheads are time-based and remain constant, or fixed, regardless of the level of production. Total Costs: Total costs at any level pf production are obtained by adding the fixed costs to the variable costs. Formula of BEP BEP in units = Total fixed costs --------------------------------------------- Sales price less variable cost per unit = Total fixed costs divided by contribution per unit. Formula of BEP BEP in Sales value= Fixed costs x Sales --------------------------- Sales Less Variable cost Example Sales 6000 units Sales price per unit Rs. 60=00 Variable cost per unit Rs.40=00 Fixed costs Rs. 40000=00
  • 11. 11 BEP in units Fixed costs Rs.40000=00 Contribution per unit Rs. 20=00 (Rs.60=00 less Rs.40=00) BEP in units 40000 divided by 20 = 2000 units. 2000 x Rs. 60=00 = Rs. 120,000 BEP in Sales Value Fixed costs Rs. 40000=00 Sales Rs. 360,000=00 Variable costs Rs. 240,000=00 BEP in sales value 40000 x 360,000 divided by 120,000=Rs.120000/- Margin of safety Margin of safety = Sales less Breakeven Sales. MOS=6000 – 2000 = 4000 / 66.7 % Conclusion: Even if Sales decrease by 66.7 %, unit will not incur loss. Conclusion BEP Analysis will help the Banker in appraisal of actual / projected performance of the borrower. It also acts as sensitivity analysis tool to judge the projected performance. It will play supporting role to DSCR.
  • 12. 12