Downloaded 845 times
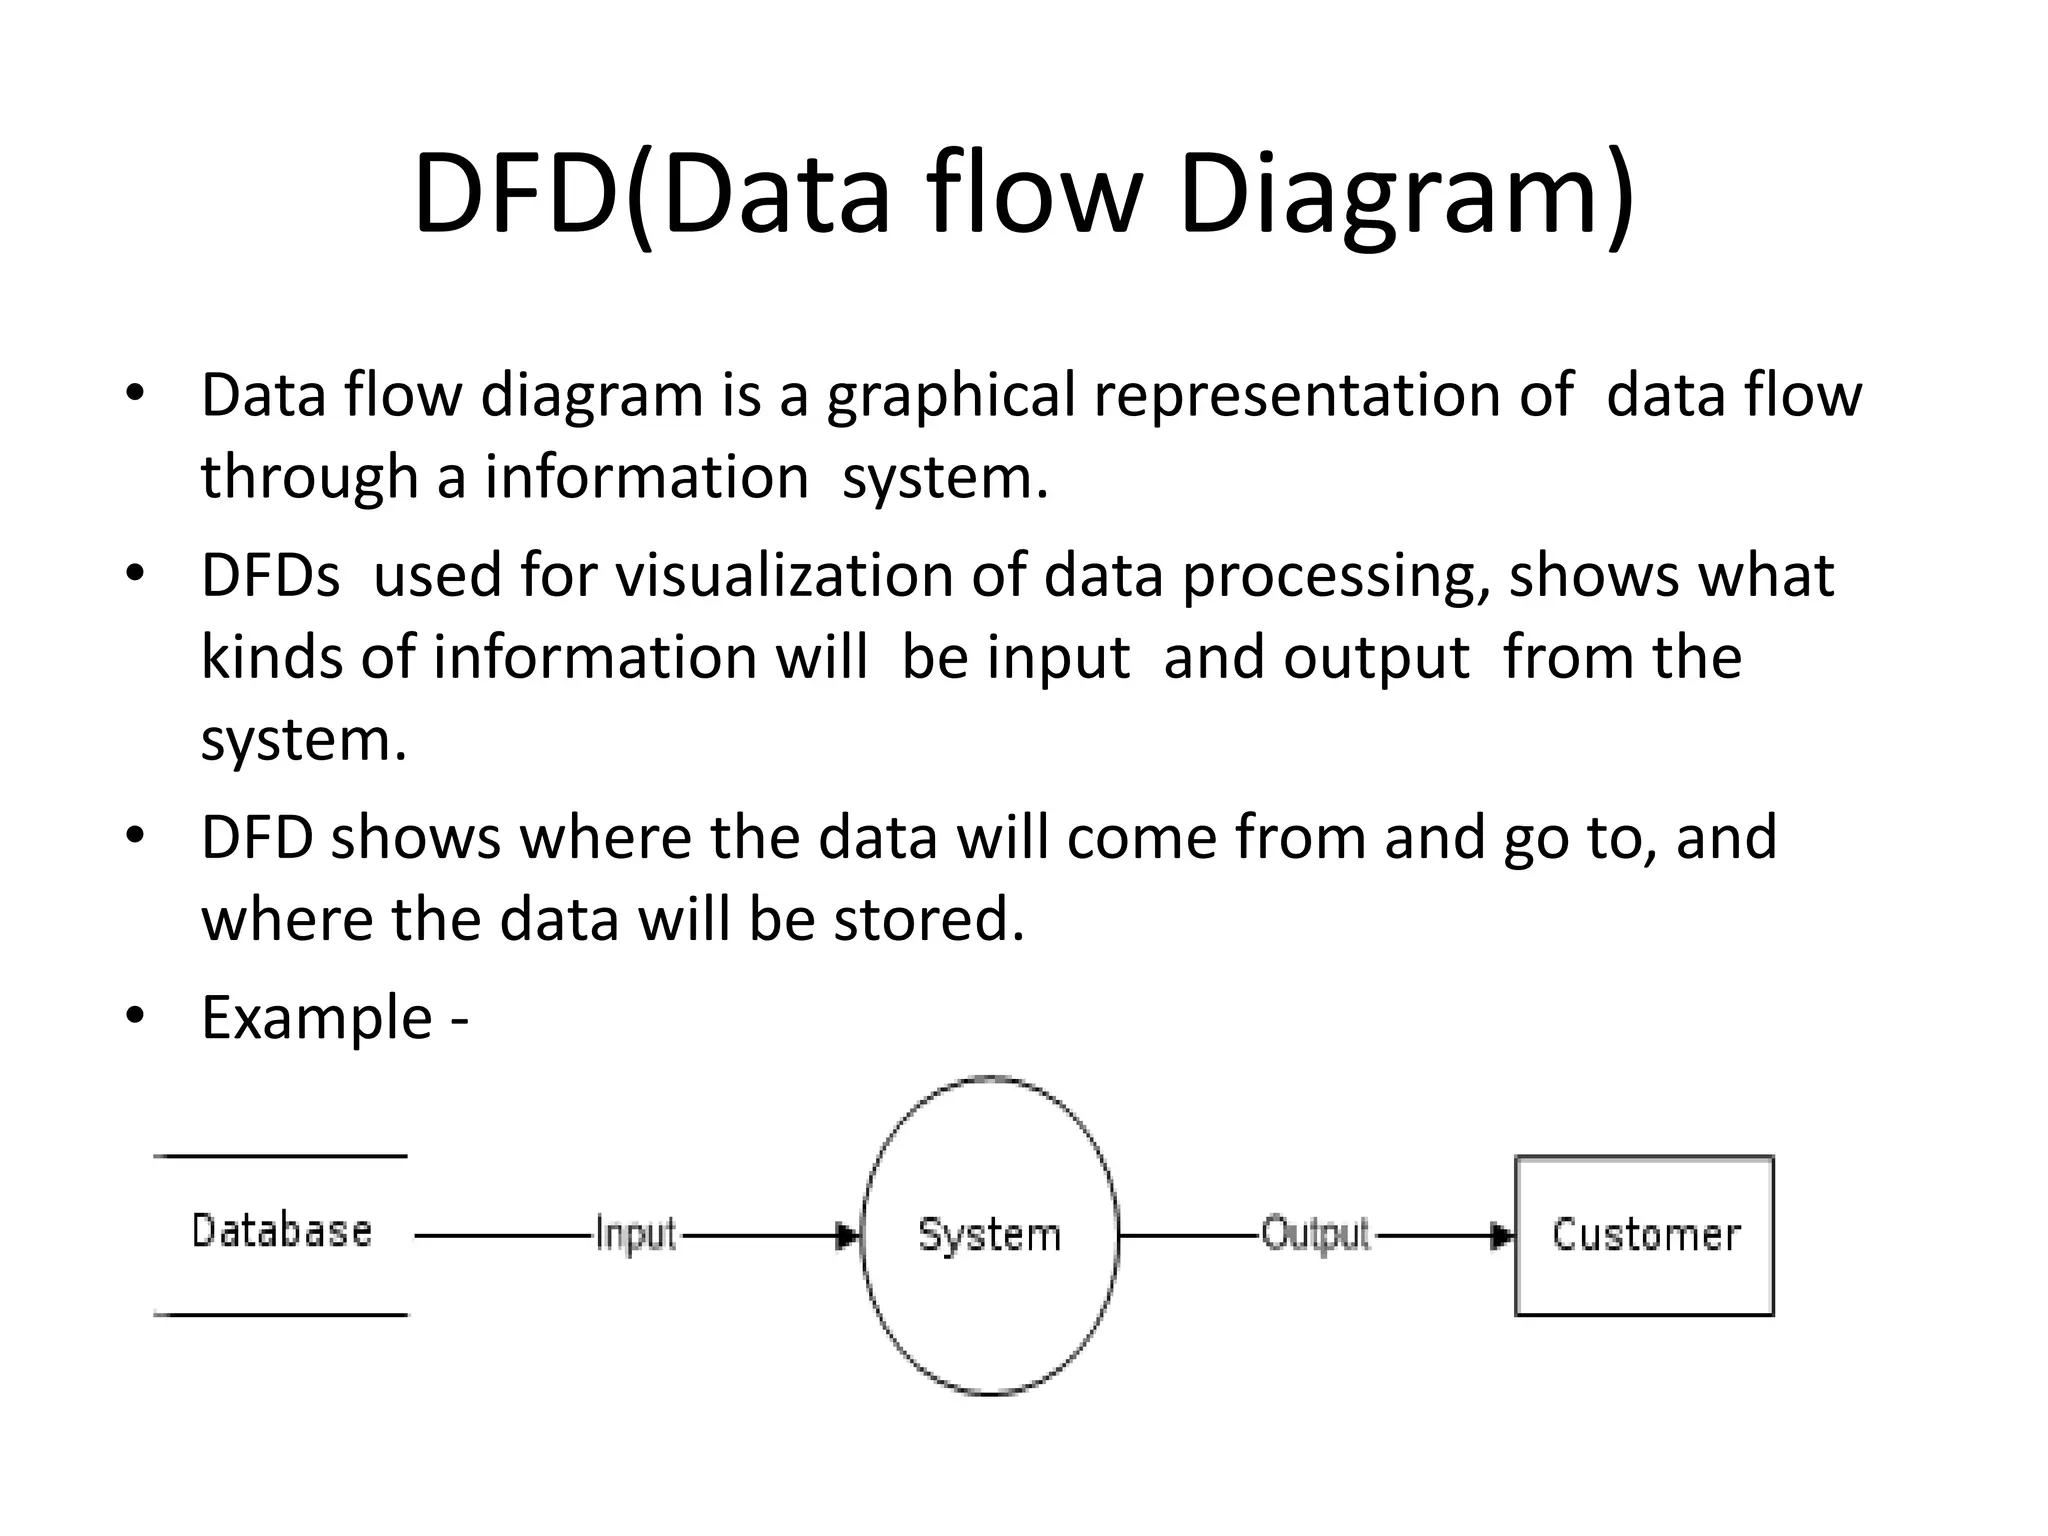


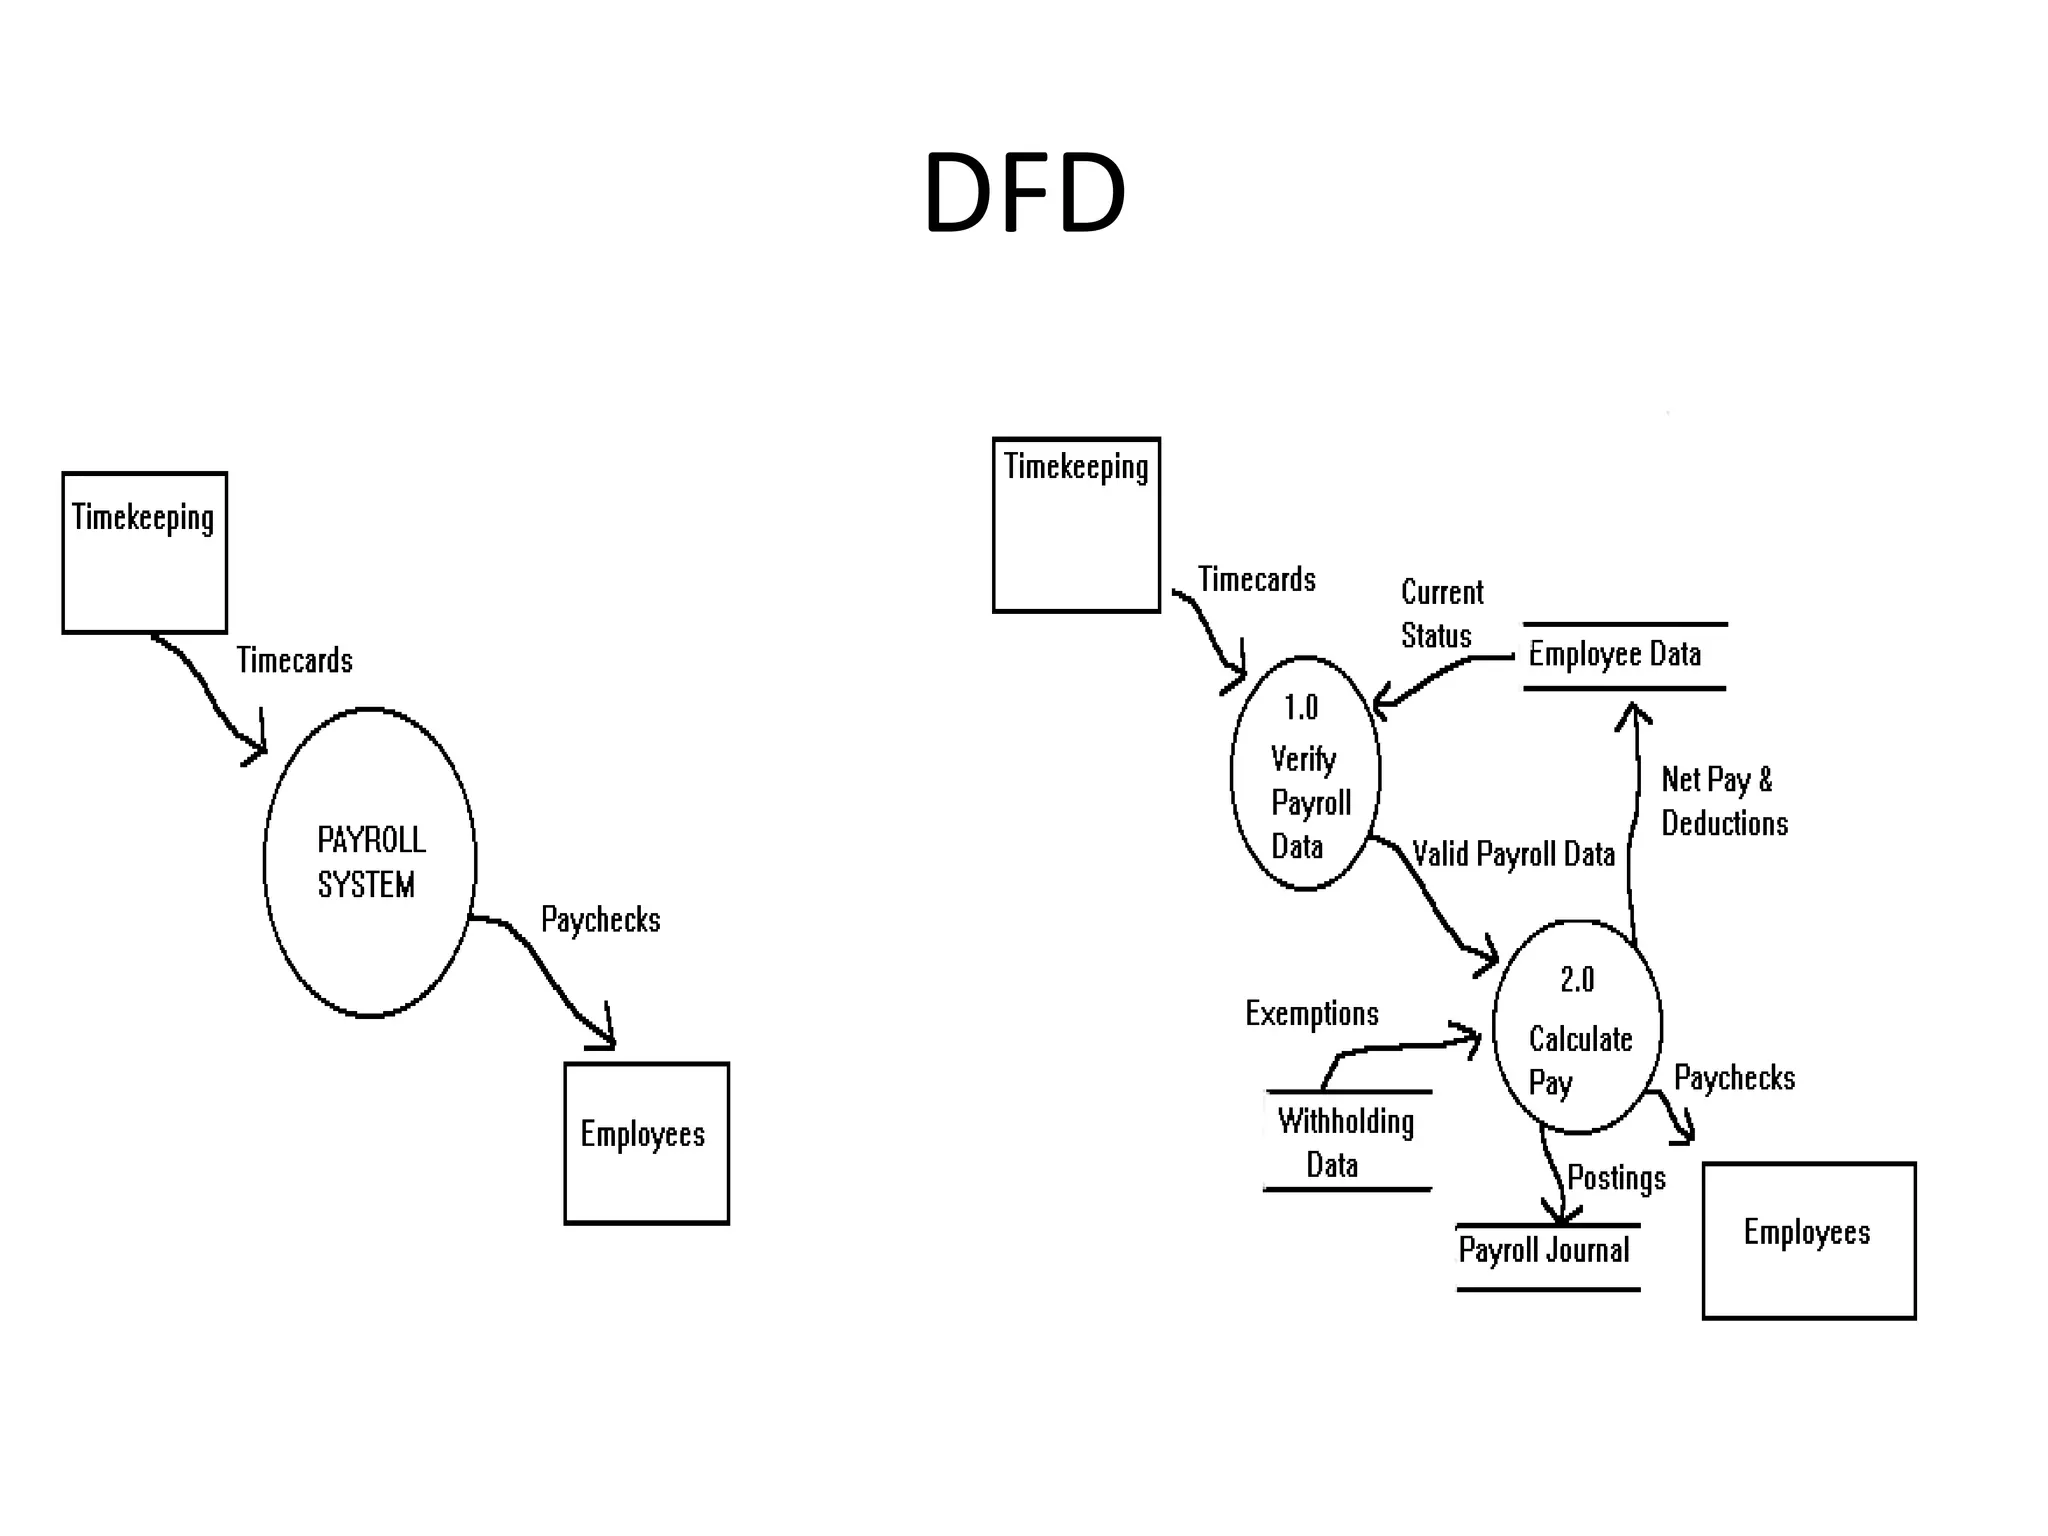

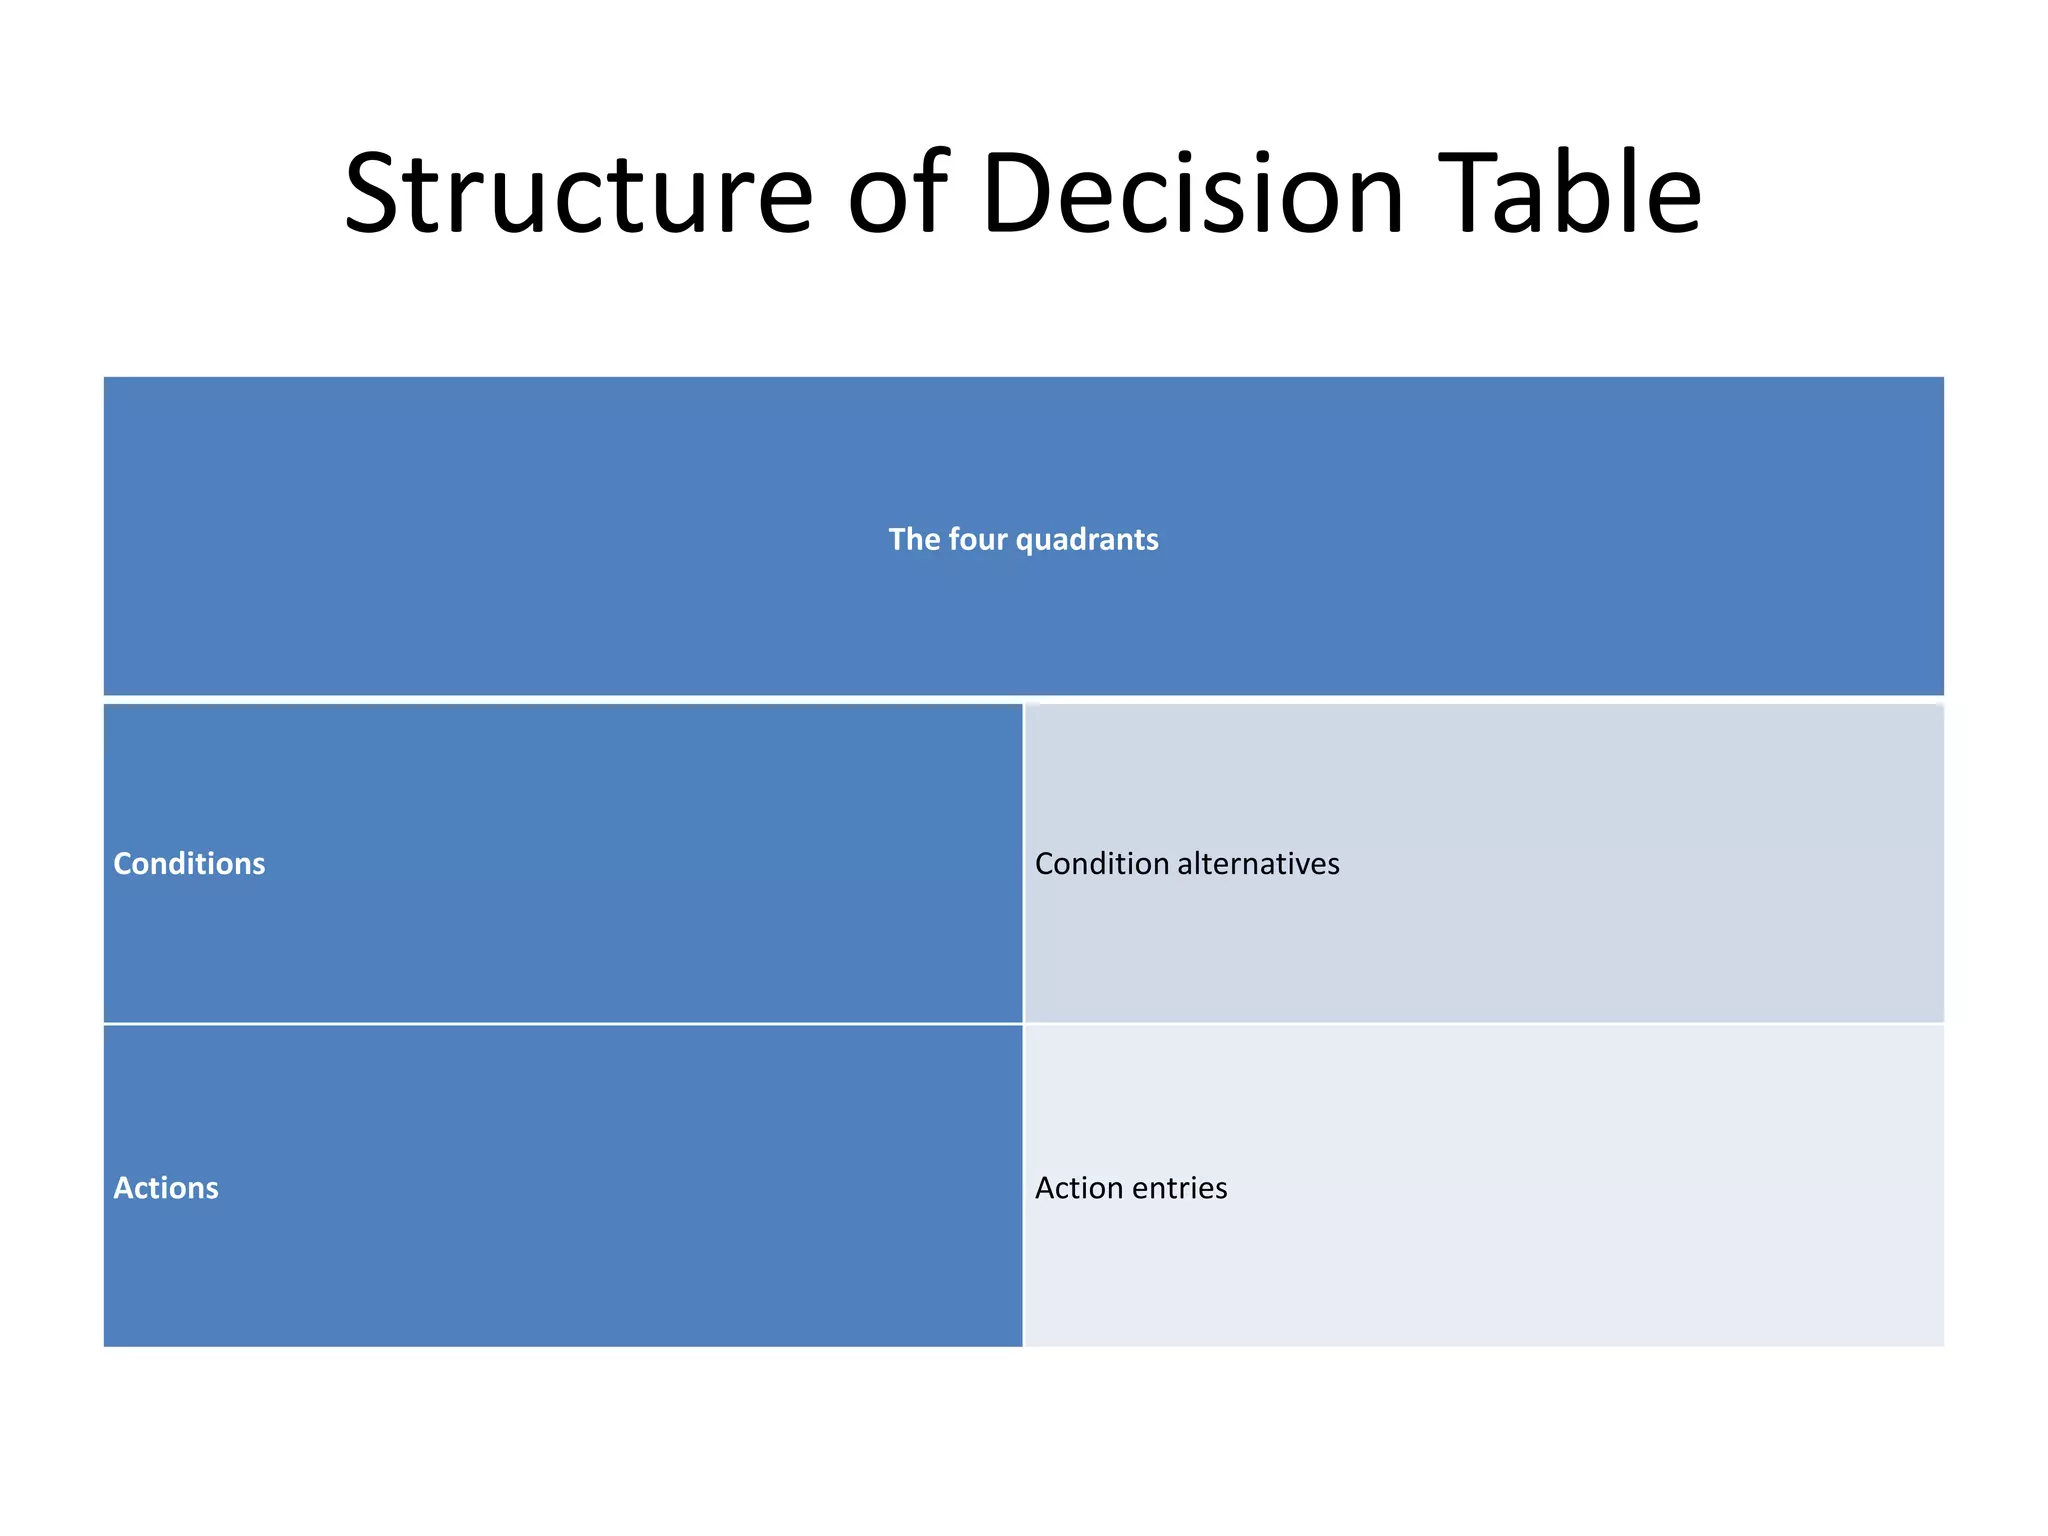
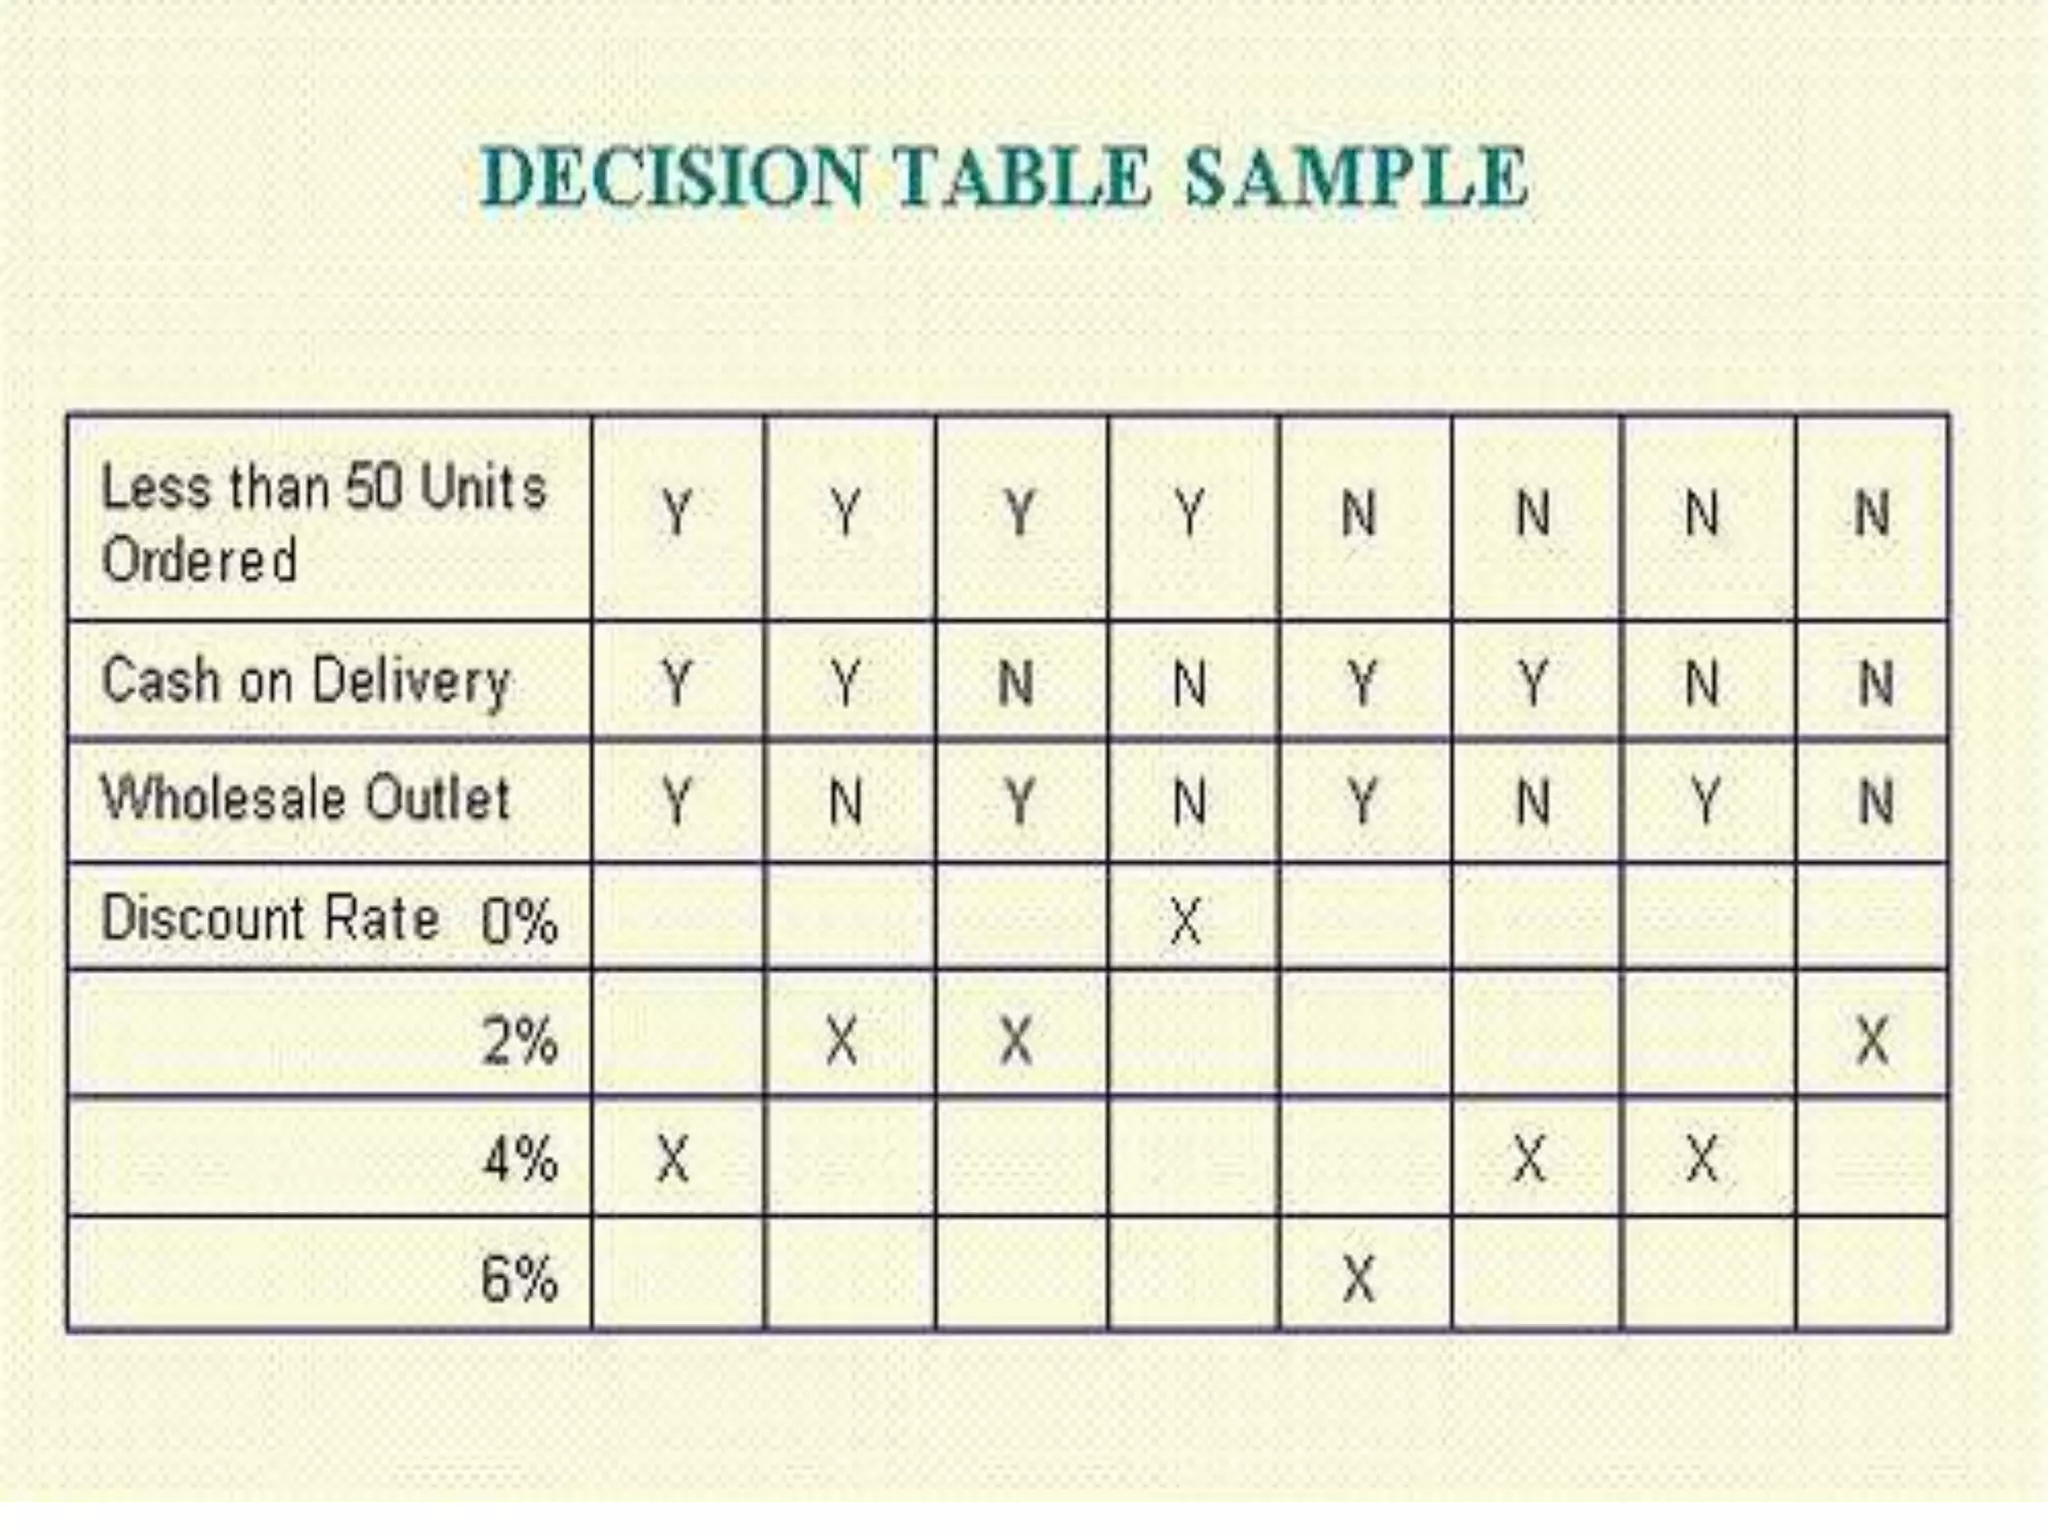
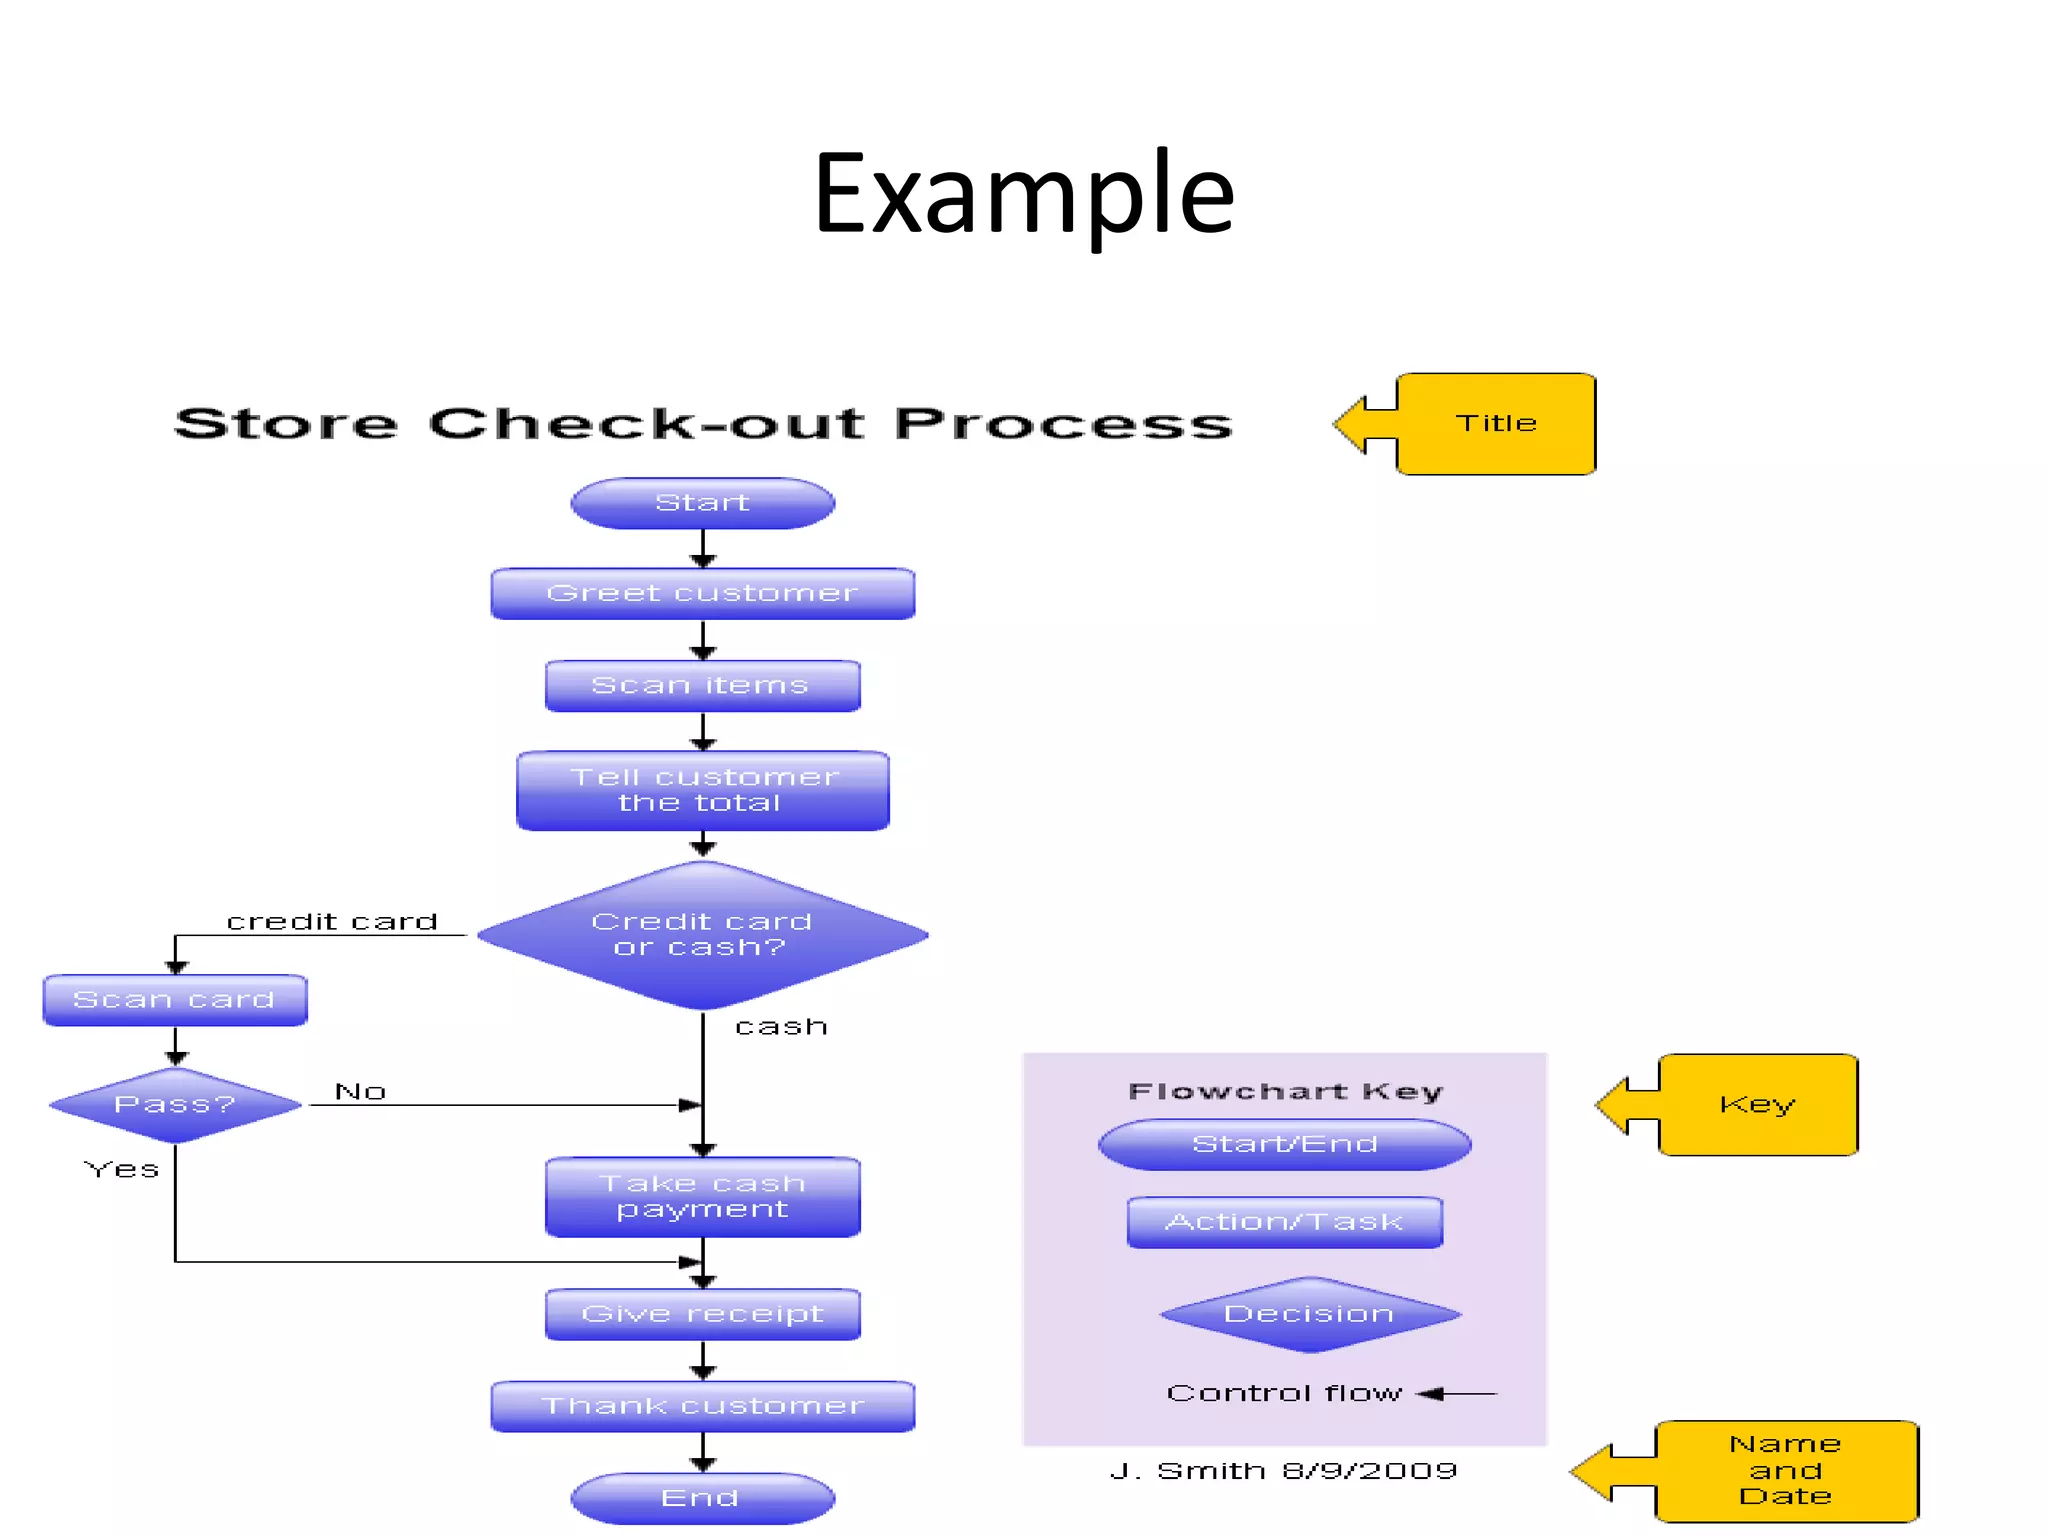
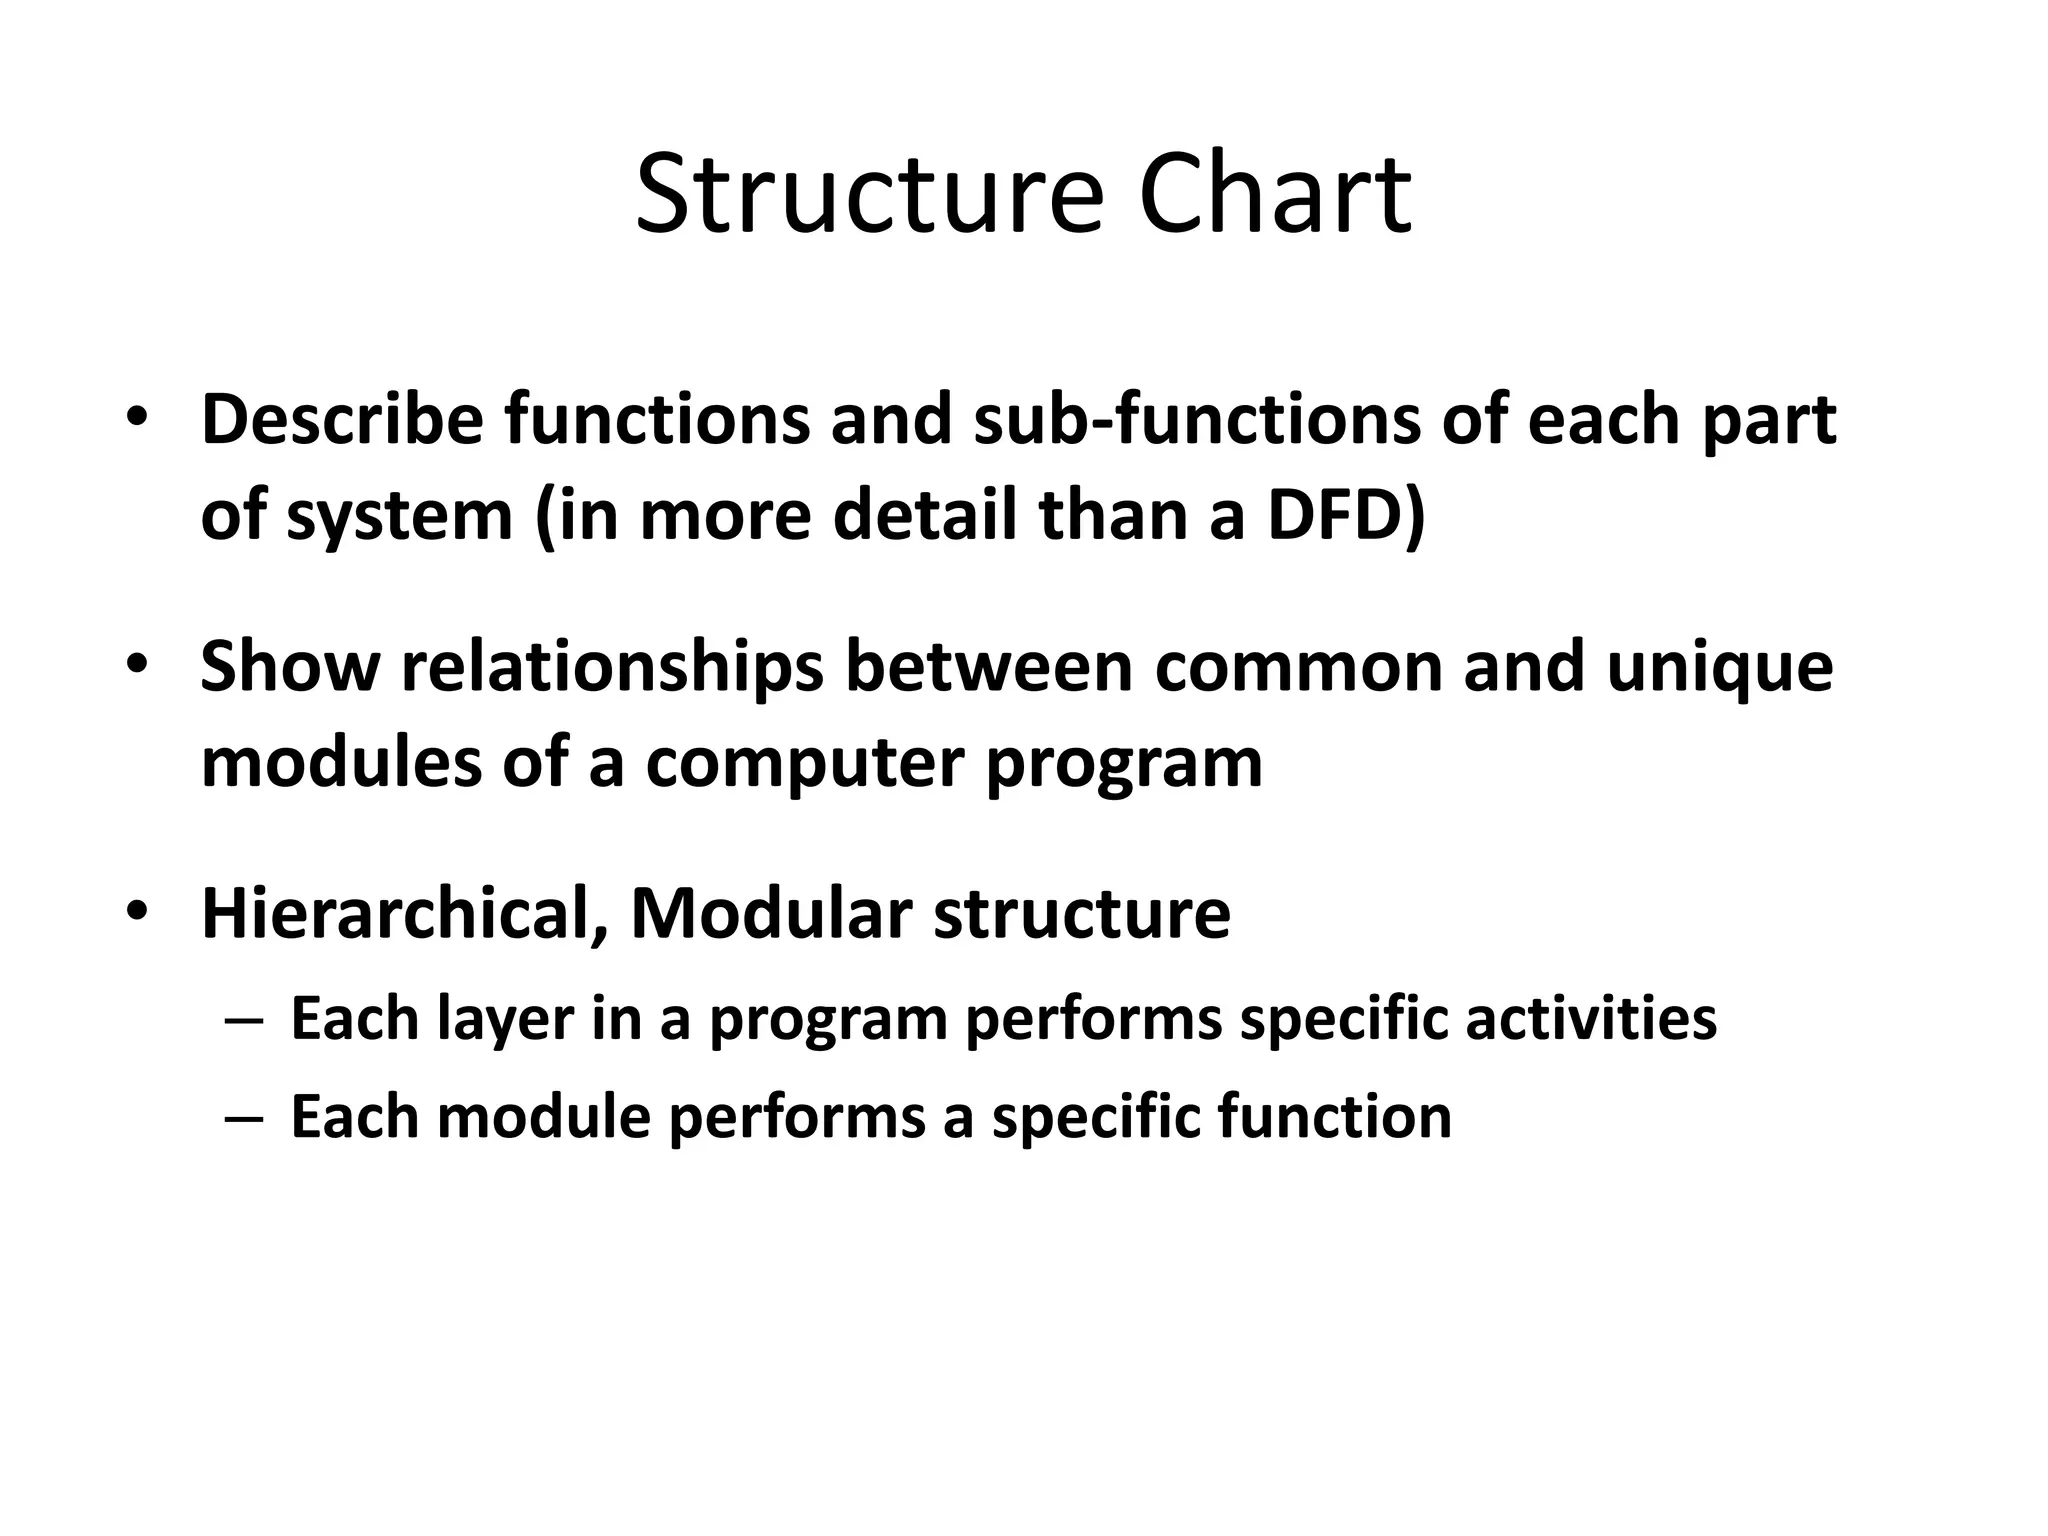
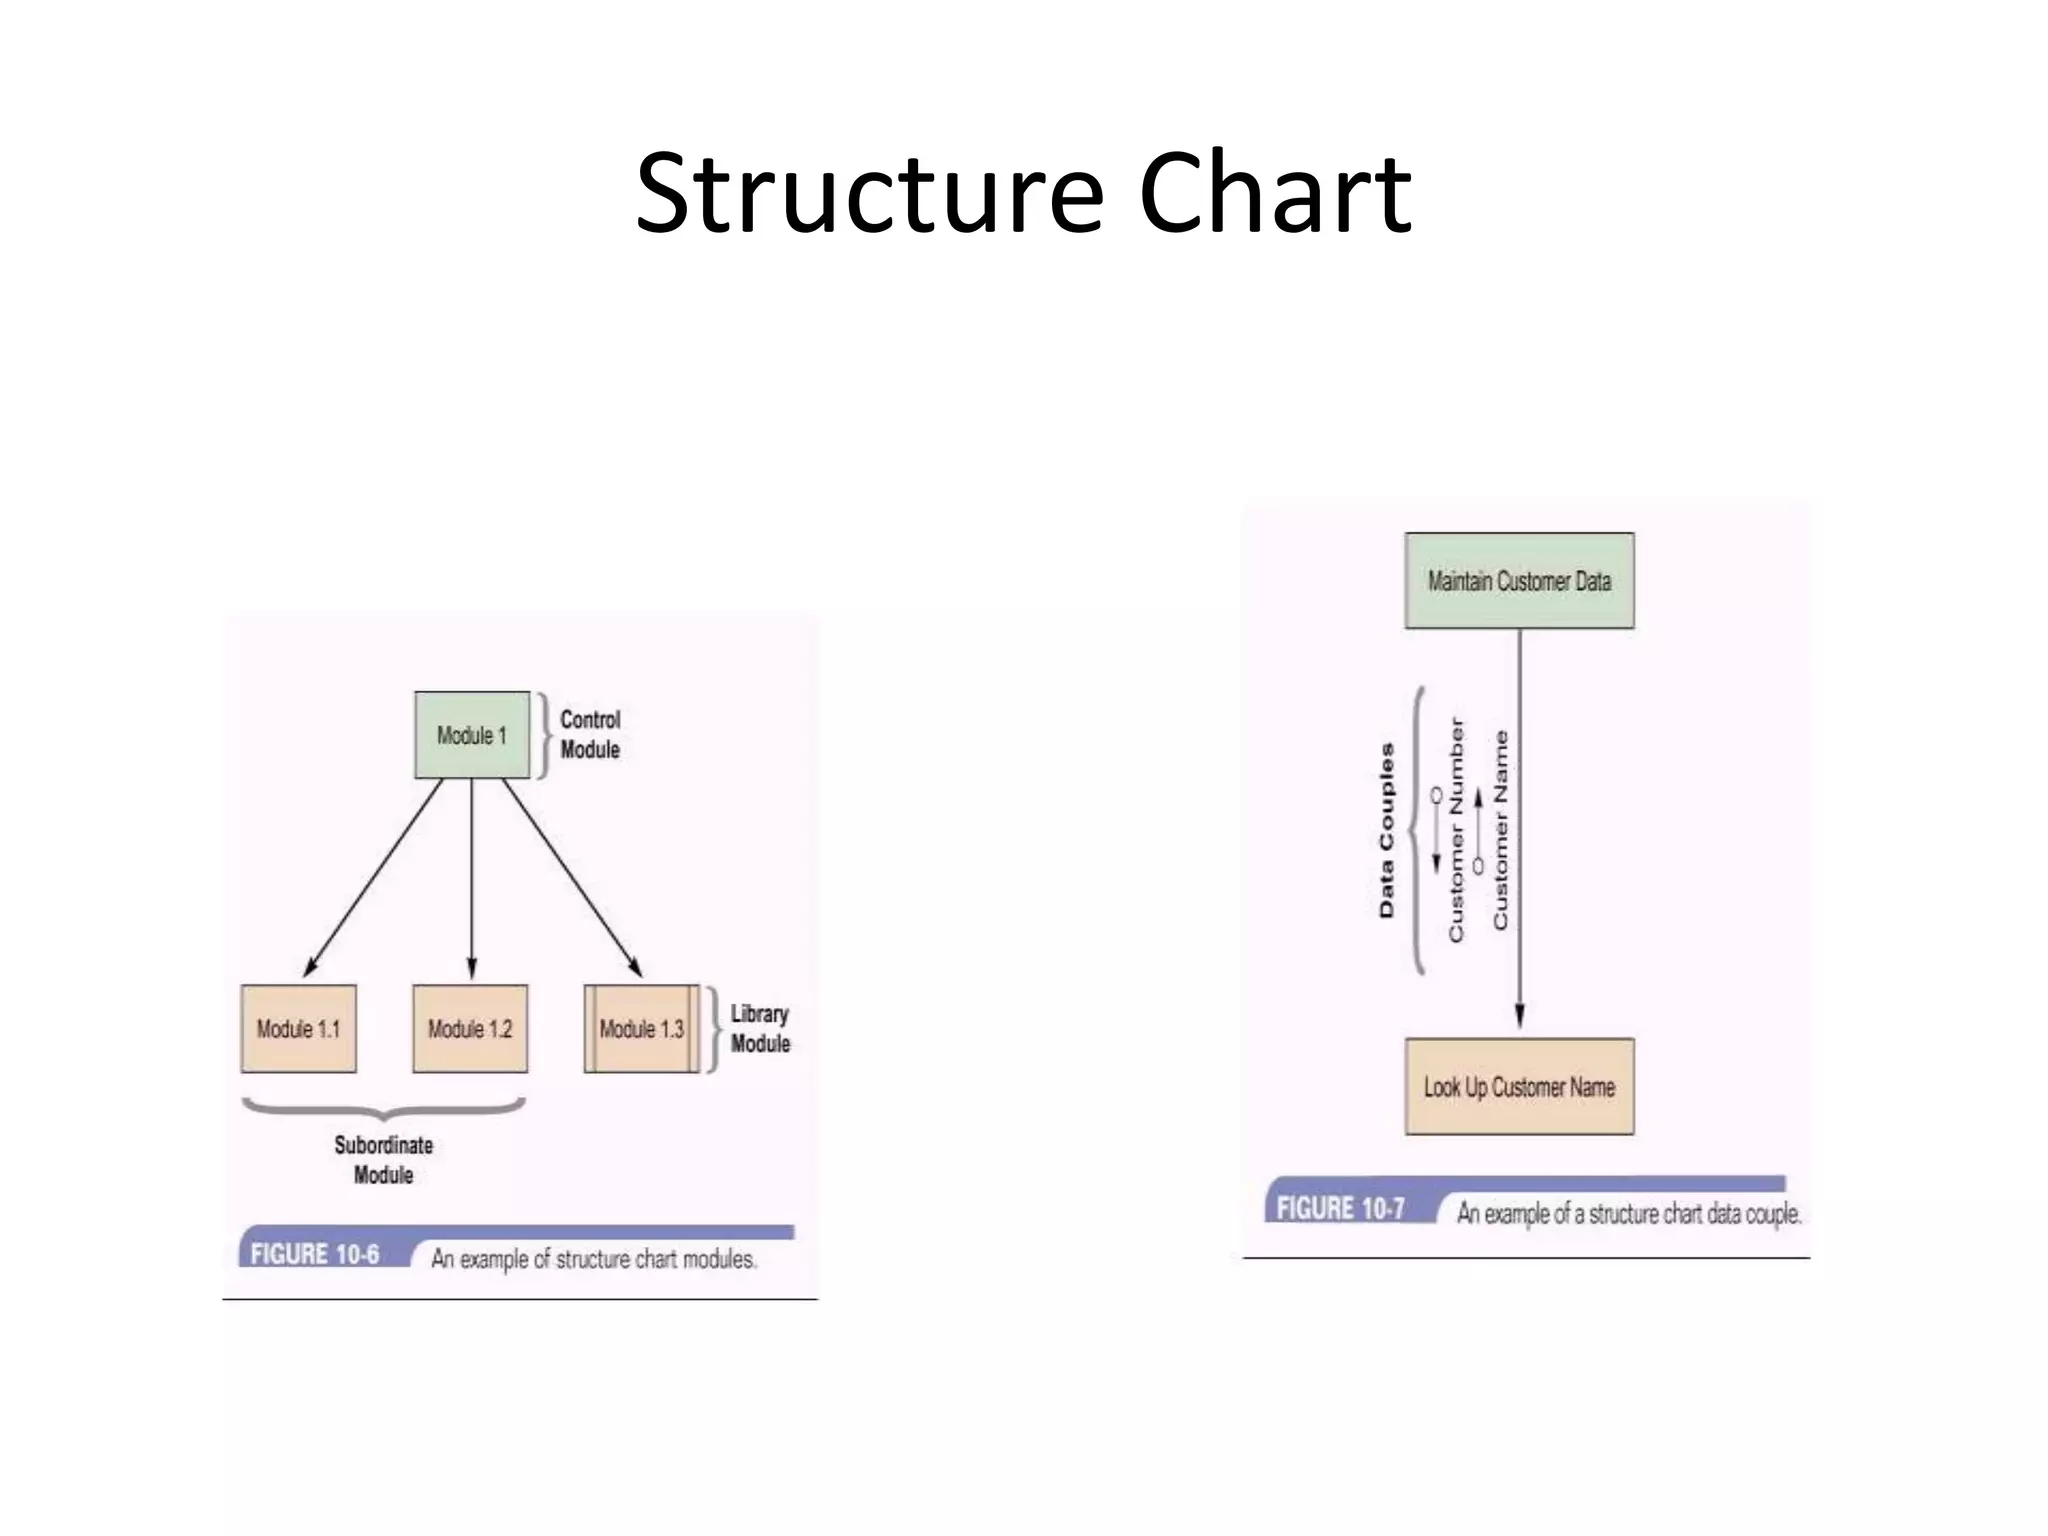
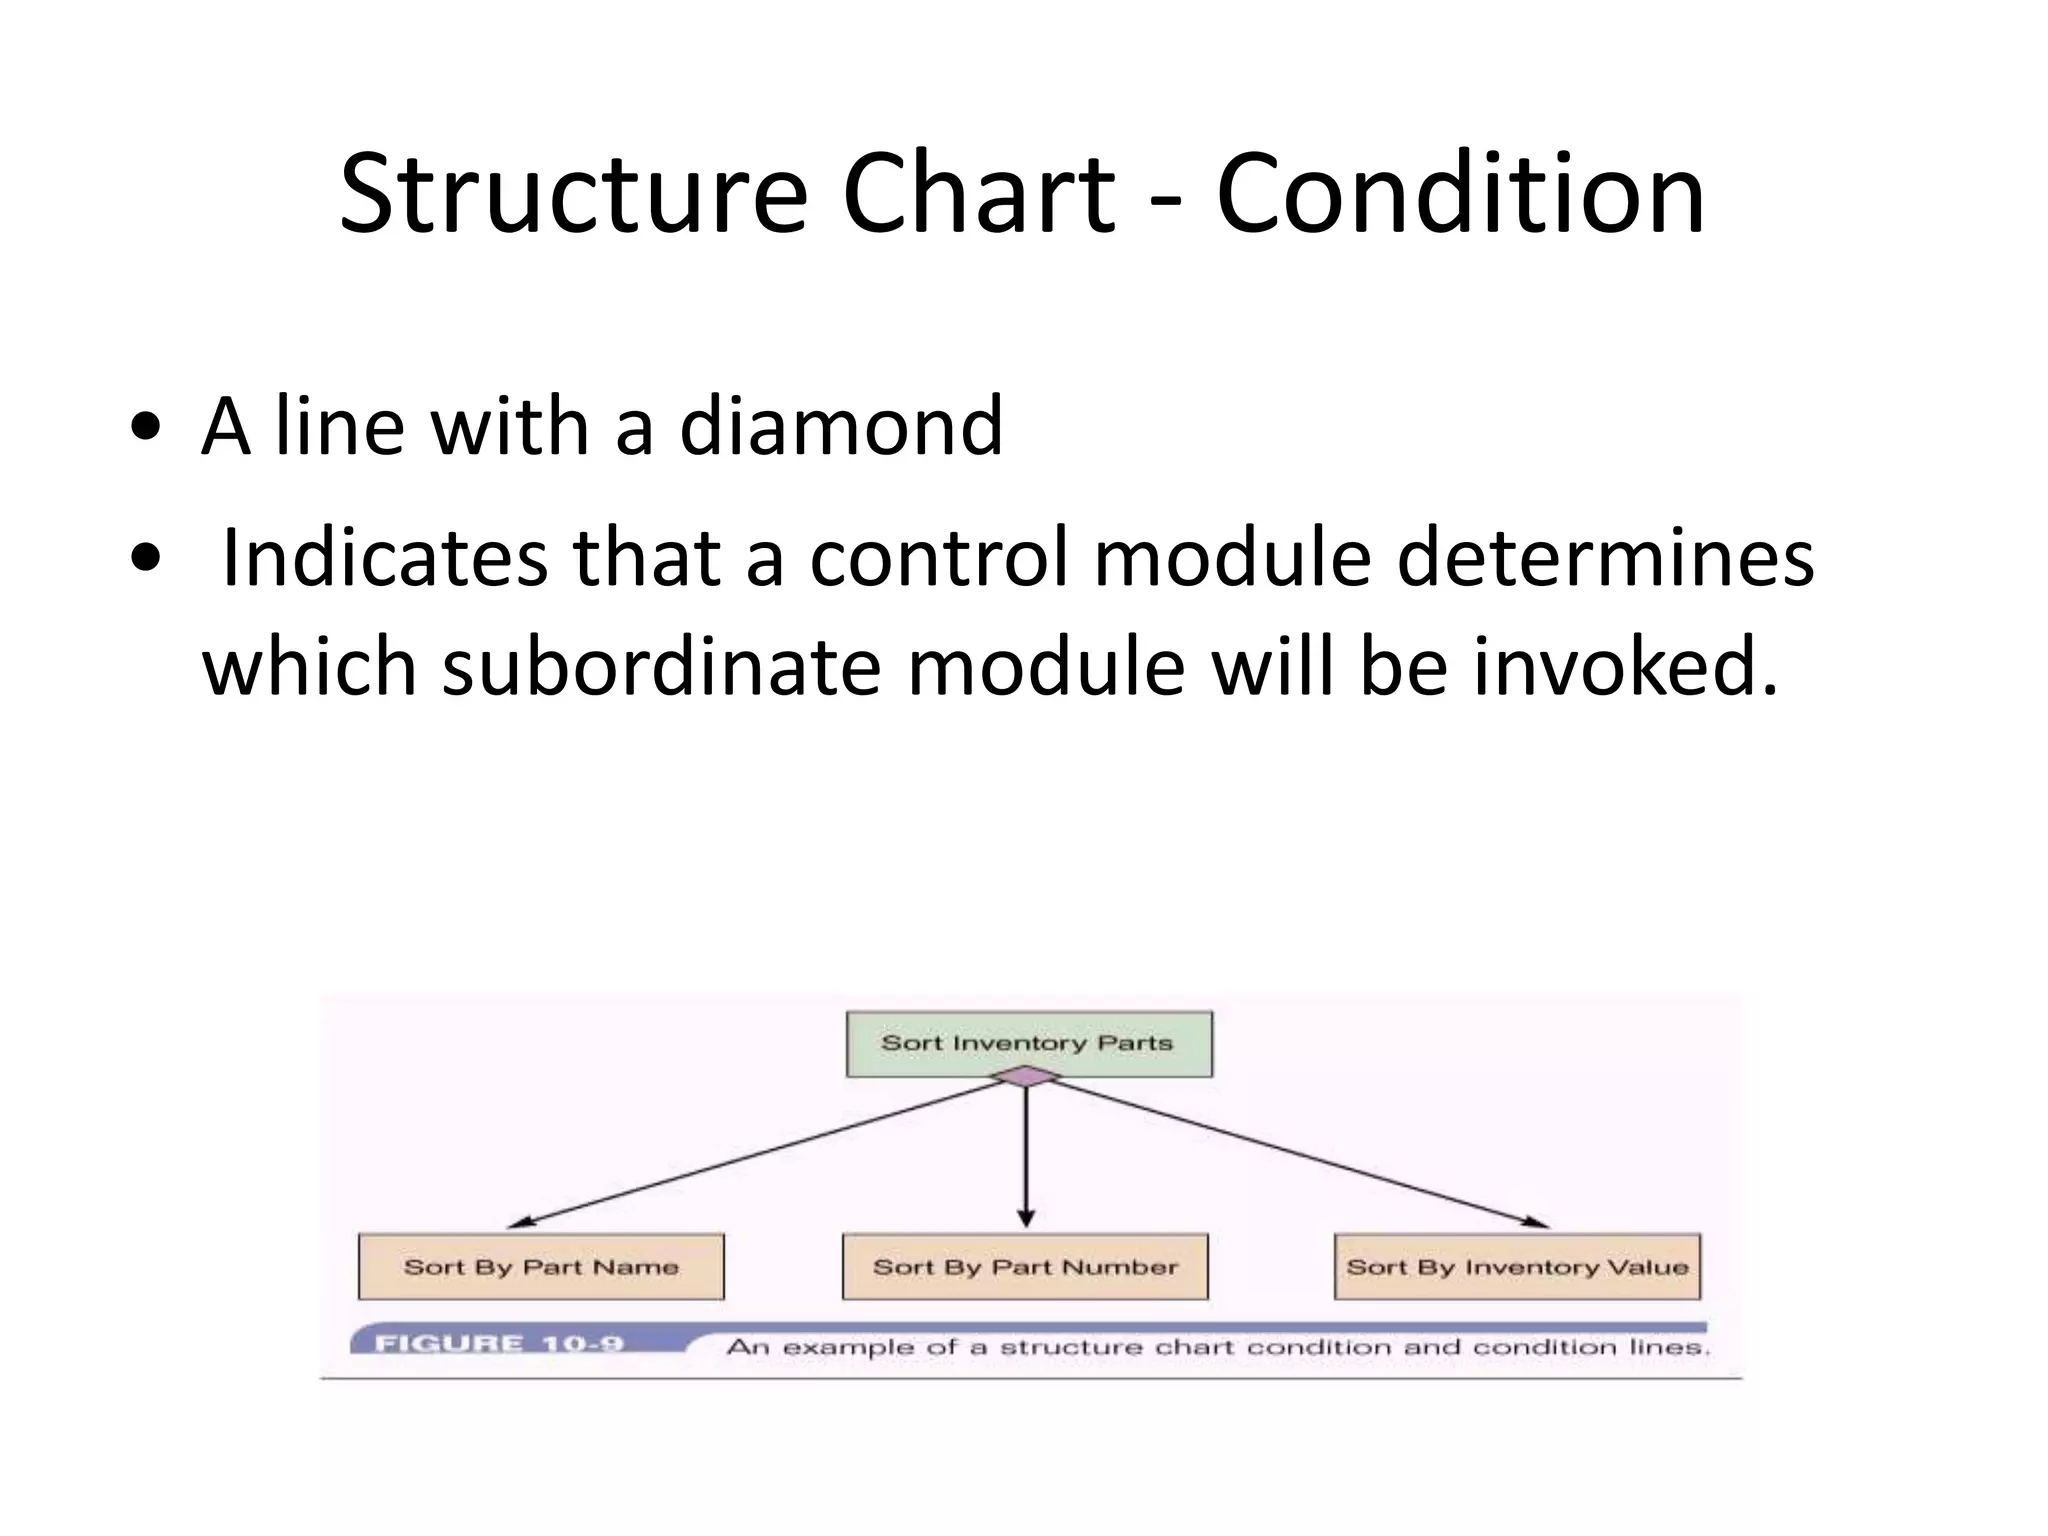
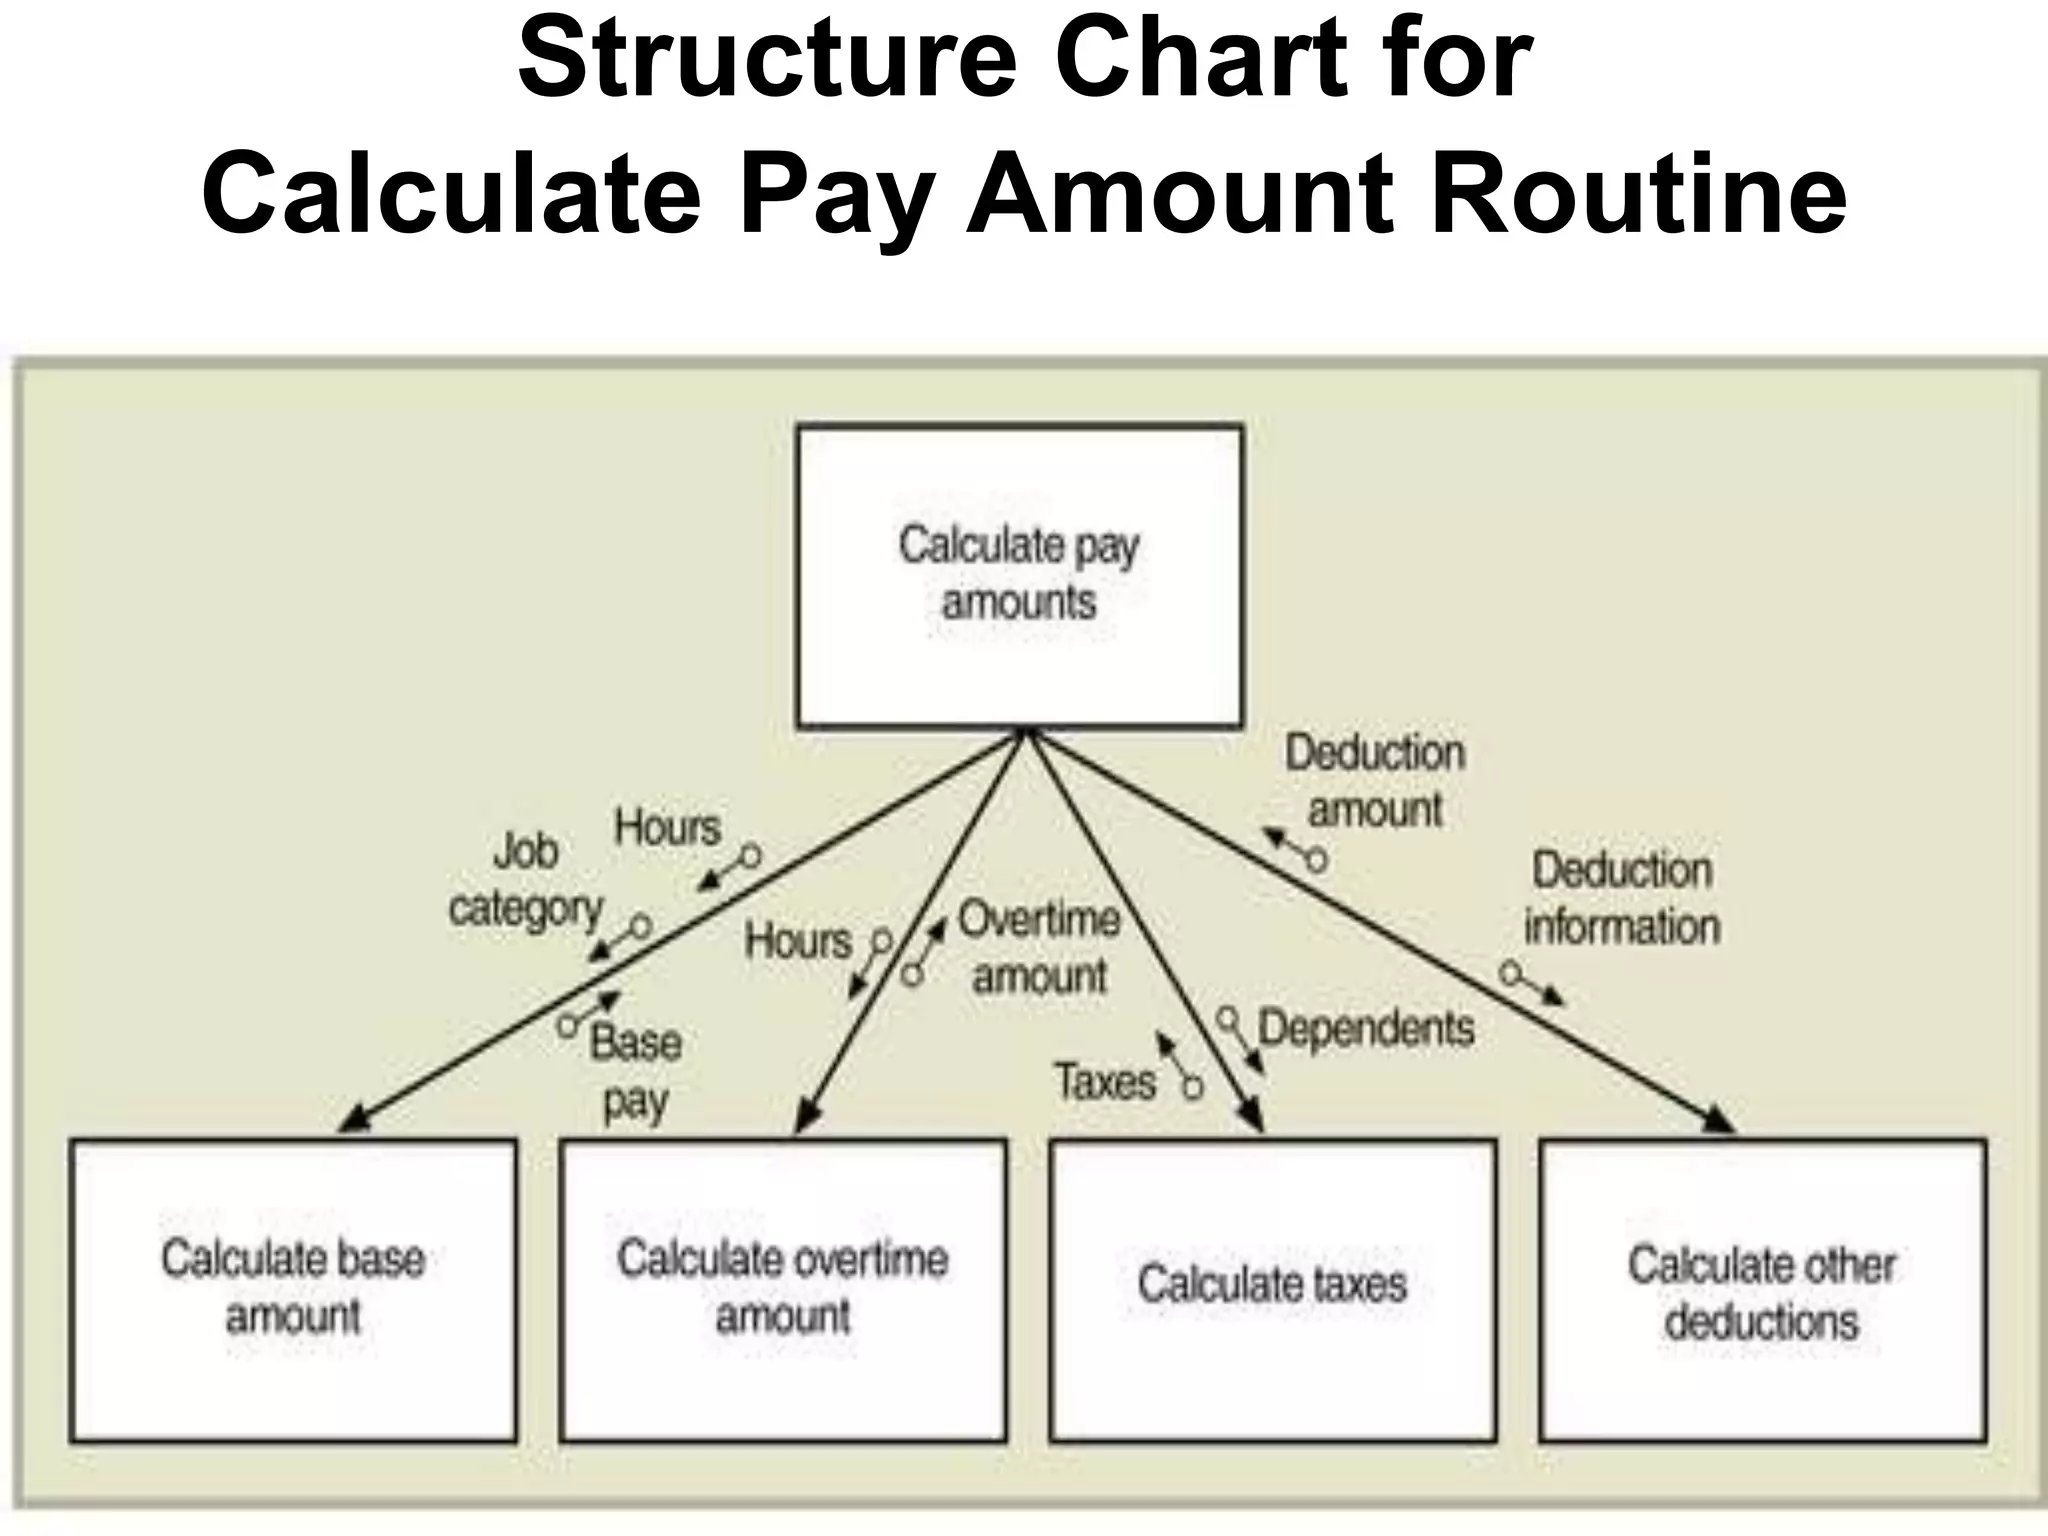


This document discusses and provides examples of various modeling techniques including data flow diagrams (DFDs), decision tables, decision charts, and structure charts. DFDs show the flow of data through a system and can be partitioned into multiple levels. Decision tables organize conditions and effects in a matrix. Decision charts model decision paths and outcomes. Structure charts depict the hierarchical modular structure of a program, showing relationships between modules, data and control couplings, conditions, and loops.