
Recommended
Recommended
More Related Content
Similar to Long Range Planning 42 (2009) 390e413 httpwww.elsevier.com.docx
Similar to Long Range Planning 42 (2009) 390e413 httpwww.elsevier.com.docx (20)
More from smile790243
More from smile790243 (20)
Recently uploaded
Recently uploaded (20)
Long Range Planning 42 (2009) 390e413 httpwww.elsevier.com.docx
- 1. Long Range Planning 42 (2009) 390e413 http://www.elsevier.com/locate/lrp Measuring Long Term Superior Performance The UK’s Long-Term Superior Performers 1984e2003 George S. Yip, Timothy M. Devinney and Gerry Johnson This article examines the issue of determining long-term sustained superior financial per- formance. We demonstrate that the technique of frontier analysis is a robust and theo- retically consistent way to identify relative performance. We show how our approach, although dependent on the reliability of reported financial data (which recent events show needed to be treated with caution for some companies), addresses the three critical issues in the measurement of performance: balancing short-term and long-term performance, capturing the multidimensional nature of performance, and finding the right peer com- parators. The approach is particularly important today, given the failure of past perfor- mance to signal in any way how firms would be able to weather a pervasive global crisis. � 2009 Elsevier Ltd. All rights reserved. Academics and practitioners would both agree that the primary job of senior management is to manage for sustainable long-term performance that results in superior returns for the owners of the firm’s assets (i.e., shareholders), while also meeting the
- 2. claims of other stakeholders. However many studies have noted that few companies manage to achieve such long-term su- perior performance.1 This article argues that the difficulties managers face in sustaining long- term performance arise not just from a competitive environment that naturally flattens out a firm’s performance profile, but also from the inherent problems in accounting for the mul- tidimensional character of performance as it is commonly understood and measured. To under- stand superior sustained performance, one requires a theoretically consistent and robust understanding of what it means to perform.2 This article proposes an approach for characterising performance that accounts for the ma- jor dilemmas in determining what it means to be a superior financial performer. This question 0024-6301/$ - see front matter � 2009 Elsevier Ltd. All rights reserved. doi:10.1016/j.lrp.2009.05.001 http://www.elsevier.com/locate/lrp has been at the forefront of strategic thinking for decades, and has come to the fore, not just in terms of theory - e.g., what does it mean to have sustainable competitive advantage e but also in terms of practice e e.g., in going from ‘good to great’, what is meant by ‘good’ and ‘great’. Characterising sustained superior performance requires dealing with three specific challenges: (1) how to balance long versus short term performance, (2) how to address the issue of the
- 3. existence of multiple, perhaps conflicting, measures of performance, and (3) how to determine what the relevant basis of comparison should be. Each is discussed below, and their practical implications discussed in Exhibit 1 using GE as an example. Challenge 1 - balancing short-term and the long-term performance Although managers face the challenge of managing for both short-term and long-term perfor- mance,3 most measures focus primarily on short-term performance; a few years at most and only a few quarters in some cases. Even with supposed longer- term future looking measures, such as share prices, the length of the time horizon is itself subject to the collective foresight of in- vestors and the length of that foresight. Even academics are not immune to this tendency: the ma- jority of academic studies rely on cross-sectional analyses, and when longitudinal analysis is conducted performance is normally construed narrowly.4 Challenge 2 - the conflicts between different measures of performance The advent of the balanced scorecard and similar approaches has signalled wide acceptance of the idea that managers should be evaluated on multiple measures of performance.5 However, no one has yet come up with a robust way of doing this and addressing the critical questions of what those measures should be, and how managers or analysts should balance different measures, particularly when they conflict. Challenge 3 - finding the right peer comparators Performance needs to be measured not just against what the
- 4. company itself has done in the past, but also against comparable companies - managers do this, as do analysts. But they may use quite different comparators than might be found in academic studies, with their reliance on broad stan- dard industrial classification comparator categorizations. difficulties in sustaining long-term performance arise not just from the competitive environment but also from problems in measuring the multidimensional character of performance In this article we propose frontier analysis as a better method to address these three challenges. This method involves the creation of frontiers of financial performance based on multiple measures over an extended period of time within a set of industry peers. The general theoretical logic for this approach is based on the notion that superior performance arises from dominance.6 Dominance, as defined here, implies that a superior financial performer is one whose pattern of performance, on all or some combination of performance dimensions, is greater than its peers (we refine later what ‘all or some’ implies). This improved way of measuring relative company performance should be of interest not only to managers, but also to all those interested in the performance of companies - investment analysts, board directors, policy makers and academics. We demonstrate this approach by applying the frontier analysis technique to two common types of performance rankings: single year performance within an industry (oil) and multi-year perfor-
- 5. mance within a country (the UK). For the latter, we apply the technique to 215 of the largest Long Range Planning, vol 42 2009 391 Exhibit 1 The Three Challenges and GE’s Transition The difficulty in understanding and characterising performance can be seen in examining the case of GE, one of the true sustained performers, and comparing its performance across the CEO transition from Jack Welch to Jeffrey Immelt. Welch’s tenure as the CEO was something of a dream run - from 1981 to 1999 GE’s share price increased three-fold - making him one of the iconic executives of the 20th Century. Immelt’s tenure has been viewed less rosily, with the investors treating GE much less kindly under him than they did under his predecessor, despite the fact that what Immelt was managing was what he inherited from Welch, and that he had to do it in the considerably more difficult environment that followed the events of September 11, 2001. GE’s numbers and strategy create a complex picture. During his first 5 years as CEO, Immelt engaged in $30 billion in divestitures and $65 billion in acquisitions, dramatically altering GE’s $150 billion business portfolio and sectoral context, and hence the economic factors affecting company performance. During this period GE’s performance on market measures (specifically, on share price) declined by over 30 percent, yet (with the
- 6. exception of 2003 and 2004), the company’s ROA results were above Welch’s prior decade average, revealing that, in general, Immelt’s strategy improved year-to-year GE’s operational performance. What is clear is that this fact has not been incorporated into investors’ beliefs about the future, because Immelt’s strategy of focussing on innovation requires cash, and the level of dividends being paid out has been reduced in anticipation of future growth opportunities. Immelt’s difficulties are with investors’ concerns about two measures of performance - the share price and short term div- idend flows. As Useem notes, ‘According to an analysis by Stern Stewart, 82% of [GE’s stock] price is based on investors’ hopes for future earnings growth, rather than on GE’s fundamentals [emphases added].’ It is also interesting to note that the slight decline in accounting perfor- mance seen in the early Immelt years is consistent with the general trend in GE’s performance in the previous decade (which was for slightly lower returns in the 1990s than in the 1980s) and the general decline in diversified manufacturers’ performances overall. This short story reveals that, even for such an obviously iconic performer as GE, the three challenges rear their head. Has GE remained a sustained performer? Is 5 years too soon to make a judgement on Immelt’s GE when the data conflict? To what extent can market ana- lysts’ ‘future expectations’ measure ‘performance’ when we have historic measures that do not line up with these expectations? What should be the basis of comparison when one-third
- 7. of the company’s asset base is altered?7 publicly listed UK companies and over 3,000 peer comparator firms, operating in nearly all indus- tries with a significant UK presence, over the 20-year period 1984e2003. We find and identify 28 companies - both expected and unexpected - that meet our criteria for long term superior perfor- mance. We discuss the theoretical and practical issues in the measurement of performance, the logic and structure of frontier analysis, and how we go about structuring performance frontiers. We then apply the technique along with a set of normative criteria to determine a set of superior long-term financial performers. The application is meant to be illustrative, but also informative about what it means to be a superior performing firm. We end with some speculation about the implications of both the analysis and the technique. Problems in measuring performance Many measurement approaches suffer from the problem of providing a one-dimensional, short- term view of performance that is overly dependent on the measurement’s start and end points. 392 Measuring Long Term Superior Performance While such a view is a poor predictor of future performance - as was found most glaringly in the case of Peter and Waterman’s book, In Search of Excellence e it is (as Phil Rosenzweig has so ele- gantly pointed out) a hallmark of most attempts to attribute performance to specific actions and rules. Representing the one-dimensional view, some business researchers, especially those in fi- nance, but increasingly also in strategic management, claim that
- 8. Total Return to Shareholders (TRS) is the most superior and credible criterion for performance. Yet despite the obvious impor- tance of TRS to investors, particularly in Anglo-Saxon (as opposed to Continental European or Jap- anese) business systems, there is little evidence that senior managers use it as the single measure of their firm’s performance.8 shareholder return can be a treacherous indicator of a company’s prospects Although TRS has the benefit of being a robust backward and forward looking measure of finan- cial performance it is not an ultimate measure without limitations. First, there are many interme- diate outcomes that affect TRS - e.g., the level and growth rates of profits and return on investment, cash flows and many other non-financial variables such as market power and corporate reputation - and TRS represents only a collective opinion about their value.9 Second, the longer the time frame - and top managers have a much longer tenure than the typical holding period of most shareholders, certainly in the U.K. and the U.S. - the greater the influence of these intermediate outcomes on TRS. For example, one explanation for the lower TRS associated with Jeffrey Immelt’s tenure at GE was his promotion of innovation (e.g., the ‘Ecomagination’ initiative) over labour and produc- tion productivity (e.g., Welch’s six-sigma campaign). As the returns to innovation are less certain and longer term, and potentially require more upfront investment, they are subject to more varied interpretation by investors. Third, shareholder return can be a treacherous indicator of a company’s
- 9. prospects, as evidenced by the Internet-induced stock market bubble at the end of the 20th Century. The TRS of many of these companies was based on expectations derived from highly uncertain in- formation such as ‘click streams’ and ‘share of eyeballs’, none of which proved to be particularly predictive of the actual financial outcomes. In our GE example, despite improved operational per- formance under Immelt, the company’s price-earnings ratio was only half of that under Welch. Faced with such evidence, even TRS devotees are now questioning the primacy of shareholder value.10 Fourth, measures of corporate performance should be closely linked to what top managers can influence. Although the Chairman of the Board and the Chief Executive may feel they need to influence TRS, lower level executives need to manage to more specific operational performance measures that are influenced directly by their decisions. Mixed performance measures, such as eco- nomic value added, attempt to include the cost of capital in lower level operational performance metrics. measures of corporate performance should be closely linked to what top managers can influence Different companies and their top managers have different objectives, both from other firms and over different periods. For example, a younger, growing company may choose to place much more emphasis on revenue or market share growth than on profits (as Japanese automobile manufac- turers did when first entering the United States in the 1970s and 1980s). At GE, for example, Byrnes has noted that Welch operated in a regime where cutting
- 10. headcounts and improving cost perfor- mance was easier and more relevant and pensions funds were flush with cash, while Immelt, with much less latitude to reduce costs, has promoted an innovation based strategy instead. Depending Long Range Planning, vol 42 2009 393 on their personal situations, equity holdings and performance incentives, some managers may em- phasise TRS more than others. We know that top managers will tend to seek to retain the autonomy to run their companies as they think best, and therefore try to avoid pressure from stakeholders, particularly shareholders: to do so, they may only need to perform well on a few key financial mea- sures. Thus managers of companies that do well on TRS will stress that measure, saying ‘never mind the profits for now,’ (the mantra for the many Internet start-ups of the early 2000s), while managers of companies with stodgy share price performance will invariably point (if possible) to profit per- formance. It is those managers whose companies perform badly on both TRS and profit-related measures who get into trouble. ..comparing companies in the same industry in performance terms ..is vital to inform investors and evaluate and motivate managers. The frontier approach to measuring performance We have argued above that different companies, especially in different industries, but even in the same industry, can justifiably use different measures of performance at different times. This might
- 11. imply that even companies in the same industry cannot be compared or ranked in performance terms. But such comparison is vital, both to inform investors and to evaluate and motivate man- agers. Frontier analysis allows such comparisons (see Exhibit 2 for a brief history of the method), Exhibit 2 A Short History of Frontier Analysis Frontier analysis was developed in the 1970s as a means of understanding the efficiency of decision making units (DMUs), which might be production lines, factors, firms or any closed system with specific inputs and outputs.12 In its simplest form, known as Data Envelopment Analysis (DEA), non-parametric linear programming techniques are applied to estimate an input-output function where there is no need to specify the functional form a priori.13 The efficiency of a DMU can then be determined by comparing the difference between the max- imum output(s) achievable with a set of input(s) to the actual output(s) achieved (or con- versely, the minimum vs. the actual input(s) necessary to achieve specific output(s)). It is this benchmark comparison logic that has made DEA useful in a practical sense - by focusing not on absolute measures of performance but comparisons with benchmarks, it fits well with many of the conventional heuristics used by managers.14 DEA has evolved dramatically in terms of sophistication and application over the last 30+ years, and has been used to examine thousands of examples of input-output efficiency from private versus public universities to the financing of diagnostic
- 12. related groups in health care and plant energy utilisation.15 It has proved particularly useful in examining the ‘performance’ of organisations that have no direct profit imperative, such as hospitals, and those with mul- tiple inputs and multiple outputs. Its particularly relevance here lies in its ability to character- ise situations with multiple outputs. The method is not without its limitations, including its reliance on the veracity of the data at hand which (unlike in parametric approaches) are assumed to be correct, both in terms of objectivity and of freedom from error (although errors can be adjusted with some assump- tions). This is particularly salient in the case of financial data which, even when audited, can be subject to error, interpretation and restatement. 394 Measuring Long Term Superior Performance and does so in a way consistent with strategic notions of sustained advantage (see Methodology Appendix for a technical description). The following presents a conceptual overview of a perfor- mance frontier and discuss how it can be operationalised to make effective and meaningful com- parisons of firms within an industry.11 We then illustrate the application of the same approach to identifying long-term sustained performers amongst a set of publicly listed UK companies across different industries. What a performance frontier looks like
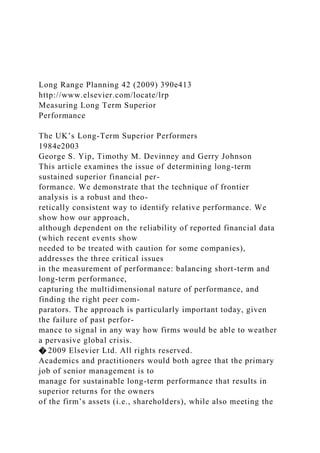
- 13. We can illustrate frontier analysis diagrammatically with the simple case of two measures of per- formance, although the technique can be applied for many measures. Figure 1 shows a hypothetical industry performance frontier for one year, using two dimensions of performance: X1 and X2. In this example, Companies A, B and C are all at the performance frontier for their industry that year, even though each company has achieved a different combination of performances on the two measures. Company A scores highest on X1, and Company C on X2. Company B does not score highest on either measure, but neither is it dominated overall by either A or C. Because we cannot say (without evidence) that any of these three clearly dominate the others on all of the performance dimensions being considered (or on a linear combination of those measures) e and nor can we conclude that any one of them has performed less well than any other firm - we state that, together, they define the frontier. In contrast, companies E and F have each performed below that year’s frontier for the industry, meaning that they are dominated either directly or indirectly by the firms with which they are being compared. In the case of F, its underperformance is simply the distance on the line between the points occupied by F and B, implying that it is using the same performance measures in the same proportions but is doing less well on both. In the case of company E, its underperformance is measured by the distance between its position and a point d, which is a combination of the po- sitions of A and B. As there is no one company that has the same ratio as company E on the two
- 14. measures, company E can be characterised as being dominated by a linear combination of these two competitors. The benefit of this logic should be clear. First, one can begin to address the multi-dimensionality of performance without reliance on simple averaging (which will tend to mask differences and hide dominance). Second, where dominance exists, superior performance can be identified quite easily. Third, where dominance does not exist one cannot, empirically, make an a priori argument for su- perior performance. Any attempt to argue for the superior performance of one firm over another becomes wholly reliant on the (perhaps biased) opinion or orientation of the researcher, who must make an arbitrary or theoretical argument for a specific weighting of the various measures of per- formance. Hence, in the Figure 1 example, the conclusions that can be drawn are that {A, B, C} are superior firms relative to firms {E, F}. We cannot say anything about the order of performance of the three firms {A, B, C} or of the two firms {E, F}. All we know - and can say with confidence - is that {A, B, C} > {E, F}. Output (x1) Output (x2) A B C E
- 15. F d Firms A,B and C are efficient and define the frontier. Firm F’s inefficiency is measured against firm B and can be calculated as the radial projection (0F/0B). Firm E’s inefficiency is measured against a weighted average of firms A and B (Ad)*A + dB*B and would be (0E/0d) 0 Figure 1. A Frontier with Two Dimensions of Performance Long Range Planning, vol 42 2009 395 Choosing measures of performance The performance frontier can be constructed from many different performance measures e but which should they be? Ideally, they should be a mix that reflects the interests of different corporate stakeholders but are also relevant to the operational and strategic decisions being made by man- agers. Different stakeholders expect different outcomes from companies and, hence, apply different measures. For example, in the U.K. and U.S., the majority of equity in large public companies is now owned by institutional investors who hold shares for a relatively short period of time (less than one year on average in the U.S.). While these investors place heavy emphasis on the direct outcome of TRS, they also care about intermediate outcomes e
- 16. such as profits, innovation and rep- utation e in so far as they affect TRS and serve to signal future performance. Investors such as banks and insurance companies may regard cash flow and long- term survival as more important than TRS,16 while (as Dore notes) companies from Continental Europe and Japan also pay signif- icant attention to the interests of other stakeholders. (These may include employees, who will care a lot more about jobs - quantity, quality and remuneration - as a direct outcome, and see TRS and profits, etc., as intermediate outcomes that affect jobs). Top managers are the stakeholder group with the most power over a company’s direction and success Top managers are also key stakeholders and, even more important, are the stakeholder group with the most power over the direction and success of a company: ‘C-suite executives’ (CEO, COO, CFO, etc.) certainly have an interest in TRS, both as shareholders themselves and because of the pressure they face from equity investors. But TRS and other measures of returns on equity tend to be blunt instruments for monitoring and managing a company’s myriad activities. For such purposes both top and middle managers rely much more on accounting measures - including profit margins, return on assets, and return on capital employed - that can get at the fine grain of a com- pany’s performance. As argued above, some stakeholders may even be concerned with non-financial aspects of performance, such as those relating to employees’ employment conditions or social responsibility outputs.
- 17. The beauty of the frontier approach is that it can accommodate any mixture of measures and still allow companies to be ranked against each other, even where they excel on different criteria: in this sense, frontier analysis can compare apples with oranges! (Pursuing that analogy, frontier analysis can rank an apple as being closer to apple perfection than an orange is to orange perfection e dog show judges do the same when they select a ‘best in show’ from among different ‘best in breeds’. But frontier analysis avoids the judgemental subjectivity often inherent in such decisions.) With frontier analysis it is not so much the exact measures selected that is vital, but that there should be a broad and diverse collection of measures, all of which are related to underlying issue(s) of interest. Indeed, the more similar the measures are, the less information is revealed by the ad- dition of another performance dimension, since the ordering of firms will not change. What this implies is that the choice of the measures used should be determined by: (1) are they relevant to important stakeholder groups (ones to which managers react)? (2) do managers manage to these measures or drivers of these measures? (3) are they duplicated by a linear combination of the other measures being used? In other words, these three criteria ask two variants of a relevance question and one degree-of-independence question. Sensitivity analysis allows the investigator not only to examine the diversity of the measures needed, but also to see whether or not different weightings or groupings matter to the form or sub- stance of the frontier. Indeed, with many other approaches -
- 18. single item measures such as return on assets or TRS, or averages of combinations of measures - problems arise in that results will depend on the single measure chosen, or that the aggregation process smoothes over important effects. 396 Measuring Long Term Superior Performance With frontier analysis, adding more measures provides more information and, hence, can allow the investigator to differentiate exactly where a single firm is clearly dominating - or being dominated by - its peers. We also believe it is just as important to know when there is no dominant, superior per- formance as it is to know when such performers exist: thus, an additional value of frontier analysis is in revealing when conclusions about relative performance cannot be made. For the purpose of studying long-term financial performance, we have adopted a selection of fi- nancial measures meant to be representative of the sort of information investors, managers and key stakeholders would examine when gauging whether or not a firm is performing well. (The choice of these measures is discussed later.) Choice of comparators As Paul Nunes has noted, ‘you can call anyone a winner depending on how you draw the set around them.’17 As with any ranking approach, we must choose a relevant set of comparator firms, since being superior means being superior to something or someone else. Managers compare their performance to benchmarks, either to the stock market as a whole (e.g., all
- 19. FTSE 350 companies or the S&P 500) or, more commonly, to their peers in the same industry and to their own historic performance. However, almost every company of notable size (e.g., large enough for the FTSE 100 or the Fortune 500) operates with its own unique mix of participation in industries, countries and market segments, all of which have their own effects on company performance, and will thus influence performance expectations. If two companies in the same industry have a different mix of international business locations one could expect them to perform differently in ways related to the prospects of the countries where they operate, so few companies have directly comparable peers against which to benchmark perfor- mance (and, indeed, managers are very cognizant of this fact). While comparisons should ideally be made with peers that are as similar as possible, allowance needs to be made for different yardsticks for different companies. As noted above, frontier analysis allows for this kind of diversity in its ability to accommodate firms choosing different performance metrics on which to concentrate: all that is asked is that firms perform best on that combination. in an increasingly globalised world, where more and more competition is cross-border, comparisons should be with both domestic and international industry peers As we have to select some set of comparators, we believe that industry peers are the most rele- vant, as industry is the most influential group identity affecting performance, as opposed to others (nationality, size, nature of ownership etc.): certainly, industry effects account for a significant per-
- 20. centage of variance in firm performance. And, in an increasingly globalised world, where more and more competition is cross-border, we believe that comparisons should be with both domestic and international peers in the same industry.18 Controlling for industry effects This discussion also has implications with respect to industry effects. As noted above, it is well established in the strategy literature that industry effects on performance are strong, so our approach here must con- trol for industry differences. This is done, first, by controlling the peers that determine the industry set, and second, by adopting an industry-by-industry approach (or more correctly, a peer-set by peer-set ba- sis) to conducting the analysis, since the frontier cannot be, either theoretically or empirically, estimated outside the set of firms that form the industry peer set. In other words, the greater the differences between the firms being compared the less meaningful the frontier becomes. The importance of this can be seen in the examples illustrated in Figure 2, which presents the average efficiencies of firms in each of 44 industries. This efficiency (represented in Figure 1 by Long Range Planning, vol 42 2009 397 Figure 2. Average Firm Performance (Efficiency) Relative to Industry Frontier Note: industry data are based on all firms in the top 50 or 100 of each industry, mostly for the period 1984 to 2003 3
- 21. 9 8 M ea su rin g L o n g T erm S u p erio r P erfo rm a n ce the distances Ed and FB) is measured against that of the industry frontier firms, which are given an efficiency level of 100%. In other words, the bars in the Figure 2 chart represent how close the ef-
- 22. ficiency of the average firm in each industry is to its industry frontier in percentage terms - the higher the number the closer it is to the best performance frontier. If we examine the airline industry, we see that, over twenty years, the average firm exhibits an average efficiency of 96%, very close to the frontier: what does this imply and what does it not imply? First, it does not imply that airlines are more profitable in an absolute sense than marine shipping companies (where the average performance efficiency is only 52%), since the performance efficiency is not a be- tween-industry comparison and airlines are not relevant as peer comparators to marine shipping com- panies. Hence, nothing can be said about the absolute value of financial performance across these industries from this analysis. Whether the airline industry should be considered to be a poor invest- ment is not determinable from these numbers alone: the industry has many unfavourable character- istics, making it ‘unattractive’ by standard strategic definitions,19 but these only determine the level of the frontier, not the relative position of firms on or below that frontier. (That would be akin to com- paring a 100-meter sprinter’s average time per kilometre to that of a marathon runner.) Second, what it does imply is that there are very few fundamental financial performance differences between firms in the airline industry but potentially many differences between marine shipping firms. This may arise from any of a host of reasons: heavy competition, standardization, regulation, consumer or tech- nological homogeneity, capital utilisation, and so on. For example, the role of standardisation does seem to explain some of the patterns between industries. If we
- 23. compare the number of different Stan- dard Industrial Classification (SIC) codes represented within each industry segment illustrated in Figure 2, we find a correlation of�0.31, implying that industries made up of more SIC codes (i.e., those are less standardized/more diversified) have lower average efficiencies. The implication of this lower average efficiency is that the broader, more heterogeneous the industry definition, the greater is the margin for sustainable performance differences within it. Selection of time period What is the relevant time period for measuring sustainable superior performance? Most researchers use three to five years, but we believe that the answer should relate to the length of endurance of the factors that underlie performance. There are now many schools of thought on what drives superior performance. Among strategists, the two dominant paradigms of competitive positioning and supe- rior resources both emphasize the long-lived nature - often ten or more years - of these bases of supe- rior performance.21 Indeed, a recent empirical study by Morgan Stanley estimated that, depending on the industry, a well financed and aggressive competitor would require between two and 23 years to establish a business similar to that of leading industry incumbents.22 Companies must see off chal- lenges from new competitors (or new ones from established competitors) which tend to occur episod- ically, and often less frequently than every three to five years. They also need to sustain performance through business cycles, so performance should be judged over at least one complete cycle, which can take ten years or more from peak to peak. Lastly, companies have to perform through significant en-
- 24. vironmental changes, which may occur less often than every decade. Hence, there is a case for exam- ining performance periods that are multiples of decades, and a number of previous well-known studies on performance have used periods of between 10 and 20 years.23 From the different evidence and arguments above, we selected 20 years as the relevant period for this study. [Frontier analysis] plots annual deviations to show how far a company is from the frontier each year, establishing a picture of performance over an entire period Long Range Planning, vol 42 2009 399 Qualifier: Cobham (Aerospace industry) Non-Qualifier: Reuters (Publishing industry) 0% 10% 20% 30% 40% 50%
- 25. 60% 70% 80% 90% 100% 1985 1987 1989 1991 1993 1995 1997 1999 2001 2003 0% 10% 20% 30% 40% 50% 60% 70% 80% 90% 100% 1985 1987 1989 1991 1993 1995 1997 1999 2001
- 26. Figure 3. Examples of Annual Deviations from Frontier. A Qualifier and a Non-Qualifier as Long Term Superior Performers One other problem of time period selection is sensitivity to start and end dates if the measure concerns total (or average) change from start point to end point. (We are all familiar with how company and fund managers select periods to maximise reported performance.) The frontier tech- nique avoids this problem by taking an annual (or other period) approach such that performance can be viewed as a pattern over multiple years, and with each year’s performance independent of previous ones. That is, the technique does not look at change from the previous year - it plots annual deviations to show how far a company is from the frontier each year, thereby establishing a picture of performance over the entire period (see example in Figure 3). Applying the frontier technique To demonstrate the approach here we conduct two sets of analyses. First, we use an analysis of se- lected companies in the oil industry in one year to show how frontier analysis can create a rank 400 Measuring Long Term Superior Performance order of performance across multiple measures. It also reveals the difficulty with averaging across measures and why a more robust approach is needed. Second, we use an analysis of 215 British companies over 20 years to show how the technique can indeed identify long-term superior performers.
- 27. Creating a rank order across multiple measures For the performance ranking analysis we selected the oil industry because it is particularly problem- atic. It contains large companies from many different countries that might also be assumed to stress different measures. Table 1 shows the 2002 rankings of 11 major oil companies from various coun- tries on seven different performance measures (see also Exhibit 3). What is revealed in the table is that it is not at all clear from considering the seven different measures which is the best overall per- former, which the worst, and how the others rank in between. Statoil (Norwegian) has the most first place rankings and seems to be the best performer: Conoco Phillips (American) has the most last place rankings, and seems to be the worst. But are these judgements correct? In particular, which measure or measures should dominate? And what should be the criteria for deciding on weights? Or should they all be weighted equally? The frontier technique avoids the need to make decisions on weights, merely on what measures to include.24 It is worth noting that the more measures that are included, the less important any single measure becomes (particularly if the measures entail, effec- tively, the same information) and also that measures that reveal no clear pattern of dominance are also less important as performance differentiators.25 In this exercise we compared the 2002 performance of each firm on each measure with the per- formance of all major oil companies (not just these eleven) on the same measures for all the years from 1984 to 2003. What this effectively does is determine benchmarks as firm/year combinations. In other words, the approach is both backward and forward
- 28. looking: firm performance is bench- marked against how well both it and other firms did, in both the past and the future. We found that the best frontier was determined by three of the seven measures - return on total assets (ROTA), total shareholder return (TRS) and Tobin’s q e and was defined by just four firm- year combinations - Lukoil in 1999, Royal Dutch Shell in 2001, PPT Public in 2002, and Sinopec in 1999: none of the other hundreds of combinations registered performance as good.26 We then cal- culated the efficiency (closeness to the frontier as defined by the three measures of ROTA, TRS and Tobin’s q) for each of the eleven companies in 2002, resulting in the overall ranking shown in Table 2. Now we can see that three companies share the first ranking: Statoil, Imperial Oil Table 1. Performance Rankings of Selected Oil Companies on Different Measures in 2002 Company and Nationality Profit Margin ROSF ROTA ROCE CFOPR TRS Tobin’s q BP (UK) 9th 8th 7th 7th 10th 8th 3rd Chevron Texaco (USA) 10th 10th 10th 10th 9th 5th 9th China Petroleum (CHN) 8th 9th 8th 8th 3rd 1st 11th Conoco Phillips (USA) 11th 11th 11th 11th 11th 4th 10th ENI (ITA) 2nd 3rd 4th 3rd 4th 9th 4th Exxon Mobil (USA) 6th 4th 5th 6th 8th 11th 6th
- 29. Imperial Oil (CAN) 4th 2nd 3rd 4th 7th 2nd 1st Royal Dutch Shell (NL) 5th 7th 2nd 5th 1st 10th 2nd Repsol YPF (ESP) 7th 5th 6th 2nd 6th 6th 8th Statoil (NOR) 1st 1st 1st 1st 5th 3rd 5th Unocal (USA) 3rd 6th 9th 9th 2nd 7th 7th Note: rankings are among these 11 companies only, not among all oil companies. Profit Margin ¼ Net Profit as Percentage of Revenues. ROSF ¼ Return on Shareholders Funds. ROTA ¼ Return on Total Assets. ROCE ¼ Return on Capital Em- ployed. CFOPR ¼ Cash Flow from Operations. TRS ¼ Total Return to Shareholders. Tobin’s q ¼ ratio of the market value of firm assets to their replacement cost. Long Range Planning, vol 42 2009 401 and Royal Dutch Shell, while Conoco Phillips remains last. Without this frontier analysis, we might have ranked Imperial Oil somewhat lower and Royal Dutch Shell much lower, as both ranked rel- atively low on several measures, but not (for the most part) on the three frontier-defining measures. Similarly, although Conoco Phillips did well (4th) on the TRS measure, adding the other two fron- tier defining measures dropped it to last place. What this example reveals is the value of using a more systematic approach to thinking about superior performance, and how the assumptions underlying the frontier approach can lead to
- 30. a more parsimonious way of thinking about how performance rankings are formed. It also reveals the limit of the performance information that we have available and how it is used. For example, the orderings we create indicate not only where performance dominance exists, but also where it does not, which is important in a world where performance league tables seek to make minute differences more significant. Our analysis thus implies a cautionary perspective: when dominance does not ex- ist it is much harder (indeed perhaps impossible) to draw meaningful conclusions about perfor- mance differences between sets of companies. Similarly, we are limited by the veracity of the data available. For example, in 2004 Royal Dutch Shell revealed that it had overstated its reserves by 20%.27 Of the numbers examined by us as ‘per- formance’ indicators, only TRS would have been influenced by that knowledge (as indeed it was, by more than 7%). Had reserves been in our performance measures, Shell’s restatement would have meant the company’s overall performance had been erroneously inflated. Examining performance over multiple years The previous analysis demonstrates how the frontier analysis technique can be used for one com- mon performance analysis task - ranking in one year within an industry. Next we demonstrate how the technique can be used for another common challenge e identifying a country’s best long term performers. Selection of industries and companies We selected those 38 industry sectors in the Osiris database (see
- 31. Exhibit 3) that had significant numbers of large UK companies, and for which complete and consistent data were available (Table 3 indicates which sectors we were able to analyse, and which not). We defined ‘large’ by the firm’s ranking by asset size in the world’s top 100 within its particular Dow Jones Classification Industry (in the few cases where there were less than 100 firms in a specific industry in the database we used the top 50 as the frontier). The two criteria of significant presence of UK companies and complete data meant that we excluded 43 industries, nearly all of which have few British companies Table 2. Performance Efficiency and Ranking of Selected Oil Companies in 2002 Company and Nationality Efficiency Rank Order Statoil (NOR) 100% 1st¼ Imperial Oil (CAN) 99% 1st¼ Royal Dutch Shell (NL) 99% 1st¼ ENI (ITA) 98% 4th BP (UK) 97% 5th¼ China Petroleum (CHN) 97% 5th¼ Repsol YPF (ESP) 97% 5th¼ Unocal (USA) 97% 5th¼ Chevron Texaco (USA) 95% 9th¼ Exxon Mobil (USA) 95% 9th¼ Conoco Phillips (USA) 93% 11th Efficiency ¼ performance relative to the frontier for 1984 to 2003. The frontier is defined as 100% efficiency. 402 Measuring Long Term Superior Performance
- 32. in the global top 50/100. The only notable exceptions were pharmaceuticals and various financial service industries, where large number of mergers and acquisitions over the 20 year time period caused severe data problems. (Various aggregations accounted for the 8 industries neither included nor excluded from the total number of 89 on the Osiris database.) Following from our earlier argument, prior work indicated to us that the DJIC offered more stable and more realistic Table 3. Industries Analysed and Not Analysed Industries Analysed Industries Not Analysed Advertising/Market Research Advanced Industrial Equipment Aerospace Agriculture Airlines Aluminium Apparel Auto Parts Broadcasting Automobile Building Materials Banks, Ex-S&L Casinos & Gaming Biotechnology Chemicals, Specialty Chemicals, Commodity Communications Clothing & Fabrics Department Stores Computers
- 33. Diversified Manufacturing Consumer Electronics Distillers & Brewers Consumer Services Drug Stores Cosmetics Entertainment Diversified Financial Food Diversified Technology Furnishings & Applications Electric Components Grocery Stores Factory Equipment Heavy Construction Financial Advisors Household Non-Durables Fixed-Line Communications Leisure Footwear Lodging Forest Products Medical Devices Healthcare Providers Medical Supplies Heavy Machinery Mining Home Construction Office Equipment Household Products, Durable Oil Industrial Services Paper Products Insurance, Full Line Precious Metals Insurance, Life
- 34. Publishing Insurance, Property Restaurants & Pubs Internet Services Retailers, Specialty Investment Services Ship Building Nonferrous Metals Shipping Oil Drilling, Equipment Soft Drinks Pharmaceuticals Steel Pipelines Telecoms Pollution Control Transport Services Real Estate Utilities Savings & Loans Semiconductors Software Tires Tobacco Toys Long Range Planning, vol 42 2009 403 classifications, given that some large publicly traded companies spanned as many as 50 4-digit SIC
- 35. codes, and that the DJIC system was actively used by both firms and analysts. (We tested the validity of our choice by conducting analyses using 3 digit SIC codes, but found the frontiers derived from them were much less stable and significantly less likely to produce interpretable results.) Selection of time period Following our earlier arguments for a 20-year period, we selected the time span of 1984 through 2003, mainly because the last year was the most current one in the database. This period is also particularly relevant for British companies, in that it starts around the time the Thatcher reforms began to affect the economy and the environment facing UK companies, as well as spanning at least one economic cycle - the boom and bust of the Internet bubble, as well as the stock market melt- down of 1987 - providing an extra test for sustained performance. Selection of measures For reasons of data availability we selected five measures: profit margin (%), return on share- holders’ funds (%), return on total assets (%), return on capital employed (%), and cash flow to operating revenues (%). As demonstrated in the analysis of oil companies, where only three mea- sures defined the frontier, the results from frontier analysis becomes less sensitive as more measures are added. Hence, we conclude that these five measures would give an adequate picture of a firm’s performance position without unnecessary duplication. We checked our results against alternate sets of measures, some of which included measures of return to shareholders (TRS and Tobin’s
- 36. q), but while these alternative sets produced additional qualifying companies, they always included those that qualified under the five measures reported here. Hence, any error from choice of mea- sures would have been of exclusion but not of inclusion. We chose the five measures because we wanted to be confident that the companies we labeled as long- term superior performers did indeed qualify under alternative sets of measures, but also to ensure that we had the largest possible data sample (for instance, including Tobin’s q led to approximately 10% missing data). Exhibit 3 Data Base For all the analyses in our study, we used the Osiris database (provided by Bureau van Dijk) which contains annual report data on 30,000 public companies (and 8,000 unlisted and de- listed companies) covering more than 125 countries from around the globe over the past 20 years. The standard problem in analysing companies relative to industries is that traditional indus- try classification systems, especially the Standard Industrial Classification, provide a poor match with the activities of diversified companies, having been designed with industries, not companies, in mind. Osiris uses the Dow Jones Global Segmentation Industry Classifica- tion (DJIC) scheme of 89 defined industries. This system assigns one dominant industry to each company (public companies only), and has the advantage of having been designed to achieve the best fit for the world’s existing companies and be
- 37. most relevant to investors and analysts. While the problems of classifying diversified companies can never be com- pletely eliminated, the Dow Jones classifications in fact work remarkably well for capturing the actual diversified patterns of most companies with the lowest level of error.20 only 28 out of 215 firms e a mere 13% of all UK firms estayed close to the frontier consistently over our twenty-year period 404 Measuring Long Term Superior Performance Selection of performance criteria For a company to qualify as a long-term superior performer we used criteria that accounted for both the firm’s relative position and its consistency of performance. The operative criteria were how close to the performance frontier a company was year-by- year over the twenty-year period, and whether it stayed close to the frontier consistently over those years. In the end, we found that only 28 out of 215 firms e i.e., a mere 13% of all UK firms e were ‘qualifiers’ that fell into this set. The specific criteria used to determine whether or not a firm qualified as a superior long-term performer, in order of stringency, were: 1. The firm had to have been in existence for 20 years. This criteria ensured we had long-term performers;
- 38. 2. The firm had to have been in the top one-third of the performance distribution in its industry peer set during the 20-year period. In other words, when compared to its industry frontier, it had to be in the top one-third of performers on average over this period. This represents the relative performance criterion e the average deviations from the frontier are represented in the data given earlier in Figure 2. 3. The firm could not have recorded more than two years of consecutive performance decline, in only one of which could it have fallen out of the top third of performers in its industry. In other words, a firm that, on average, had been in the top one- third over the 20-year period could register two years of declining performance, including one year out of the top third of performers e a longer (or deeper) decline would have disqualified the firm based on the consistency of performance criterion. While other researchers, analysts or managers might choose other specific criteria, those we used were specifically aimed at addressing the issues of: (1) performance relative to peer comparators and (2) consistency of performance over time. It is important to recognise that more or less stringent criteria would not change the order of firms or limit the reliability of the technique - it would just change the definition of what it means to be in the set of superior long-term performers. Annual deviation from the frontier Once the performance frontier was created for a particular industry, each company’s ‘deviation’ for
- 39. each year (their distance from the frontier) was calculated. As we determined the performance fron- tier for 20 years, we were able to plot each company’s performance relative to the frontier over time: this approach is illustrated in Figure 3 for two companies. The first e the aerospace company Cob- ham e easily qualified on the three criteria, as is illustrated by the bar chart of their deviation from the frontier, which shows that, in every year, Cobham was above the 90th percentile of performance relative to the frontier. By contrast, the second company e the publishers Reuters - shows the power of observing annual deviations. While Reuters performed very well for the 15 years from 1985 to 1999 (and was even the frontier performer with a value of 100% in 1999) it then went into rapid decline, and fell below 40% in 2003, thus clearly failing both criteria 2 and 3. The Reuters example shows how examining the annual deviation from the frontier reduces the sensitivity to start and end dates for measures of performance over a time period. Reuters was indeed a superior performer until its change of strategy in 2001 to diversify into Internet-related businesses. (Simi- larly, Vodafone would probably also have been at risk of dropping off the list if the analysis were extended into 2006). The qualifying UK industries and companies Using our selected measures and criteria, our analysis of the 215 UK companies in the 38 industries iden- tified 28 companies in 19 industries as qualifying as long term superior performers (Table 4). Some of these qualifiers e such as BP, Cadbury-Schweppes and Tesco e could probably have been named by most casual observers before our analysis, while others, such as
- 40. AG Barr and Bespak, are much less well known. And some well-known companies, such as Unilever and Whitbread, might well not have Long Range Planning, vol 42 2009 405 featured on most lists of best performers, even though our analysis shows that they should. As with all rankings of performance, we have to stress that the ranking applies only for the time period studied, and is not necessarily a predictor of future performance. Apart from anything else, any company with a long period of sustained superior performance must be in danger of developing obsolescence in its business models and strategies, as well as increasing competitive envy, imitation or challenge. In examining Table 4 it should be noted that the distance between the average performance ef- ficiency level and the frontier performers may seem quite small. But it should be remembered that there are three criteria and it is consistency (criterion 3) that is the final determinant. Many firms have outstanding years, but few can remain outstanding with any regularity. That said, it is also telling (and consistent with notions of erosion of performance) that few UK companies are con- stantly at the very edge of the frontier, with the possible exceptions of Balfour, Huntleigh Technol- ogy, the aerospace firms (Cobham, Meggitt and Smiths), and Shell (bearing in mind its wrongly stated profits), each of which was a frontier firm in one or several years. Vodafone also defined the telecommunications frontier in its early years, but has remained a frontier performer not be-
- 41. cause of outstanding absolute performance but because its performance has declined less steeply than that of the industry as a whole. It is not the purpose of this article to explain in depth why each company qualified e in fact the reasons tend be very different in each case. Nevertheless, we can discern three broad categories that Table 4. UK Companies Qualifying as Long Term Superior Performers (1984 to 2003) Industry (Average Performance Efficiency, Firm by Year) Companies Firm Average Performance Efficiency Advertising (80%) Taylor Nelson Sofres 85% Aerospace (89%) Cobham 94% Meggitt 93% Smiths Group 95% Alcoholic Beverages (85%) Allied Domecq 88% Scottish & Newcastle 88% Apparel (74%) Next 80% Casinos & Gaming (76%) Hilton Group 80% Stanley Leisure 80%
- 42. Construction (92%) Balfour 96% Drugstores (87%) Boots 92% Entertainment (87%) EMI Group 90% Food (81%) Cadbury-Schweppes 87% Unilever 84% Grocery Stores (63%) Tesco 68% Household Non-Durables (65%) Reckitt Benckiser 70% Medical Devices (79%) Smith & Nephew 83% Medical Supplies (88%) Bespak 92% Huntleigh Technology 95% Office Equipment (90%) Domino Printing 92% Oil (75%) BG Group 77% BP 78% Shell 99% Paper Products (74%) Bunzl 86% Restaurants & Pubs (56%) Greene King 58% Whitbread 58% Soft Drinks (88%) AG Barr 90%
- 43. Telecom (92%) Vodafone 95% 406 Measuring Long Term Superior Performance provide a glimpse at some of the strategic orientation and market circumstances of superior per- forming companies that we label ‘large survivors,’ ‘protected nichers’ and ‘successful challengers’ (see Table 5). The ‘large survivors’ (typified by Shell, Unilever, Balfour and Reckitt Benckiser) were already large, successful and well-established at the start of the 20-year period.28 Many operated in compet- itive, but not punitive, environments, while some (such as the aerospace companies Cobham, Meg- gitt and Smiths Group, with their links to the defence establishment) operated in semi-protected environments. These companies had starting positions where size and market dominance, com- bined with some evolutionary changes in strategy, helped them to sustain their long-term superior performance. The ‘protected nichers’ are typified by AG Barr (a Scottish company making specialised beverages such as ‘Irnbru’) and Bespak (a producer of drug delivery and similar medical devices). These com- panies typically remained in their niches, excelling within them, but were less exposed to direct competition. The ‘successful challengers’ - perhaps the most interesting
- 44. group e are typified by BP, Cad- bury-Schweppes, Smith & Nephew, Next and Tesco. Most of these companies started out as medium-sized companies facing much larger, formidable competitors, but over the twenty-year period transformed not only their mix of businesses, but also their business and management models. It is not the identity of the companies that matters, nor have we produced a list of all long-term superior performing British companies over the period 1984 to 2003. What matters is that the fron- tier technique can produce a list of winners (or losers or any other ranking) from a diverse group while avoiding the common problems of recency effects (where observers remember only recent performance), insufficient number of measures, and inappropriate comparators. Table 5. UK Long Term Superior Performers by Categorization Industry Sector Large Survivors Protected Nichers Successful Challengers Advertising Taylor Nelson Sofres Aerospace Cobham Meggitt Smiths Group Alcoholic Beverages Allied Domecq Scottish & Newcastle Apparel Next
- 45. Casinos & Gaming Hilton Group Stanley Leisure Construction Balfour Drugstores Boots Entertainment EMI Group Food Unilever Cadbury-Schweppes Grocery Stores Tesco Household Non-Durables Reckitt Benckiser Medical Devices Smith & Nephew Medical Supplies Bespak Huntleigh Technology Office Equipment Domino Printing Oil BG Group BP Shell Paper Products Bunzl Restaurants & Pubs Greene King Whitbread Soft Drinks AG Barr Telecom Vodafone Long Range Planning, vol 42 2009 407
- 46. Discussion Prior research studies in strategy, particularly those related to the resource-based and dynamic capabil- ities theories, have emphasized firm specific advantage and sustainable performance. However, nearly all the empirical modelling of performance has utilised approaches based on central (average) tenden- cies. Our use of frontier based modelling is better aligned with both theory - in that we address the crit- ical issues underlying what Kirby has called the ‘quixotic quest’ for a singular robust assessment of superior performance, and make maximal (not average) performance tendencies the focus of our at- tention - and also managerial practice - where companies look to improve performance by benchmark- ing extreme comparators (those on the frontier of performance). Here our approach should make it easier for managers to achieve sustained long-term superior performance by making it easier to meet the three critical challenges of performance measurement identified at the beginning of the article. empirical modelling of performance is usually based on averages. Frontier based modelling makes maximal performance the focus [just as] companies look to improve by benchmarking extreme comparators For Challenge 1 e Balancing Short-Term and Long-Term Performance, frontier analysis allows the use of measures over any time period and the visual display of annual deviations (as illustrated by the Cobham and Reuters examples) makes it easier to identify different periods of superior or in- ferior performance. More important, frontier analysis allows a
- 47. clear view of how performance tracks over time relative to a defined maximum set by selected peers. Such comparisons can, of course, also be done with simple benchmarking comparisons, but these suffer from the need to show either many individual measures or an arbitrarily formed composite, which itself involves the problem of how to construct the composite, and the need to force all companies to be measured against the same benchmark. Frontier analysis is expressly designed to meet Challenge 2 e The Conflicts between Different Mea- sures of Performance. Any number of measures can be used, with the additional benefit that the tech- nique can reveal the smallest subset of measures that best defines performance in a particular industry. In particular, frontier analysis allows different firms to be compared even when they them- selves are being managed to different criteria. Our oil company analysis illustrates how varying per- formance on eight different measures can be reconciled to produce a clear ranking of performance. For Challenge 3 e Finding the Right Comparators, frontier analysis does not eliminate the prob- lem of company diversity, but reduces its effect by allowing different companies to, in effect, select their own dimensions of performance. For example, in our analysis of UK companies, both Cad- bury-Schweppes and Unilever qualified in the food category, even though they have quite different product mixes. For companies with sufficiently diverse businesses that they might need to be an- alysed in more than one industry, the exercise can be repeated placing the company in different
- 48. sectors. If the answer comes out different - for example, if the same company shows up as a long-term superior performer when compared to its peers in one industry but not in another e that is a valuable result, which the company might use to consider rebalancing its portfolio of businesses towards those sectors where it qualifies as a long- term superior performer and away from those in which it does not. By meeting these challenges, frontier analysis, applied in the context of strategic performance, can improve strategic management or investment analysis in a number of ways. As emphasized in this article, there is clear application to the comparison of performance at company level, allowing for different comparators and coping with the problem of corporate diversification. As argued above, this technique can be used as an adjunct to business portfolio analysis to evaluate whether a com- pany is in the right mix of industries. Similar benefits e of coping with a diverse comparator group 408 Measuring Long Term Superior Performance and strategic situations e can apply in using the method to compare business units within a com- pany: since frontier analysis allows each unit to excel on its performance dimensions, this technique can be particularly helpful in adjusting for the differing emphases of different units over time, par- ticularly depending on their age and strategic objectives. One business unit might reach the frontier in terms of sales growth, another in terms of profits and yet a third in terms of the combination of
- 49. the two e but at the same time others may be revealed to be below the frontier over many years and on many criteria. Thus the technique could also help in the perennial problem of deciding compen- sation for top managers in a multi-divisional company, when the divisions’ value drivers may be quite different and call for differing performance measurements. Investment analysts can conduct the same analyses, especially for comparison across rather than within companies (partly because that is their focus and also because they only have access to public data). Our comparison of average industry efficiencies (Figure 2) is also very valuable to analysts in their searches for companies that are likely to greatly outperform (or underperform) their industry peers. Our results show the relative prospects of all the industries we analysed, pointing to the air- line industry (with the highest average efficiency from 1984 to 2003) as the worst in which to look for outperformers and the marine shipping industry as the best. This logic also holds when looking beyond financial performance measures. Our analysis and ex- amples here are limited by the use of purely financial measures of firm performance - and hence depend on the veracity of data drawn from firms’ financial statements. But this does not mean the approach could not be expanded to include non-financial measures, such as exemplified by the ‘triple bottom line’. Indeed, it is arguable that the non- parametric nature of DEA makes it par- ticularly suited for broad comparisons between what are more independently determined perfor- mance characteristics. As analysts become more open to triple bottom line accounting, the use
- 50. of an approach like ours will potentially allow them to make more clear and substantive compar- isons between competitors. One can also speculate as to the value of the approach for examining the performance differences of multinational subsidiaries operating in different geographic markets. The logic is no different than that discussed in the business portfolio argument, except that perfor- mance differences can now be more readily related to the economic, political or cultural differences of different subsidiaries’ operating locations. [frontier analysis] can be expanded to include non-financial measures. As ‘triple bottom line’ accounting [gains ground], our approach will potentially allow for more clear and substantive comparisons [across] more independent performance characteristics In conclusion, our frontier approach implies that managers, analysts and researchers need to take a more complex conceptual view of what it means to have long- term superior performance and to think more deeply about how to measure that performance. However, at the same time it follows that simple benchmark comparisons can e as Gigerenzer et al. note - potentially provide managers and analysts with a powerful logical heuristic that can help them make quicker and better decisions. Although our approach is technical, the logic itself can be applied easily to small sets of firms (as shown in the oil industry example). Such an approximation is logically consistent with our approach and theoretically consistent with extant thinking in
- 51. strategy. Acknowledgements We thank the Editor in Chief and the journal’s anonymous reviewers for their encouragement and advice, as well as our colleagues in the Advanced Institute of Management Research for their many Long Range Planning, vol 42 2009 409 comments and suggestions. We acknowledge funding assistance from the Economic and Social Research Council and the Engineering and Physical Sciences Research Council. Appendix: Methodology Normal approaches in strategy and management (and indeed industrial organization in general) rely on comparisons between mean cross-sections of firms (as would be the case with regression analysis or ANOVA). Population ecology studies rely on survivorship analyses that do not distin- guish between levels of survivorship, while more qualitative assessments have often suffered from ex-post sampling problems (the most famous case being Peters and Waterman’s In Search of Excellence). Frontier analysis Our approach is based on ‘Frontier Analysis,’ which has a long tradition in economics and oper- ations research, particularly for estimating production functions and benchmarking activities. It is based on the simple logic that it is the extremes of the distribution in the data that are of interest e in the case of production, the minimum (rather than the mean)
- 52. costs associated with a volume of output. In our case it is the maximum performance that is the focus. Two approaches are used. One e Data Envelopment Analysis (DEA) e is a linear programming approach that allows for assessment of multiple outputs and can handle small samples, but (as Charnes et. al note) suffers from the fact that it is non-parametric. The other, Stochastic Frontier Analysis (SFA), is a parametric approach that accounts for the stochastic character of the data, but requires larger sample sizes and can accommodate only one dependent variable.29 For this study we chose to use DEA as a means of creating a sample of ‘frontier’ performers because it allows us to make use of multiple measures of performance and impose a more stringent set of criteria that requires firms to be extreme on more than one dimension of performance. This is critical in our case, as our reliance on DEA and sec- ondary data means that we could make selection errors if we used a limited number of performance criteria. The output of interest to us is the performance efficiency of a firm, measured across multiple criteria and based on a comparison with a global industry peer set. Figure 1 shows how such a per- formance measure is calculated in a situation with 2 output measures (space precludes us from go- ing into greater detail). The maximum efficiency measure is 1 and numbers below 1 can be roughly interpreted as percentage deviations from the frontier. Empirically, efficiency is measured as a radial projection from the origin to the nearest point on the frontier in the space defined by the dimen- sions of performance. Frontier analysis puts heavy requirements on the quality and comparability of data. Hence, we estimate the frontiers on an industry-by-
- 53. industry basis using comparable measures of performance (excluding e.g. taxation, depreciation and other factors that would be distorted by different countries’ accounting standards). The logic for the use of DEA in management research is outlined in a number of papers and can be justified with recourse to resource based and capabilities thinking.30 The resource based theory and dynamic capabilities approaches emphasise the unique, path dependent, causally ambiguous components of a firm’s structure as major determinants of long- term strategic performance. How- ever, tests in these theories traditionally rely on analyses that compare the mean performances of different cross-sections: by emphasizing extreme performances, DEA is more in line with the logic of current strategy theory. Selection of firms The logic is that a firm is being benchmarked not just against other firms’ performance in a given year but against any firm’s performance in any given year. Therefore, each combination of firm-year potentially represents a frontier performance against which other firm-years can be compared. This creates several complications for which adjustments needed to be made. First, all the performance measures must be computed in comparable terms (including adjusting for currency changes and inflation) and based on criteria specific to the industry. Second, where an industry shows changes 410 Measuring Long Term Superior Performance
- 54. in average performance efficiency over time we need to adjust the distribution to account for such temporal patterns. For example, the telecoms industry showed no change in average efficiency until around 2000 when the average firm’s efficiency declined. Figure 3 shows the example of Reuters in the publishing industry, which was excluded based on criteria 2 and 3: despite being a frontier per- former in 1999 and having quite good performance at times (average performance efficiency in its industry is 65%), its performance was erratic and registered a significant collapse over the last four years of the study period. References 1. T. J. Peters and R. H. Waterman, Search of Excellence: Lessons from America’s Best Run Companies, Harper & Row, New York, (1982) However, even those companies they identified as superior long-term per- formers soon fell back to average or worse since, by selecting firms based on a small number of criteria for a limited period of time, they failed to account for the natural variability and stickiness in perfor- mance. What was discovered (but not by Peters and Waterman) was that most of their ‘excellent’ firms had regressed to the mean by the time the second edition of their very popular book went to press. See Who’s excellent now?, Business Week 5, 76e86 (Nov 5, 1984); K. E. Aupperle, W. Acar and D. E. Booth, An empirical critique of in search of excellence: how excellent are the excellent companies?, Journal of Management 12(4), 499e512 (1986); P Rosenzweig, Misunderstanding the nature of company perfor- mance: the Halo effect and other delusions, California
- 55. Management Review 49, 6e20 (2007). 2. P. J. Richard, T. M. Devinney, G. S. Yip and G. Johnson, Measuring organizational performance: towards methodological best practice, Journal of Management, 35(3), 718–804 (2009). 3. D. F. Abell, Managing with Dual Strategies: Mastering the Present e Preempting the Future, The Free Press, New York (1993). 4. This can be seen in the October 2001 issue of Academy of Management Review, which was devoted to time and organisational research. See also T. Wright, The importance of time in organisational research, Acad- emy of Management Review 27, 343e345 (2001). 5. See R. S. Kaplan and D. P. Norton, The balanced scorecard e measures that must drive performance, Har- vard Business Review 71e79 (JanuaryeFebruary 1992); R. S. Kaplan and D. P. Norton, The Balanced Scorecard, Harvard Business School Press, Boston (1996). 6. For the theoretic background, see T. M. Devinney, D. F. Midgley and S. Venaik, The organisational im- perative and the optimal performance of the global firm: formalizing and extending the integrationeres- ponsiveness framework, Organization Science 11, 674e695 (2000); and for a technical discussion of strategic application dominance see T. M. Devinney, D. F. Midgley and S. Venaik, Managerial beliefs, mar- ket contestability and dominant strategic orientation in the eclectic paradigm, in J. Cantwell and R. Narula (eds.), Reevaluating the Eclectic Paradigm, Routledge, London (2003).
- 56. 7. There are many discussions of the GE saga. Two relevant cases to the discussion here are C. A. Bartlett, GE’s Growth Strategy: The Immelt Initiative, Harvard Business School, (2006) Case 9-306-087. and C. A. Bartlett and M. Wozny, GE’s Two Decade Transformation: Jack Welch’s Leadership, Harvard Business School, (2002) Case 9-399-150. See also J. Useem, Meet ‘da man’: GE’s new CEO, Fortune 14, 102e106 (2001); and N. Brynes, Was Jack Welch’s run all it was cracked up to be?, Business Week 86e87 (29 April 2002). 8. For TRS, see, for example A. Rappaport, Creating Shareholder Value: The New Standard for Business Per- formance, Wiley, New York (1986); M. G. Danielson and E. Press, Accounting returns revisited: evidence of their usefulness in estimating economic returns, Review of Accounting Studies 8, 493e530 (2003); For a review of the extensive literature on the differences between the Anglo-Saxon, Continental and Japanese business systems, see R. Dore, Stock Market Capitalism: Welfare Capitalism. Japan and Germany versus Anglo-Saxons, Oxford University Press, New York (2000); M. Aoki, Towards a Comparative Institutional Analysis, MIT Press, Cambridge, MA (2001). 9. G. D. Dowling and P. W. Roberts, Corporate reputation and sustained superior financial performance, Strategic Management Journal 23, 1077e1093 (2002). 10. See S. R. Bond and J. G. Cummins, The stock market and investment in the new economy: some tangible facts and intangible fictions, Brookings Papers on Economic Activity 1, 61e108 (2000); G. Day, A. J. Fein and G. Ruppersberger, Shakeouts in digital markets: lessons from B2B exchanges, California Management
- 57. Review 45(2), 131e150 (2003). Long Range Planning, vol 42 2009 411 11. For a more technical and comprehensive comparison, readers are directed to T. M. Devinney, G. Johnson and G. S. Yip, Using frontier analysis to evaluate company performance, British Journal of Management, in press. 12. M. J. Farrell, The measurement of productive efficiency, Journal of the Royal Statistical Society 120(3), 253e281 (1957); A. W. Charnes, W. W. Cooper and E. Rhodes, Measuring the Efficiency of Decision- Making Units, European Journal of Operational Research 2(6), 429e444 (1978); W. W. Cooper, Opera- tional research/management science: where it’s been. where it’s going?, Journal of the Operational Research Society 50(1), 3e11 (1997). 13. D. Banker and A. Maindiretta, Nonparametric analysis of technical and allocative efficiencies in produc- tion, Econometrica 56(6), 1315e1332 (1988). 14. G. Gigerenzer, P. M. Todd and ABC Research Group, Simple Heuristics that Make Us Smart, Oxford Uni- versity Press, Oxford (2000). 15. Examples can be found in W. Cook and J. Zhu, Data Envelopment Analysis: Modelling Operational Pro- cesses and Measuring Productivity, Createspace, Scotts Valley (2008); and J. Zhu, Quantitative Models for Performance Evaluation and Benchmarking, Springer, New York (2002).
- 58. 16. T. M. Devinney and H. Milde, Agency contracting and inside debt, Schweizerische Zeitschrift für Volkswirt- schaft und Statistik 129, 97e111 (1990). 17. Quoted in J. Kirby, Toward a theory of high performance, Harvard Business Review 83(7), 30e39 (2005). 18. Industry and market segment effects on performance are well established. Various studies have examined the relative contributions of industry, company and business unit effects on firm performance. See par- ticularly R. Schmalensee, Do markets differ much?, American Economic Review 75(3), 341e351 (1985); R. Rumelt, How much does industry matter?, Strategic Management Journal 12(3), 167e185 (1991); A. M. McGahan and M. E. Porter, How much does industry matter, really?, Strategic Management Journal 18(special issue, summer), 15e30 (1997); G. Hawawini, V. Subramanian and P. Verdin, Is performance driven by industry-or firm-specific factors? A new look at the evidence, Strategic Management Journal 24(1), 1e16 (2003); Similarly, it is well established that the extent of international activities affects com- pany performance: see S. Tallman and J. T. Li, Effects of international diversity and product diversity on the performance of multinational firms, Academy of Management Journal 39(1), 179e197 (1996); M. Hitt, R. Hoskisson and H. Kim, International diversification: effects on innovation and firm performance in product-diversified firms, Academy of Management Journal 40(4), 767e799 (1997); Y. Luo, Industry at- tractiveness, firm competence, and international investment performance in a transitional economy, Bulletin of Economic Research 50(1), 73e83 (1998). Lastly, presence in particular countries exposes a com- pany to each country’s particular economic conditions. For the
- 59. case for cross-border comparisons, see P. Ghemawat, Semi-globalization and international business strategy, Journal of International Business Studies 34(2), 138e152 (2003). 19. M. E. Porter, Competitive Strategy: Techniques for Analyzing Industries and Competitors, Free Press, New York (1980). 20. The problems with using SIC codes as a measure of industry are discussed in R. N. Clarke, SICs as delineators of economic markets, Journal of Business 62, 17e31 (1984); For an in-depth study using the Osiris data base industry classification, see G. S. Yip, A. M. Rugman and A. Kudina, International success of British companies, Long Range Planning 39(3), 241e264, (2006) which also shows that the Dow Jones industry classifications are comparable to but generally better than classifications based on the Standard Industrial Classification (SIC code) system. 21. For competitive positioning, see G. S. Yip, A. M. Rugman and A. Kudina (2006), ibid.; For superior re- sources, see J. B. Barney, Firm resources and sustained competitive advantages, Journal of Management 17, 99e120 (1991). 22. Morgan Stanley, The Competitive Edge, Morgan Stanley, New York (1998). 23. Peters and Waterman (1982), op. cit. at Ref 1, used 20 years; J. P. Kotter and J. L. Heskett, Corporate Cul- ture and Performance, Free Press, New York, (1982) used 11 years; J. C. Collins and J. I. Porras, Built to Last: Successful Habits of Visionary Companies, HarperBusiness, New York, (1994) used up to 15 years;
- 60. R. Foster and S. Kaplan, Creative Destruction: Why Companies that are Built to Last Underperform the Market - and How to Transform Them, Currency/Doubleday, New York, (2001) used 15 years. W. Joyce, N. Nohria and B. Roberson, What Really Works: The 4 + 2 Formula for Sustained Business Success, Harper- Business, New York, (2003) used 10 years. For a review of these studies, see also J. Kirby, Toward a theory of high performance, Harvard Business Review 30e39 (JulyeAugust 2005). 412 Measuring Long Term Superior Performance 24. Frontier analysis has the added advantage of being flexible with respect to weighting. One could, if desired, weight the various measures according to some rule - in this analysis we assume that any measure is equally valid and what matters is the mixture of measures. 25. This is consistent with E. H. Feroz, S. Kim and S. L. Raab, Financial statement analysis: a data envelop- ment analysis approach, Journal of the Operational Research Society 54, 48e58, (2003) They specifically note that DEA is particularly useful when different output measures are providing different pieces of information and interpretation is problematic. 26. The frontier with 3 measures was as good as others with more measures. In other words, little if any ad- ditional information was gleaned from the other measures and hence a simpler frontier could be formed without any loss of generality. The firm-year combinations represented the highest performance combi- nations over the full study period from the full list of all major oil companies e this accounts for the fact
- 61. that three of these four companies do not appear in Tables 1 and 2. 27. H. Timmons, S.E.C. Investigating Shell’s restatement of oil and gas reserves, New York Times, (20 February 2004) C6. 28. Reckitt & Colman PLC and Benckiser NV were separate large companies that merged in 1999 to form Reckitt Benckiser. 29. P. Bauer, Recent developments in the econometric estimation of frontiers, Journal of Econometrics 46, 39e56 (1991). 30. D. L. Day, A. Y. Lewin and S. H. Li, Strategic leaders or strategic groups: a longitudinal data envelopment analysis of the U.S. brewing industry, European Journal of Operations Research 80, 619e638 (1995); T. M. Devinney, D. F. Midgley and S. Venaik, (2000), op. cit. at Ref 5; D. J. Teece, G. Pisano and A. Shuen, Dynamic capabilities and strategic management, Strategic Management Journal 18, 509e533 (1997). Biographies George S. Yip is Dean of Rotterdam School of Management, Erasmus University. He was previously Director of Research and Innovation at Capgemini Consulting, a professor at London Business School and Cambridge Uni- versity, and Lead Senior Fellow of the U.K.’s Advanced Institute of Management Research. He is the author of Total Global Strategy (1992 and 2003, published in ten languages) and Managing Global Customers (2007). The Times
- 62. Higher Educational Supplement ranked him as one of the UK’s twelve most successful academic consultants in any discipline. Rotterdam School of Management, Erasmus University, Burgemeester Oudlaan 50, 3062 PA Rotterdam, The Netherlands. Phone +31 (0)10 408 1901; fax +31 (0)10 408 2296 e-mail: [email protected] Timothy M. Devinney is Professorial Research Fellow at the Australian School of Business at the University of New South Wales. While conducting this research he was an International Visiting Fellow of the U.K.’s Advanced In- stitute of Management Research, a Humboldt Foundation Research Awardee and Rockefeller Foundation Bellagio Fellow. Australian School of Business, University of New South Wales, Sydney NSW 2052, Australia. Phone +61 (2) 8006 0048; fax +61 (2) 9663 4672 e-mail: [email protected] Gerry Johnson is Professor of Strategic Management at Lancaster University Management School and also a Senior Fellow of the U.K.’s Advanced Institute of Management Research. His research interests focus on management processes of strategy development and strategic change. He has published a number of books and written numerous papers in the field of Strategic Management. Exploring Corporate Strategy, of which he is co-author, is the best selling text on Strategy in Europe and regularly appears in the Top 10 Business Books in the UK. Advanced Institute
- 63. of Management Research and Lancaster University Management School, Lancaster, LA1 4YX UK. Phone +44 (0)1524 592374; fax +44 (0)1524 594720 e-mail: [email protected] Long Range Planning, vol 42 2009 413 mailto:[email protected] mailto:[email protected] mailto:[email protected]Measuring Long Term Superior PerformanceOutline placeholderChallenge 1 - balancing short- term and the long-term performanceChallenge 2 - the conflicts between different measures of performanceChallenge 3 - finding the right peer comparatorsProblems in measuring performanceThe frontier approach to measuring performanceWhat a performance frontier looks likeChoosing measures of performanceChoice of comparatorsControlling for industry effectsSelection of time periodApplying the frontier techniqueCreating a rank order across multiple measuresExamining performance over multiple yearsSelection of industries and companiesSelection of time periodSelection of measuresSelection of performance criteriaAnnual deviation from the frontierThe qualifying UK industries and companiesDiscussionAcknowledgementsMethodologyFrontier analysisSelection of firmsReferences Explain the following in 100 or more words each. · Task Manager · The windows Registry · Format Disk · Hard Disk Defrag/Optimize · Control Panel · Environment Variables · User Profiles
- 78. w es t(s um (o f(r an ki ng s( fo r( a( gi ve n( ye ar (is de cl ar ed (to (s et (th e( pe rf or m
- 88. at )h as )th e) lo w es t)s um )o f)r an ki ng s) fo r) th e ye ar )o n) th e) di ffe re nt )in di
- 95. th re e( ye ar s. • Su pp os e( yo u( dr ew (th e( fo llo w in g( ta bl e( on (th e( fo llo w in
- 102. A ,%1 %fo r% Sa le s% gr ow th ,%a nd %1 fo r% M TB %fo r% th e% gr an d% to ta l%o f%4 ).% Fi rm
- 107. ). • Th e% be st %p er fo rm er %in %y ea r% 3% w as %fi rm %C %(w ith %a %to ta l%o f%4 ),% fo
- 108. llo w ed by %fi rm %A %(a %to ta l%o f%5 ).% Fi rm %B %w as %th e% w or st %in %y ea r% 3% (a %to
- 110. ng le 'fi rm 'd em on st ra te d' su st ai ne d' hi gh 'lo ng 5t er m pe rf or m an ce .'F ir m
- 116. e' fa st es t'i n' ou r' sa m pl e. 'It 'w as 'ra nk ed 'fi rs t'i n gr ow th 'in 'a ll' th re e'
- 124. co ns is te nt ly *n ea r* th e* pe rf or m an ce *fr on Ce r (n ot *n ec es sa ri ly *a t*t he
- 129. =& ne t&p ro fit &/ &to ta l&r ev en ue • Re tu rn &o n& as se ts &= &n et &in co m e& /& to ta l&a