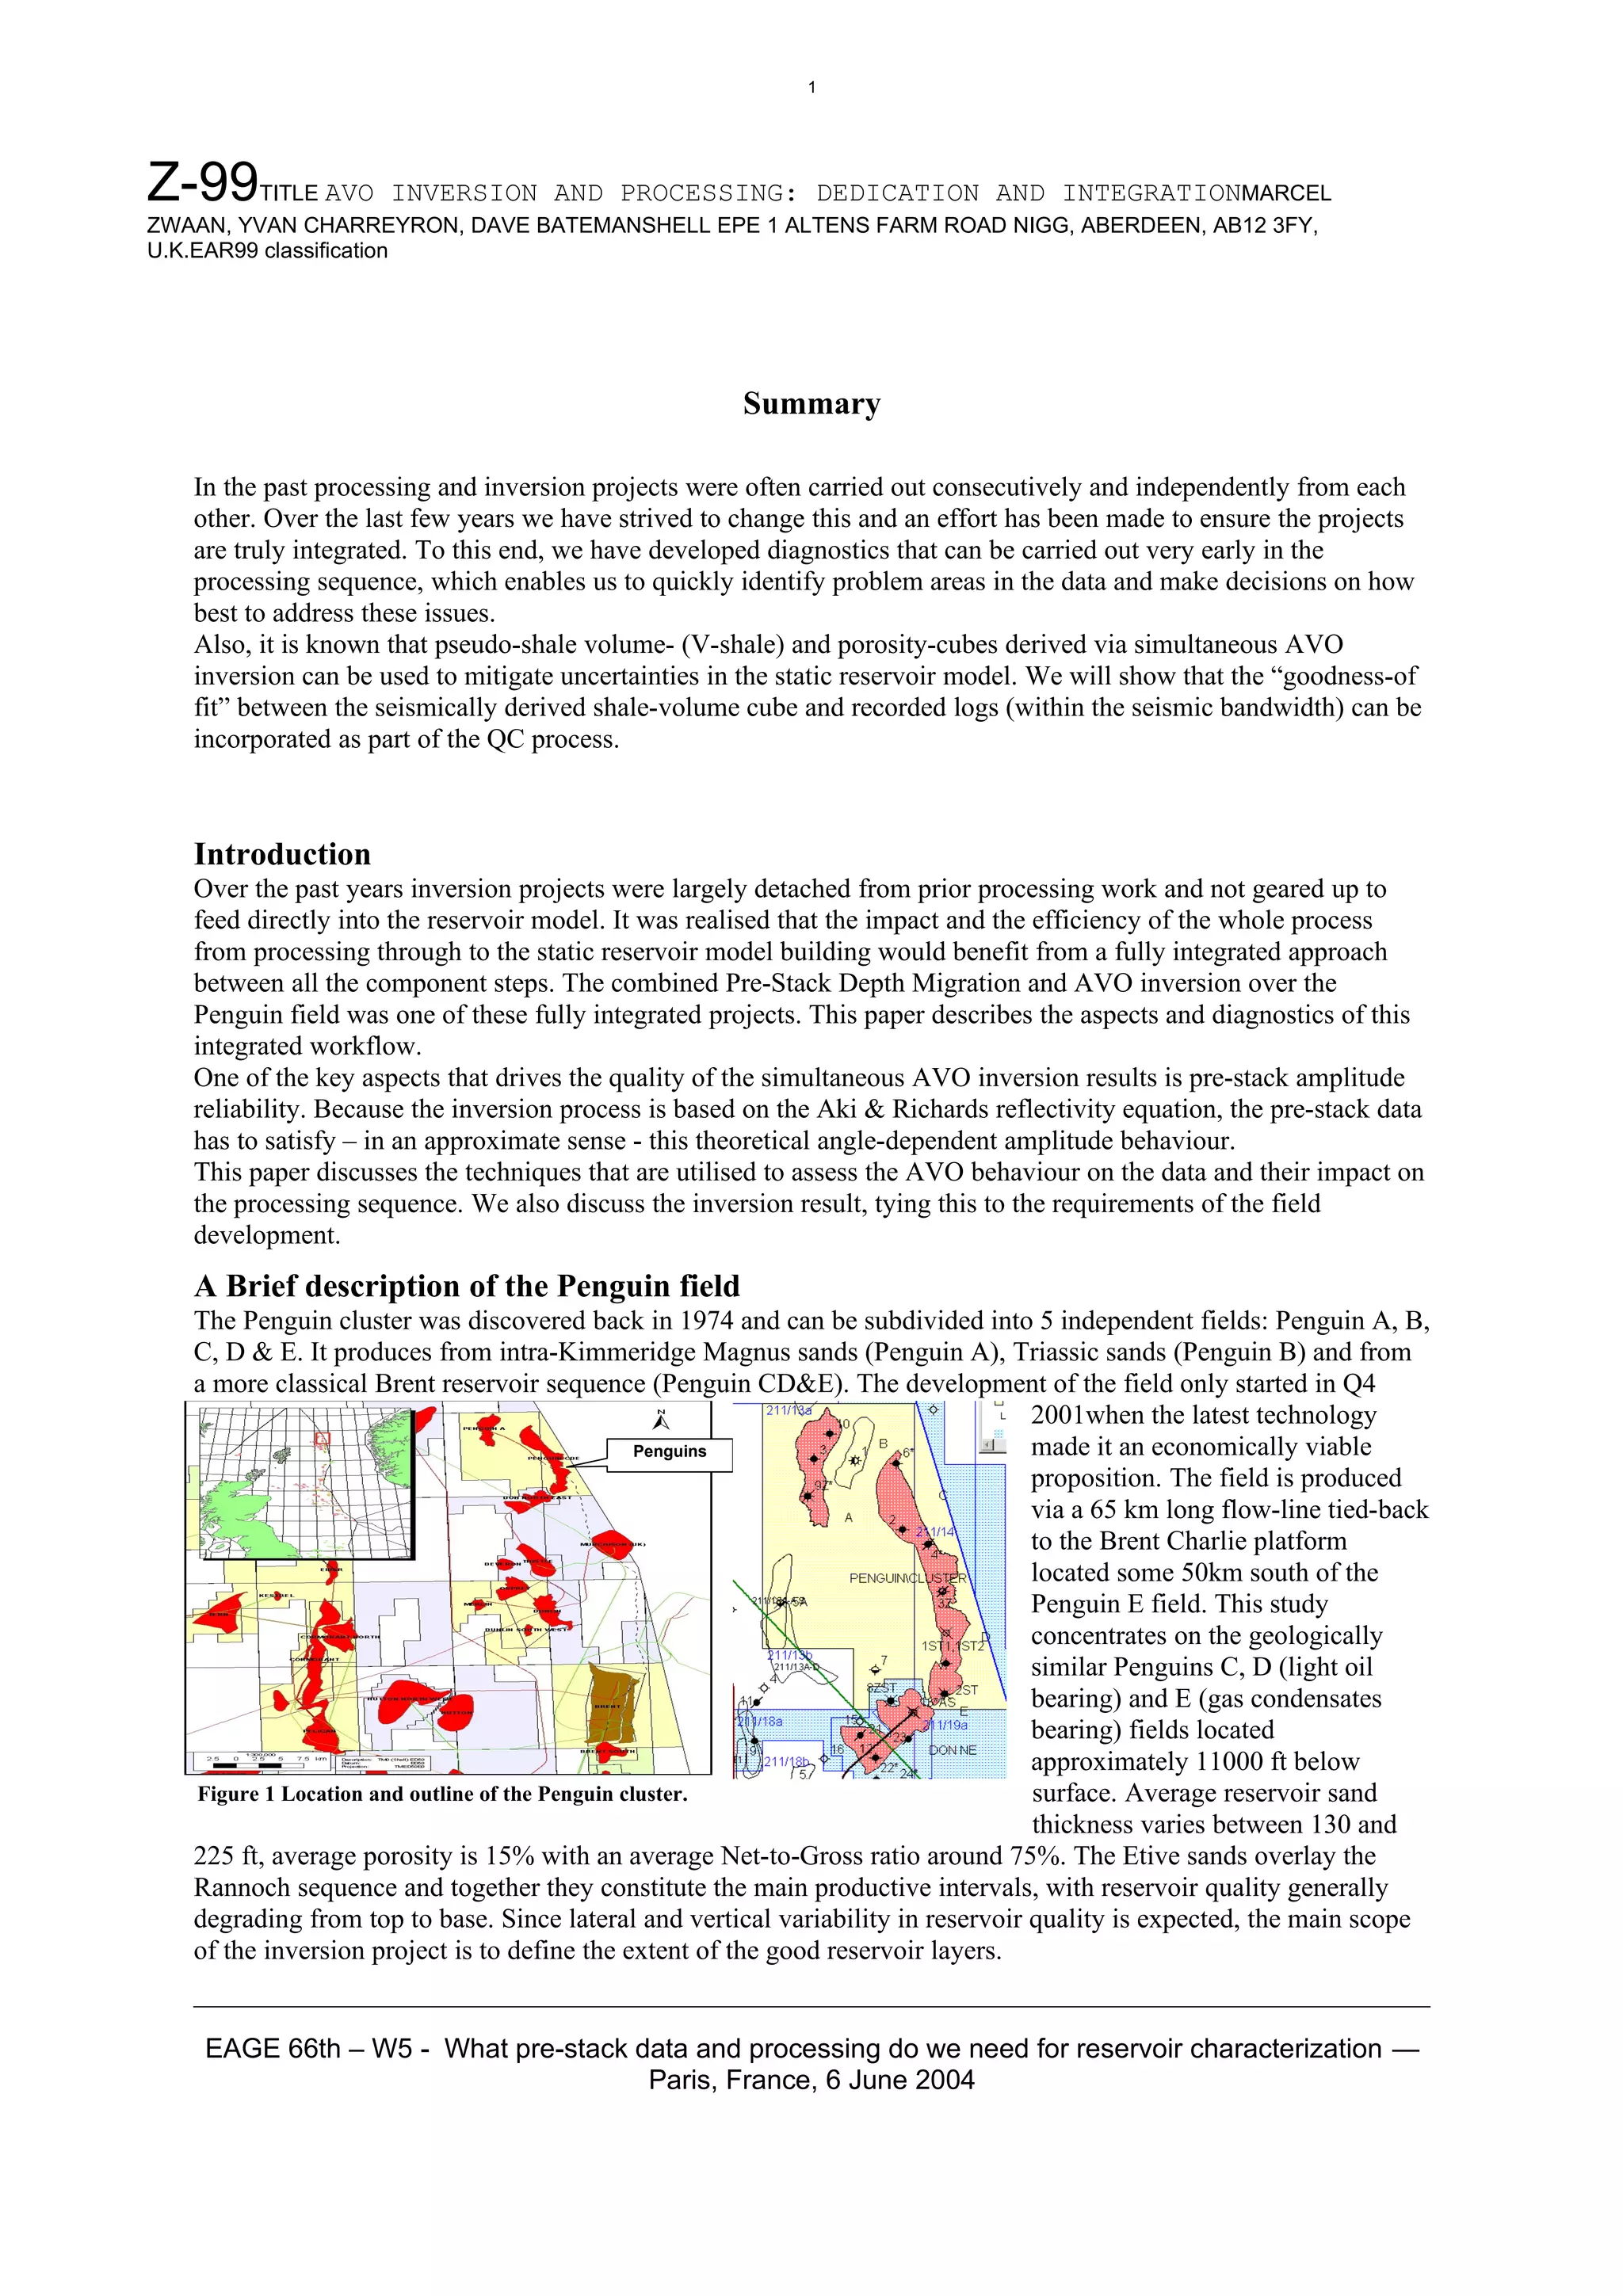
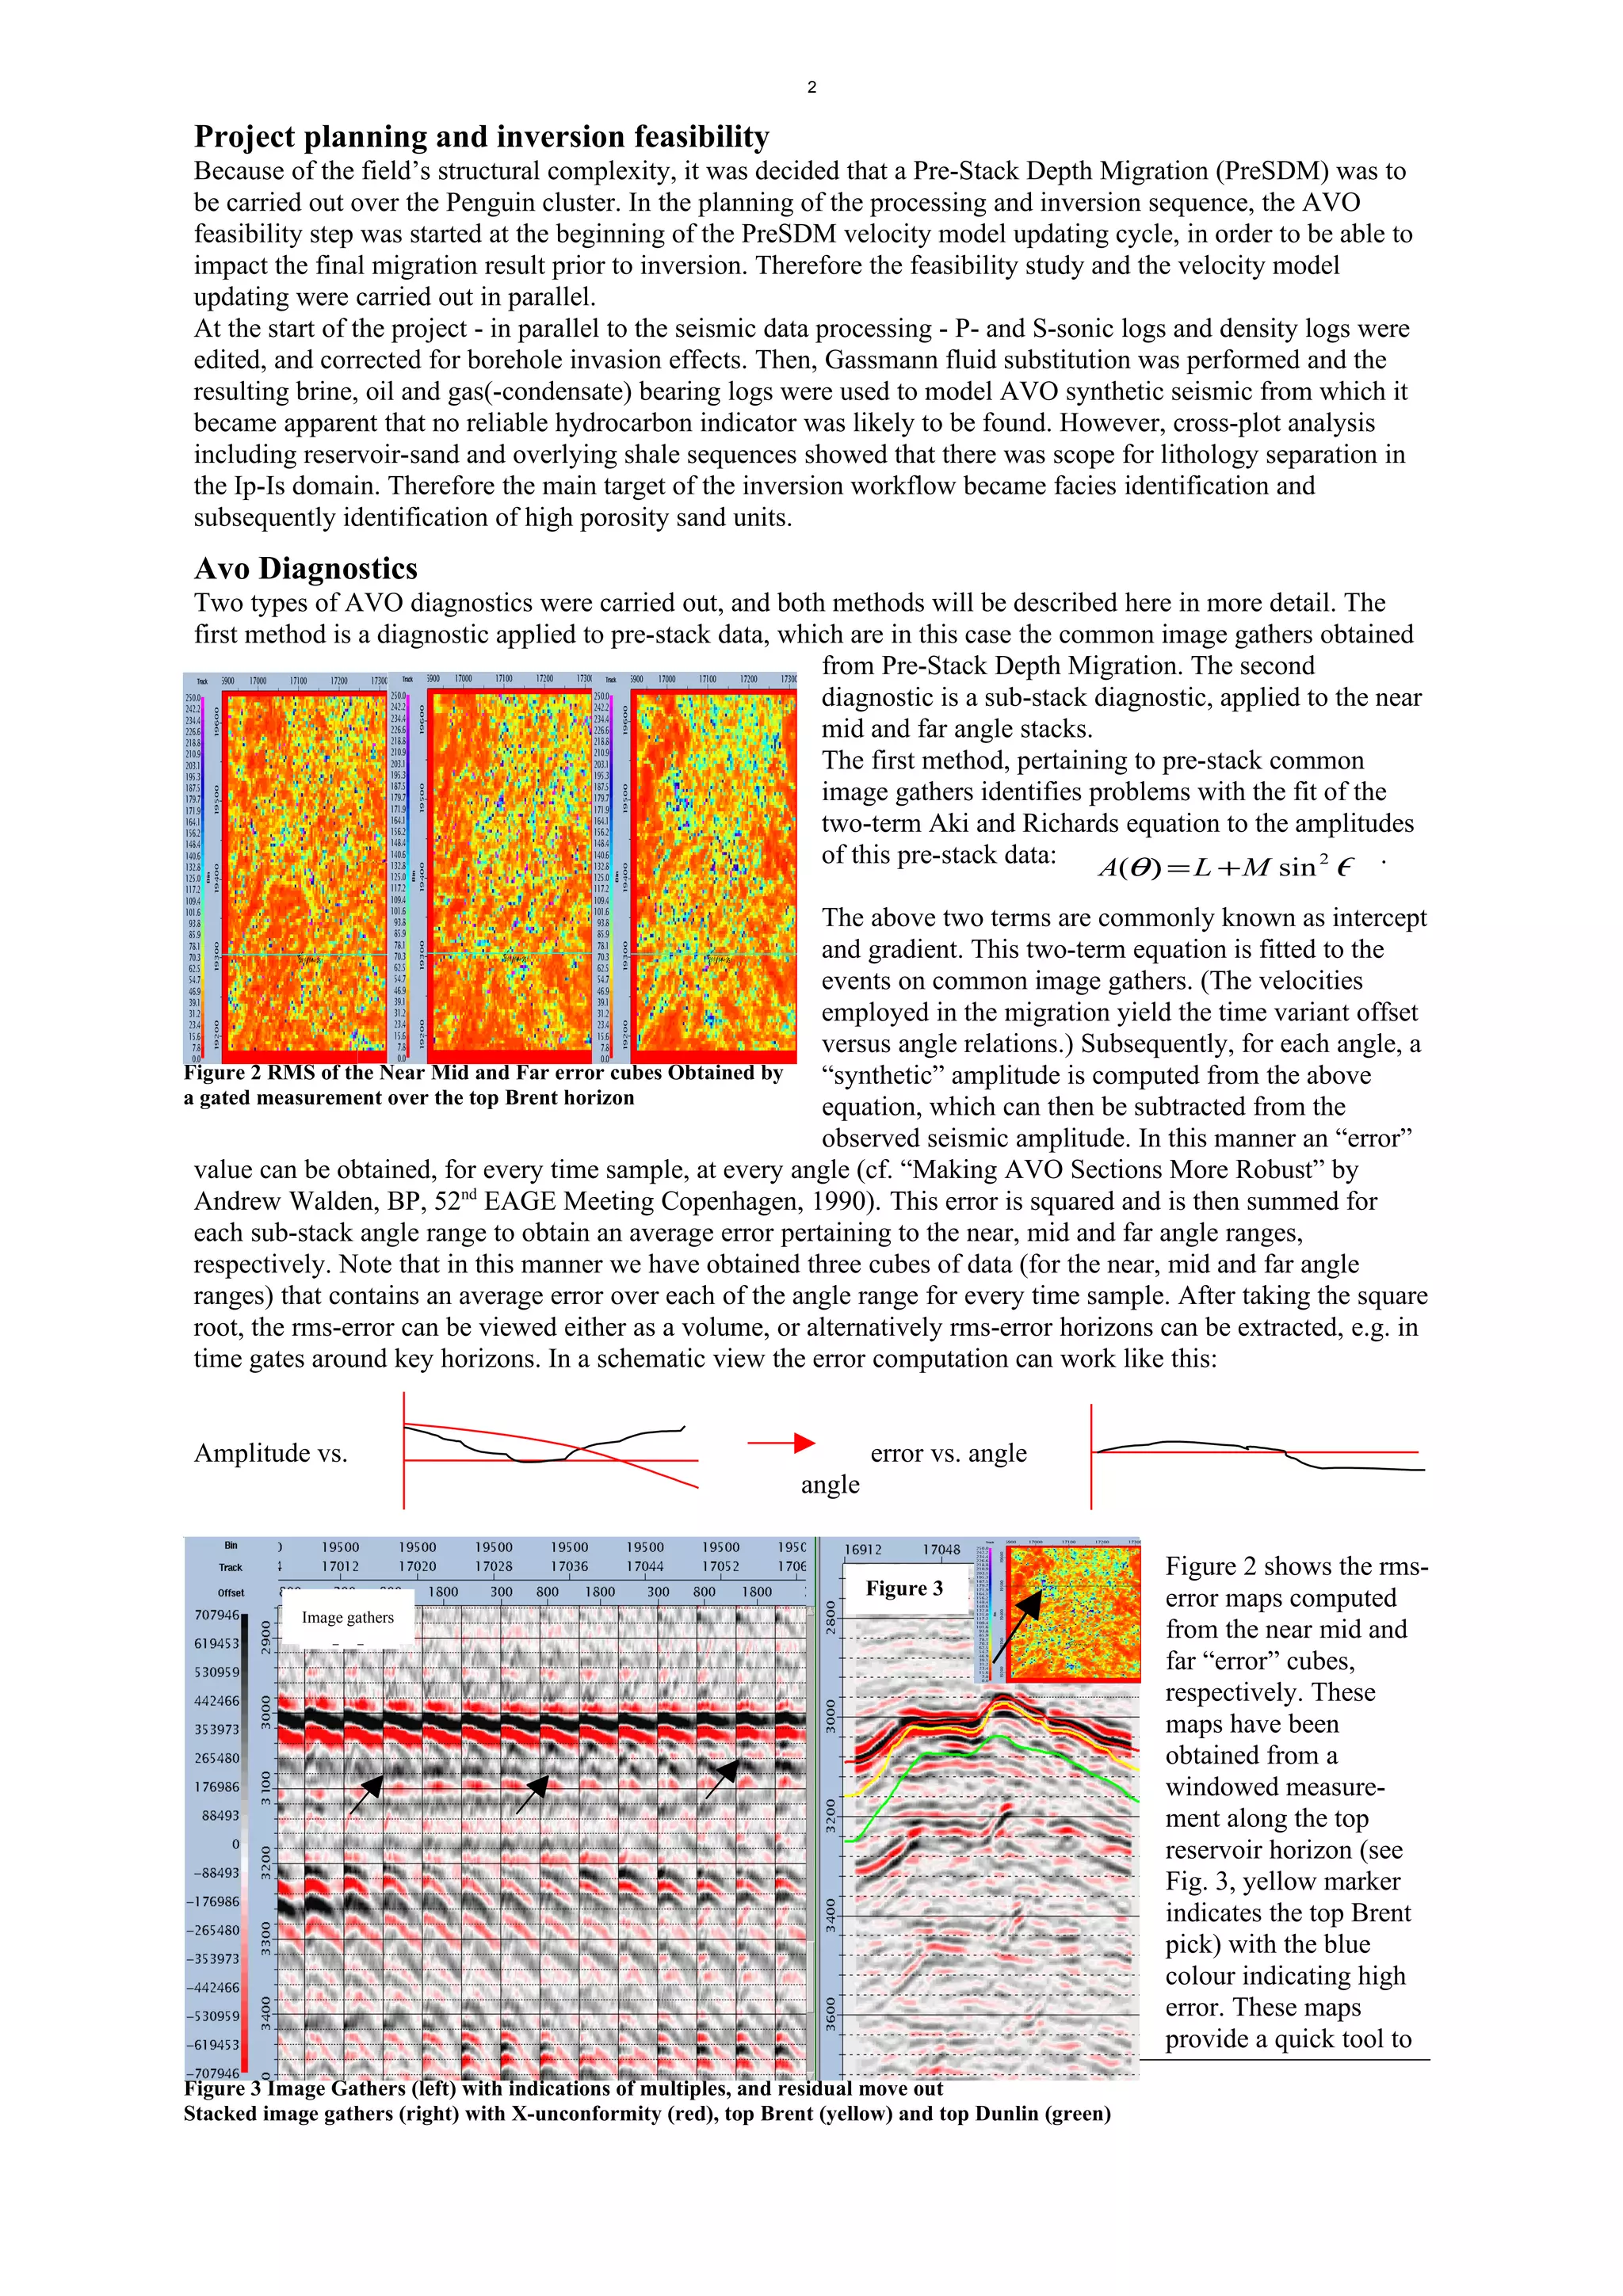
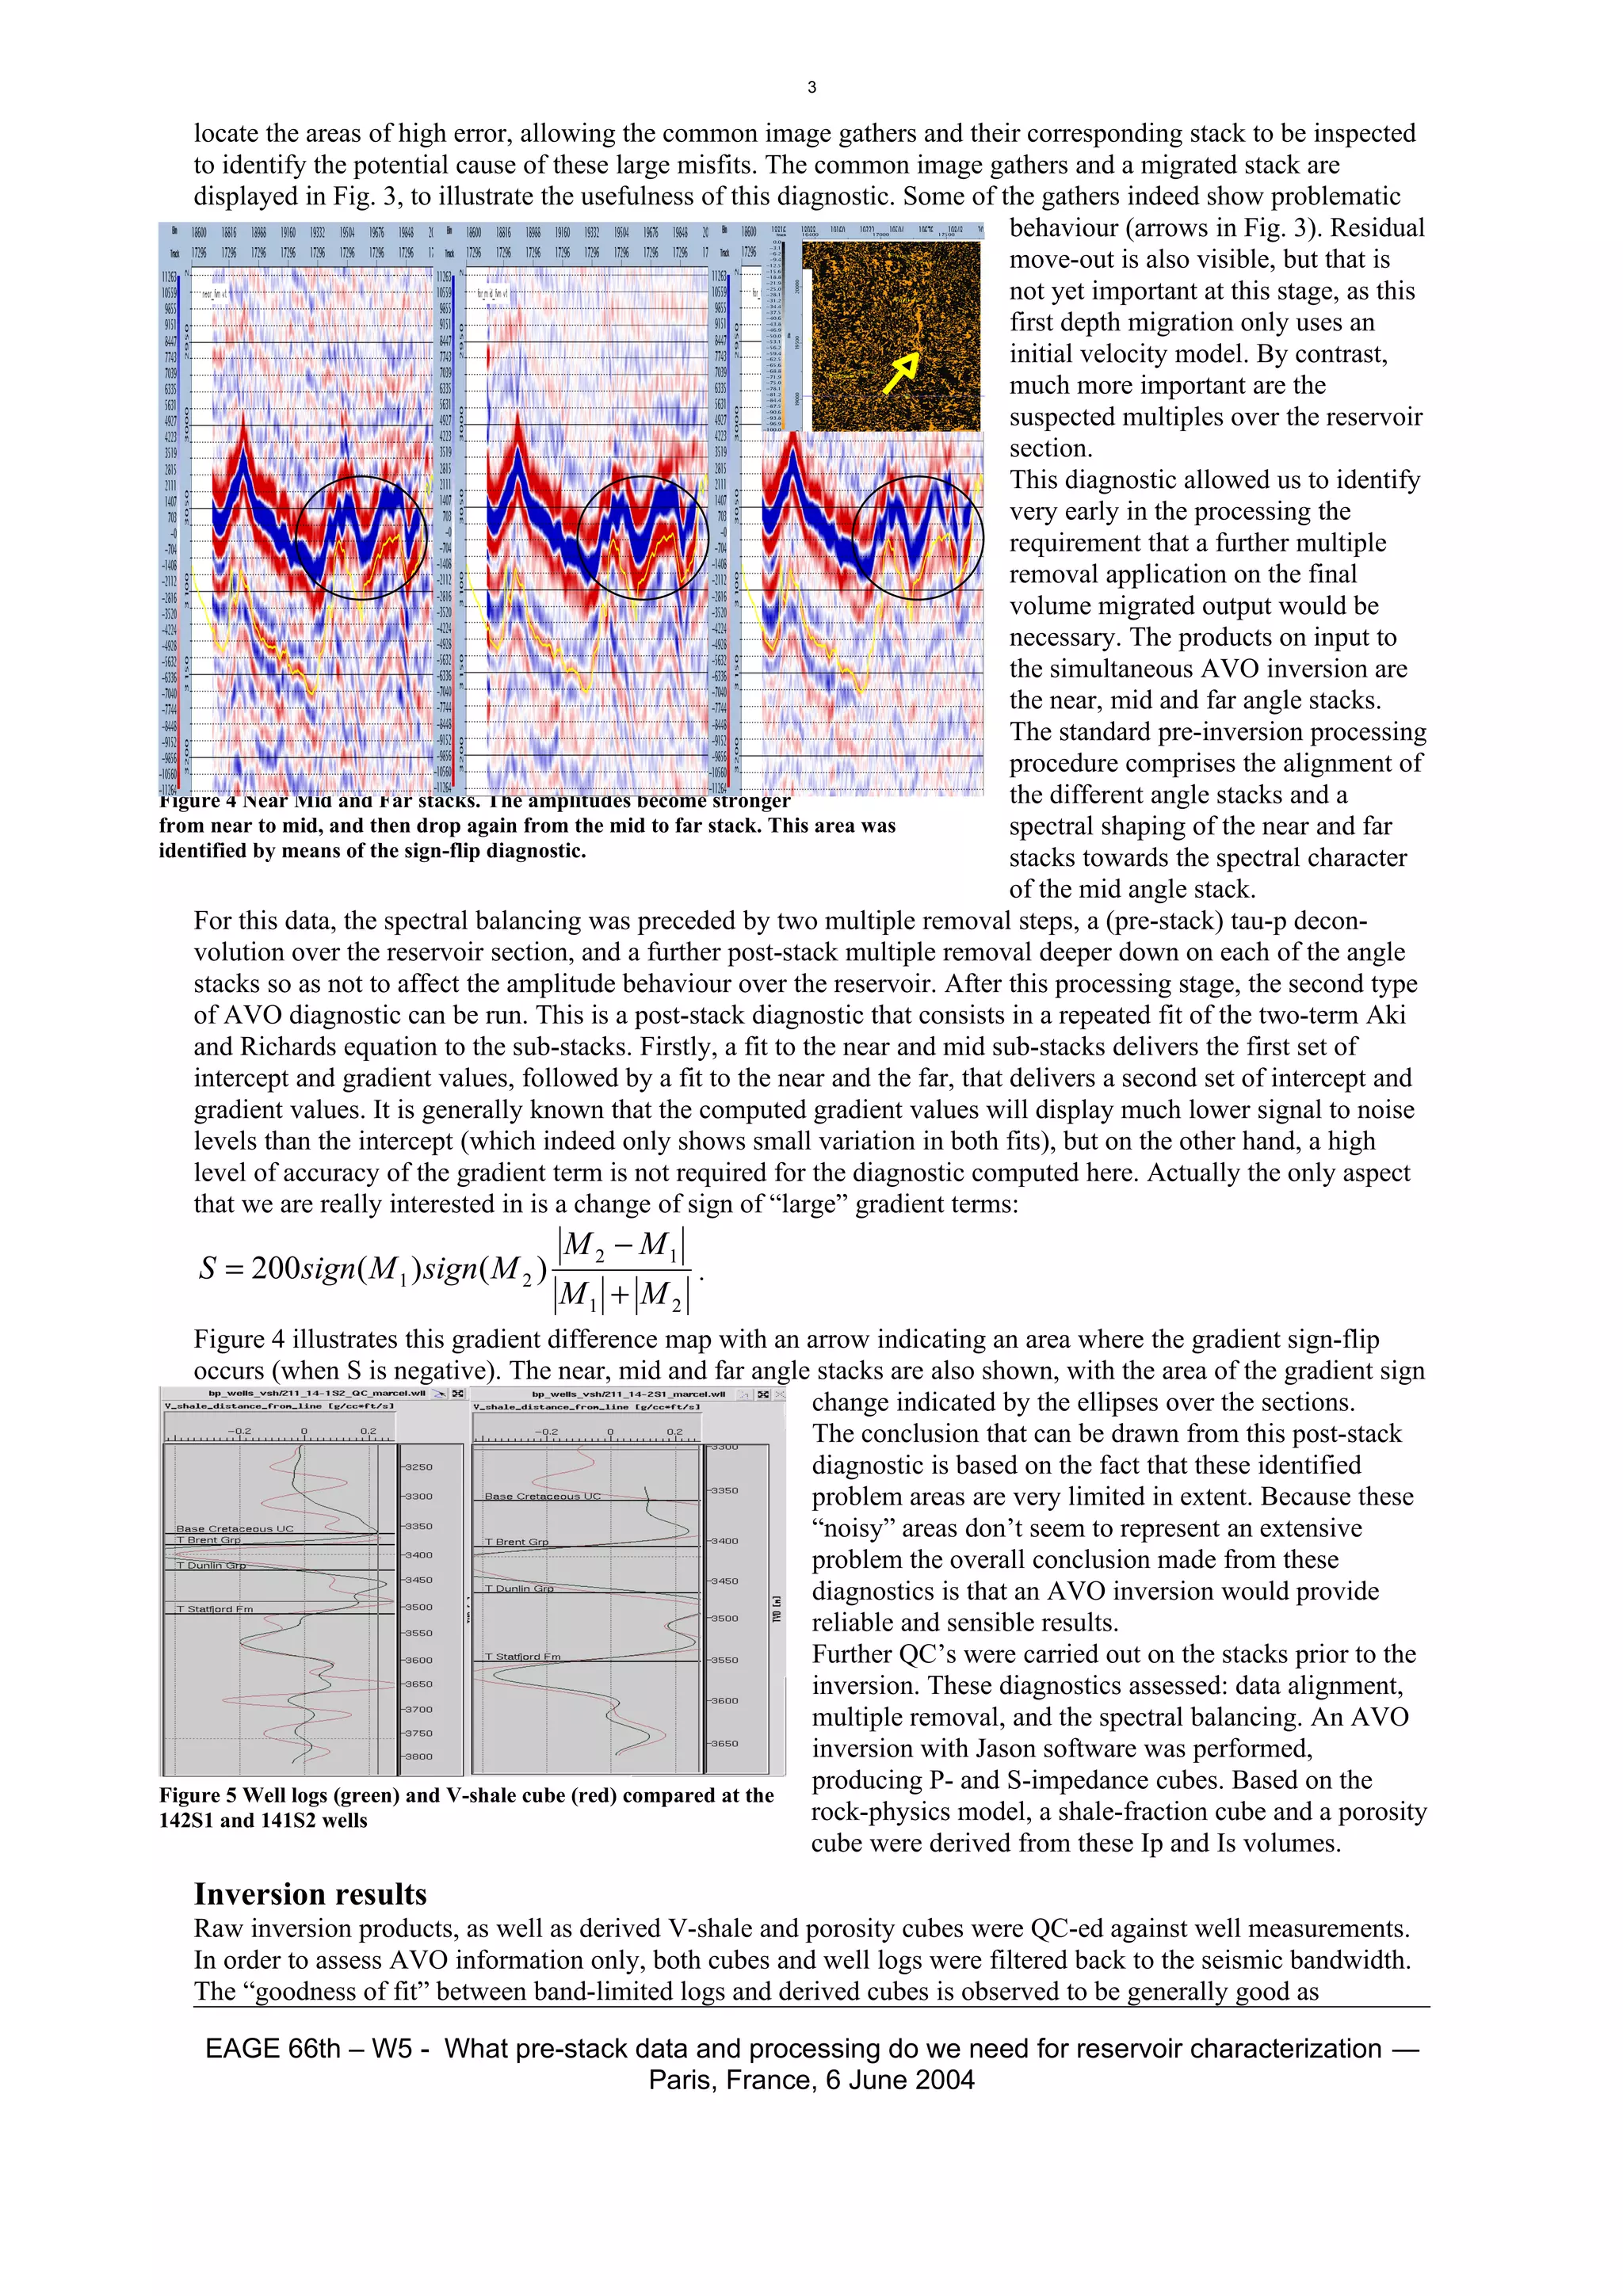
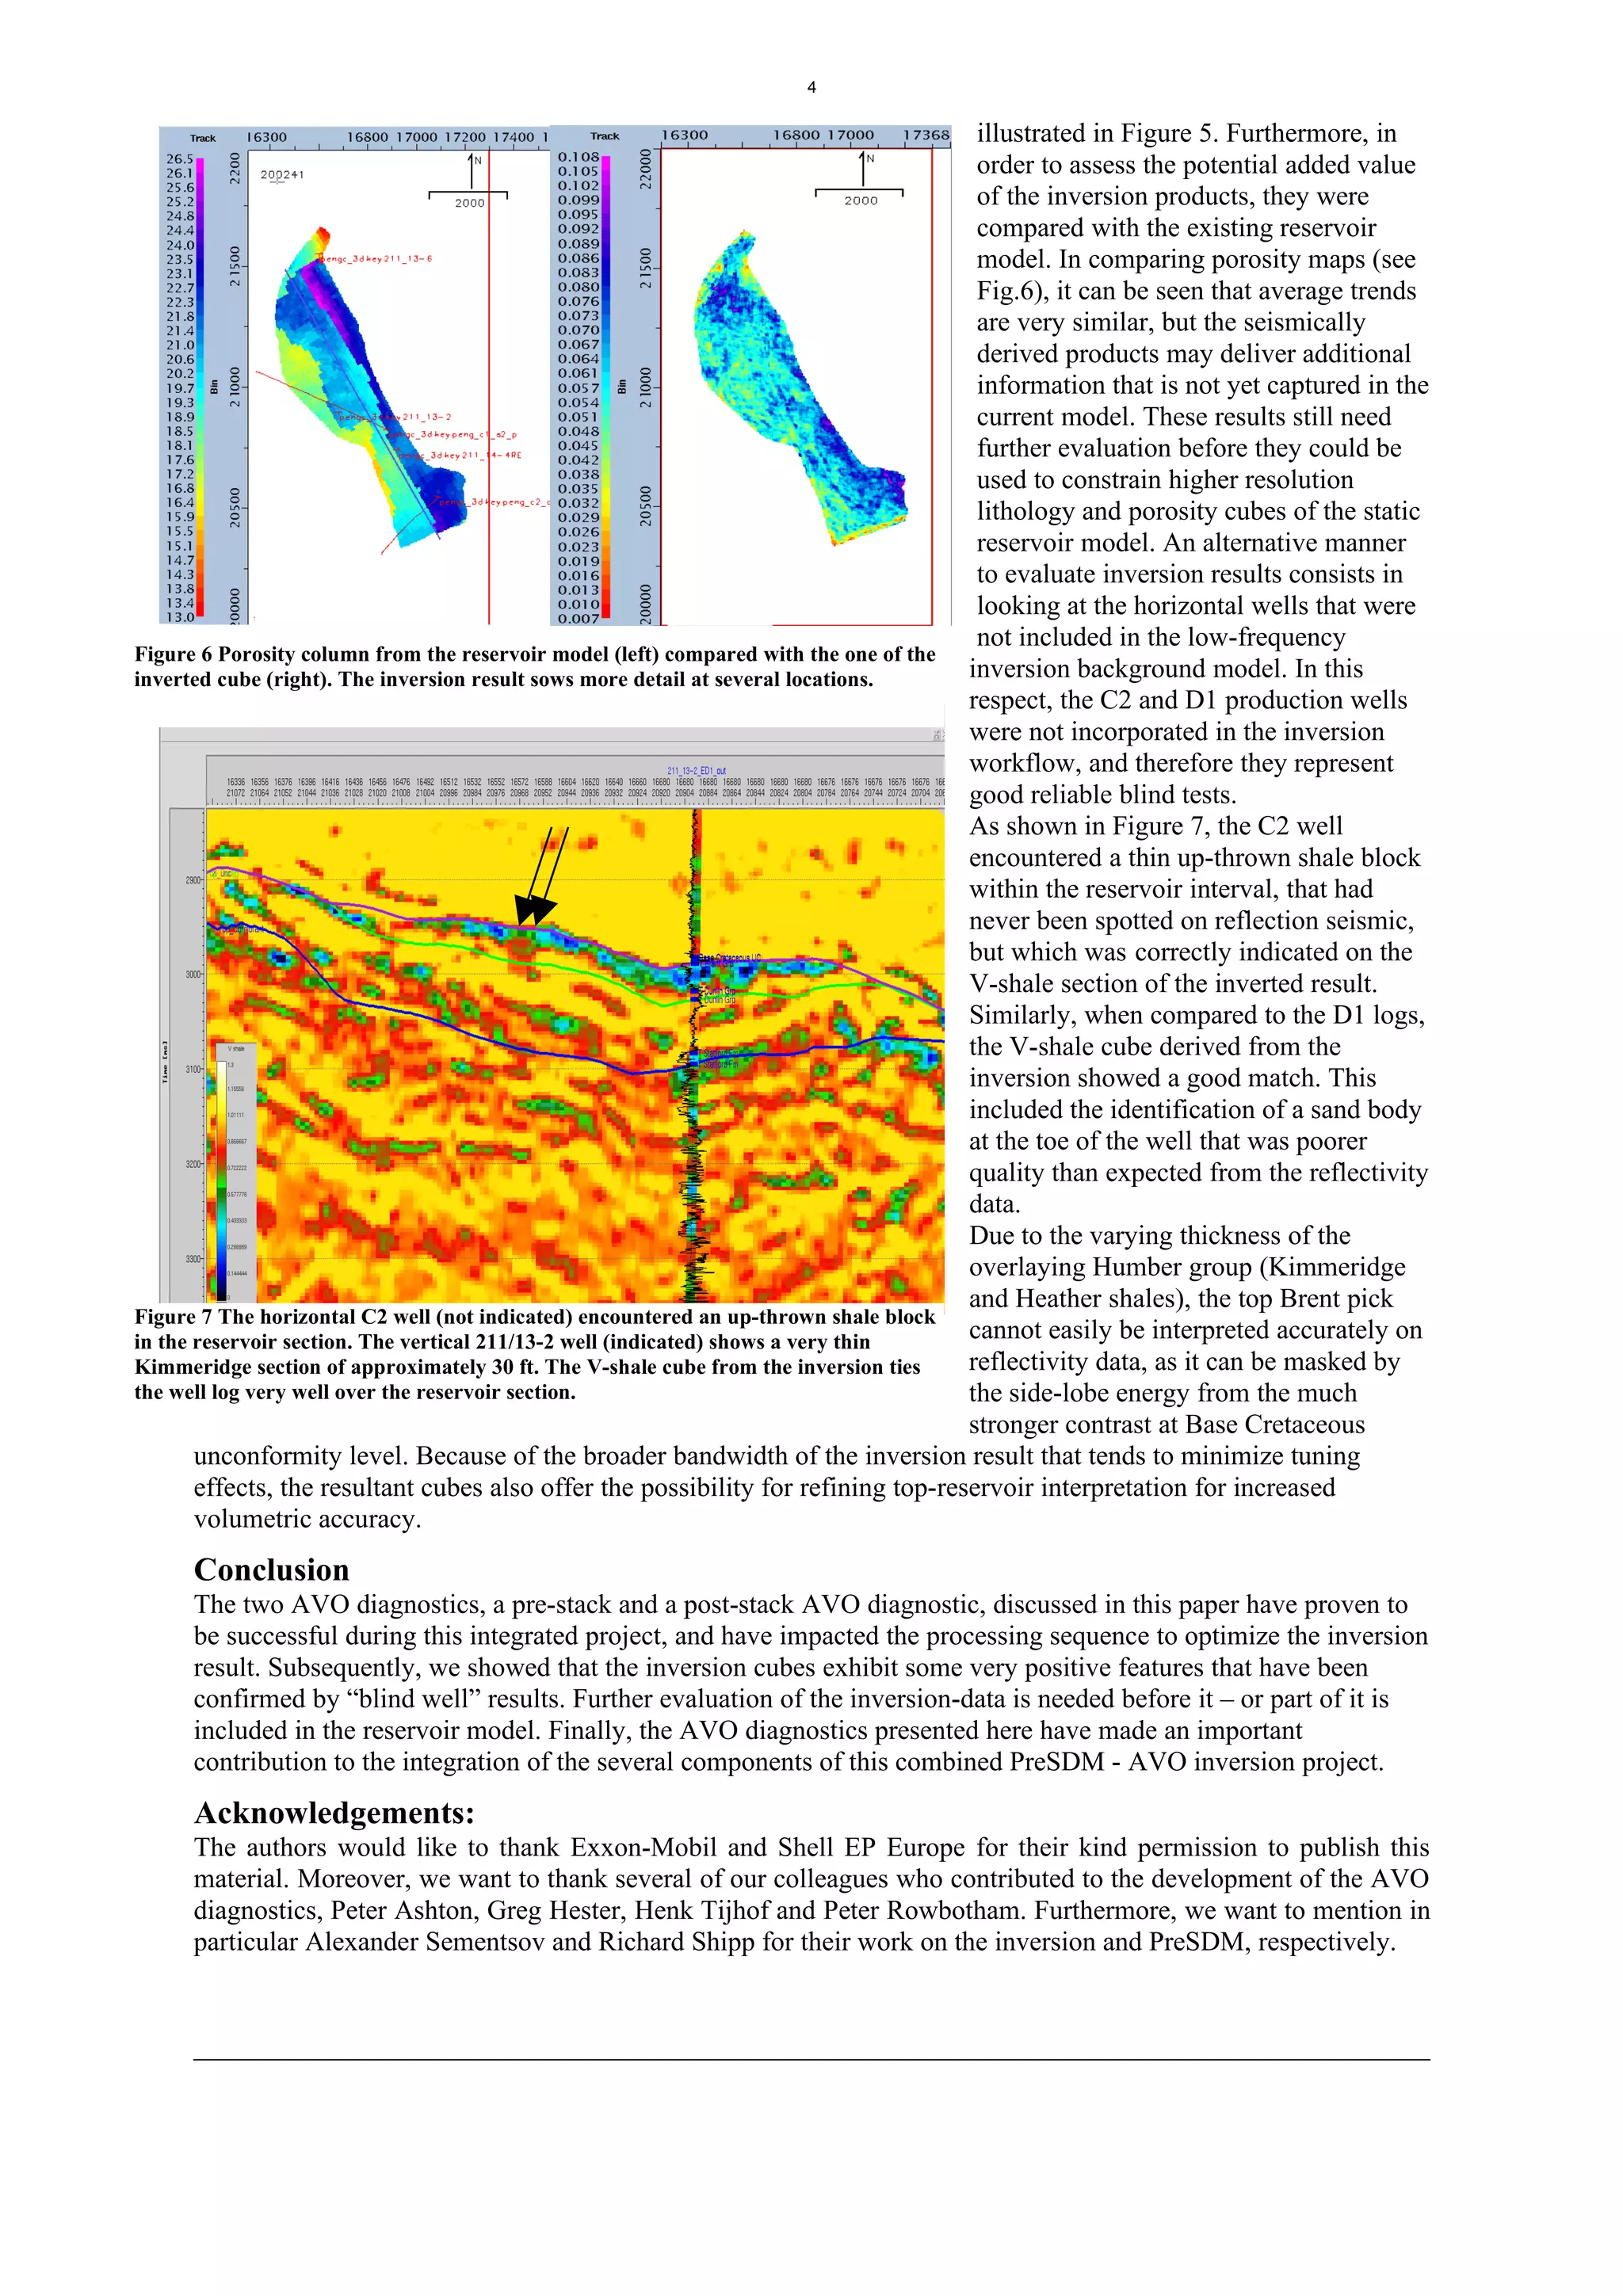
This document discusses an integrated workflow for pre-stack depth migration and AVO inversion on the Penguin oil field in the North Sea. Key aspects of the integrated workflow include: 1) Conducting AVO feasibility studies early in processing to help update the velocity model; 2) Using AVO diagnostics on pre-stack data and angle stacks to identify problems and improve amplitude reliability; 3) Inverting for lithology and porosity cubes to aid reservoir characterization and modeling. The integrated approach aimed to improve efficiency and impact of the entire process from seismic processing through reservoir modeling.
1. AVO inversion and processing of seismic data from the Penguin Field was challenging due to noise in the data and lack of clear AVO trends.
2. Pre-stack diagnostics identified issues like residual moveout and multiples that were addressed through additional processing steps.
3. Post-stack diagnostics on near, mid, and far stacks helped assess whether the data obeyed expected AVO behavior needed for inversion.
4. Inversion results for properties like Vshale, porosity, and net-to-gross ratio showed improved detail compared to original reservoir models.
This document proposes using GNSS-R measurements to retrieve the scattering coefficient distribution over the ocean surface for oil slick detection. It presents a method to deconvolve the measured delay-Doppler map to remove the effects of the antenna pattern and retrieve the scattering coefficient values. A simulation applies the method to detect an oil slick in a retrieved scattering coefficient image, demonstrating the potential of this GNSS-R approach for ocean remote sensing applications like oil spill monitoring.
1) The document discusses stormwater retrofit assessments (SRA) conducted by Metro Conservation Districts to identify the most cost-effective locations for installing stormwater best management practices (BMPs).
2) An SRA involves delineating subwatersheds and catchments, analyzing land use and soil data, identifying potential BMP locations, modeling BMP designs and pollutant reductions, and ranking catchments based on performance metrics like cost per pound of pollutant reduced.
3) The assessments help direct limited funding and labor resources to projects that provide the greatest water quality benefits, in support of total maximum daily load implementation plans.
Seismic interpretation involves correlating seismic data features with geological elements to understand the subsurface. The goal is to map reservoirs, including depth, thickness, and properties. This involves processing data, well calibration, horizon and fault tracking, and attribute analysis. Direct hydrocarbon indicators on seismic can help identify potential reservoirs, but require validation with amplitude versus offset analysis due to limitations and need for a geological model.
The document discusses an airborne DInSAR study conducted over São Sebastião, Brazil to monitor terrain movements that could impact oil and gas pipelines. P-band and X-band data were acquired in 2009 and 2010 and processed to generate deformation maps. P-band results had sub-centimeter accuracy and detected movements in forested areas, while X-band detected millimeter movements in urban areas. Comparisons to in-situ sensors showed correlations. The study demonstrated airborne DInSAR is well-suited for monitoring complex terrain and vegetation areas for natural and potentially hazardous movements.
Presentation - Seakeping Numerical Method Taking Into Account the Influence o...Mirel Nechita
1. The document presents a computational method for simulating ship seakeeping that considers fully nonlinear steady wave fields. Mathematical formulations are provided for steady and unsteady potential flow problems.
2. Numerical methods are described, including a desingularized Rankine panel method and a hybrid method combining the panel method and Green function method. The methods are validated against experimental data.
3. Effects of hull form variations are examined for steady wave distributions, hydrodynamic forces, and unsteady wave patterns. The importance of including nonlinear steady wave effects is demonstrated, especially in downstream regions.
Numerical Simulation: Flight Dynamic Stability Analysis Using Unstructured Ba...Masahiro Kanazaki
The document summarizes a numerical simulation of flight dynamic stability analysis using an unstructured Navier-Stokes solver. It investigates the ability of computational fluid dynamics (CFD) to analyze dynamic stability at supersonic flight conditions. The study uses the Standard Dynamics Model configuration and estimates aerodynamic derivatives from computational results to analyze stiffness, damping, and unsteady oscillation characteristics. Grid dependency is also examined using coarse, medium, and fine meshes.
Vortex Dissipation Due to Airfoil-Vortex InteractionMasahiro Kanazaki
1) A numerical simulation was conducted of airfoil-vortex interaction (AVI) for two airfoils to improve a hybrid method for predicting blade-vortex interaction (BVI) noise.
2) The simulation estimated the change in vortex center location and circulation due to sequential AVI. It found that the original vortex was decelerated and moved upward due to induced counter-rotating vortices from the first airfoil.
3) Sound pressure fluctuations were also estimated, finding that the pressure level after the second AVI was lower than after the first due to the increased miss-distance between the vortex and airfoil. This simulation provided data to modify the prescribed wake model used in the hybrid
Towards the identification of the primary particle nature by the radiodetecti...Ahmed Ammar Rebai PhD
To contact the author use ahmed.rebai2@gmail.com
Radio signal from extensive air showers EAS studied by the CODALEMA experiment have been detected by means of the classic short fat antennas array working in a slave trigger mode by a particle scintillator array. It is shown that the radio shower wavefront is curved with respect to the plane wavefront hypothesis. Then a new fitting model (parabolic model) is proposed to fit the radio signal time delay distributions in an event-by-event basis. This model take into account this wavefront property and several shower geometry parameters such as: the existence of an apparent localised radio-emission source located at a distance Rc from the antenna array of and the
radio shower core on the ground. Comparison of the outputs from this model and other reconstruction models used in the same experiment show: 1)- That the radio shower core is shifted from the particle shower core in a statistic analysis approach. 2)- The capability of the radiodetection method to reconstruct the curvature radius
with a statistical error less than 50 g.cm−2 . Finally a preliminary study of the primary particle nature has been performed based on a comparison between data and Xmax distribution from Aires Monte-Carlo simulations for the same set of events.
Integration of multiple data sources into a resource estimate analysis of t...Alastair Cornah
The document summarizes a study analyzing different methods for integrating multiple data sources, like drill samples and channel samples, into a resource estimate. It describes generating a "ground truth" dataset and extracting virtual channel samples with varying levels of error. Estimation methods tested include ordinary kriging of drillholes only, ordinary kriging of drillholes and channels, cokriging, colocated cokriging, and ordinary kriging with variance of measurement error. The last method performed best by rebalancing weights based on error variances and outperformed other methods when channel data had any error. In conclusions, channel data can benefit estimation if errors are less than 2 standard deviations but drillholes only are better with higher errors
TGS Arcis- 2014 Marketing Survey Washout Creek 3C 3DTGS
Arcis Seismic Solutions is making the Washout Creek 3C 3D seismic survey available for immediate subscription. This survey was designed to evaluate multiple hydrocarbon-bearing zones from the Cretaceous to Devonian periods, including productive formations like the Cardium, Belly River, Glauconitic, Rock Creek, and Duvernay. Arcis' proprietary tools and multicomponent processing technology, including shear wave splitting analysis, will enhance imaging and aid in horizontal well placement within both shallow and deep targets.
This study used ground-penetrating radar (GPR) to analyze the Quaternary stratigraphy of a sandy portion of the Marambaia Isthmus in Brazil. Five radar facies were identified in one GPR profile, representing different depositional environments: facies A and A' showed planar reflections indicating a low-energy beach or shore environment; facies B showed sigmoidal reflections indicating transport of shelf sediments during a marine transgression; facies C showed oblique reflections indicating eolian dune deposition during lower sea levels; and facies D showed well-sorted sand grains deposited by reworking. Together, the facies suggest periods of marine transgression and lower sea levels with dune formation, providing information on the
This document describes a numerical model that couples mechanical and heat and mass transfer processes during manufacturing of medium density fiberboard (MDF) using hot pressing. The model includes:
1) Heat and mass transfer equations accounting for air, water vapor, energy, and resin polymerization kinetics.
2) A mechanical model using an aging linear elastic constitutive law to model compression of the mat.
3) Coupling of the mechanical and heat/mass transfer models using a finite element method with implicit time stepping.
4) Numerical results from the model show good agreement with laboratory experiments and provide temperature, moisture content, and density profiles throughout the pressing process.
Trim refers to the difference between a ship's draft at the bow and stern. It is measured as the difference between the forward and aft draft. Shifting weight on a ship causes its center of gravity to shift and creates a trimming moment that changes the ship's trim. The amount of trim change depends on factors like the ship's displacement, longitudinal metacentric height, and the distance the weight is shifted. A change in trim results in changes to the forward and aft draft.
Seismic QC & Filtering with GeostatisticsGeovariances
The quality of seismic volumes is critical in building reliable reservoir models. Seismic data are often polluted by acquisition or processing artifacts which may have strong impact on subsequent seismic processing or interpretation. Geostatistics allows filtering efficiently seismic noise and artifacts without modifying the signal.
Geovariances provides solutions from seismic data quality control and filtering to reservoir characterization. This technology is based on geostatistics and all algorithms are available in Isatis, leader in geostatistical software solutions.
Between 1958 and 1981, EMPA performed dynamic load tests on 226 highway bridges in Switzerland. Standard test procedures were used where a loaded truck was driven across bridges at increasing speeds while bridge response was measured. Natural frequency, damping, and dynamic load increase were calculated from the response data. Test results showed that a bridge's fundamental frequency and maximum span are correlated, and that dynamic response only occurs if the bridge and vehicle frequencies are matched by speed and road conditions. The experience from these tests was used to define dynamic load allowances in the Swiss bridge design code based on fundamental frequency.
This paper investigates the turbulent flow around a marine propeller used to actuate an underwater vehicle (UUV) using computational fluid dynamics (CFD). The propeller often operates at low Reynolds numbers and off-design conditions for UUV applications. A RANS solver with a k-ω turbulence model was used to simulate the 3D flow field for the propeller operating at different advance ratios, representing forward, hovering, and crashback conditions. Pressure and velocity distributions were analyzed and thrust/torque coefficients were compared to experimental data, showing good agreement. The results provide insight into the complex low Reynolds number flow for propeller design and UUV control.
The document defines and describes bocatomas, which are hydraulic structures built on rivers or canals to extract part or all of the main water flow. It discusses their functions, components, classification, types, design considerations, and operation/maintenance. The key points are:
- Bocatomas extract water flows for uses like public water supply, irrigation, hydroelectric plants, industry, and more.
- They consist of elements like intake gates, sediment removal canals, barrages, traps, energy dissipaters, and spillways.
- Design involves factors such as location, topography, geology, hydrology, and ecology. Hydraulic calculations are also required.
- Pro
WaReS is a code developed by Marine Analytica to calculate loads and responses of floating structures. This memo presents an extract of the verification report.
This document discusses concepts related to ship stability including:
- Density and its effects on a ship's volume and displacement. As density increases, volume decreases due to an inverse relationship between density and volume. Displacement increases with density due to a direct relationship.
- The law of floatation and how it relates to a ship's center of gravity, center of buoyancy, draft, and density. It explains how these factors work together to keep a ship floating.
- Static stability and concepts like metacentric height, righting arm, and their relationship to a stable, unstable, or neutral ship. Ship stability depends on maintaining a positive metacentric height and righting moment.
- Additional topics
Computation of Hydrodynamic Characteristics of Ships using CFDNabila Naz
1) The document summarizes research using computational fluid dynamics (CFD) to analyze hydrodynamic characteristics like wave patterns, resistance, and pressure around ship hulls.
2) CFD simulations were conducted using the SHIPFLOW software to model potential, boundary layer, and viscous flow around two ship hulls at varying speeds.
3) Results for wave elevation, resistance coefficients, and streamlines showed good agreement with experimental data, though some discrepancies remained, especially near bow and stern.
This document discusses geometric corrections in seismic data processing. It covers CDP gathers, stacking traces from common reflection points to improve the signal-to-noise ratio, and applying static and dynamic corrections. Static corrections include weathering corrections to account for low-velocity near-surface layers and elevation corrections. The objectives are to understand how to apply these corrections and interpret stacking charts.
This document discusses numerical techniques in SWAN (Simulating WAves Nearshore), a wave model. It covers discretization schemes, convergence criteria, source term stability, and interpolation methods. The propagation schemes are fully implicit and use upwind differencing. Convergence is checked using criteria on changes in wave height and period from iteration to iteration. Under-relaxation and action density limiting can improve stability for multi-scale wave simulations. Input data like spectra and environmental fields are interpolated to the computational grid.
The document describes a method for detecting and determining post-launch frequency shifts in channels on the AMSU-A instrument. The method uses satellite cross-over data and radiative transfer modeling to identify a frequency shift in Channel 6 on NOAA-15. The analysis finds the actual channel frequency is 36.25 MHz higher than the pre-launch measurement. This method could help improve weather forecasts by providing more accurate channel frequency data for assimilation of AMSU observations.
Subsalt Steep Dip Imaging Study with 3D Acoustic Modelingleizhuo
1) 3D modeling was conducted to understand challenges with imaging subsalt steep dips using wide-azimuth (WAZ) surface seismic in the Gulf of Mexico. Modeling results showed WAZ fails to illuminate subsalt three-way closures and steeply dipping faults due to energy refracting at the salt-sediment interface.
2) 3D vertical seismic profile (VSP) modeling was able to image subsalt steep dips by recording both direct and refracted energy arrivals with downhole receivers. However, VSP illumination is localized around the borehole.
3) An integrated approach combining full-azimuth surface seismic to image broader areas with 3D VSP to illuminate
Presentation by Kimberley Koudstaal, WaterProof Marine Consultancy & Services B.V., The Netherlands, at the Delft3D and XBeach User Day: Coastal morphodynamics, during Delft Software Days - Edition 2019. Wednesday, 13 November 2019, Delft.
This document summarizes an approach for classifying seafloor textures in high resolution sonar images using multiscale discriminant analysis. The approach extracts statistical parameters from wavelet decompositions of the sonar images at multiple scales. A discriminant analysis is then used to reduce the feature space and generate an optimal subspace for classification. The method was tested on real sonar images containing speckle noise and showed improved classification of seabed textures like pebbles, dunes, ridges and sand.
Seismic data processing 15, kirchhof migrationAmin khalil
Kirchhoff migration is a widely used seismic data processing method. It works by back projecting observed seismic event energy from traces to possible subsurface reflection points based on traveltime. This smears the event energy to all possible subsurface locations, generating artifacts. Stacking multiple migrated traces helps resolve the true dipping reflector. Ray tracing is used to build the traveltime field. Kirchhoff migration is computationally expensive, taking days to process post-stack or months for pre-stack data. Representing the earth in 3D rather than 2D is preferable but requires knowing the 3D velocity model which is challenging.
Quantitative and Qualitative Seismic Interpretation of Seismic Data Haseeb Ahmed
This document discusses quantitative and qualitative seismic interpretation techniques used to analyze seismic data and map subsurface geology. It compares traditional qualitative techniques to more modern quantitative techniques. It then focuses on unconventional seismic interpretation techniques used for unconventional reservoirs with low permeability, including AVO analysis, seismic inversion, seismic attributes, and forward seismic modeling. These techniques can help identify tight gas, shale gas, and gas hydrate reservoirs that conventional methods cannot easily detect. The document provides details on how each technique works and its advantages.
IRJET - Effect of Local Scour on Foundation of Hydraulic StructureIRJET Journal
This document summarizes research on the effect of local scour on the foundations of hydraulic structures like bridge piers and abutments. It discusses factors that influence local scour depth around pile groups, including pile shape, spacing between piles, and arrangement. Laboratory experiments were conducted using a flume to model local scour at circular and square pile groups with varying spacings. The Florida Department of Transportation (FDOT) bridge scour evaluation program was also used to estimate scour depths. Results showed that scour depth decreases as pile spacing increases and is less for circular piles compared to square piles. The research highlights the importance of considering local scour effects in foundation design of hydraulic structures.
Noise Removal in SAR Images using Orthonormal Ridgelet TransformIJERA Editor
Development in the field of image processing for reducing speckle noise from digital images/satellite images is a challenging task for image processing applications. Previously many algorithms were proposed to de-speckle the noise in digital images. Here in this article we are presenting experimental results on de-speckling of Synthetic Aperture RADAR (SAR) images. SAR images have wide applications in remote sensing and mapping the surfaces of all planets. SAR can also be implemented as "inverse SAR" by observing a moving target over a substantial time with a stationary antenna. Hence denoising of SAR images is an essential task for viewing the information. Here we introduce a transformation technique called ―Ridgelet‖, which is an extension level of wavelet. Ridgelet analysis can be done in the similar way how wavelet analysis was done in the Radon domain as it translates singularities along lines into point singularities under different frequencies. Simulation results were show cased for proving that proposed work is more reliable than compared to other de-speckling processes, and the quality of de-speckled image is measured in terms of Peak Signal to Noise Ratio and Mean Square Error
Noise Removal in SAR Images using Orthonormal Ridgelet TransformIJERA Editor
Development in the field of image processing for reducing speckle noise from digital images/satellite images is a challenging task for image processing applications. Previously many algorithms were proposed to de-speckle the noise in digital images. Here in this article we are presenting experimental results on de-speckling of Synthetic Aperture RADAR (SAR) images. SAR images have wide applications in remote sensing and mapping the surfaces of all planets. SAR can also be implemented as "inverse SAR" by observing a moving target over a substantial time with a stationary antenna. Hence denoising of SAR images is an essential task for viewing the information. Here we introduce a transformation technique called ―Ridgelet‖, which is an extension level of wavelet. Ridgelet analysis can be done in the similar way how wavelet analysis was done in the Radon domain as it translates singularities along lines into point singularities under different frequencies. Simulation results were show cased for proving that proposed work is more reliable than compared to other de-speckling processes, and the quality of de-speckled image is measured in terms of Peak Signal to Noise Ratio and Mean Square Error.
1) Geostatistics provides tools to describe spatial continuity in data, estimate values at unsampled locations, and create multiple equiprobable subsurface models that account for uncertainty.
2) Variograms quantify the dissimilarity between data points over distance and are used to model spatial correlation.
3) Multiple scales of heterogeneity often exist, with longer correlation ranges related to large-scale variations and shorter ranges corresponding to smaller features.
1) The document discusses which seismic attributes are most useful for quantitative seismic reservoir characterization. It analyzes attributes such as zero phase amplitude, relative impedance, and absolute impedance.
2) The conclusion is that an absolute impedance inversion provides the best attribute in theory but is difficult in practice. A relative impedance inversion, which is easier to generate, is determined to be a more practical seismic attribute.
3) Low frequency content is a challenge for absolute impedance inversions, as the low frequencies must be supplied or interpolated, introducing subjectivity. Relative impedance avoids this by restricting the inversion to the seismic bandwidth.
1) The document discusses which seismic attributes are most useful for quantitative seismic reservoir characterization. It analyzes attributes such as zero phase amplitude, relative impedance, and absolute impedance.
2) The conclusion is that an absolute impedance inversion provides the best attribute in theory but is difficult in practice. A relative impedance inversion, which is easier to generate, works nearly as well for characterization.
3) Key advantages of relative impedance over zero phase amplitude include relating to geology rather than just impedance contrasts, and allowing comparison between seismic datasets and well logs after appropriate scaling. However, relative impedance lacks low frequency content included in absolute impedance.
1. The document discusses applying multi-curve reconstruction technology to seismic inversion to improve accuracy and reliability. It focuses on reconstructing SP and RMN curves from well logs that are affected by various distortions.
2. The process of reconstructing the curves involves removing baseline drift, standardizing values, applying linear filtering, and fitting the curves. This removes interference and retains valid lithological information.
3. Reconstructing high quality curves improves the resolution and credibility of seismic inversion results. The method is shown to effectively predict sand distribution with little error.
Lateral resolution and lithological interpretation of surface wave profi lingAdam O'Neill
This document summarizes research on using surface wave profiling to characterize near-surface geology. It discusses issues with lateral resolution when imaging subsurface features like sinkholes. Numerical modeling of a sinkhole in buried hard rock shows that wider sinkholes are resolved better than narrow ones. Field data from Western Australia that combines surface wave and electrical resistivity data illustrates improved lithological interpretation when both methods are used. The researchers investigate ways to enhance lateral resolution, such as using non-linear geophone spacing. They also demonstrate data-driven classification of rock types based on resistivity and shear wave velocity measurements.
Reconstruction of underwater image by bispectrumprasanna9111
This document describes a new approach for reconstructing underwater images that have been distorted by moving water waves. The approach uses bispectrum analysis to recover the phase information of the true underwater object from a sequence of distorted images. Bispectrum analysis allows the phase of the target image to be estimated by analyzing the averaged bispectrum of the image ensemble. The algorithm was tested on both simulated and real-world image data, and initial results showed promise in reconstructing sharper images compared to traditional averaging methods.
Wavelet estimation for a multidimensional acoustic or elastic earthArthur Weglein
A new and general wave theoretical wavelet estimation
method is derived. Knowing the seismic wavelet
is important both for processing seismic data and for
modeling the seismic response. To obtain the wavelet,
both statistical (e.g., Wiener-Levinson) and deterministic
(matching surface seismic to well-log data) methods
are generally used. In the marine case, a far-field
signature is often obtained with a deep-towed hydrophone.
The statistical methods do not allow obtaining
the phase of the wavelet, whereas the deterministic
method obviously requires data from a well. The
deep-towed hydrophone requires that the water be
deep enough for the hydrophone to be in the far field
and in addition that the reflections from the water
bottom and structure do not corrupt the measured
wavelet. None of the methods address the source
array pattern, which is important for amplitude-versus-
offset (AVO) studies.
Wavelet estimation for a multidimensional acoustic or elastic earth- Arthur W...Arthur Weglein
A new and general wave theoretical wavelet estimation
method is derived. Knowing the seismic wavelet
is important both for processing seismic data and for
modeling the seismic response. To obtain the wavelet,
both statistical (e.g., Wiener-Levinson) and deterministic
(matching surface seismic to well-log data) methods
are generally used. In the marine case, a far-field
signature is often obtained with a deep-towed hydrophone.
The statistical methods do not allow obtaining
the phase of the wavelet, whereas the deterministic
method obviously requires data from a well. The
deep-towed hydrophone requires that the water be
deep enough for the hydrophone to be in the far field
and in addition that the reflections from the water
bottom and structure do not corrupt the measured
wavelet. None of the methods address the source
array pattern, which is important for amplitude-versus-
offset (AVO) studies
The wave equation analysis indicates that with a Conmaco 50E5 hammer operating at a 3 ft stroke:
1) A 14-inch square prestressed concrete pile driven to 69 ft would have an ultimate capacity of approximately 200 kips and a blow count of 62 blows/ft.
2) Maximum dynamic pile driving compression and tension stresses would be less than 2.0 ksi and 0.4 ksi respectively at the end of initial driving.
3) Bearing graph analyses indicate refusal would occur at ultimate capacities ranging from 320 to 360 kips at the hammer's maximum stroke of 3 ft.
MODELING THE CHLOROPHYLL-A FROM SEA SURFACE REFLECTANCE IN WEST AFRICA BY DEE...ijaia
Deep learning provide successful applications in many fields. Recently, machines learning are involved for oceans remote sensing applications. In this study, we use and compare about eight (8) deep learning estimators for retrieval of a mainly pigment of phytoplankton. Depending on the water case and the multiple instruments simultaneously observing the earth on a variety of platforms, several algorithm are used to estimate the chlolophyll-a from marine reflectance.By using a long-term multi-sensor time-series of satellite ocean-colour data, as MODIS, SeaWifs, VIIRS, MERIS, etc…, we make a unique deep network model able to establish a relationship between sea surface reflectance and chlorophyll-a from any measurement satellite sensor over West Africa. These data fusion take into account the bias between case water and instruments.We construct several chlorophyll-a concentration prediction deep learning based models, compare them and therefore use the best for our study. Results obtained for accuracy training and test are quite good. The mean absolute error are very low and vary between 0,07 to 0,13 mg/m3 .
MODELING THE CHLOROPHYLL-A FROM SEA SURFACE REFLECTANCE IN WEST AFRICA BY DEE...gerogepatton
Deep learning provide successful applications in many fields. Recently, machines learning are involved for oceans remote sensing applications. In this study, we use and compare about eight (8) deep learning estimators for retrieval of a mainly pigment of phytoplankton. Depending on the water case and the multiple instruments simultaneously observing the earth on a variety of platforms, several algorithm are used to estimate the chlolophyll-a from marine reflectance.By using a long-term multi-sensor time-series of satellite ocean-colour data, as MODIS, SeaWifs, VIIRS, MERIS, etc…, we make a unique deep network model able to establish a relationship between sea surface reflectance and chlorophyll-a from any measurement satellite sensor over West Africa. These data fusion take into account the bias between case water and instruments.We construct several chlorophyll-a concentration prediction deep learning based models, compare them and therefore use the best for our study. Results obtained for accuracy training and test are quite good. The mean absolute error are very low and vary between 0,07 to 0,13 mg/m
This document discusses using elastic inversion data from 4D seismic surveys to improve reservoir modeling and enhanced oil recovery (EOR) efforts. It presents a workflow for integrating inversion data, well logs, and reservoir simulation models. Inversion data provides acoustic impedance and Poisson's ratio volumes that can be used with well logs to predict lithology and fluids. The resulting "lithology cube" maps properties like porosity, saturation, and lithology over time. The goal is to populate reservoir simulation grids with seismic-derived properties to compare models to 4D observations and improve EOR. The methodology aims to close the loop between seismic data, reservoir properties, and simulation models to optimize reservoir management and recovery.
Skybuffer SAM4U tool for SAP license adoptionTatiana Kojar
Manage and optimize your license adoption and consumption with SAM4U, an SAP free customer software asset management tool.
SAM4U, an SAP complimentary software asset management tool for customers, delivers a detailed and well-structured overview of license inventory and usage with a user-friendly interface. We offer a hosted, cost-effective, and performance-optimized SAM4U setup in the Skybuffer Cloud environment. You retain ownership of the system and data, while we manage the ABAP 7.58 infrastructure, ensuring fixed Total Cost of Ownership (TCO) and exceptional services through the SAP Fiori interface.
Let's Integrate MuleSoft RPA, COMPOSER, APM with AWS IDP along with Slackshyamraj55
Discover the seamless integration of RPA (Robotic Process Automation), COMPOSER, and APM with AWS IDP enhanced with Slack notifications. Explore how these technologies converge to streamline workflows, optimize performance, and ensure secure access, all while leveraging the power of AWS IDP and real-time communication via Slack notifications.
For the full video of this presentation, please visit: https://www.edge-ai-vision.com/2024/06/building-and-scaling-ai-applications-with-the-nx-ai-manager-a-presentation-from-network-optix/
Robin van Emden, Senior Director of Data Science at Network Optix, presents the “Building and Scaling AI Applications with the Nx AI Manager,” tutorial at the May 2024 Embedded Vision Summit.
In this presentation, van Emden covers the basics of scaling edge AI solutions using the Nx tool kit. He emphasizes the process of developing AI models and deploying them globally. He also showcases the conversion of AI models and the creation of effective edge AI pipelines, with a focus on pre-processing, model conversion, selecting the appropriate inference engine for the target hardware and post-processing.
van Emden shows how Nx can simplify the developer’s life and facilitate a rapid transition from concept to production-ready applications.He provides valuable insights into developing scalable and efficient edge AI solutions, with a strong focus on practical implementation.
Taking AI to the Next Level in Manufacturing.pdfssuserfac0301
Read Taking AI to the Next Level in Manufacturing to gain insights on AI adoption in the manufacturing industry, such as:
1. How quickly AI is being implemented in manufacturing.
2. Which barriers stand in the way of AI adoption.
3. How data quality and governance form the backbone of AI.
4. Organizational processes and structures that may inhibit effective AI adoption.
6. Ideas and approaches to help build your organization's AI strategy.
Best 20 SEO Techniques To Improve Website Visibility In SERPPixlogix Infotech
Boost your website's visibility with proven SEO techniques! Our latest blog dives into essential strategies to enhance your online presence, increase traffic, and rank higher on search engines. From keyword optimization to quality content creation, learn how to make your site stand out in the crowded digital landscape. Discover actionable tips and expert insights to elevate your SEO game.
OpenID AuthZEN Interop Read Out - AuthorizationDavid Brossard
During Identiverse 2024 and EIC 2024, members of the OpenID AuthZEN WG got together and demoed their authorization endpoints conforming to the AuthZEN API
Unlock the Future of Search with MongoDB Atlas_ Vector Search Unleashed.pdfMalak Abu Hammad
Discover how MongoDB Atlas and vector search technology can revolutionize your application's search capabilities. This comprehensive presentation covers:
* What is Vector Search?
* Importance and benefits of vector search
* Practical use cases across various industries
* Step-by-step implementation guide
* Live demos with code snippets
* Enhancing LLM capabilities with vector search
* Best practices and optimization strategies
Perfect for developers, AI enthusiasts, and tech leaders. Learn how to leverage MongoDB Atlas to deliver highly relevant, context-aware search results, transforming your data retrieval process. Stay ahead in tech innovation and maximize the potential of your applications.
#MongoDB #VectorSearch #AI #SemanticSearch #TechInnovation #DataScience #LLM #MachineLearning #SearchTechnology
How to Interpret Trends in the Kalyan Rajdhani Mix Chart.pdfChart Kalyan
A Mix Chart displays historical data of numbers in a graphical or tabular form. The Kalyan Rajdhani Mix Chart specifically shows the results of a sequence of numbers over different periods.
Main news related to the CCS TSI 2023 (2023/1695)Jakub Marek
An English 🇬🇧 translation of a presentation to the speech I gave about the main changes brought by CCS TSI 2023 at the biggest Czech conference on Communications and signalling systems on Railways, which was held in Clarion Hotel Olomouc from 7th to 9th November 2023 (konferenceszt.cz). Attended by around 500 participants and 200 on-line followers.
The original Czech 🇨🇿 version of the presentation can be found here: https://www.slideshare.net/slideshow/hlavni-novinky-souvisejici-s-ccs-tsi-2023-2023-1695/269688092 .
The videorecording (in Czech) from the presentation is available here: https://youtu.be/WzjJWm4IyPk?si=SImb06tuXGb30BEH .
Fueling AI with Great Data with Airbyte WebinarZilliz
This talk will focus on how to collect data from a variety of sources, leveraging this data for RAG and other GenAI use cases, and finally charting your course to productionalization.
Introduction of Cybersecurity with OSS at Code Europe 2024Hiroshi SHIBATA
I develop the Ruby programming language, RubyGems, and Bundler, which are package managers for Ruby. Today, I will introduce how to enhance the security of your application using open-source software (OSS) examples from Ruby and RubyGems.
The first topic is CVE (Common Vulnerabilities and Exposures). I have published CVEs many times. But what exactly is a CVE? I'll provide a basic understanding of CVEs and explain how to detect and handle vulnerabilities in OSS.
Next, let's discuss package managers. Package managers play a critical role in the OSS ecosystem. I'll explain how to manage library dependencies in your application.
I'll share insights into how the Ruby and RubyGems core team works to keep our ecosystem safe. By the end of this talk, you'll have a better understanding of how to safeguard your code.
1. 1
Z-99 TITLE AVO INVERSION AND PROCESSING: DEDICATION AND INTEGRATIONMARCEL
ZWAAN, YVAN CHARREYRON, DAVE BATEMANSHELL EPE 1 ALTENS FARM ROAD NIGG, ABERDEEN, AB12 3FY,
U.K.EAR99 classification
Summary
In the past processing and inversion projects were often carried out consecutively and independently from each
other. Over the last few years we have strived to change this and an effort has been made to ensure the projects
are truly integrated. To this end, we have developed diagnostics that can be carried out very early in the
processing sequence, which enables us to quickly identify problem areas in the data and make decisions on how
best to address these issues.
Also, it is known that pseudo-shale volume- (V-shale) and porosity-cubes derived via simultaneous AVO
inversion can be used to mitigate uncertainties in the static reservoir model. We will show that the “goodness-of
fit” between the seismically derived shale-volume cube and recorded logs (within the seismic bandwidth) can be
incorporated as part of the QC process.
Introduction
Over the past years inversion projects were largely detached from prior processing work and not geared up to
feed directly into the reservoir model. It was realised that the impact and the efficiency of the whole process
from processing through to the static reservoir model building would benefit from a fully integrated approach
between all the component steps. The combined Pre-Stack Depth Migration and AVO inversion over the
Penguin field was one of these fully integrated projects. This paper describes the aspects and diagnostics of this
integrated workflow.
One of the key aspects that drives the quality of the simultaneous AVO inversion results is pre-stack amplitude
reliability. Because the inversion process is based on the Aki & Richards reflectivity equation, the pre-stack data
has to satisfy – in an approximate sense - this theoretical angle-dependent amplitude behaviour.
This paper discusses the techniques that are utilised to assess the AVO behaviour on the data and their impact on
the processing sequence. We also discuss the inversion result, tying this to the requirements of the field
development.
A Brief description of the Penguin field
The Penguin cluster was discovered back in 1974 and can be subdivided into 5 independent fields: Penguin A, B,
C, D & E. It produces from intra-Kimmeridge Magnus sands (Penguin A), Triassic sands (Penguin B) and from
a more classical Brent reservoir sequence (Penguin CD&E). The development of the field only started in Q4
2001when the latest technology
Penguins made it an economically viable
proposition. The field is produced
via a 65 km long flow-line tied-back
to the Brent Charlie platform
located some 50km south of the
Penguin E field. This study
concentrates on the geologically
similar Penguins C, D (light oil
bearing) and E (gas condensates
bearing) fields located
approximately 11000 ft below
Figure 1 Location and outline of the Penguin cluster. surface. Average reservoir sand
thickness varies between 130 and
225 ft, average porosity is 15% with an average Net-to-Gross ratio around 75%. The Etive sands overlay the
Rannoch sequence and together they constitute the main productive intervals, with reservoir quality generally
degrading from top to base. Since lateral and vertical variability in reservoir quality is expected, the main scope
of the inversion project is to define the extent of the good reservoir layers.
EAGE 66th – W5 - What pre-stack data and processing do we need for reservoir characterization —
Paris, France, 6 June 2004
2. 2
Project planning and inversion feasibility
Because of the field’s structural complexity, it was decided that a Pre-Stack Depth Migration (PreSDM) was to
be carried out over the Penguin cluster. In the planning of the processing and inversion sequence, the AVO
feasibility step was started at the beginning of the PreSDM velocity model updating cycle, in order to be able to
impact the final migration result prior to inversion. Therefore the feasibility study and the velocity model
updating were carried out in parallel.
At the start of the project - in parallel to the seismic data processing - P- and S-sonic logs and density logs were
edited, and corrected for borehole invasion effects. Then, Gassmann fluid substitution was performed and the
resulting brine, oil and gas(-condensate) bearing logs were used to model AVO synthetic seismic from which it
became apparent that no reliable hydrocarbon indicator was likely to be found. However, cross-plot analysis
including reservoir-sand and overlying shale sequences showed that there was scope for lithology separation in
the Ip-Is domain. Therefore the main target of the inversion workflow became facies identification and
subsequently identification of high porosity sand units.
Avo Diagnostics
Two types of AVO diagnostics were carried out, and both methods will be described here in more detail. The
first method is a diagnostic applied to pre-stack data, which are in this case the common image gathers obtained
from Pre-Stack Depth Migration. The second
diagnostic is a sub-stack diagnostic, applied to the near
mid and far angle stacks.
The first method, pertaining to pre-stack common
image gathers identifies problems with the fit of the
two-term Aki and Richards equation to the amplitudes
of this pre-stack data: A(θ ) = L + M sin 2 θ .
The above two terms are commonly known as intercept
and gradient. This two-term equation is fitted to the
events on common image gathers. (The velocities
employed in the migration yield the time variant offset
versus angle relations.) Subsequently, for each angle, a
Figure 2 RMS of the Near Mid and Far error cubes Obtained by “synthetic” amplitude is computed from the above
a gated measurement over the top Brent horizon equation, which can then be subtracted from the
observed seismic amplitude. In this manner an “error”
value can be obtained, for every time sample, at every angle (cf. “Making AVO Sections More Robust” by
Andrew Walden, BP, 52nd EAGE Meeting Copenhagen, 1990). This error is squared and is then summed for
each sub-stack angle range to obtain an average error pertaining to the near, mid and far angle ranges,
respectively. Note that in this manner we have obtained three cubes of data (for the near, mid and far angle
ranges) that contains an average error over each of the angle range for every time sample. After taking the square
root, the rms-error can be viewed either as a volume, or alternatively rms-error horizons can be extracted, e.g. in
time gates around key horizons. In a schematic view the error computation can work like this:
Amplitude vs. error vs. angle
angle
Figure 2 shows the rms-
Figure 3
error maps computed
Image gathers Image
from the near mid and
far “error” cubes,
respectively. These
maps have been
obtained from a
windowed measure-
ment along the top
reservoir horizon (see
Fig. 3, yellow marker
indicates the top Brent
pick) with the blue
colour indicating high
error. These maps
provide a quick tool to
Figure 3 Image Gathers (left) with indications of multiples, and residual move out
Stacked image gathers (right) with X-unconformity (red), top Brent (yellow) and top Dunlin (green)
3. 3
locate the areas of high error, allowing the common image gathers and their corresponding stack to be inspected
to identify the potential cause of these large misfits. The common image gathers and a migrated stack are
displayed in Fig. 3, to illustrate the usefulness of this diagnostic. Some of the gathers indeed show problematic
behaviour (arrows in Fig. 3). Residual
move-out is also visible, but that is
not yet important at this stage, as this
first depth migration only uses an
initial velocity model. By contrast,
much more important are the
suspected multiples over the reservoir
section.
This diagnostic allowed us to identify
very early in the processing the
requirement that a further multiple
removal application on the final
volume migrated output would be
necessary. The products on input to
the simultaneous AVO inversion are
the near, mid and far angle stacks.
The standard pre-inversion processing
procedure comprises the alignment of
Figure 4 Near Mid and Far stacks. The amplitudes become stronger the different angle stacks and a
from near to mid, and then drop again from the mid to far stack. This area was spectral shaping of the near and far
identified by means of the sign-flip diagnostic. stacks towards the spectral character
of the mid angle stack.
For this data, the spectral balancing was preceded by two multiple removal steps, a (pre-stack) tau-p decon-
volution over the reservoir section, and a further post-stack multiple removal deeper down on each of the angle
stacks so as not to affect the amplitude behaviour over the reservoir. After this processing stage, the second type
of AVO diagnostic can be run. This is a post-stack diagnostic that consists in a repeated fit of the two-term Aki
and Richards equation to the sub-stacks. Firstly, a fit to the near and mid sub-stacks delivers the first set of
intercept and gradient values, followed by a fit to the near and the far, that delivers a second set of intercept and
gradient values. It is generally known that the computed gradient values will display much lower signal to noise
levels than the intercept (which indeed only shows small variation in both fits), but on the other hand, a high
level of accuracy of the gradient term is not required for the diagnostic computed here. Actually the only aspect
that we are really interested in is a change of sign of “large” gradient terms:
M 2 − M1
S = 200sign( M 1 ) sign( M 2 ) .
M1 + M 2
Figure 4 illustrates this gradient difference map with an arrow indicating an area where the gradient sign-flip
occurs (when S is negative). The near, mid and far angle stacks are also shown, with the area of the gradient sign
change indicated by the ellipses over the sections.
The conclusion that can be drawn from this post-stack
diagnostic is based on the fact that these identified
problem areas are very limited in extent. Because these
“noisy” areas don’t seem to represent an extensive
problem the overall conclusion made from these
diagnostics is that an AVO inversion would provide
reliable and sensible results.
Further QC’s were carried out on the stacks prior to the
inversion. These diagnostics assessed: data alignment,
multiple removal, and the spectral balancing. An AVO
inversion with Jason software was performed,
producing P- and S-impedance cubes. Based on the
Figure 5 Well logs (green) and V-shale cube (red) compared at the
142S1 and 141S2 wells rock-physics model, a shale-fraction cube and a porosity
cube were derived from these Ip and Is volumes.
Inversion results
Raw inversion products, as well as derived V-shale and porosity cubes were QC-ed against well measurements.
In order to assess AVO information only, both cubes and well logs were filtered back to the seismic bandwidth.
The “goodness of fit” between band-limited logs and derived cubes is observed to be generally good as
EAGE 66th – W5 - What pre-stack data and processing do we need for reservoir characterization —
Paris, France, 6 June 2004
4. 4
illustrated in Figure 5. Furthermore, in
order to assess the potential added value
of the inversion products, they were
compared with the existing reservoir
model. In comparing porosity maps (see
Fig.6), it can be seen that average trends
are very similar, but the seismically
derived products may deliver additional
information that is not yet captured in the
current model. These results still need
further evaluation before they could be
used to constrain higher resolution
lithology and porosity cubes of the static
reservoir model. An alternative manner
to evaluate inversion results consists in
looking at the horizontal wells that were
not included in the low-frequency
Figure 6 Porosity column from the reservoir model (left) compared with the one of the
inverted cube (right). The inversion result sows more detail at several locations. inversion background model. In this
respect, the C2 and D1 production wells
were not incorporated in the inversion
workflow, and therefore they represent
good reliable blind tests.
As shown in Figure 7, the C2 well
encountered a thin up-thrown shale block
within the reservoir interval, that had
never been spotted on reflection seismic,
but which was correctly indicated on the
V-shale section of the inverted result.
Similarly, when compared to the D1 logs,
the V-shale cube derived from the
inversion showed a good match. This
included the identification of a sand body
at the toe of the well that was poorer
quality than expected from the reflectivity
data.
Due to the varying thickness of the
overlaying Humber group (Kimmeridge
and Heather shales), the top Brent pick
Figure 7 The horizontal C2 well (not indicated) encountered an up-thrown shale block
in the reservoir section. The vertical 211/13-2 well (indicated) shows a very thin cannot easily be interpreted accurately on
Kimmeridge section of approximately 30 ft. The V-shale cube from the inversion ties reflectivity data, as it can be masked by
the well log very well over the reservoir section. the side-lobe energy from the much
stronger contrast at Base Cretaceous
unconformity level. Because of the broader bandwidth of the inversion result that tends to minimize tuning
effects, the resultant cubes also offer the possibility for refining top-reservoir interpretation for increased
volumetric accuracy.
Conclusion
The two AVO diagnostics, a pre-stack and a post-stack AVO diagnostic, discussed in this paper have proven to
be successful during this integrated project, and have impacted the processing sequence to optimize the inversion
result. Subsequently, we showed that the inversion cubes exhibit some very positive features that have been
confirmed by “blind well” results. Further evaluation of the inversion-data is needed before it – or part of it is
included in the reservoir model. Finally, the AVO diagnostics presented here have made an important
contribution to the integration of the several components of this combined PreSDM - AVO inversion project.
Acknowledgements:
The authors would like to thank Exxon-Mobil and Shell EP Europe for their kind permission to publish this
material. Moreover, we want to thank several of our colleagues who contributed to the development of the AVO
diagnostics, Peter Ashton, Greg Hester, Henk Tijhof and Peter Rowbotham. Furthermore, we want to mention in
particular Alexander Sementsov and Richard Shipp for their work on the inversion and PreSDM, respectively.