The impact of working capital management on firm profitability in different b...
Similar to Zhongmin Baihui - Overvalued S-Chip Chinese Retailer with Weak Performance, Sub-Par Corporate Governance and Questionable Related Party Transactions
Principles of Marketing 17e Chapter 2 Company and Marketing Strategy.pptxBishoyRomani
Similar to Zhongmin Baihui - Overvalued S-Chip Chinese Retailer with Weak Performance, Sub-Par Corporate Governance and Questionable Related Party Transactions (20)
2024 May - Clearbit Integration with Hubspot - Greenville HUG.pptx
Zhongmin Baihui - Overvalued S-Chip Chinese Retailer with Weak Performance, Sub-Par Corporate Governance and Questionable Related Party Transactions
1. Zhongmin Baihui Retail Group Ltd | Page 1
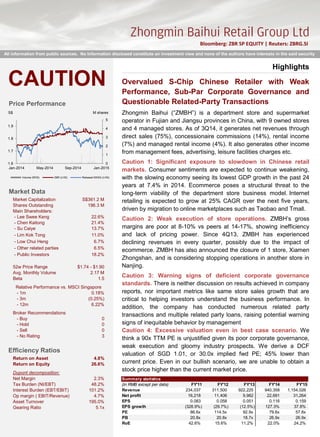
Market Data
Efficiency Ratios
Highlights_____________________________________________________________________________________________________________________________________________________________________________________________________________________________________________________________________________________________________________________________________________________________________________________________________________________________________________________________________________________
Overvalued S-Chip Chinese Retailer with Weak
Performance, Sub-Par Corporate Governance and
Questionable Related-Party Transactions
Zhongmin Baihui (“ZMBH”) is a department store and supermarket
operator in Fujian and Jiangsu provinces in China, with 9 owned stores
and 4 managed stores. As of 3Q14, it generates net revenues through
direct sales (75%), concessionaire commissions (14%), rental income
(7%) and managed rental income (4%). It also generates other income
from management fees, advertising, leisure facilities charges etc.
Caution 1: Significant exposure to slowdown in Chinese retail
markets. Consumer sentiments are expected to continue weakening,
with the slowing economy seeing its lowest GDP growth in the past 24
years at 7.4% in 2014. Ecommerce poses a structural threat to the
long-term viability of the department store business model. Internet
retailing is expected to grow at 25% CAGR over the next five years,
driven by migration to online marketplaces such as Taobao and Tmall.
Caution 2: Weak execution of store operations. ZMBH’s gross
margins are poor at 8-10% vs peers at 14-17%, showing inefficiency
and lack of pricing power. Since 4Q13, ZMBH has experienced
declining revenues in every quarter, possibly due to the impact of
ecommerce. ZMBH has also announced the closure of 1 store, Xiamen
Zhongshan, and is considering stopping operations in another store in
Nanjing.
Caution 3: Warning signs of deficient corporate governance
standards. There is neither discussion on results achieved in company
reports, nor important metrics like same store sales growth that are
critical to helping investors understand the business performance. In
addition, the company has conducted numerous related party
transactions and multiple related party loans, raising potential warning
signs of inequitable behavior by management
Caution 4: Excessive valuation even in best case scenario. We
think a 90x TTM PE is unjustified given its poor corporate governance,
weak execution and gloomy industry prospects. We derive a DCF
valuation of SGD 1.01, or 30.0x implied fwd PE; 45% lower than
current price. Even in our bullish scenario, we are unable to obtain a
stock price higher than the current market price.
Market Capitalization S$361.2 M
Shares Outstanding 196.3 M
Main Shareholders:
- Lee Swee Keng 22.6%
- Chen Kaitong 21.4%
- Su Caiye 13.7%
- Lim Kok Tong 11.0%
- Low Chui Heng 6.7%
- Other related parties 6.5%
- Public Investors 18.2%
52w Price Range $1.74 - $1.90
Avg. Monthly Volume 2.17 M
Beta 1.5
Relative Performance vs. MSCI Singapore
- 1m 0.18%
- 3m (0.25%)
- 12m 6.22%
Broker Recommendations
- Buy 0
- Hold 0
- Sell 0
- No Rating 3
Return on Asset 4.8%
Return on Equity 26.6%
Dupont decomposition:
Net Margin 2.3%
Tax Burden (NI/EBT) 48.2%
Interest Burden (EBT/EBIT) 101.2%
Op margin ( EBIT/Revenue) 4.7%
Asset Turnover 195.0%
Gearing Ratio 5.1x
Zhongmin Baihui Retail Group Ltd
Bloomberg: ZBR SP EQUITY | Reuters: ZBRG.SI
0
1
2
3
4
5
1.6
1.7
1.8
1.9
Jan-2014 May-2014 Sep-2014 Jan-2015
Volume (RHS) ZBR (LHS) Rebased MXSG (LHS)
M sharesS$
Price Performance
Summary statistics
(in RMB except per data) FY'11 FY'12 FY'13 FY'14 FY'15
Revenue 234,037 311,500 922,225 940,358 1,154,026
Net profit 16,218 11,406 9,982 22,691 31,264
EPS 0.083 0.058 0.051 0.116 0.159
EPS growth (328.9%) (29.7%) (12.5%) 127.3% 37.8%
PE 86.6x 114.5x 92.9x 79.6x 57.8x
PB 20.8x 20.8x 18.7x 26.9x 26.9x
RoE 42.6% 15.6% 11.2% 22.0% 24.2%
CAUTION
All information from public sources. No Information disclosed constitute an investment view and none of the authors have interests in the said security
2. Zhongmin Baihui Retail Group Ltd | Page 2
Business Description_____________________________________________________________________________________________________________________________________________________________________________________________________________________________________________________________________________________________________________________________________________________________________________________________________________________________________________________________________________________
Pure-play Chinese department store company listed on SGX
Zhongmin Baihui Retail Group Ltd (“ZMBH” or “the Group”) is a
department store operator in China with most of its operations situated
in the Fujian province. It retails fashion wear, electrical appliances and
has a supermarket segment. ZMBH hopes to target the middle to
middle-upper consumer segment and carries internationally renowned
brands such as Nike, Adidas, Maybelline and Montagut. Currently,
ZMBH has 13 stores including 9 self-owned stores and 4 managed
stores, spanning an aggregate gross floor area of 2,260,000 sq ft. By
the end of 2016, ZMBH plans to expand to 15 stores and achieve a
gross floor area of 3,226,000 sq ft. Approximately 15% of ZMBH’s store
space is allocated to its supermarket segment with the remaining
allocated to department store.
Strategic store locations situated in areas with good
demographics and high traffic. Of its 9 self-owned stores, 5 are
situated in Xiamen, 3 are located in Quanzhou city, and 1 is located in
Nanjing. According to financial magazine CBNweekly dated October
2014, Xiamen was most recently promoted to a Tier-1 city owing to its
solid economic foundation attributed to stronger consumption, tourism
and commercial activity. Within Xiamen, ZMBH operates its flagship
store, Xiamen Wucun, which has 3 floors and a basement level and is
strategically located at a transportation hub connecting the bus terminal,
bus rapid transit and high speed train terminal, with an expected
pedestrian traffic of 100,000 daily.
Diversified revenue mix boosted with other income. The Group’s
revenue is mainly derived from direct sales of its own merchandise and
inventories, commission from concessionaire sales, rental income, and
managed rental fees from retail partners. Other income sources include
management fees from operating its managed stores, leisure facilities
charges, entertainment, advertising, and promotion fees.
Experienced management team and notable board members. The
CEO, Mr. Chen Kaitong has over 30 years of experience in China’s
retail industry and serves as the Chairman of Quanzhou City Store &
Franchise Association. He is also a member of the National People’s
Congress representing Quanzhou City. The Founder and Chairman, Mr.
Lee Swee Keng, who is a distant relative of the CEO, has over 30
years of business experience managing various enterprises. Other
notable directors on the board include independent directors Dr. Ong
Seh Hong, a Member of Parliament in Singapore, and Mr. Koh Lian
Huat, an accounting partner specializing in real estate.
Figure 1: ZMBH Store Locations
Figure 2: Revenue Breakdown
RMB
922m
FY2013
73% Direct Sales
11% Concessionaire comms
6% Rental Income
5% Managed Rental
4% Advertisement Fees
1% Management Fees
100%
Zhongmin
Baihui
Development
Pte Ltd
100%
Zhongmin
Baihui
(Quanzhou)
Commercial
Management
Co Ltd
100%
Xiamen Shi
Zhongmin
Baihui
Commercial
Co Ltd
100%
Zhongmin
Baihui
(Nanjing)
Commercial
Co Ltd
Quanzhou
ZMBH
Private
Sister
Company
Zhongmin Baihui
Retail Group Ltd.
Figure 3: Group Structure
3. Zhongmin Baihui Retail Group Ltd | Page 3
Key related party relationships and group structure. The Group has
four fully-owned subsidiaries and a key related-party relationship to a
sister company, Quanzhou Zhongmin Baihui Shopping Co., Ltd
(“QZMBH”) that is 100% privately-owned by 3 board directors Chen
Kaitong, Su Caiye and Su Jianli. QZMBH owns department stores
under the ZMBH label and pays ZMBH a management fee for
operating these stores. Currently, 4 out of 13 stores under ZMBH’s
operations are managed stores. The remaining 9 self-owned stores
operate under Xiamen Shi Zhongmin Baihui Commercial Co., Ltd.
(“XZMBH”).
Industry Overview_____________________________________________________________________________________________________________________________________________________________________________________________________________________________________________________________________________________________________________________________________________________________________________________________________________________________________________________________________________________
Chinese macro headwinds and strong ecommerce competition
Moderately competitive industry facing risk of disruption from
substitutes. Our Porter’s Five Forces analysis highlights a few key
insights. Supplier bargaining power is limited due to the fragmented
nature of the supplier base. Customer bargaining power is significant:
although the customer base is not concentrated, information about
products on offer is widely available, switching costs are low, and price
elasticity is high given the fact that industry sales are driven by
discretionary purchases. Threat of new entrants is not significant, as
entering the market requires high fixed capital and moderately
significant working capital investment. Threat of substitutes is the most
significant risk facing the industry, with ecommerce making great
inroads and taking market share from mainstream retailers.
Broader macroeconomic indicators exhibit slowdown in 2013-2014.
Following fears of a hard landing since 2012, the Chinese economy
has seen a visible slowdown in economic growth with 2014 GDP
coming in at 7.4%, 10 bps below the PRC government’s target. A
severe correction in the property market continues to dampen
investment, while weaker global demand is hurting manufacturing.
While the retail sector has seen respectable growth of 10.7% CAGR
over the past five years, growth is beginning to slow down on the back
of declining consumption levels. On a whole, consumer confidence has
remained tepid through 2014 and is expected to remain subdued in the
near future.
Slowdown of store-based retail growth. There is evidence that
store-based retailers are seeing a significant slowdown in profit growth
due to soaring rent and wage costs. Many large retailers have been
significantly impacted and plan to scale back expansion plans for 2015.
For example, Carrefour has become more cautious about new store
expansion in China, while Wal-Mart closed three stores in 2013 and is
expected to close a further 15-30 outlets in China over 2014-2015.
Competitive
Rivalry
Buyer power
Supplier
power
Threat of new
entrants
Threat of
substitutes
Figure 4: Porter’s 5 Forces Industry Analysis
95
97
99
101
103
105
107
109
111
113
2008 2009 2010 2011 2012 2013 2014
Figure 5: China Consumer Confidence Index
-10%
-5%
0%
5%
10%
15%
1H12 2H12 1H13 2H13 1H14
Golden Eagle Intime Retail
Parkson Retail New World
Sun Art
Figure 6: Widespread SSSG Decline
2015
4. Zhongmin Baihui Retail Group Ltd | Page 4
Growth of ecommerce a major threat to retail industry. Despite
accounting for only 15% of total retail sales, online purchases have
been growing at a rapid pace of 60% CAGR between 2008 and 2013.
Over the next five years, online retailers such as Alibaba and JD.com
are expected to continue expansion and offer more diversified products.
This will attract higher gross sales value to online platforms and grab
market share from traditional retailers. Over the next five years, internet
retail is forecasted to grow at 25% CAGR. The threat of ecommerce to
traditional retail is reflected in an across-the-board decline in same
store sales growth (SSSG) since 2012, suggesting that a larger
proportion of consumers are switching to online channels for their
purchases.
Retail sales affected by corruption crackdown. Due to a harsh
crackdown on corruption by the Xi administration, the retail industry has
suffered. One example is the decline of gift card sales, a favoured
means for corrupt businessmen to bribe officials as the transactions are
hard to track. Such corporate gift cards have traditionally been used for
higher-end jewelry, watches, premium apparel and cosmetics.
Following the corruption crackdown, sales relating to the gift cards
have plummeted, impacting gross sales value by almost 30%.
Financial Analysis_____________________________________________________________________________________________________________________________________________________________________________________________________________________________________________________________________________________________________________________________________________________________________________________________________________________________________________________________________________________
Unsustainable historical financial performance
Weak margins compared to peer average show poor cost control.
ZMBH has low gross margins at 8-10% compared to the department
store peer average of 14-17%. Even when compared with supermarket
peers, the average gross margin is >20% or double what ZMBH is
earning. A thin gross margin could imply weak bargaining power with
suppliers, due to its smaller scale versus other more established
department store and supermarkets. The company also suffers from a
very thin net profit margin of 1%, as compared to its peer average of
16%. Persistently thin margins on the gross and net levels indicate
poor cost control and an overall lack of pricing power.
Unsustainable concessionaire rates. ZMBH has the highest
concessionaire rates at 21.2% in FY2013 versus its peers who have
rates ranging from 15-18%. Given that it is a small regional player in
Fujian with most of its stores in second and third-tier cities, the high
concessionaire rates will converge to the average as bargaining power
remains weaker than larger competitors. Given the slowing
macroeconomic backdrop threatened with greater competition from
ecommerce, it is unlikely that ZMBH can maintain its high
concessionaire rate going forward.
8.9%
18.3%
14.1%
17.5%
14.7%
22.2%
0.0%
5.0%
10.0%
15.0%
20.0%
25.0%
ZMBH Golden
Eagle
Intime
Retail
Parkson
Retail
New
World
Sun Art
Figure 7: Gross Margin Comparison
Average
17.4%
5. Zhongmin Baihui Retail Group Ltd | Page 5
ROE – Dupont decomposition. ZMBH enjoys a ROE of 26.6%, higher
than the peer average of 12.2%. This seemingly high figure is largely
due to ZMBH’s debt-free expansion and its small shareholder equity
given its small size compared to peers. Breaking down ROE in the 5-
step Du Pont analysis raises more insights:
Tax burden: Our net income divided by earnings before tax is 48.2%,
implying a tax rate of >50%. This seems to be excessively high given
that the corporate tax rate in China is 25%. We believe this is due to
the presence of rent-free incentives included under rental expenses
which may not be tax deductible. Adding back the non-cash rent-free
incentives, we have a tax rate closer to 30%.
Interest burden: ZMBH’s EBT / EBIT ratio is at 101.2%, which
seems dislocated to its adjusted D/E ratio of 11x. This is because the
company classifies its operating lease expenses under rental
expenses, while it has no borrowings in its balance sheet, which
distorts the interest burden ratio.
Operating margin: ZMBH enjoys a 4.7% EBIT margin, far below
department store peers’ average of 27%, but similar to Sun Art’s 5%.
However, we are still surprised at such a low margin as its
concessionaire and management fee income should increase its
operating margin to ~10%, higher than a pure hypermarket player like
Sun Art.
Asset turnover: ZMBH’s asset turnover is 1.95x, similar to Sun Art’s
asset turnover of 1.8x, but far from department store peers average
of 0.3x. This could firstly suggest that despite how management is
describing its business as a department store, the business is run
more similarly to a hypermarket. Secondly, there may have been a
one-off inflated revenue due to contribution from new shops in 2013.
Gearing ratio: ZMBH’s gearing is at 5.1x, significantly higher than
peer average of 2.5x. This means that ZMBH cannot afford to take on
more leverage to finance its expansion going forward.
Cash conversion cycle. ZMBH enjoys a cash conversion cycle (CCC)
of -32 days. This compares poorly against its department store peers,
who have a significantly better CCC of -843 days. Even Sun Art, a
pure-play hypermarket player has a CCC of -85 days. Department
stores have far higher accounts payable days due to their reliance on
the concessionaire sales model, in which the store collects on behalf of
tenants before releasing payments to them net of concessionaire
commissions. In contrast, ZMBH relies heavily on direct sales. On the
other hand, the weak CCC might also imply that ZMBH has not been
using its working capital efficiently and can improve its cash
management policies.
26.6%
21.9%
10.5%
4.9%
7.1%
16.5%
0.0%
5.0%
10.0%
15.0%
20.0%
25.0%
30.0%
ZMBH Golden
Eagle
Intime
Retail
Parkson
Retail
New
World
Sun Art
Figure 8: Return on Equity Comparison
Average
12.2%
Profit
Margin
Tax
Burden
Interest
Burden
Operating
Margin
Asset
Turnover
Gearing
Ratio
2.3%
48.2%
101.2%
4.7%
1.95x
5.1x
6. Zhongmin Baihui Retail Group Ltd | Page 6
Erratic financial performance since 2013
Declining net income since listing reversed with 3x spike in TTM
net income (Figure 9). While net income peaked at RMB 16.2m in
2011 at IPO, it has declined steadily to RMB 10.0m for FY13. However,
in the latest 3Q14 trailing twelve months, this trend was reversed and
net income shot to a record high of RMB 31.3m. This is likely due to
expansion plans in 2013 which involved the asset transfer of 2 fully-
operational managed stores from QZMBH in May 2013 and the launch
of 2 new self-owned stores, one in May and one in November 2013.
According to management, newly opened stores require a 2 year
gestation period to ramp up productivity and reach operational steady
state. However, when we compare these numbers with operational
data points such as sales psf, the new stores seem to be generating
sales psf nearly in an impractical range.
Strong downward pressure even with optimistic outlook. Breaking
down the revenue figures further uncovered that sales psf generated
from the new stores seemed improbable. Based on backward
inductions, we found that in order to justify the derived sales psf figure
in 2013 of RMB 909, the 4 new stores (2 transferred-in and 2 new)
would have to generate a sales psf value of RMB 1,152. This seems
improbable given that the current best-performing store, Xiamen
Wucun, has a sales psf of RMB 1,000. Factoring in the gestation period
of 2 years for the 2 new stores and considering the less attractive
location of the 2 transferred-in stores, it is highly unlikely for these new
stores to provide a ~64% uplift required to achieve 2013 sales psf. Also,
ZMBH’s stores are located in tier-2-going-tier-1 cities, with lower buying
power compared to consumers in first-tier cities. For comparison,
Golden Eagle, the most efficient company in the peer group with
exposure to tier 1 cities, has a sales psf of RMB 1,400. We were
unable to derive reasonable operational numbers from the spike in
revenues, and there is no explanation or discussion about such results
by management, giving little visibility to ZMBH’s future income stream
and the sustainability of TTM profit uptrend.
Figure 9: Margin trend over 2013 – 2014
-5.0%
0.0%
5.0%
10.0%
15.0%
20.0%
1Q12 2Q12 3Q12 4Q12 1Q13 2Q13 3Q13 4Q13 1Q14 2Q14 3Q14
Gross Margin EBIT Margin NPAT Margin
Initial revenue
spike not matched
with profits despite
store transfer
Erratic profits
gains in following
quarters. Too soon
for new stores to
reflect profit
High growth spike
168
366
241
350
852
727
523 481
642322
451
343
403
481
458
386
343
510
490
817
584
753
1,333
1,184
909
824
1,152
-
500.0
1,000.0
1,500.0
31-Dec-
10
31-Dec-
11
31-Dec-
12
31-Mar-
13
30-Jun-
13
30-Sep-
13
31-Dec-
13
Existing
(3)
New (4)
PSF SGD
sales growth by category
Direct sales RMB psf Concessionary sales psf
Split between
new and old assets
Figure 10: Sales psf development and implied contribution in FY 2013
7. Zhongmin Baihui Retail Group Ltd | Page 7
Declining quarterly sales since 2Q14. Despite the expansion plans in
2013, ZMBH’s quarterly revenue peaked in 4Q13, and started to
decline again. While management attributed the results to a gestation
period of the 2 new self-owned stores and a gold rush in 2013, we
believe the decline was due to worsening industry conditions, as
consumers migrated to ecommerce while the economy further slowed
down. Such a decline in revenue is consistent with other department
store peers, all of whom reported negative SSSG in the first half of
2014. It is highly likely that ecommerce will structurally threaten the
business model of department stores and there remains little optimism
that a small player like ZMBH will be able to buck the trend.
Huge off-balance sheet operating lease agreements portray riskier
leverage ratios than perceived. A cursory look at the balance sheet
would suggest ZMBH has a very conservative capital structure without
any debt. However, after adding back the RMB 1.2b operating lease
obligations as well as for its peers, ZMBH has an eye-popping adjusted
net debt-to-equity ratio of 11.4x compared to an adjusted peer average
of 2.2x! The leases from these normalized ratios were not capitalized
for comparability purposes among peers to iron out varying tenures and
cost of debt. As such, this calls for a more judicious analysis of ZMBH’s
capital structure before investing in this over-leveraged yet deceptively
debt-free company.
Corporate Governance_____________________________________________________________________________________________________________________________________________________________________________________________________________________________________________________________________________________________________________________________________________________________________________________________________________________________________________________________________________________
Questionable corporate structure coupled with weak
disclosures and insider selling
Insufficient operational performance disclosure, especially sales
psf. ZMBH’s corporate disclosure policy leaves much to be desired.
The company’s annual reports do not provide management discussion
and analysis of the company’s financial performance and only a brief
mention of performance is mentioned in the Chairman’s letter. The
company does not disclose core operational matrices for retailers, such
as gross sales per store, sales mix and same store sales growth. The
company’s opaque disclosure policy falls short of that of its peers and
makes it challenging to benchmark the company’s performance
adequately and justify the anomalous revenue growth in 2013.
Numerous related party transactions raise questions about
conflict of interest. Over the past years, ZMBH has transacted
repeatedly with Quanzhou ZMBH (“QZMBH”), a privately owned
company owned by members of the ZMBH Board of Directors - Chen
Kaitong, Su Caiye and Su Jianli. QZMBH was founded by the current
CEO, Mr. Chen Kaitong. At ZMBH’s startup, QZMBH was used to pre-
emptively acquire lease agreements for retail venues which lessor
Figure 10: Setup & Related Party Transactions
Zhongmin Baihui Retail
Group Ltd - “ZMBH”
100%
Zhongmin Baihui
Development Pte Ltd
Zhongmin Baihui
(Nanjing) Commercial
Co Ltd
Hui’an
Hongyi
49%
Sis
Co.
Management
Agreements
& Asset
Transfers
1
Zhongmin Baihui
(Quanzhou)
Commercial Mgmt Co
Ltd - “QZM”
2
Lease
Agreement
Xiamen Shi Zhongmin
Baihui Commercial Co
Ltd - “X”
30%
Citi-Base
Commerce
Logistics
(Xiamen) Co
Ltd
3
Storage &
Delivery
100%
100%
100%
Quanzhou ZMBH
“QZMBH”
All Other Shareholders Chinese Board of Directors
100%38.5%61.5%
Management Agreements
& Asset Transfer
• QZMBH owns stores under ZMBH’s label.
QZM manages stores, earns management fee
(~RMB 1.6m/store)
• QZMBH transfers ‘managed stores’ to QZM
when fully operational through an asset
transfer structured with favourable terms
1
Lease Agreement
• Hui’an leases a commercial centre to QZM
• QZM pays annual lease ~RMB 10m to Hui’an.
• Since QZMBH owns 49%, Chinese board of
directors effectively earn a proportionate
amount of lease from Hui’an through listco
2
Storage and Delivery
• JV established with to store and deliver goods
for X to reap economies of cost
• X holds a minority stake, JV could be used to
hold inventory to understate listco assets
• No operations commenced yet
3
Concerns
8. Zhongmin Baihui Retail Group Ltd | Page 8
rights are then transferred to ZMBH upon its listing. Currently, QZMBH
owns 4 stores which are managed by ZMBH for an annual
management fee of RMB 1.6m per store.
ZMBH has a history of numerous related party transactions with
QZMBH (Figure 10), including asset transfers with suspect
consideration and lease agreements. Engaging Asiasons as its
underwriter, ZMBH’s RMB 10m asset transfer constituted RMB 8.8m of
intangible assets. The prevalence of related party transactions is a
potential corporate governance deficiency which could result in
earnings management, conflict of interest and agency problems.
Multiple related party loans. There are also multiple loans to and from
related parties. These loans are unsecured, non-interest bearing and
payable on demand. This makes us wonder if the major shareholders
are treating ZMBH as their personal “piggy bank” where they can draw
out loans at no cost anytime they wish to. If the company does indeed
have excess capital which they can take out from the company, then
this capital should be returned to shareholders in the form of dividends.
Shareholders selling stakes after IPO. While the listing of ZMBH on
the Catalist exchange on 21 January 2011 was a primary issuance of
30m new shares, we observe a significant sell down of shares among
the board of directors following the IPO ‘pop’. Directors’ act of
monetizing their stakes after IPO, indicate a lack of confidence and a
lower future expected value of the company than the post-IPO price.
Increase in shareholding of Chinese Board of Directors who own
QZMBH. After IPO, we notice that the Directors who own the sister
company Quanzhou ZMBH, Chen Kaitong, Su Caiye and Su Jianli
have increased their stakes significantly. This serves as a potential
warning sign especially when more decisional power is transferred to
these directors who can potentially orchestrate more related
party transactions with QZMBH. These 3 directors now own 37.9% of
total shares outstanding and are likely to increase their stakes going
forward.
Figure 11: Change in Director Shareholdings
since 2010
-80.0%
-60.0%
-40.0%
-20.0%
0.0%
20.0%
2010 2011 2012 2013 3Q 2014
Lee Swee Keng, Chairman
Chen Kaitong, CEO
Su Caiye, Director
Lim Kok Tong, Director
Low Chui Heng, Director
Su Jianli, Director
; Net Chg: (7.6%)
; Net Chg: 58.1%
; Net Chg: 15.0%
; Net Chg: 95.0%
; Net Chg: (5.4%)
; Net Chg: 0%
*Net change in shareholding post-IPO
IPO
9. Zhongmin Baihui Retail Group Ltd | Page 9
Valuation_____________________________________________________________________________________________________________________________________________________________________________________________________________________________________________________________________________________________________________________________________________________________________________________________________________________________________________________________________________________
We used a DCF valuation to arrive at a fair value of SGD 1.01
(WACC / Cost of equity of 12.6%, LT growth of 4.4%) with a
potential downside of 45.0%. Implied price to 15E earnings multiple
at its fair value is 30.0x, which is in line with peers, whose stocks are
trading at on average 10.0 – 15.0x. We believe that EV / 15E EBITDA
of 8.5x, which is low compared to the level its peers are traded at, is
driven primarily by the no-debt, net-cash capital position of ZMBH. The
fair value of SGD 1.01 is built upon optimistic assumptions of 3.0% psf
growth from 2015E - 2019E and 11.0% direct sales gross margin. As
such, given the unfavourable macro-headwind and competition from e-
commerce, both psf sales and direct sales margin would possibly be
eroded. All of these would exert a further downward pressure to the
stock price.
Excessive Valuation at 90x TTM PE
ZMBH’s current valuation is unrealistic when compared with its
peers. We believe that the current valuation of ZMBH is excessive and
does not match up with the poor execution and limited growth
prospects of the company. Based on common department store metrics
such as price to sales (1.9x), price to book (19x) and price to earnings
(172x) ratios, the market appears to value ZMBH as an Amazon with
huge growth potential instead of a Chinese department store player
facing tremendous headwinds. In comparison, department stores peers
have seen de-rating of their stock prices due to a sluggish retail
environment in China, the threat of ecommerce and the anti-corruption
drive, but ZMBH’s stock appears to have a Teflon coating and has not
seen these headwinds priced into the stock price yet.
Overly stable stock price movement despite volatility of earnings.
The stock price performance of ZMBH has been suspiciously stable
and trending upwards since 2011, compared to other department store
0
5,000
10,000
15,000
20,000
25,000
30,000
35,000
40,000
45,000
50,000
0
0.5
1
1.5
2
2.5
Thousands
Volume Price
$1.79
$0.35
SGD
*$1.01
$1.84
Figure 12: Bull-bear Price Performance Outlook Figure 13: Bull-bear Scenario Analyses
Base
70
80
90
100
110
120
ZMBH New World Golden Eagle
Parkson Retail Sun Art Intime Retail
Figure 14: Peer Stock Price Performance
ZMBH
10. Zhongmin Baihui Retail Group Ltd | Page 10
peers who have seen their stock prices hit by falling SSSG and the
emerging threat of ecommerce. We do not think there is any
justification for ZMBH’s stock price performance given the company’s
lacklustre results: net income and earnings per share have been falling
since 2011. We believe that most of this inefficiency is du e to a lack
of coverage of the stock by sell-side analysts and a lack of interest from
institutional fund managers due to ZMBH’s position as an S-chip listed
in Singapore, especially after many accounting fraud cases involving S-
chips since 2011. Retail investors may have been myopic, viewing the
company’s impressive revenue growth from 2009 to 2013 as a sign of
prosperity. However, despite the decline of ZMBH’s revenue since
4Q13, the stock has continued to march upwards, disregarding poor
industry dynamics or deteriorating company financials.
Most optimistic bull case scenario still does not justify current
valuation. With the stock price seemingly divergent from the realities of
ZMBH and pricing future growth into perfection, we evaluate how much
ZMBH is worth intrinsically in a best-case scenario. Assuming the
pipeline of announced new store openings are executed in time, ZMBH
will have two new owned stores in 2015. Taking guidance from
management, we assume that stores take two years to be fully
operational and deliver steady state performance.
Despite its history of poor execution, let us assume that ZMBH is able
to double its EBIT margins to 11% in the long run, a record high given
its history. We also assume ZMBH is able to achieve RMB 993 sales
psf in 2019, a record high for the company and a significant increase
from RMB 631 psf in 3Q14. Our terminal growth rate is generous at
4.4%, with a discount rate of 12.6% due to the company’s smaller size,
poorer execution and an additional China country risk premium. Our
valuation in this best-case scenario is SGD 1.79, close to its current
stock price of SGD 1.84 but still implying a 2.8% downside.
Using a more reasonable set of assumptions for our DCF calculations,
where growth is expected to be lower and sales psf is estimated at
RMB 748 sales psf in 2019, we reach a valuation of SGD 1.01, or 45.1%
lower than ZMBH’s current price.
Investment Risks_____________________________________________________________________________________________________________________________________________________________________________________________________________________________________________________________________________________________________________________________________________________________________________________________________________________________________________________________________________________
We have identified key upside risks to our investments:
Market continues to be irrational. There is a high risk that the market
continues to price the stock far beyond reasonableness, since this is
what has happened since 2011. The low volatility of the stock is also
Psf growth from
2015 - 2019E
- 0.69
1.0% 0.79
2.0% 0.90
3.0% 1.01
5.0% 1.26
7.0% 1.55
9.0% 1.87
Figure 15: Sales psf Sensitivity Analysis
Gross margin fluctuation
2015 - 2019E
8.0% 0.65
9.0% 0.77
10.0% 0.89
11.0% 1.01
13.0% 1.25
15.0% 1.49
17.0% 1.73
Figure 16: Gross Margin Sensitivity Analysis
11. Zhongmin Baihui Retail Group Ltd | Page 11
questionable given the troubles that department stores are facing in
China.
We sincerely hope that our report will uncover this “false gold” and that
the market will take our views seriously.
Management is able to outperform our most bullish scenario. If
management is able to grow its SSSG significantly to achieve good
operating leverage and also improve its execution with effective cost-
cutting, we believe that ZMBH will enjoy further gains and deserve its
valuation premium.
In January 2015, ZMBH announced the closing down of its Xiamen
Zhongshan store, which was situated on the Xiamen equivalent of
Orchard Road. If the company is unable to compete one of the busiest
shopping streets in the city, how can we have faith in management’s
execution capabilities? Furthermore, ZMBH’s second store, Nanjing
Nanzhan store, has been struggling as its surrounding areas are still
under construction. This begs the question as to why management
chose this area in the first place, as it was out of their circle of
competence in Fujian and situated in an area which is unattractive for
retail.
The retail industry in China experiences a sudden revival in
fortunes due to a sustained recovery in China’s economy and a
diminishing ecommerce. We expect our projections to fail if the
Chinese government is able to increase China’s economic growth to 10%
annually. Given the slowdown in industrial output and excess supply in
Chinese industrial and property markets, we do not think this is likely.
Also, ecommerce is unlikely to diminish in China, as younger
consumers who are more tech-savvy shift to ecommerce for
convenience and lower prices. The shift to mobile platforms for
ecommerce will only increase the penetration of ecommerce as many
Chinese consumers without desktop computers can access and
purchase goods through mobile platforms instead.
Conclusion_____________________________________________________________________________________________________________________________________________________________________________________________________________________________________________________________________________________________________________________________________________________________________________________________________________________________________________________________________________________
We strongly believe that ZMBH currently does not offer a compelling
risk-reward profile for investors given its positioning against macro
headwinds, weak financial performance, sub-par corporate governance
and sky-high valuation. We reiterate a negative outlook with a
significant potential downside to its current price.
12. Zhongmin Baihui Retail Group Ltd | Page 12
Disclaimers
_____________________________________________________________________________________________
By reading this report, you agree that use of this is research at your own
risk. In no event will you hold the authors or any affiliated party liable for
any direct or indirect trading losses caused by any information in this
report.
This report is not investment advice or a recommendation or solicitation to
buy any securities. The authors are not registered as an investment
advisor in any jurisdiction. You agree to do your own research and due
diligence before making any investment decision with respect to securities
covered herein.
You represent that you have sufficient investment sophistication to critically
assess the information, analysis and opinions in this report. You further
agree that you will not communicate the contents of this report to any other
person unless that person has agreed to be bound by these same terms of
service. As of the publication date of this report, neither the authors nor its
affiliated parties hold any position, long or short, whether directly or
indirectly, in the issuer’s securities; and does not stand to profit in the
event the issuer’s securities depreciate in value
The research report includes forward-looking statements, estimates,
projections, and opinions prepared with respect to among other things,
certain accounting, legal, and regulatory issues the issuer faces and the
potential impact of those issues on its future business, financial condition
and results of operations, as well as more generally, the issuer’s
anticipated operating performance, access to capital markets, market
conditions, assets and liabilities
Such estimates, projections and opinions may prove to be substantially
inaccurate and are inherently subject to significant risks and uncertainties
beyond the authors’ control.
Our research and report expresses our opinions, which we have based
upon generally available information, field research, inferences and
deductions through our due diligence and analytical process. We believe
all information contained herein is accurate and reliable, and has been
obtained from public sources we believe to be accurate and reliable.
However, such information is presented “as is,” without warranty of any
kind, whether express or implied. The authors make no representation,
express or implied, as to the accuracy, timeliness, or completeness of any
such information or with regard to the results to be obtained from its use.
All expressions of opinion are subject to change without notice, and the
authors are not obligated to update or supplement any reports or any of
the information, analysis and opinion contained in them. You should
assume that the authors has and/or will file as a whistleblower with
regulators.
13. Zhongmin Baihui Retail Group Ltd | Page 13
Appendix
____________________________________________________________________________________________________________________________________________________________
Appendix A – Annotated stock price chart.............................................................................................14
Appendix B – Macroeconomic Indicators...............................................................................................14
Appendix C – Growth of ecommerce ......................................................................................................15
Appendix D – Fujian and Jiangsu store sales........................................................................................16
Appendix E – Store Locations.................................................................................................................16
Appendix F – Management Biographies.................................................................................................19
Appendix G - Questionable related party transactions .........................................................................20
Appendix H – Zhongmin Baihui Retail Group Ltd Financials................................................................22
Appendix I – Zhongmin Baihui Retail Group Ltd Key Performance .....................................................25
Appendix J – DCF Valuation....................................................................................................................26
Appendix K – Trading Comparables .......................................................................................................27
14. Zhongmin Baihui Retail Group Ltd | Page 14
Source: EIU
Appendix A – Annotated stock price chart
Appendix B – Macroeconomic Indicators
Broad macroeconomic indicators point to a slowdown in the Chinese economy, resulting in reduced
consumer confidence and slower retail sales growth
0
5,000
10,000
15,000
20,000
25,000
0.00
0.50
1.00
1.50
2.00
2.50
Jan-2011 Jul-2011 Jan-2012 Jul-2012 Jan-2013 Jul-2013 Jan-2014 Jul-2014
Volume (RHS) Price (LHS)
('000)(SGD)
28 Mar 2011
Established
logistics joint
venture in Xiamen
with Citi-Base
Commerce
Logistics
19 Jul 2013
Received
approval to
be
transferred to
SGX
mainbboard
3 Sep 2013
Officially
begins
trading on
SGX
mainboard
4 Oct 2011
Opened new
store in Xiamen.
Total stores: 8
25 May 2011
Business Times
published an
article questioning
Zhongmin’s share
price runup
27 Feb 2012
Announced
Nanjing store
will be delayed
and will not
open by 1H
2012
20 Sep 2012
Opened store
in Nanjing,
first store
outside Fujian
9 Oct 2012
Announced
Xiamen store
delayed and
will not open
by 2H 2012
31 Dec 2012
Announced
delay of two
Xiamen
leased
premises
12 Mar 2013
Acquired two
stores in
Xiamen from
QZMH
21 Nov 2013
Opened 11th
store in
Xiamen,
Fujian
27 Feb 2014
Announced
full year
results and
dividend of
SGD 0.01
19 Jul 2013
Opened 12
th
store in
Quanzhou,
Fujian
8 Jan 2015
Terminated
the lease of
unprofitable
Xiamen store
28 Nov 2014
Opened 13
th
store in
Quanzhou,
Fujian
4.5 5.1
5.9
7.3
8.4
9.5
10.4
11.2
12.4
13.5
14.5
4%
6%
8%
10%
12%
0.0
2.0
4.0
6.0
8.0
10.0
12.0
14.0
16.0
Thousands
GDP (LHS) Growth % (RHS)
(USD tn)
Figure B-1: China GDP
1.6 1.8
2.1
2.6
3.0 3.4
3.8
4.1
4.6
5.2
5.7
4%
6%
8%
10%
12%
0.0
1.0
2.0
3.0
4.0
5.0
6.0
Private Consumption (LHS) Growth % (RHS)
(USD tn)
Figure B-2: China Private Consumption
Source: EIU
15. Zhongmin Baihui Retail Group Ltd | Page 15
Appendix C – Growth of ecommerce
Ecommerce is emerging as the most significant threat to the traditional department store retail model.
18 38 68
121
188
308
453
611
753
892
1,039
0
200
400
600
800
1000
1200
(USD bn)
Figure C-1: China online shopping value
3%
6%
9%
13%
18%
24%
30%
36%
38% 40% 41%
0%
10%
20%
30%
40%
50%
Figure C-3: Online retail sales as a % of total China
retail sales
14 29 51
91
140
227
333
447
549
647
751
0
100
200
300
400
500
600
700
800
(USD)
Figure C-2: China per-capita online shopping
expenditure
Source: CLSA Research Source: CLSA Research
Source: CLSA Research
95
100
105
110
115
2008 2009 2010 2011 2012 2013 2014
Figure B-3: China Consumer Confidence Index Figure B-4: China Retail Sales
1.0
1.1
1.2
1.4
1.6 1.7
1.9
2.1
2.3
2.4
2.7
4%
6%
8%
10%
12%
14%
16%
0.0
0.5
1.0
1.5
2.0
2.5
3.0
Private Consumption (LHS) Growth % (RHS)
(USD tn)
Source: CEIC Source: EIU
Note: USD:CNY 1:6.21 as of 16 January 2015
16. Zhongmin Baihui Retail Group Ltd | Page 16
Appendix D – Fujian and Jiangsu store sales
Slowing growth of department store sales in China is reflected in the cities where ZMBH is operating in.
Appendix E – Store Locations
Xiamen Zhongshan Store
Gross floor area: 172,000 sq ft (16,000 sq m)
Year of commencement: 2013
Location: Xiamen Zhongshan Store is strategically located at the middle of
Zhongshan Road, one of the busiest commercial pedestrian malls in Xiamen
City.
0.57
0.74
0.95
1.04 1.06
0%
5%
10%
15%
20%
25%
30%
35%
0
0.2
0.4
0.6
0.8
1
1.2
2009 2010 2011 2012 2013
Value Sales (LHS) Sales Growth (RHS)
(RMB bn)
Source: CEIC Database Source: CEIC Database
16.7
18.8
21.1 21.3
23.3
0%
2%
4%
6%
8%
10%
12%
14%
0
5
10
15
20
25
2009 2010 2011 2012 2013
Value sales (LHS) Sales Growth (RHS)
(RMB bn)
Figure D-1: Fujian Department Store Sales Figure D-2: Jiangsu Department Store Sales
17. Zhongmin Baihui Retail Group Ltd | Page 17
Xiamen Jiahe Store
Gross floor area: 251,000 sq ft (23,300 sq m)
Year of commencement: 2011
Location: Xiamen Jiahe Store is strategically located in the heart of a residential
area in Xiamen City with heavy human traffic.
Xiamen Wucun Store
Gross floor area: 309,000 sq ft (28,700 sq m)
Year of commencement: 2010
Location: Xiamen Wucun Store is one of the largest underground retail malls in
Fujian province. It is located in the commercial centre of Xiamen City, in the
heart of a transportation hub that is a nexus linked by walkways and
underground pedestrian crossings to bus terminals, a Bus Rapid Transit (BRT)
station and Xiamen Railway Station.
Nanjing Nanzhan Store
Gross floor area: 361,000 sq ft (33,600 sq m)
Year of commencement: 2012
Location: Nanjing Nanzhan Store is next to the Nanjing Railway Station which is
the biggest train station in Asia.
Zhangzhou Zhongshan Store
Gross floor area: 120,000 sq ft (11,100 sq m)
Year of commencement: 2003
Location: Zhangzhou Zhongshan Store is located in the city centre of Zhangzhou
City with high and constant pedestrian flow and high visibility.
Zhangzhou Longwen Store
(Expected opening in 2015)
Gross floor area: 471,000 sq ft (43,700 sq m)
Location: Zhangzhou Longwen Store is next to the Central Business District and
the municipal government of Zhangzhou City, surrounded by residential
buildings and schools
Quanzhou Xinhua Store
Gross floor area: 188,000 sq ft (17,400 sq m)
Year of commencement: 2013
Location: Quanzhou Xinhua Store is next to one of the oldest Buddhist temple,
Kaiyuan Temple in Fujian province which is an attraction for domestic and
foreign travelers. The store is also close to some of the most popular historical
and commercial scenic spots in Quanzhou City, including Bell Tower,
Zhongshan Road, Confucian Temple, Chengtian Temple, Guandi Temple and
West Lake.
Quanzhou Tumen Store
Gross floor area: 176,000 sq ft (16,400 sq m)
Year of commencement: 1999
Location: Quanzhou Tumen Store is located in one of the busy shopping belts in
the city centre of Quanzhou City with high and constant pedestrian flow and
high visibility.
18. Zhongmin Baihui Retail Group Ltd | Page 18
Quanzhou Quanxiu Store
Gross floor area: 112,000 sq ft (10,400 sq m)
Year of commencement: 2006
Location: Quanzhou Quanxiu Store is situated at the city centre of Quanzhou City
with high pedestrian flow and high visibility, next to the public transportation
systems and within close proximity to the residential areas.
Quanzhou Hui’an Huixing Store
Gross floor area: 117,000 sq ft (10,900 sq m)
Year of commencement: 2009
Location: Quanzhou Hui’an Huixing Store is located in the heart of Hui’an County
with high and constant pedestrian flow and high visibility, and within the
residential areas.
Quanzhou Anxi Store
Gross floor area: 69,000 sq ft (6,400 sq m)
Year of commencement: 1997
Location: Quanzhou Anxi Store is strategically located in the commercial centre of
Anxi County with high and constant pedestrian flow and high visibility, and
within close proximity to the residential areas.
Quanzhou Quangang Store
Gross floor area: 43,000 sq ft (4,000 sq m)
Year of commencement: 2003
Location: Quanzhou Quangang Store is located in the centre of Quangang District,
an industrial area for petrochemicals with high and constant pedestrian flow and
high visibility, and centre of the residential areas.
Quanzhou Qiaonan Store
(Expected opening in 2014)
Gross floor area: 68,000 sq ft (6,300 sq m)
Location: Quanzhou Qiaonan Store is located at intersection to several city areas
such as Jinjiang District, Quanzhou Development District, and South District of
Quanzhou Bridge.
Quanzhou Hui‘an Chengnan Store
(Expected opening in 2014)
Gross floor area: 274,000 sq ft (25,400 sq m)
Location: Quanzhou Hui’an Chengnan Store is strategically located adjacent to
Luoyang Town government, Hui’an County and is located at the south of the
town area of Hui’an County. The store is situated in a heavy human traffic area
with strong economic fundamentals and clear city development plans
Quanzhou Quangang Zhongxing Store
(Expected opening in 2015)
Gross floor area: 219,000 sq ft (20,400 sq m)
Location: Quanzhou Quangang Zhongxing Store is strategically located at the
intersection of Zhongxing Street and Xuefu Road which are the main roads
running through Quangang District’s central area and is close to the offices of
the Quangang District Government.
Source: Company Annual Report
2013
19. Zhongmin Baihui Retail Group Ltd | Page 19
Appendix F – Management Biographies
Name Title Background
Lee Swee Keng
Executive
Chairman
Mr Lee was appointed to the Board in September 2004. He is responsible
for charting and steering the Group’s business direction, as well as the
overall management, strategic planning and business development for the
Group. He possesses over 30 years of experience as a business
entrepreneur, establishing and managing businesses in industries ranging
from food and beverage to construction machinery and equipment.
Together with Mr Chen Kaitong, Mr Lee was involved in the set up and
operations of small-scale department stores in Fujian Province before they
collaborated to establish Zhongmin Baihui and its group of store
Chen Kaitong
CEO and
Executive Director
Mr Chen was appointed as Director of the Company in December 2008. He
is responsible for strategic corporate planning and business development,
as well as formulating the business workflow and organisational structure
of the Group. He has been with the group since its inception and was
instrumental in the early stages of set up for the stores.
Mr Chen has been involved in China’s retail industry for more than 30
years and has received numerous awards for his contribution to the sector.
In 2010, he was elected as the chairman of the Quanzhou City Chain Store
& Franchise Association. He has also been a member of the National
People’s Congress representing Quanzhou City since 2007.
Su Jianli
Deputy CEO
(Marketing and
Operations) and
Executive Director
Mr Su was appointed to the Board in December 2008. His responsibilities
include assisting the CEO in performing the daily running of the Group, with
emphasis on strategic corporate planning and development of Group
operations, implementation of quality management policies and marketing
and sales.
Mr Su possesses more than 16 years of experience at the management
level in the power and apparel industries. He is also active in the
operations of our Managed stores.
Low Chui Heng Executive Director
Mr Low was appointed as Director in September 2004, and has been with
the Company since its inception.
He is currently the managing director of Hong Hock Hardware Pte. Ltd. Mr
Low is an entrepreneur with over 30 years of experience and has
established over 10 businesses during this period. These businesses
include import and export of non-ferrous metals and building materials,
hostel accommodation, retailing computer hardware, software and related
accessories.
Su Caiye
Non-Executive
Director
Mr Su was appointed as Director in December 2008, and is presently the
General Manager and legal representative of Quanzhou Zhongmin Baihui,
the parent company of our managed stores.
Mr Su has more than 18 years of experience in the retail industry,
beginning with a sole-proprietorship retail shop selling mainly apparel in
1992. He was involved in the establishment of Xiamen Zhongmin Baihui.
Source: Company Annual Report
2013
20. Zhongmin Baihui Retail Group Ltd | Page 20
Appendix G - Questionable related party transactions
Quanzhou ZMBH (“QZMBH”), a key related party owned by members of ZMBH Board of Directors -
Chen Kaitong, Su Caiye and Su Jianli. QZMBH is a privately owned company incorporated in Quanzhou
City, Fujian Province and founded by the current CEO, Mr. Chen Kaitong. At startup, QZMBH was used to
pre-emptively acquire lease agreements for retail venues for which lessor rights are then transferred to
ZMBH subsequently. Currently, QZMBH owns 4 stores which are managed by ZMBH for an annual
management fee of RMB 1.6m per store.
ZMBH has a history of numerous related party transactions with QZMBH. The prevalence of related party
transactions are a potential corporate governance deficiency which could result in earnings management,
conflict of interest and agency problems.
Questionable related party asset transfer from QZMBH to QZM. In March 2013, QZMBH was involved
in a questionable related party asset transfer with Zhongmin Baihui (Quanzhou) Commercial Management
(“QZM”), a wholly-owned subsidiary of ZMBH. The nature of the consideration, implied operating
performance, and implied valuation leave many questions unanswered and raise doubts about the
appropriateness of the consideration.
QZMBH transferred the operation and maintenance of two operational department stores, Quanzhou
Quanxiu and Quanzhou Tumen to ZMBH. The transaction consideration was up to RMB 10m of which
RMB 8.8m is composed of intangible assets. The consideration will be made in two payments, contingent
on the two stores generating a profit in the subsequent two years.
The motivations and outcome of the transaction leave many questions unanswered. Ostensibly, the
valuation of the deal is 10x adjusted PE, after considering ZMBH’s foregone management fees and
incurred tax expenses. However, this valuation is the maximum consideration payable and is contingent on
Zhongmin Baihui Retail
Group Ltd - “ZMBH”
100%
Zhongmin Baihui
Development Pte Ltd
Zhongmin Baihui
(Nanjing) Commercial
Co Ltd
Hui’an
Hongyi
49%
Private Sister
Company
Management
Agreements
& Asset
Transfers
1
Zhongmin Baihui
(Quanzhou)
Commercial Mgmt Co
Ltd - “QZM”
2
Lease
Agreement
Xiamen Shi Zhongmin
Baihui Commercial Co
Ltd - “X”
30%
Citi-Base
Commerce
Logistics
(Xiamen) Co
Ltd
3
Storage &
Delivery
100%
100%
100%
Quanzhou ZMBH
“QZMBH”
Management Agreements
& Asset Transfer
• QZMBH owns stores under ZMBH label and
QZM manages stores, earns management fee
(¥1.6m/store)
• QZMBH transfers stores to QZM when fully
operational through an asset transfer
structured with favourable terms to ZMBH
1
Lease Agreement
• Hui’an leases a commercial centre to QZM
• QZM pays annual lease ~RMB 10m to Hui’an.
• Since QZMBH owns 49%, Chinese board of
directors effectively earn a proportionate
amount of profit from Hui’an through listco
2
Storage and Delivery
• JV established to store and deliver goods for
X to reap economies of scale
• X holds a minority stake, JV could be used to
hold inventory to understate listco assets
• No operations commenced yet
3
All Other Shareholders Board of Directors from China
61.5% 100%
38.5%
21. Zhongmin Baihui Retail Group Ltd | Page 21
the transferred stores being profitable in the following 24 months – should the two stores incur losses,
ZMBH will not have to pay any consideration to QZMBH.
The implied operating performance of the stores raises an air of doubt. Taking management’s estimate that
the 2 transferred stores will make RMB 5m net profit per year, and assuming a 1% net profit margin which
is consistent with net margins of other ZMBH stores, the stores would be generating implied yearly sales of
RMB 500m. They would be doing so on only RMB 1.2m of property, plant and equipment, implying a highly
unrealistic 417x turnover on their fixed assets.
Furthermore, the ease of arranging such an asset transfer to ZMBH could suggest an equal possibility for
ZMBH to transfer loss-making assets in event of a downturn.
An additional warning sign was that the independent financial advisor for the asset transfers is Asiasons
Capital, the company that was caught up in the penny stock scandal along with Liongold and Blumont,
leaving the professionalism of their advice in doubt.
Lease agreements with QZMBH. A notable related party transaction is a lease agreement between QZM
and Hui’an Hongyi (“Hui’an”) for the establishment of the Quanzhou Hui’an Huixing Store, situated at the
Hui’an commercial centre. QZM pays an annual lease of RMB 10m to Hui’an. This lease transaction is
problematic considering Hui’an is 49% owned by QZMBH, effectively attributing RMB 4.9m of each lease
payment back to the Chinese Board of Directors of ZMBH.