Download to read offline

![[Price for scheduled purchasing]
Arbitrarily made
Algorithm stocks Trading Strategies (Separate) 388720 Date
Period
Gap
(Indication /
stock)
Color
low price 40,419 W 40,419 W ~ 0 W 17 % -616,596 W -15
Low mid 52,898 W 52,898 W ~ 40,419 W 53 % -1,927,541 W -36
Mid 65,377 W 65,377 W ~ 52,898 W 89 % -3,238,486 W -50
High mid 77,855 W 77,855 W ~ 65,377 W 125 % -4,549,430 W All selling
Suggested Purchase
Amount 3,629,641 W
Number of stocks
purchased 105
Indication price Range Buying / Selling Buying / Selling [Stocks]
High price 90,334 W 90,334 W~ ~ 77,855 W 161 % -5,860,375 W All selling
2025-02-06
3 months
Current stock price Evaluation
Stock price rise
probability score
Investment opinion Prospective purchase amount
34,550 W Low price 49.0 Normal 10,000,000 W
Stock price rise
probability score
A Sector 53.3 47.2 48.6 48.4 50.5 48.7
49.0
B Sector 28.8 52.5 48.4 48.4 21.3 38.3
Total average 41.0 49.8 34.1 44.6 35.9 43.5
2024.09.02 2024.10.07 2024.11.05 2024.12.03 2025.01.03 2025.02.06
2024.11.05 2024.12.03 2025.01.03 2025.02.06
Total of
increase rate
Total score
A Sector -13 % 3 % -0 % 4 % -4 %
-2 % 48.0
B Sector 45 % -168 % 60 % -128 % 45 %
Total average 18 % -46 % 24 % -24 % 18 %
2024.10.07
-13%
3% -0% 4% -4%
45%
-168%
60%
-128%
45%
18%
-46%
24%
-24%
18%
-200%
-150%
-100%
-50%
0%
50%
100%
2024.10.07 2024.11.05 2024.12.03 2025.01.03 2025.02.06
Increase rate of stock price rise
A sector
B sector
Total average
yuilrobotics
53
47 49 48 51 49
29
53
20
48
21
38
41
50
34
45
36
44
0
10
20
30
40
50
60
2024.09.02 2024.10.07 2024.11.05 2024.12.03 2025.01.03 2025.02.06
Stock price rise probability score
A sector
B sector
Total average](https://image.slidesharecdn.com/yuilrobotics388720algorithminvestmentreport-250206125914-6cb090bf/85/yuilrobotics-388720-Algorithm-Investment-Report-2-320.jpg)

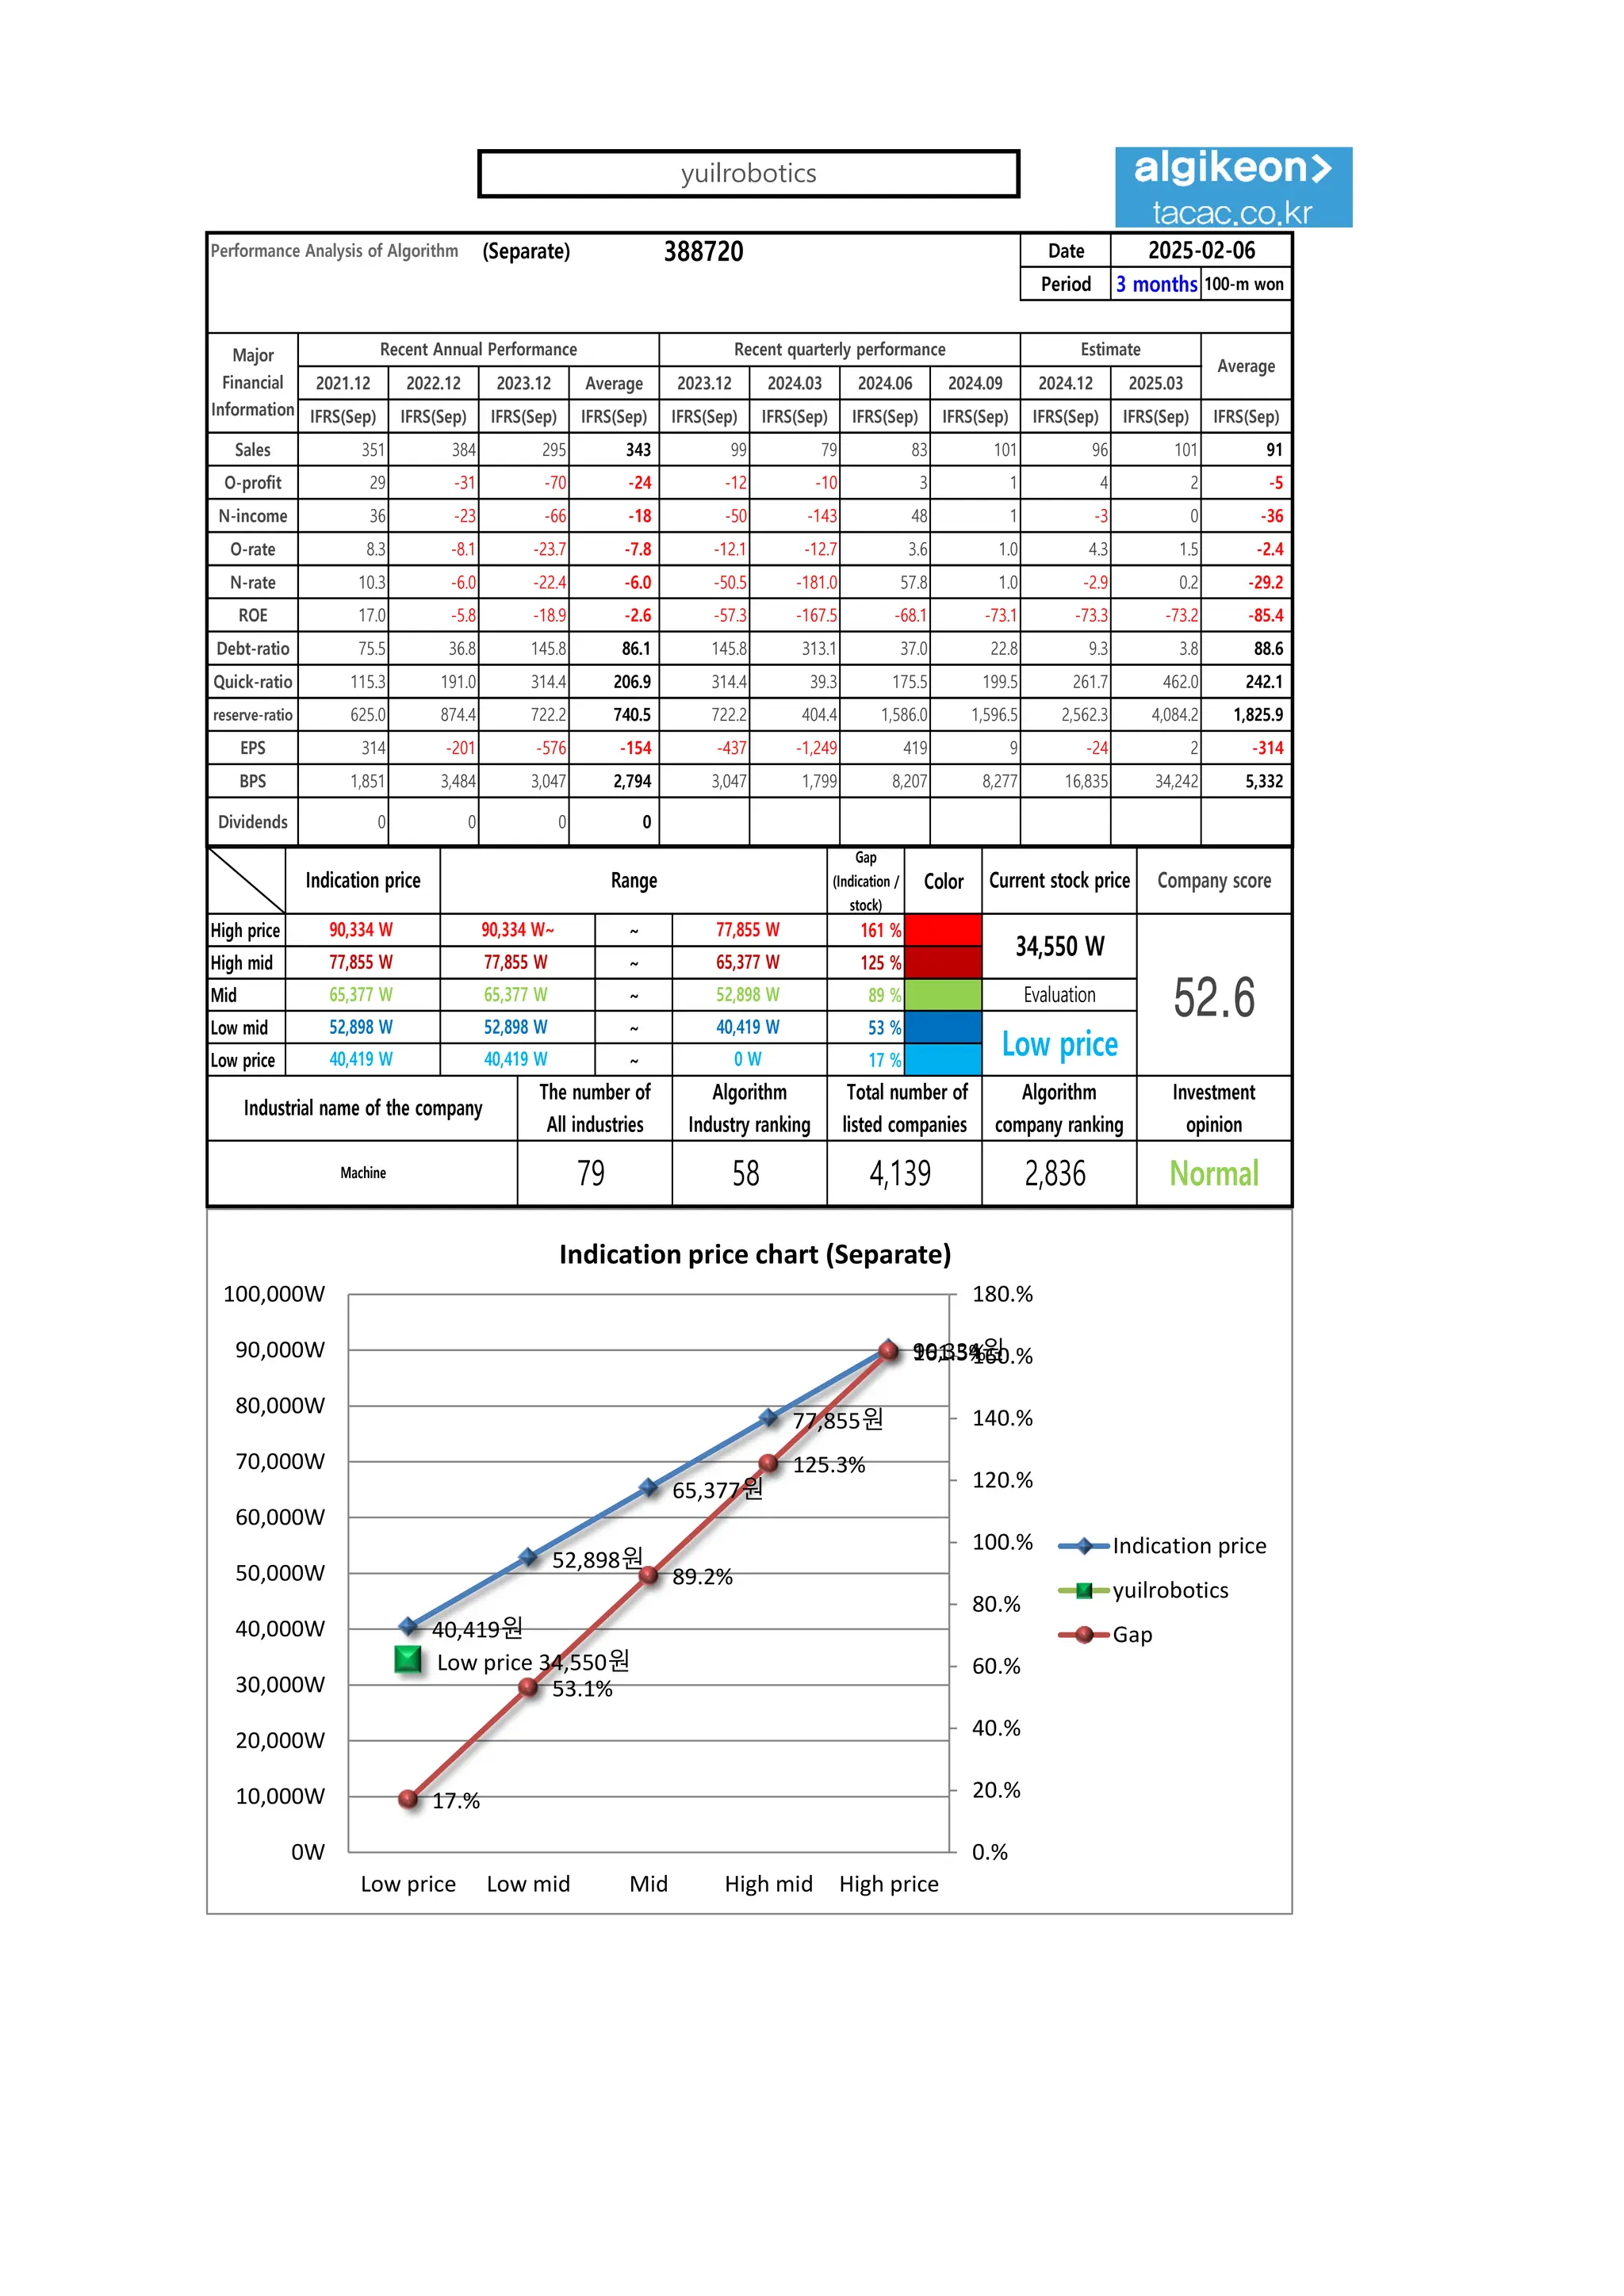
The document presents a performance analysis of an algorithm over a three-month reporting period, detailing financial metrics such as sales, operating profit, net income, return on equity, and various ratios for 2021 to 2025. It includes projections of stock prices, evaluation metrics, investment opinions, and past performance metrics across different sectors. Additionally, it provides disclaimers regarding the accuracy of the provided data and the responsibility of users when making investment decisions.


![[휴림로봇]hyulimrobot 090710 Algorithm Investment Report](https://cdn.slidesharecdn.com/ss_thumbnails/hyulimrobot090710algorithminvestmentreport-250923234005-7edfe548-thumbnail.jpg?width=640&height=640&fit=bounds)


![[웹케시]webcash 053580 Algorithm Investment Report](https://cdn.slidesharecdn.com/ss_thumbnails/webcash053580algorithminvestmentreport-250925003052-f31dd73c-thumbnail.jpg?width=640&height=640&fit=bounds)


![[ls머트리얼즈]LS Materials 417200 Algorithm Investment Report](https://cdn.slidesharecdn.com/ss_thumbnails/lsmaterials417200algorithminvestmentreport-260202182715-66072c7b-thumbnail.jpg?width=640&height=640&fit=bounds)
![[롯데웰푸드]lottewell food 280360 Algorithm Investment Report](https://cdn.slidesharecdn.com/ss_thumbnails/lottewellfood280360algorithminvestmentreport-251010014427-e0439c3a-thumbnail.jpg?width=640&height=640&fit=bounds)
![[동원산업]dongwon industries 006040 Algorithm Investment Report](https://cdn.slidesharecdn.com/ss_thumbnails/dongwonindustries006040algorithminvestmentreport-251003020532-5dd00f8a-thumbnail.jpg?width=640&height=640&fit=bounds)
![[동서]dongsuh 026960 Algorithm Investment Report](https://cdn.slidesharecdn.com/ss_thumbnails/dongsuh026960algorithminvestmentreport-251001020056-e986a251-thumbnail.jpg?width=640&height=640&fit=bounds)


![[쿠콘]coocon 294570 Algorithm Investment Report](https://cdn.slidesharecdn.com/ss_thumbnails/coocon294570algorithminvestmentreport-250926162409-bd6c1593-thumbnail.jpg?width=640&height=640&fit=bounds)


![[더즌]dozn 462860 Algorithm Investment Report](https://cdn.slidesharecdn.com/ss_thumbnails/dozn462860algorithminvestmentreport-250920161038-b31c0a65-thumbnail.jpg?width=640&height=640&fit=bounds)

![[헥토파이낸셜]hectofinancial 234340 Algorithm Investment Report](https://cdn.slidesharecdn.com/ss_thumbnails/hectofinancial234340algorithminvestmentreport-250917010057-0603ecf0-thumbnail.jpg?width=640&height=640&fit=bounds)
![[한국공항]Korea Airport Service 005430 Algorithm Investment Report](https://cdn.slidesharecdn.com/ss_thumbnails/koreaairportservice005430algorithminvestmentreport-250915064019-e6873549-thumbnail.jpg?width=640&height=640&fit=bounds)
![[대상]Daesang 001680 Algorithm Investment Report](https://cdn.slidesharecdn.com/ss_thumbnails/daesang001680algorithminvestmentreport-250915063303-81c41298-thumbnail.jpg?width=640&height=640&fit=bounds)
![[삼성중공업] Samsung Heavy Industries 010140 Algorithm Investment Report](https://cdn.slidesharecdn.com/ss_thumbnails/samsungheavyindustries010140algorithminvestmentreport-250904015122-fe022f35-thumbnail.jpg?width=640&height=640&fit=bounds)
![대상 001680 알고리즘 기업분석 보고서 [알고리즘 기업분석 컨설팅-알기컨]](https://cdn.slidesharecdn.com/ss_thumbnails/001680-250303132112-443c504a-thumbnail.jpg?width=640&height=640&fit=bounds)
![[삼성전자]samsung electronics 005930 Algorithm Investment Report](https://cdn.slidesharecdn.com/ss_thumbnails/samsungelectronics005930algorithminvestmentreport-250227014600-4fa86dc7-thumbnail.jpg?width=640&height=640&fit=bounds)
![[동서]dongsuh 026960 Algorithm Investment Report](https://cdn.slidesharecdn.com/ss_thumbnails/dongsuh026960algorithminvestmentreport-250226011658-61b0afaa-thumbnail.jpg?width=640&height=640&fit=bounds)
![동원fnb 049770 알고리즘 기업분석 보고서 [알고리즘 기업분석 컨설팅-알기컨]](https://cdn.slidesharecdn.com/ss_thumbnails/fnb049770-250224032312-db728faf-thumbnail.jpg?width=640&height=640&fit=bounds)
![[SFA반도체]SFA semicon 036540 Algorithm Investment Report](https://cdn.slidesharecdn.com/ss_thumbnails/sfasemicon036540algorithminvestmentreport-250219022804-aa8f2510-thumbnail.jpg?width=640&height=640&fit=bounds)


