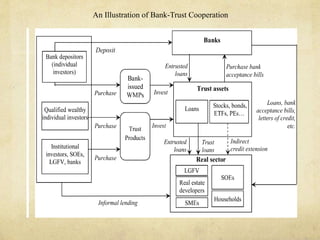
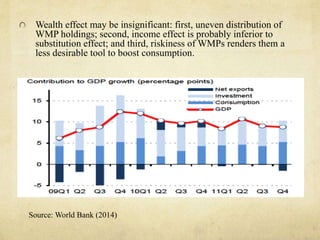
Shadow Banking: 
Implications for Financial 
Stability and Economic 
Rebalancing in China 
Prepared for the 12th International Post 
Keynesian Conference, Kansas City 
Yan Liang 
Willamette University
Outline 
1. Fast Growth and Increasing Size of Shadow Banks; 
2. Shadow Banks: Major Institutions and Activities; 
3. Causes of Shadow Banking Growth; 
4. Shadow Banking, Credit Expansion and Financial 
Fragility; 
5. Shadow Banking and Macroeconomic Rebalancing; 
6. Conclusions
Estimates of China’s Shadow Banks 
Date RMB (tn) USD (tn) % of 2012 GDP 
GFSecurities 12/17/12 30 4.8 57% 
Citi Research 1/11/13 28 4.5 54% 
Barclays Dec. 2012 25.6 4.1 49% 
Hua Tai Securities 12/14/12 25 4 48% 
UBS 10/16/12 13.7-24.4 2.2-3.9 26-46% 
ANZ Bank End 2013 30 4.9 51% 
Bank of America 
Merrill Lynch 7/6/12 14.5 2.3 28% 
Source: Federal Reserve of San Francisco (2013); The Economist (2014)
Although the size of the shadow banks is still relatively small, 
the sector has experienced immense growth since 2009; 
Shadow banks have quadrupled since 2008, with an 
annualized growth rate of 34% since the end of 2010. 
According to Financial Stability Board (2013), the size (as a 
percent of GDP) of China’s non-bank financial intermediary 
(a proxy for “shadow banks”) grew by 45% in 2012, the 
highest among all 25 jurisdiction it examines.
Shadow Banks: Major Institutions and Activities 
Shadow banking system consists of a web of specialized financial 
institutions that conduct credit, maturity, and liquidity transformation 
without direct, explicit access to public backstops (Adrian et al 2013). 
shadow banks include: 
Bank off-balance-sheet activities: informal securitization of loans, 
undiscounted bank acceptance bills and other credit-based assets through 
wealth management products (WMPs); 
Bank acceptance bills are issued by banks (upon the request of firms) that 
provide unconditional payment to the holder of the bills at maturity; 
Trusts and trust-bank cooperation: trust loans, entrusted loans, WMPs; 
Trust loans are loans arranged by trust companies and entrusted loans are 
lending from one company to another through the intermediaries of banks or 
trusts; 
Numerous others: leasing companies, finance companies, loan guarantee 
companies; micro finance lenders; underground banks; person to person 
lending; and pawn shops. 
“Total Social Financing” by the official account provides an imperfect 
measure of shadow banks (Borst 2011).
Growth of Total Social Financing, by Components, 2013 
RMB Loans 
53% 
Domestic Equity 
Financing of Non-financial 
Enterprises 
Corporate Bonds 
1% 
Trust Loans 
11% 
11% 
Entrusted Loans 
15% 
Foreign 
Currency Loans 
4% 
Undiscounted Bankers' 
Acceptances 
5% 
Note: Increase in the TSF was 17.32 trillion yuan in November 2013. 
Source: People’s Bank of China, Statistical Bureau of China
Trusts: now second largest non-bank financial institutions, 
asset under management (AUM) has increased fivefold since 
2010 to reach 12.5 tn yuan as of 2014Q2. Trust loans 
accounted for 11% of TSF in 2013 (fell to 4% in the first five 
months of 2014). They also intermediate “entrusted loans”. 
Trusts assist in “disguised” interbank lending, so trust 
products can be recorded as interbank assets that require less 
bank capital. There was a fivefold increase in trust products 
distributed through banks during 2007-9. 
Wealth Management Product (WMP): informal securitization 
of loans and other credit-based assets to attract and retain 
deposits and to evade loan-to-deposit and capital 
requirements in order to expand lending. As of 2013Q3, 
outsandingWMP reached 9.9 trillion yuan, or 18% of GDP.
Outstanding Wealth Management Products (RMB Billions) 
20 
18 
16 
14 
12 
10 
8 
6 
4 
2 
0 
10000 
9000 
8000 
7000 
6000 
5000 
4000 
3000 
2000 
1000 
0 
RMB Billions 
% 
and as Percentage of GDP 
WMP outstanding 
Percent of GDP
An Illustration of Bank-Trust Cooperation
3. Causes of Shadow Bank Development 
“Financial Repression”? WMPs are often considered as safe as 
bank deposits. As long as WMPs are offered by banks and pay a 
higher interest rate than bank deposits, there will be demand. So 
even if interest rates are liberalized, there will be still high demand 
for WMPs. So financial repression is not the only answer. 
Demand-side: savers/investors seek high yield investment venues 
(underdeveloped bonds and equity markets); small- and medium-sized 
enterprises need financing; 
Supply-side: banks’ incentives to evade regulations (loan quota, 
capital requirements, sectoral exposures, etc.); cash rich SOEs 
(with access to cheap bank credit) engage in “carry trade”; 
Surge in shadow banking driven by credit expansion in 2009 then 
tightening in 2010.
WMP Yield vs. Benchmark Deposit Rate
4. Shadow Banks, Credit Expansion and 
Financial Fragility 
Institutional Risks: Trusts 
Low capital requirement (200 mn yuan or 10% of net assets 
in 2010) to set up trusts; high leverage ratio (40X!) (IMF 
2014); very opaque - only 29 (out of 66 registered trusts) 
disclose capital, and most (except for two publicly listed) 
failed to report returns (China Trustee Association); 
Make risky investment to infrastructure, real estate, local 
gov’t funding vehicles (LGFVs) and industries with excess 
capacity; 
Fund pooling and “ever-greening” WMPs -issue new WMPs 
and use the proceeds to either pay for previous obligations or 
continue lending to dodge non-performing loans. .
Trusts: AUM to Equity Ratio 
45 
40 
35 
30 
25 
20 
15 
10 
5 
0 
All 
Top 10 by AUM 
2004 2005 2006 2007 2008 2009 2010 2011 2012
Financial Fragility: Institutional Risks, Cont’d 
Bank WMPs: 
Majority are loan-based and the number of loans is limited; so 
credit risk diversification is weak; 
No rating system, no tranching based on credit risk, no 
secondary market; so liquidity risk is excessive; 
Maturity of WMPs is shortening. In 2007, less than 10% were 
less than 90 days, and more than 50% were a year and above; 
by end 2010, about 40% were less than 90 days and <20% were 
a year or over; but funds raised could be invested in long term 
projects, e.g. real estate; so again, liquidity risk is excessive; 
Banks often act alone in originating, distributing, custodying 
and managing WMPs; fund pooling; contagion risks are high – 
Xiao Gang “ponzi scheme”;
 China’s overall debt rose to 142 trillion yuan ($22.8 trillion), or 245% of GDP 
as of 2014Q1, up from roughly 150% in 2008 (Standard Chartered 2014);
Financial Fragility: Systemic Risks 
 China’s overall debt rose to 142 trillion yuan ($22.8 trillion), or 245% of GDP as of 
2014Q1, up from roughly 150% in 2008 (Standard Chartered 2014); 
 Shadow banks contributed greatly to credit expansion 
100 
80 
60 
40 
20 
0 
-20 
Bank loans 
Corporate bonds 
Entrusted loans 
Trust loans 
Bank acceptance bills 
Growth Rate of Credit, by Type, y-o- 
y
300 
250 
200 
150 
135 138 
149 
161 156 155 154 153 153 
181 
195 194 
209 
219 230 
240 
109 103 107 114 106 98 98 96 97 112 125 129 142 151 163 173 
100 
50 
0 
consumer loans 
Govt leverage 
LGFV leverage 
Coporate leverage 
Total debt 
Total Debt to GDP Ratio by Sector, 2000-2015e 
Source: PBoC, Gao Hua Securities, Goldman Sachs
Upper panel: Private Credit (in percentage 
of GDP) in Selected Countries, 2012 (or 
latest data available) 
Lower Panel: Private Credit Growth (5 year 
change in private credit as % of nominal GDP) 
in Selected Countries
7 
6 
5 
4 
3 
2 
1 
0 
20 
18 
16 
14 
12 
10 
8 
6 
4 
2 
0 
Share of loss-making 
companies (based on 
negative RoA) 
Median return on assets 
(right scale) 
Chinese Corporate Sector Performance 
Source: IMF (2013)
Systemic Risk 
“5-30 rule”? China’s situation resembles 66 pp growth in 
Thailand and 40 pp growth in Malaysia five years prior to the 
Asian crisis; and 46 pp growth in the US in 2002-2007 
(Goldman Sachs 2013); 
Increasing indebtedness, coupled with potential slower 
growth and worsened corporate profitability, may make 
businesses more susceptible to financial distress and failure, 
and it also increases the level of non performing loans (NPLs) 
for the banking sector.
But still, China is unique 
State-owned banks dominate; central govt has the 
capacity to write off bad debt and recapitalize banks. 
Think the late 1990s; 
WMPs as the weakest link; but (ultimate) investors 
mostly purchase with own savings, low leverage and 
low risks of distress sales and debt deflation; 
Tight capital control; external debt is 7.5% of GNI; 
$3.4 trillion fx reserves. No external calls.
5. Shadow Banking and Macroeconomic 
Rebalancing 
Two “Merits” of shadow banks: lending to SMEs (Companies borrowed 
716 billion yuan via entrusted loans in 2014Q1; corporate bond 
issuance over the same period amounted to only 385 billion yuan (The 
Economist 2014)) and WMPs boost HH income and hence consumption 
(Goldman Sachs 2013); or really?? 
“Credit multiplier” (ratio of nominal GDP growth to total credit growth) 
decreased from an average of .8 in 2003-8 to .4 since 2009. Half of trust loans 
in 2012 were to finance new investment, the other half for refinancing old 
debt that funded past projects but were no longer contributing to economic 
growth; 
Sectoral exposure of shadow banking may further contribute to imbalances; 
local gov’t, property developers, and industries with surplus capacity 
accounted for 70% of trust loans in 2012 (KPMG 2012); 
Increasing financing costs and higher debt servicing costs reduce profitability 
and heighten refinancing needs. Zhang (2013): charge 24% annual rate and 
still have unlimited demand for loans; 4 times “prime” rate and much higher 
than the 15% average financing costs faced by SMEs.
Median EBIT/Interest Expense by Firm Leverage 
Source: IMF (2013) 
12 
10 
8 
6 
4 
2 
0 
1 1001 
2012 
2010 
Rolling window of 200 companies ranked by debt/asset 
ratio 
(low  high)
Annual Growth Rates of Interest Expense (2008-12 5 Year Average) 
China 
Poland 
Chile 
South Africa 
Mexico 
Russia 
Turkey 
India 
Philippines 
Indonesia 
Thailand 
Colombia 
Malaysia 
Brazil 
Argentina 
Source: IMF (2013) 
-5 0 5 10 15 20 25 30
Wealth effect may be insignificant: first, uneven distribution of 
WMP holdings; second, income effect is probably inferior to 
substitution effect; and third, riskiness of WMPs renders them a 
less desirable tool to boost consumption. 
Source: World Bank (2014)
6. Conclusions 
Rising size of shadow banks and significant impacts 
on the financial and productive sectors; more research 
is called for; 
Regulatory options: prohibit shadow banks; 
patchwork, reactive and fragmented regulatory 
changes (currently implemented); assimilate shadow 
banks into traditional banking system (some failed 
experiments).

Shadow Banking: Implications for Financial Stability and Economic Rebalancing in China

  • 1.
    Shadow Banking: Implicationsfor Financial Stability and Economic Rebalancing in China Prepared for the 12th International Post Keynesian Conference, Kansas City Yan Liang Willamette University
  • 2.
    Outline 1. FastGrowth and Increasing Size of Shadow Banks; 2. Shadow Banks: Major Institutions and Activities; 3. Causes of Shadow Banking Growth; 4. Shadow Banking, Credit Expansion and Financial Fragility; 5. Shadow Banking and Macroeconomic Rebalancing; 6. Conclusions
  • 3.
    Estimates of China’sShadow Banks Date RMB (tn) USD (tn) % of 2012 GDP GFSecurities 12/17/12 30 4.8 57% Citi Research 1/11/13 28 4.5 54% Barclays Dec. 2012 25.6 4.1 49% Hua Tai Securities 12/14/12 25 4 48% UBS 10/16/12 13.7-24.4 2.2-3.9 26-46% ANZ Bank End 2013 30 4.9 51% Bank of America Merrill Lynch 7/6/12 14.5 2.3 28% Source: Federal Reserve of San Francisco (2013); The Economist (2014)
  • 4.
    Although the sizeof the shadow banks is still relatively small, the sector has experienced immense growth since 2009; Shadow banks have quadrupled since 2008, with an annualized growth rate of 34% since the end of 2010. According to Financial Stability Board (2013), the size (as a percent of GDP) of China’s non-bank financial intermediary (a proxy for “shadow banks”) grew by 45% in 2012, the highest among all 25 jurisdiction it examines.
  • 5.
    Shadow Banks: MajorInstitutions and Activities Shadow banking system consists of a web of specialized financial institutions that conduct credit, maturity, and liquidity transformation without direct, explicit access to public backstops (Adrian et al 2013). shadow banks include: Bank off-balance-sheet activities: informal securitization of loans, undiscounted bank acceptance bills and other credit-based assets through wealth management products (WMPs); Bank acceptance bills are issued by banks (upon the request of firms) that provide unconditional payment to the holder of the bills at maturity; Trusts and trust-bank cooperation: trust loans, entrusted loans, WMPs; Trust loans are loans arranged by trust companies and entrusted loans are lending from one company to another through the intermediaries of banks or trusts; Numerous others: leasing companies, finance companies, loan guarantee companies; micro finance lenders; underground banks; person to person lending; and pawn shops. “Total Social Financing” by the official account provides an imperfect measure of shadow banks (Borst 2011).
  • 6.
    Growth of TotalSocial Financing, by Components, 2013 RMB Loans 53% Domestic Equity Financing of Non-financial Enterprises Corporate Bonds 1% Trust Loans 11% 11% Entrusted Loans 15% Foreign Currency Loans 4% Undiscounted Bankers' Acceptances 5% Note: Increase in the TSF was 17.32 trillion yuan in November 2013. Source: People’s Bank of China, Statistical Bureau of China
  • 7.
    Trusts: now secondlargest non-bank financial institutions, asset under management (AUM) has increased fivefold since 2010 to reach 12.5 tn yuan as of 2014Q2. Trust loans accounted for 11% of TSF in 2013 (fell to 4% in the first five months of 2014). They also intermediate “entrusted loans”. Trusts assist in “disguised” interbank lending, so trust products can be recorded as interbank assets that require less bank capital. There was a fivefold increase in trust products distributed through banks during 2007-9. Wealth Management Product (WMP): informal securitization of loans and other credit-based assets to attract and retain deposits and to evade loan-to-deposit and capital requirements in order to expand lending. As of 2013Q3, outsandingWMP reached 9.9 trillion yuan, or 18% of GDP.
  • 8.
    Outstanding Wealth ManagementProducts (RMB Billions) 20 18 16 14 12 10 8 6 4 2 0 10000 9000 8000 7000 6000 5000 4000 3000 2000 1000 0 RMB Billions % and as Percentage of GDP WMP outstanding Percent of GDP
  • 10.
    An Illustration ofBank-Trust Cooperation
  • 11.
    3. Causes ofShadow Bank Development “Financial Repression”? WMPs are often considered as safe as bank deposits. As long as WMPs are offered by banks and pay a higher interest rate than bank deposits, there will be demand. So even if interest rates are liberalized, there will be still high demand for WMPs. So financial repression is not the only answer. Demand-side: savers/investors seek high yield investment venues (underdeveloped bonds and equity markets); small- and medium-sized enterprises need financing; Supply-side: banks’ incentives to evade regulations (loan quota, capital requirements, sectoral exposures, etc.); cash rich SOEs (with access to cheap bank credit) engage in “carry trade”; Surge in shadow banking driven by credit expansion in 2009 then tightening in 2010.
  • 12.
    WMP Yield vs.Benchmark Deposit Rate
  • 13.
    4. Shadow Banks,Credit Expansion and Financial Fragility Institutional Risks: Trusts Low capital requirement (200 mn yuan or 10% of net assets in 2010) to set up trusts; high leverage ratio (40X!) (IMF 2014); very opaque - only 29 (out of 66 registered trusts) disclose capital, and most (except for two publicly listed) failed to report returns (China Trustee Association); Make risky investment to infrastructure, real estate, local gov’t funding vehicles (LGFVs) and industries with excess capacity; Fund pooling and “ever-greening” WMPs -issue new WMPs and use the proceeds to either pay for previous obligations or continue lending to dodge non-performing loans. .
  • 14.
    Trusts: AUM toEquity Ratio 45 40 35 30 25 20 15 10 5 0 All Top 10 by AUM 2004 2005 2006 2007 2008 2009 2010 2011 2012
  • 15.
    Financial Fragility: InstitutionalRisks, Cont’d Bank WMPs: Majority are loan-based and the number of loans is limited; so credit risk diversification is weak; No rating system, no tranching based on credit risk, no secondary market; so liquidity risk is excessive; Maturity of WMPs is shortening. In 2007, less than 10% were less than 90 days, and more than 50% were a year and above; by end 2010, about 40% were less than 90 days and <20% were a year or over; but funds raised could be invested in long term projects, e.g. real estate; so again, liquidity risk is excessive; Banks often act alone in originating, distributing, custodying and managing WMPs; fund pooling; contagion risks are high – Xiao Gang “ponzi scheme”;
  • 16.
     China’s overalldebt rose to 142 trillion yuan ($22.8 trillion), or 245% of GDP as of 2014Q1, up from roughly 150% in 2008 (Standard Chartered 2014);
  • 17.
    Financial Fragility: SystemicRisks  China’s overall debt rose to 142 trillion yuan ($22.8 trillion), or 245% of GDP as of 2014Q1, up from roughly 150% in 2008 (Standard Chartered 2014);  Shadow banks contributed greatly to credit expansion 100 80 60 40 20 0 -20 Bank loans Corporate bonds Entrusted loans Trust loans Bank acceptance bills Growth Rate of Credit, by Type, y-o- y
  • 18.
    300 250 200 150 135 138 149 161 156 155 154 153 153 181 195 194 209 219 230 240 109 103 107 114 106 98 98 96 97 112 125 129 142 151 163 173 100 50 0 consumer loans Govt leverage LGFV leverage Coporate leverage Total debt Total Debt to GDP Ratio by Sector, 2000-2015e Source: PBoC, Gao Hua Securities, Goldman Sachs
  • 19.
    Upper panel: PrivateCredit (in percentage of GDP) in Selected Countries, 2012 (or latest data available) Lower Panel: Private Credit Growth (5 year change in private credit as % of nominal GDP) in Selected Countries
  • 20.
    7 6 5 4 3 2 1 0 20 18 16 14 12 10 8 6 4 2 0 Share of loss-making companies (based on negative RoA) Median return on assets (right scale) Chinese Corporate Sector Performance Source: IMF (2013)
  • 21.
    Systemic Risk “5-30rule”? China’s situation resembles 66 pp growth in Thailand and 40 pp growth in Malaysia five years prior to the Asian crisis; and 46 pp growth in the US in 2002-2007 (Goldman Sachs 2013); Increasing indebtedness, coupled with potential slower growth and worsened corporate profitability, may make businesses more susceptible to financial distress and failure, and it also increases the level of non performing loans (NPLs) for the banking sector.
  • 22.
    But still, Chinais unique State-owned banks dominate; central govt has the capacity to write off bad debt and recapitalize banks. Think the late 1990s; WMPs as the weakest link; but (ultimate) investors mostly purchase with own savings, low leverage and low risks of distress sales and debt deflation; Tight capital control; external debt is 7.5% of GNI; $3.4 trillion fx reserves. No external calls.
  • 23.
    5. Shadow Bankingand Macroeconomic Rebalancing Two “Merits” of shadow banks: lending to SMEs (Companies borrowed 716 billion yuan via entrusted loans in 2014Q1; corporate bond issuance over the same period amounted to only 385 billion yuan (The Economist 2014)) and WMPs boost HH income and hence consumption (Goldman Sachs 2013); or really?? “Credit multiplier” (ratio of nominal GDP growth to total credit growth) decreased from an average of .8 in 2003-8 to .4 since 2009. Half of trust loans in 2012 were to finance new investment, the other half for refinancing old debt that funded past projects but were no longer contributing to economic growth; Sectoral exposure of shadow banking may further contribute to imbalances; local gov’t, property developers, and industries with surplus capacity accounted for 70% of trust loans in 2012 (KPMG 2012); Increasing financing costs and higher debt servicing costs reduce profitability and heighten refinancing needs. Zhang (2013): charge 24% annual rate and still have unlimited demand for loans; 4 times “prime” rate and much higher than the 15% average financing costs faced by SMEs.
  • 24.
    Median EBIT/Interest Expenseby Firm Leverage Source: IMF (2013) 12 10 8 6 4 2 0 1 1001 2012 2010 Rolling window of 200 companies ranked by debt/asset ratio (low  high)
  • 25.
    Annual Growth Ratesof Interest Expense (2008-12 5 Year Average) China Poland Chile South Africa Mexico Russia Turkey India Philippines Indonesia Thailand Colombia Malaysia Brazil Argentina Source: IMF (2013) -5 0 5 10 15 20 25 30
  • 26.
    Wealth effect maybe insignificant: first, uneven distribution of WMP holdings; second, income effect is probably inferior to substitution effect; and third, riskiness of WMPs renders them a less desirable tool to boost consumption. Source: World Bank (2014)
  • 27.
    6. Conclusions Risingsize of shadow banks and significant impacts on the financial and productive sectors; more research is called for; Regulatory options: prohibit shadow banks; patchwork, reactive and fragmented regulatory changes (currently implemented); assimilate shadow banks into traditional banking system (some failed experiments).