Downloaded 18 times


![3 Administrator Management
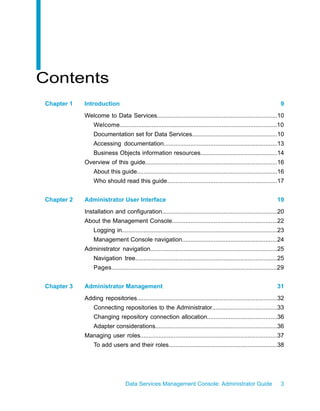
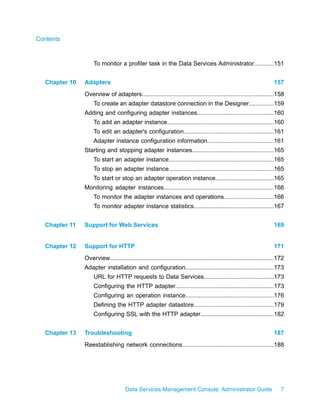
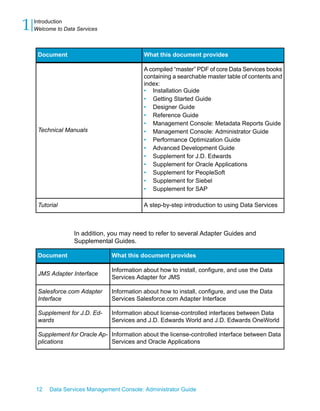
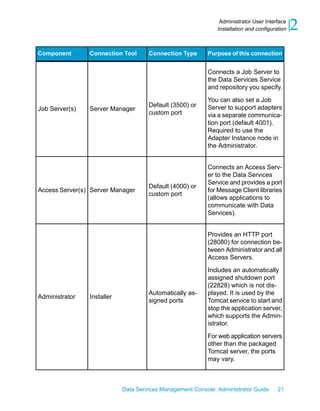
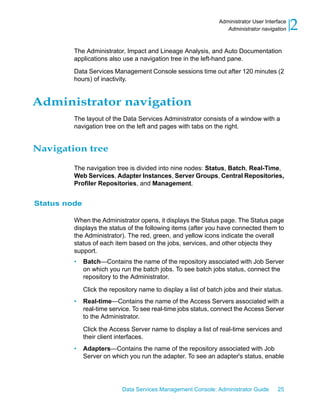
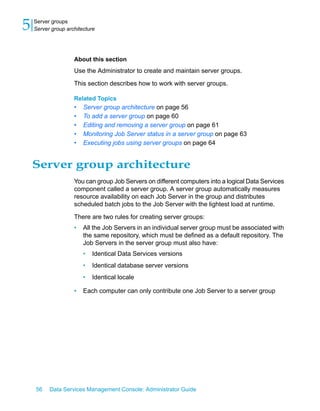
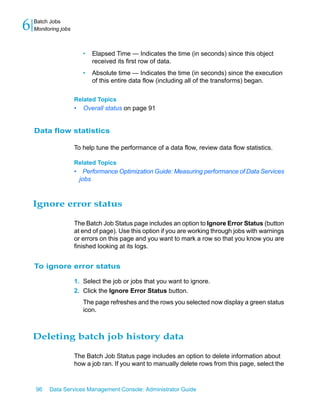
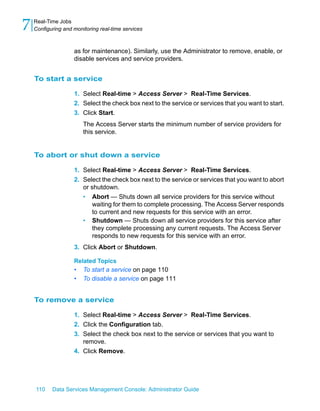
Adding repositories
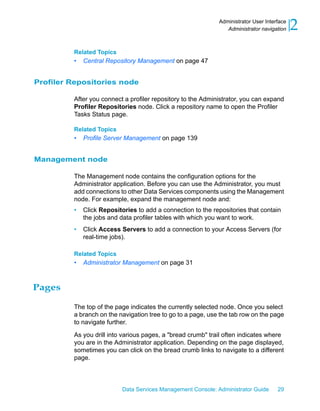
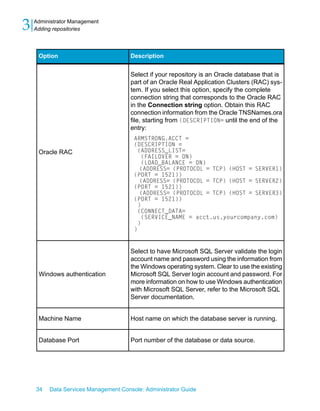
Changing repository connection allocation
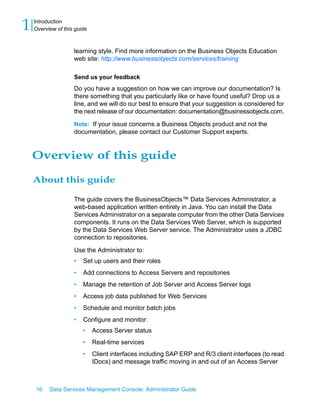
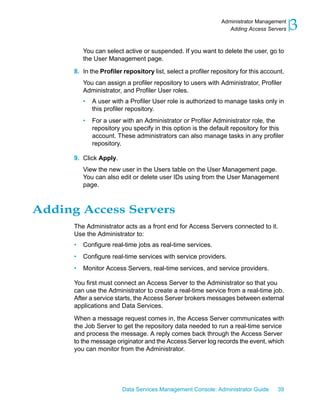
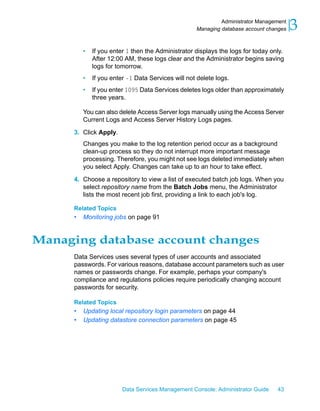
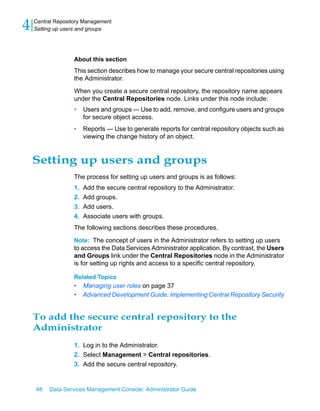
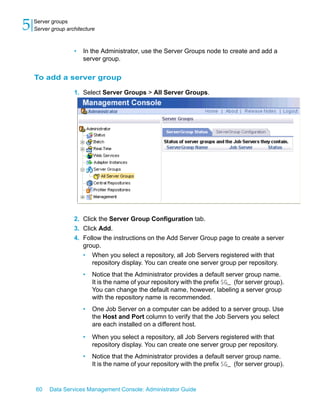
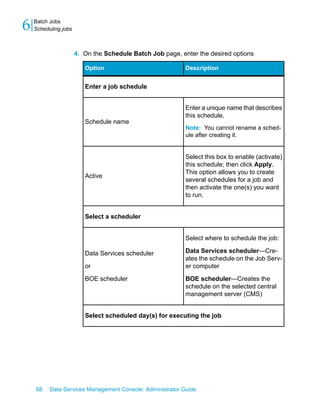
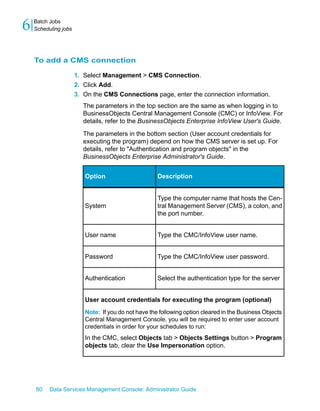
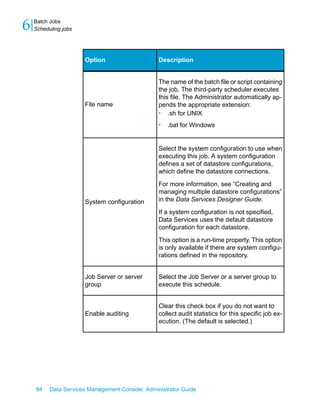
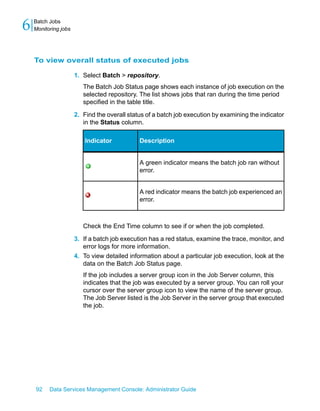
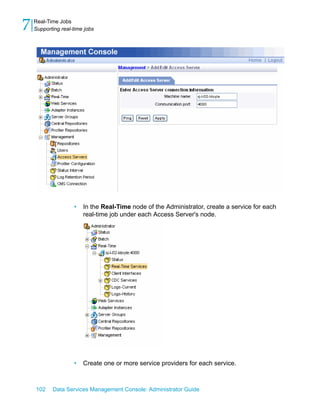
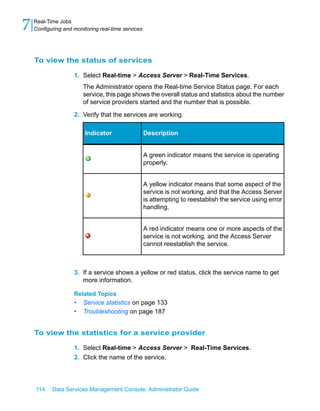
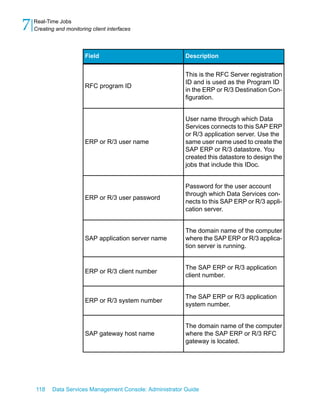
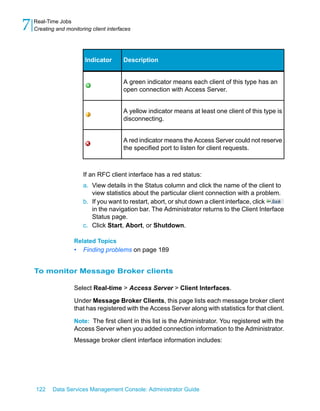
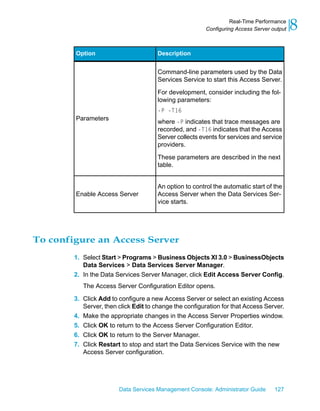
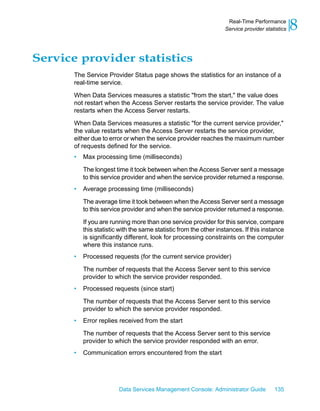
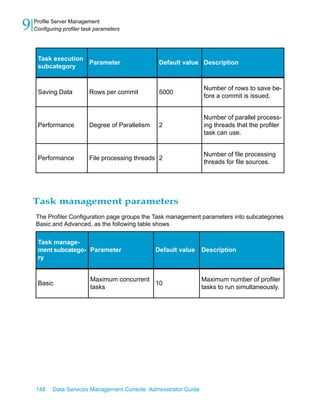
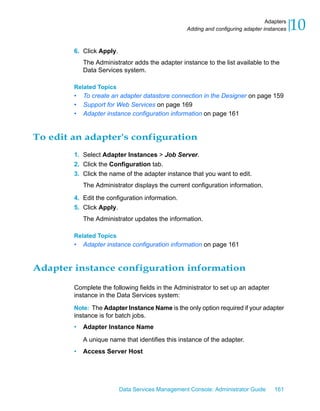
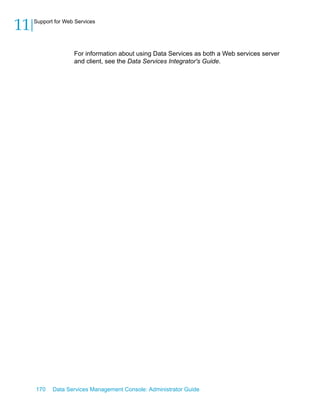
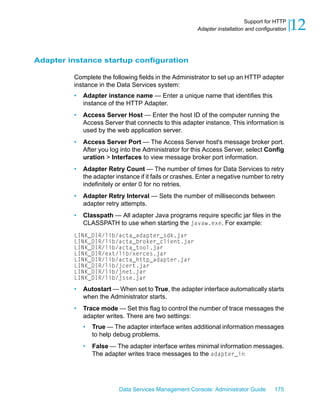
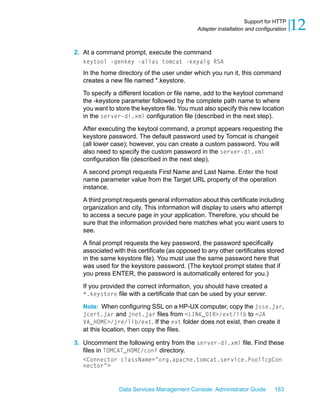
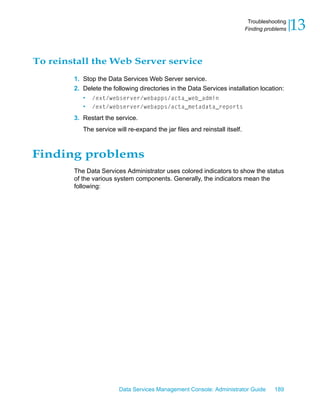
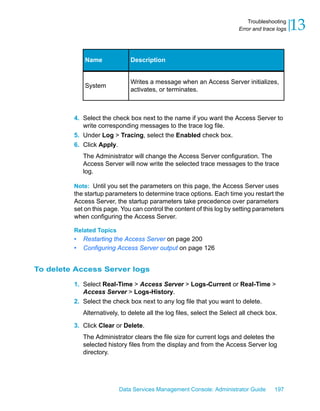
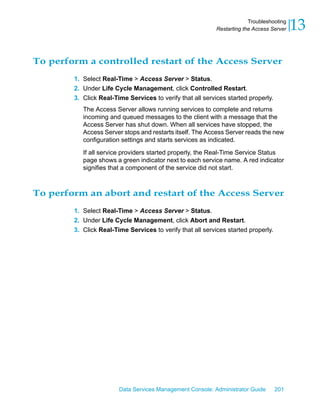
The Administrator allocates four repository connections per user as a default.
However, you can override the default value before starting the Administrator.
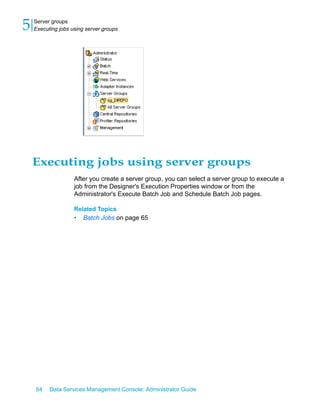
For Windows, modify the wrapper cmd_line section of LINK_DIR
/ext/WebServer/conf by adding DCNX_POOL_LIMIT:
wrapper.cmd_line=$ (wrapper.javabin)
-Dcatalina.home=$ (wrapper.tomcat_home)
-DLINK_DIR=$ (ACTAHOME) -DCNX_POOL_LIMIT=1
-classpath $ (wrapper.class_path)
For UNIX, modify the catalina.sh script found in LINK_DIR /ext/WebServer/bin
by adding -DCNX_POOL_LIMIT=1 in the 'start' section (not the 'security' section)
as follows:
if [ "$1" = "start" ] ; then
if [ "$1" = "-security" ] ; then
echo "Using Security Manager"
...
else
"$_RUNJAVA" $JAVA_OPTS $CATALINA_OPTS
-DCNX_POOL_LIMIT="1"
-Djava.endorsed.dirs="$JAVA_
Adapter considerations
To access adapter instances, you must associate a repository with a Job
Server that is:
• Installed on the same computer as the adapter instance.
• Configured with the following adapter-related properties: Support Adapter
and SNMP communication check box selected and the Communication
Port number set. Configure these properties using the Server Manager
utility.
If these conditions have not been met, you will not be able to use the Adapter
Instance node of the Administrator.
36 Data Services Management Console: Administrator Guide](https://image.slidesharecdn.com/xi3dsadministratorsguideen-120402013611-phpapp02/85/Xi3-ds-administrators_guide_en-36-320.jpg)

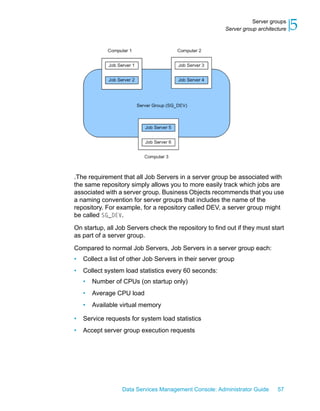
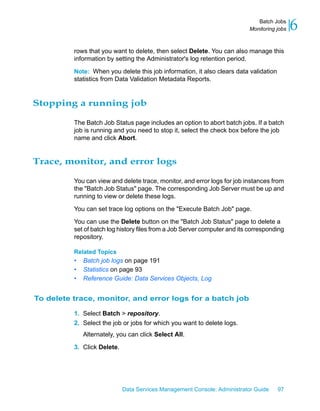


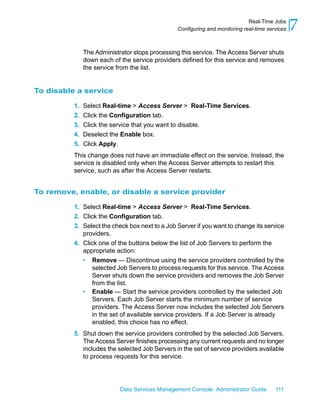
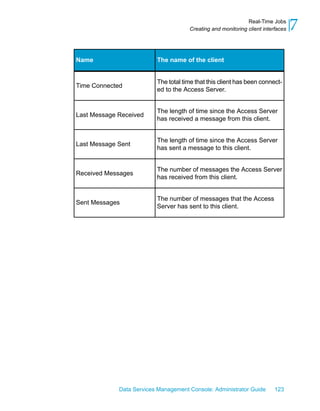


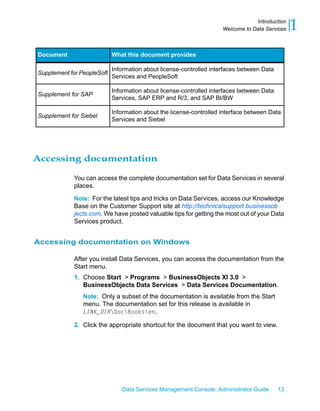
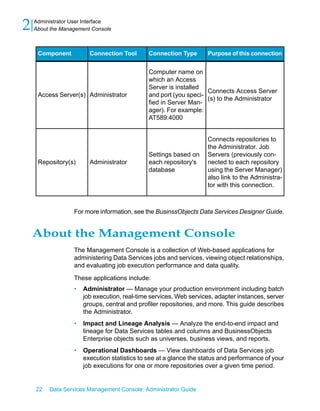
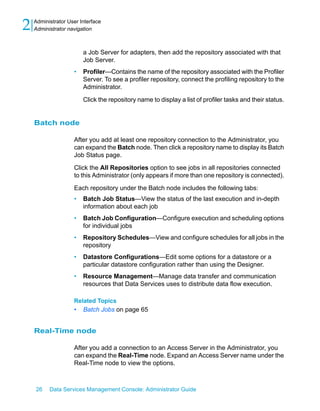
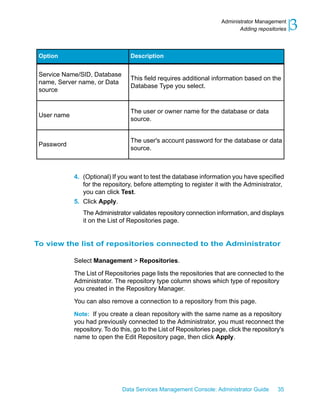
![12 Support for HTTP
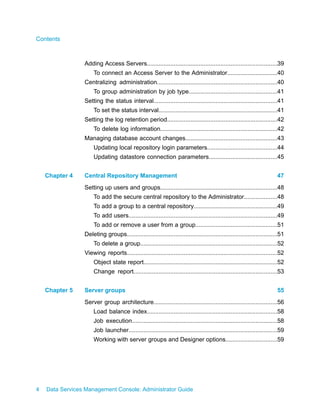
Overview
About this section
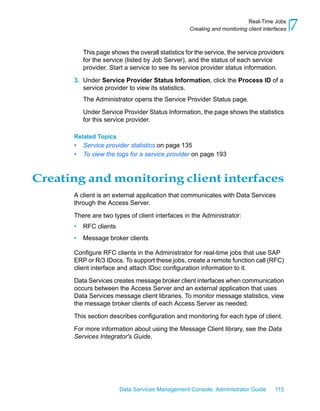
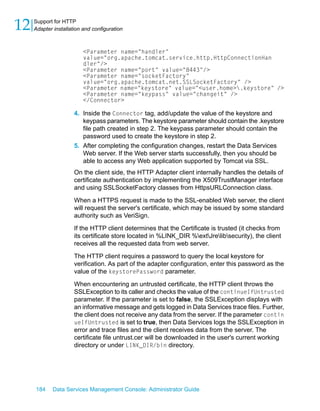
The HTTP functionality is installed with every Data Services Job Server. This
section describes how to configure and use this functionality with Data
Services. Topics include:
Related Topics
• Overview on page 172
• Adapter installation and configuration on page 173
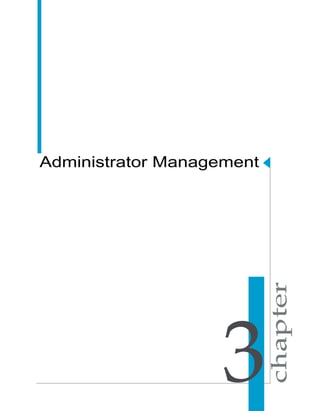
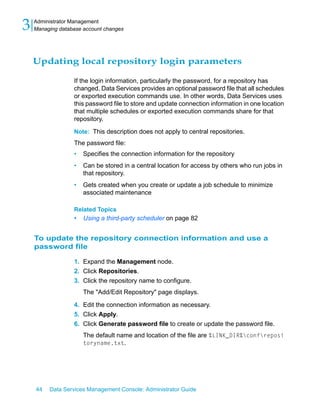
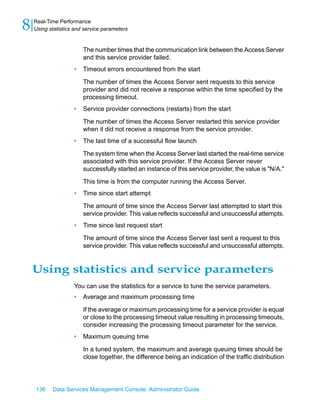
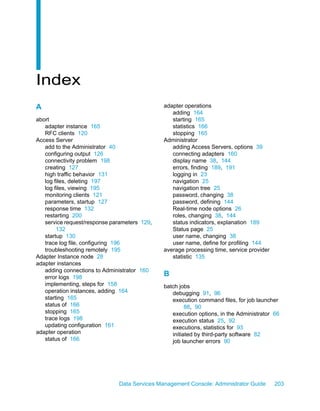
Overview
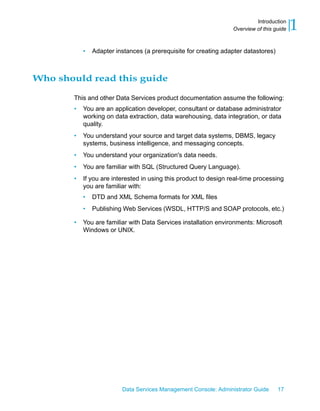
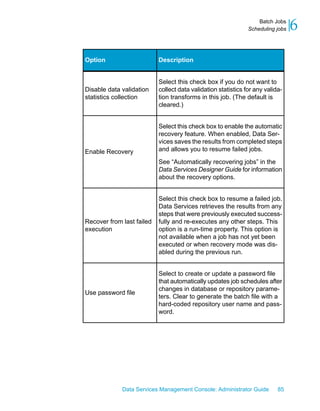
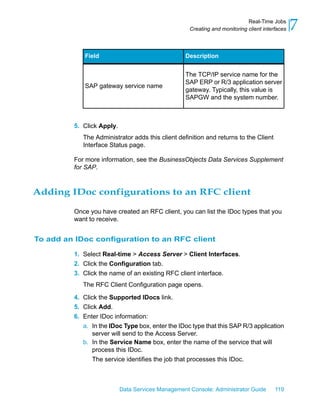
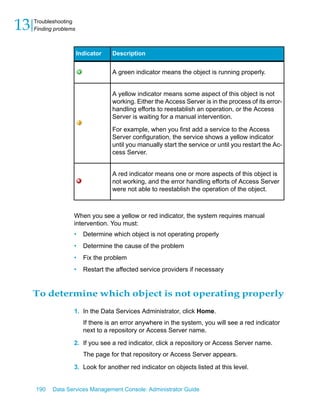
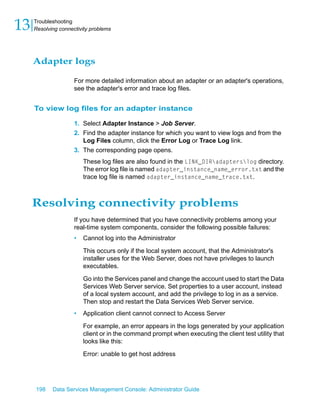
Hypertext Transfer Protocol (HTTP) is an application-level protocol for
distributed, collaborative, hypermedia information systems. HTTP has been
in use by the World-Wide Web global information initiative since 1990 and
its use has increased steadily over the years, mainly because it has proven
useful as a generic middleware protocol.
HTTP is a request/response protocol. A client sends a request to a server
specifying a "request method", a Universal Resource Identifier (URL), and
protocol version, followed by a message containing client information and
usually body content.
The server responds with a status line including the message's protocol
version and a success or error code, followed by a message containing
server information and usually body content.
HTTP communication usually takes place over TCP/IP connections. The
default port is TCP 80 [19], but other ports can be used. This does not
preclude HTTP from being implemented on top of any other protocol on the
Internet, or on other networks. HTTP only presumes a reliable transport; any
protocol that provides such a guarantee can be used.
HTTP can also utilize a Secure Socket Layer (SSL) to implement security
at the protocol level. In this manner, data exchange is protected from any
unscrupulous elements.
Business Objects Data Services supports HTTP in the following manner:
• Data transfer can be done using either HTTP or HTTPS (HTTP with SSL)
protocols
• The transport mechanism is always TCP/IP
172 Data Services Management Console: Administrator Guide](https://image.slidesharecdn.com/xi3dsadministratorsguideen-120402013611-phpapp02/85/Xi3-ds-administrators_guide_en-172-320.jpg)


![Index
real-time jobs (continued) service (continued)
See also service 100 creating 103
service and service provider 100 disabling automatic restart 111
service, specifying for 97 IDoc, connecting to 119
supporting, tasks for 100 processing retry count max 132
Real-time node,options 26 processing timeout 132
recycle request count max, service queues for 131
request/response parameters 130 queuing timeout 131
refresh interval, configuring Data Profiler 136 recycle request count max 130
removing services 110 registration failure 130
repository removing 110
adding to Administrator, options 33, 141 request/response, parameters for 129, 132
viewing from the Administrator 35, 143 response time controls 132
response time controls, service 132 service provider, adding 108
restarting Access Server 200 service provider, relation to 100
RFC clients shutdown 110
configuration options 117 statistics for 133
IDocs, adding 119 statistics, tuning 136
IDocs, parallel processing 119 service provider
purpose of 116 adding to a service 108
shutdown 120 error logs 182
starting 119 Job Server for, specifying 103
rows per commit, configuring Data Profiler 136 Job Server, relation to 100, 103
log files, viewing 193
remove or shut down 111
S restarting automatically 130
sampling row, configuring Data Profiler 136 service, relation to 100
SAP ERP and R/3, receiving IDocs from Access shutting down 111, 112
Server 116 starting 110
scheduling jobs statistics 114, 135
creating a schedule 67 trace logs 182
deleting a schedule 78 service provider[real-time jobs
options for 64 aaa] 100
using third-party scheduler 82 session time out, Management Console 24
server group Settings 24
defined 28 shutdown
determining which Job Server ran 92 Access Server 200
job launcher flag for 64 adapter instance 165
using 56, 64 adapter operation 165
Server Manager, Access Server, options 126 RFC clients 120
service service 110
configuration parameters for 103 service provider 111
206 Data Services Management Console: Administrator Guide](https://image.slidesharecdn.com/xi3dsadministratorsguideen-120402013611-phpapp02/85/Xi3-ds-administrators_guide_en-206-320.jpg)
![Index
starting the Management Console 23 trace logs (continued)
startup timeout, service request/response adapter instances 198
parameters 130 adapter instances, enabling messages in
statistics 161
adapter operations 166 batch jobs 97
for service 133 batch jobs, viewing 192
service provider 114, 135 jobs, deleting automatically 42
service, tuning 136 real-time jobs 97
status service provider 193
adapter instance 166 trace logs[errors
adapter operation 166 aaa] 191
batch job executions 92 trace logs[log files
client connections to an Access Server 121 aaa] 191
status interval, setting 41 trace logs[troubleshooting
stop batch jobs 97 aaa] 191
submit sleep interval, configuring Data Profiler troubleshooting
136 Access Server, remotely 195
connectivity problems 198
See also error logs 191
T
testing service request/response parameters U
129
third party scheduler 82 UNIX, executable batch file, for third party
timeout errors, service provider statistic 135 scheduler 82
timeouts users and roles, adding to the Administrator 38
processing 132 users, Administrator versus central repository
queuing 131 access 48
startup 130
trace logs
Access Server, configuring 196
W
Access Server, deleting 197 Web Services adapter 160
Access Server, viewing 195
Data Services Management Console: Administrator Guide 207](https://image.slidesharecdn.com/xi3dsadministratorsguideen-120402013611-phpapp02/85/Xi3-ds-administrators_guide_en-207-320.jpg)


This document provides an overview and introduction to the Data Services Management Console: Administrator Guide. It welcomes the reader to Data Services XI Release 3 and lists the documentation set. It describes how to access the documentation on Windows and UNIX systems as well as from the Business Objects website. Finally, it provides Business Objects' information resources for customer support, consulting, training, and submitting documentation feedback.