SlideShare a Scribd company logo
1 of 55
Download to read offline
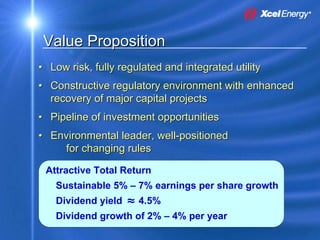
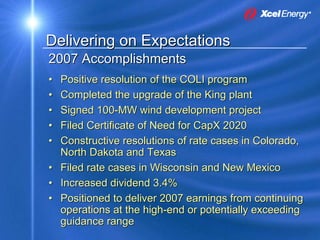
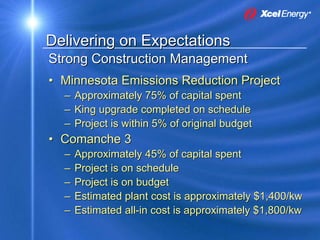
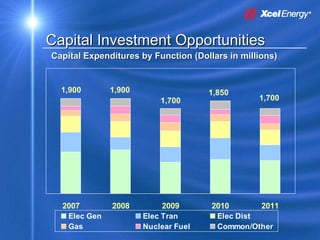
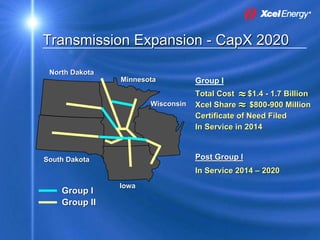
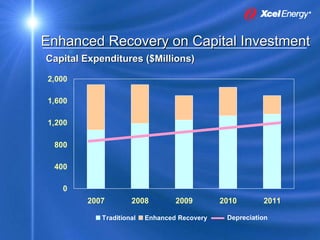
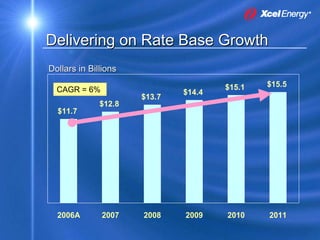
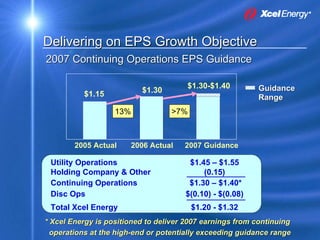
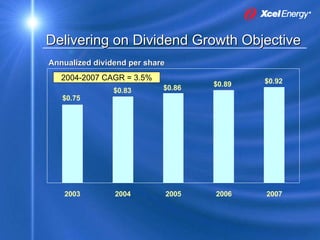
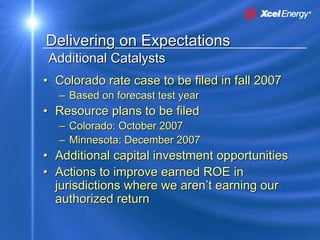
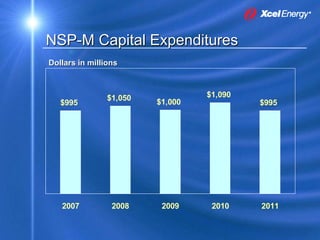
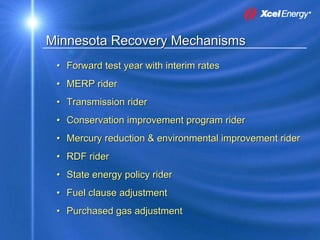
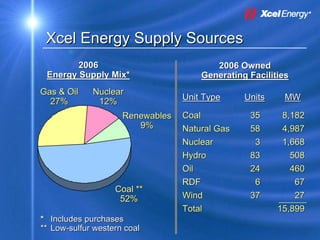
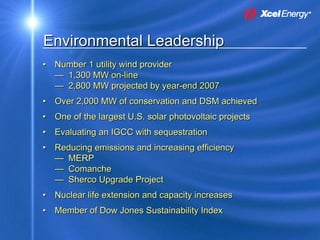
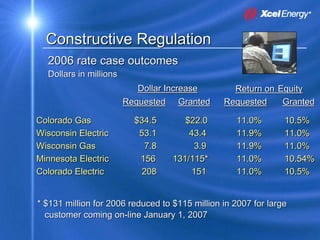
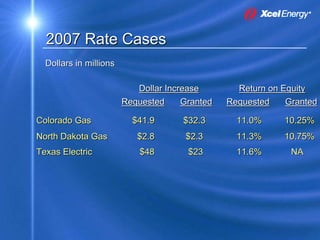
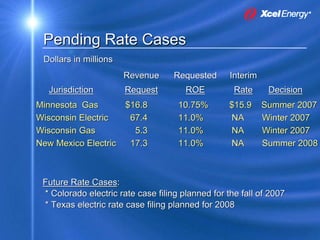
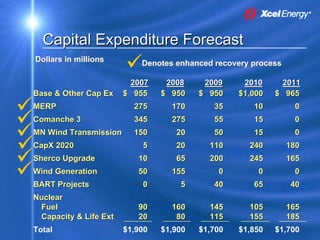
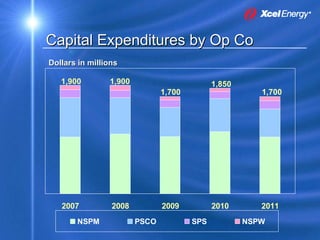
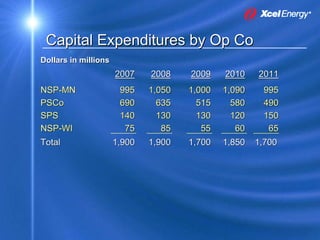
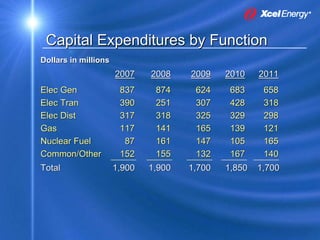
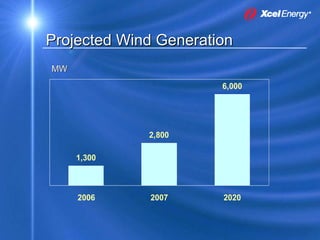
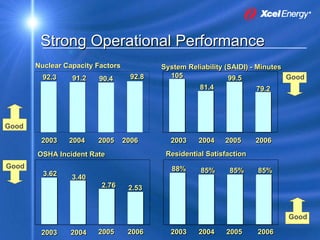
Delivering on Expectations
Kohler, Wisconsin
August 17, 2007


                        Xcel Energy Inc.
                        414 Nicollet Mall
                     Minneapolis, MN 55401
                     www.xcelenergy.com
Dick Kelly
President and CEO
Safe Harbor
This material includes forward-looking statements that are subject to
certain risks, uncertainties and assumptions. Such forward-looking
statements include projected earnings, cash flows, capital expenditures
and other statements and are identified in this document by the words
“anticipate,” “estimate,” “expect,” “projected,” “objective,” “outlook,”
“possible,” “potential” and similar expressions. Actual results may vary
materially. Factors that could cause actual results to differ materially
include, but are not limited to: general economic conditions, including the
availability of credit, actions of rating agencies and their impact on capital
expenditures; business conditions in the energy industry; competitive
factors; unusual weather; effects of geopolitical events, including war and
acts of terrorism; changes in federal or state legislation; regulation; costs
and other effects of legal administrative proceedings, settlements,
investigations and claims including litigation related to company-owned
life insurance (COLI); actions of accounting regulatory bodies; the higher
degree of risk associated with Xcel Energy’s nonregulated businesses
compared with Xcel Energy’s regulated business; and other risk factors
listed from time to time by Xcel Energy in reports filed with the SEC,
including Exhibit 99.01 to Xcel Energy’s report on Form 10-K for year 2006.
Value Proposition
• Low risk, fully regulated and integrated utility
• Constructive regulatory environment with enhanced
  recovery of major capital projects
• Pipeline of investment opportunities
• Environmental leader, well-positioned
    for changing rules

 Attractive Total Return
   Sustainable 5% – 7% earnings per share growth
                    ~ 4.5%
   Dividend yield
   Dividend growth of 2% – 4% per year
Delivering on Expectations
2007 Accomplishments
•   Positive resolution of the COLI program
•   Completed the upgrade of the King plant
•   Signed 100-MW wind development project
•   Filed Certificate of Need for CapX 2020
•   Constructive resolutions of rate cases in Colorado,
    North Dakota and Texas
•   Filed rate cases in Wisconsin and New Mexico
•   Increased dividend 3.4%
•   Positioned to deliver 2007 earnings from continuing
    operations at the high-end or potentially exceeding
    guidance range
Delivering on Expectations
Strong Construction Management
• Minnesota Emissions Reduction Project
  – Approximately 75% of capital spent
  – King upgrade completed on schedule
  – Project is within 5% of original budget
• Comanche 3
  –   Approximately 45% of capital spent
  –   Project is on schedule
  –   Project is on budget
  –   Estimated plant cost is approximately $1,400/kw
  –   Estimated all-in cost is approximately $1,800/kw
Capital Investment Opportunities
Capital Expenditures by Function (Dollars in millions)


  1,900       1,900                  1,850
                                                 1,700
                          1,700


  2007        2008         2009       2010       2011
   Elec Gen           Elec Tran        Elec Dist
   Gas                Nuclear Fuel     Common/Other
Transmission Expansion - CapX 2020

 North Dakota
                Minnesota          Group I
                                               ~
                                               ~
                                   Total Cost     $1.4 - 1.7 Billion
                                               ~
                                               ~
                       Wisconsin   Xcel Share      $800-900 Million
                                   Certificate of Need Filed
                                   In Service in 2014


                                   Post Group I
South Dakota
                                   In Service 2014 – 2020
                Iowa
    Group I
    Group II
CapX 2020 Permitting Timeline
  2007                   2008                    2009   2010


    MN Certificate of Need – 345kV Projects
    MN Certificate of Need – 345kV Projects


         Analyses of Routes


          Bemidji 230kV Project Need and Route
          Bemidji 230kV Project Need and Route

                   WI, ND, SD: Need, Route Permits
                   WI, ND, SD: Need, Route Permits


                         MN Route Permits
                         MN Route Permits


                         Federal Environmental Review
                         Federal Environmental Review
Nuclear Life Extension and Uprate
• Monticello
   – Life extension approximately $150 million
   – Power uprate approximately $130 million ($1,850/kw)
      • 15 MW new capacity in 2009
      • 56 MW new capacity in 2011

• Prairie Island
   – Life extension approximately $400 million
      • Includes Unit 2 steam generator replacement
   – Power uprate approximately $320 million ($1,900/kw)
      • 82 MW new capacity on Unit 1 in 2012
      • 82 MW new capacity on Unit 2 in 2015
Nuclear Plant Life Extension
• Federal License Renewal Process
  – Complete for Monticello
  – Plan to submit Prairie Island applications in 2008
  – Expect Prairie Island renewed licenses in 2010

• State Certificate of Need for Spent Fuel Storage
  –   Complete for Monticello
  –   Plan to submit Prairie Island application in
      December 2007 with completion expected June
      2010
Enhanced Recovery on Capital Investment
Capital Expenditures ($Millions)

2,000

1,600

1,200

 800

 400

   0
        2007         2008         2009        2010       2011

                                               Depreciation
            Traditional   Enhanced Recovery
Delivering on Rate Base Growth
Dollars in Billions
                                              $15.5
                                      $15.1
  CAGR = 6%                   $14.4
                      $13.7
              $12.8
  $11.7


  2006A       2007    2008    2009    2010    2011
Delivering on EPS Growth Objective
2007 Continuing Operations EPS Guidance

                                       $1.30-$1.40         Guidance
                           $1.30
          $1.15                                            Range
                   13%             >7%


        2005 Actual      2006 Actual   2007 Guidance

 Utility Operations                     $1.45 – $1.55
 Holding Company & Other                    (0.15)
 Continuing Operations                  $1.30 – $1.40*
 Disc Ops                              $(0.10) - $(0.08)
 Total Xcel Energy                       $1.20 - $1.32
* Xcel Energy is positioned to deliver 2007 earnings from continuing
  operations at the high-end or potentially exceeding guidance range
Delivering on Dividend Growth Objective
Annualized dividend per share
   2004-2007 CAGR = 3.5%                       $0.92
                                       $0.89
                            $0.86
                $0.83
   $0.75


   2003         2004            2005   2006    2007
Delivering on Expectations
    Additional Catalysts
• Colorado rate case to be filed in fall 2007
     – Based on forecast test year
• Resource plans to be filed
     – Colorado: October 2007
     – Minnesota: December 2007
•    Additional capital investment opportunities
•    Actions to improve earned ROE in
     jurisdictions where we aren’t earning our
     authorized return
Ben Fowke
Vice President and CFO
Northern States Power – Minnesota
                            2006 Financials ($Millions)
North Dakota   Minnesota
                           Earnings Cont. Op       $272
                           Assets               $9,079
                           GAAP ROE               11.2%
                           Equity Ratio           52.3%
                           2006 Owned Generation (MW)
                                  (NSP System)
                           Coal         3,590
South Dakota
                           Nuclear      1,817
                           Gas          2,335
                           Renewable      399
     2006 Customers
  Electric   1,360,000
                                  2006 Retail Sales
  Gas          465,000
                            (Thousands of Mwh / MMBtu)
                           Electric       35,923
                           Gas            70,497
NSP-M 2006 Rate Base and ROE
Dollars in Millions                       W/N
                             Rate Base Earned ROE
Minnesota Electric               $3,599   10.3%
Minnesota Gas                       441    6.1
North Dakota Electric               188    8.9
North Dakota Gas                     44    7.5
South Dakota Electric               232    NR
Wholesale                            27    NR
Total Rate Base                  $4,531


Regulated Equity Ratio = 51.6%
NR = Not Reported
NSP-M Capital Expenditures
Dollars in millions


                                  $1,090
                $1,050   $1,000
   $995                                    $995


   2007          2008     2009     2010    2011
Minnesota Recovery Mechanisms
 • Forward test year with interim rates
 • MERP rider
 • Transmission rider
 • Conservation improvement program rider
 • Mercury reduction & environmental improvement rider
 • RDF rider
 • State energy policy rider
 • Fuel clause adjustment
 • Purchased gas adjustment
Dakota’s Recovery Mechanisms
 • Forward test year with interim rates (ND)
 • Historical test year (SD)
 • Environmental rider (ND & SD)
 • Transmission rider (ND & SD)
 • Fuel clause adjustment (ND & SD)
 • Full decoupling on retail natural gas (ND)
Public Service Company of Colorado

                         2006 Financials ($Millions)
  Colorado
                        Earnings Cont. Op       $221
                        Assets              $8,363
                        GAAP ROE                7.8%
                        Equity Ratio         56.5%
                        2006 Owned Generation (MW)
                        Coal        2,656
                        Gas         1,026
                        Wind           54
                        Renewable     358
    2006 Customers
                               2006 Retail Sales
 Electric   1,320,000
                         (Thousands of Mwh / MMBtu)
 Gas        1,250,000
                        Electric        27,198
                        Gas            125,123
PSCo 2006 Rate Base and ROE
Dollars in Millions                         W/N
                             Rate Base    Earned ROE
Colorado Electric                $3,292     7.7%
Colorado Gas                      1,106     7.8
Wholesale                           418     NR
Total Rate Base                  $4,816


Regulated Equity Ratio = 60.3%
NR = Not Reported
PSCo Capital Expenditures
Dollars in millions


   $690
                $635
                               $580
                        $515          $490


   2007          2008   2009   2010   2011
Colorado Recovery Mechanisms
 • Ability to file either historical or forecast test years
 • Purchased capacity cost adjustment
 • Comanche 3 – forward CWIP via general rate case
 • Transmission rider
 • Renewable energy rider
 • IGCC rider (if there is an approved project)
 • Demand side management cost adjustment rider
 • Air quality improvement rider
 • Energy cost adjustment
 • Gas cost adjustment
 • Partial decoupling on retail natural gas
Northern States Power – Wisconsin
       Upper Michigan
                         2006 Financials ($Millions)
                        Earnings Cont. Op        $44
                        Assets               $1,251
                        GAAP ROE                9.7%
                        Equity Ratio           57.1%
                        2006 Owned Generation (MW)
                        Included in NSP System
     Wisconsin
                               2006 Retail Sales
                         (Thousands of Mwh / MMBtu)
                        Electric        6,173
   2006 Customers
                        Gas           14,568
 Electric   245,000
 Gas        100,000
NSP-W 2006 Rate Base and ROE
Dollars in Millions                        W/N
                             Rate Base   Earned ROE
Wisconsin Electric               $556     10.7%
Wisconsin Gas                      77      4.6
Wholesale                          29      4.4
Michigan Electric                  14      8.4
Michigan Gas                        3      2.2
Total Rate Base                  $679


Regulated Equity Ratio = 56.1%
NSP-W Capital Expenditures
Dollars in millions


                 $85
   $75
                                      $65
                               $60
                        $55


   2007          2008   2009   2010   2011
Wisconsin Recovery Mechanisms

 • Forward test year
 • Ability to file for prospective fuel & purchase energy
   adjustments (Wisconsin)
 • Fuel clause adjustment – wholesale
 • Purchased gas adjustment
 • Fuel clause factor (Michigan retail)
Southwestern Public Service
   New Mexico
                       2006 Financials ($Millions)
                      Earnings Cont. Op        $48
                      Assets              $2,619
                      GAAP ROE                5.9%
                      Equity Ratio         49.1%
                      2006 Owned Generation (MW)
                      Coal        2,073
   Texas
                      Gas         2,078

                             2006 Retail Sales
   2006 Customers
                       (Thousands of Mwh / MMBtu)
 Electric   385,000
                      Electric       17,291
SPS 2006 Rate Base and ROE
Dollars in Millions
                                           W/N
                             Rate Base   Earned ROE
Texas Electric                   $977      NR
New Mexico Electric               311      6.2%
Wholesale                         404      NR
Total Rate Base              $1,692


Regulated Equity Ratio = 50.1%
NR = Not Reported
SPS Capital Expenditures
Dollars in millions


                                      $150
   $140
                $130    $130
                               $120


   2007          2008   2009   2010   2011
SPS Recovery Mechanisms

 • Historical test year (Texas & New Mexico)
 • Texas fixed fuel factor recovery
 • New Mexico fuel clause adjustment
 • Ability to establish interim rates through rate case to
   recover capacity costs associated the Lea Power
   contract (Texas)
Key Take-Aways
• Strong regulatory recovery mechanisms
   – Forward test years
   – Riders for major capital projects
   – Fuel clause and PGA recovery
• Opportunities exist to improve earned ROE in
  jurisdictions where we aren’t earning our
  authorized return
• Significant capital investment opportunities exist
• We are disciplined portfolio managers
• Capital investment is driven by customer
  requirements and economic signals
Value Proposition
• Low risk, fully regulated and integrated utility
• Constructive regulatory environment with enhanced
  recovery of major capital projects
• Pipeline of investment opportunities
• Environmental leader, well-positioned
  for changing rules

 Attractive Total Return
   Sustainable 5% – 7% earnings per share growth
                    ~ 4.5%
   Dividend yield
   Dividend growth of 2% – 4% per year
Upcoming Analyst Meeting

          December 5th
Date:
Location: New York Marriott Marquis
          Times Square

Details to follow in the coming weeks
Appendix
Profile
          NSP- Minnesota                     Traditional Regulation
                           NSP- Wisconsin
          47% Net Income
                           7% Net Income     Operate in 8 States

                                             Combination Utility:
                                             • Electric 85% net income
                                             • Gas 15% net income
    PSCo
38% Net Income
                                             Customers:
                                             • 3.3 million electric
                                             • 1.8 million gas

                                             2006 Financial Stats:
                                             • NI Cont Op = $548 million
                                             • Assets = $22 billion
           SPS                               • Equity Ratio = 43%
       8% Net Income                         • GAAP ROE = 10.1%


           2006 EPS $1.30 continuing operations
           2007 Dividend $0.92 per share annualized
Xcel Energy Supply Sources
        2006                               2006 Owned
 Energy Supply Mix*                     Generating Facilities
Gas & Oil    Nuclear
                                  Unit Type       Units    MW
  27%         12%
                                  Coal             35      8,182
                     Renewables
                        9%        Natural Gas      58      4,987
                                  Nuclear           3      1,668
                                  Hydro            83        508
                                  Oil              24           460
                                  RDF               6            67
                   Coal **
                                  Wind             37         27
                    52%
                                  Total                   15,899
* Includes purchases
** Low-sulfur western coal
   Low-sulfur
Delivering Competitively Priced Energy
    Summer 2006 EEI Typical Bills
         Cents per kWh (Retail)
21

18

15

12

  9                                     7.79
                            6.64 7.01
  6

  3

  0
                                                       C
       uis City ines City rillo aul ago ver kee nix n D C mi ton York
     o
  . L ake Mo as ma St. P hic en wau hoe gto Mia Bos ew
St L       es ns A s /          C     D i l P h in           N
  al t                 pl                          h
               Ka                       M       as
           D          M
S                                              W
Environmental Leadership
• Number 1 utility wind provider
  — 1,300 MW on-line
                 on-line
  — 2,800 MW projected by year-end 2007
                              year-end
• Over 2,000 MW of conservation and DSM achieved
• One of the largest U.S. solar photovoltaic projects
• Evaluating an IGCC with sequestration
• Reducing emissions and increasing efficiency
  — MERP
  — Comanche
  — Sherco Upgrade Project
• Nuclear life extension and capacity increases
• Member of Dow Jones Sustainability Index
Constructive Regulation
  2006 rate case outcomes
  Dollars in millions
                           Dollar Increase        Return on Equity
                        Requested Granted       Requested    Granted

Colorado Gas              $34.5       $22.0        11.0%        10.5%
Wisconsin Electric         53.1        43.4        11.9%        11.0%
Wisconsin Gas                7.8        3.9        11.9%        11.0%
Minnesota Electric         156     131/115*        11.0%        10.54%
Colorado Electric           208         151        11.0%        10.5%


* $131 million for 2006 reduced to $115 million in 2007 for large
  customer coming on-line January 1, 2007
2007 Rate Cases
  Dollars in millions

                           Dollar Increase        Return on Equity
                        Requested     Granted   Requested    Granted

Colorado Gas              $41.9       $32.3       11.0%     10.25%
North Dakota Gas           $2.8       $2.3        11.3%     10.75%
Texas Electric              $48        $23        11.6%       NA
Pending Rate Cases
 Dollars in millions
                       Revenue      Requested      Interim
  Jurisdiction         Request         ROE          Rate      Decision
Minnesota Gas       $16.8            10.75%        $15.9     Summer 2007
Wisconsin Electric   67.4            11.0%         NA        Winter 2007
Wisconsin Gas         5.3            11.0%         NA        Winter 2007
New Mexico Electric  17.3            11.0%         NA        Summer 2008


 Future Rate Cases:
 * Colorado electric rate case filing planned for the fall of 2007
 * Texas electric rate case filing planned for 2008
Capital Expenditure Forecast
Dollars in millions        Denotes enhanced recovery process

                        2007     2008     2009     2010     2011
Base & Other Cap Ex    $ 955    $ 950    $ 950    $1,000   $ 965
MERP                     275      170       35       10         0
Comanche 3               345      275       55       15         0
MN Wind Transmission     150       20       50       15         0
CapX 2020                  5       20      110      240        180
Sherco Upgrade            10       65      200      245        165
Wind Generation           50      155        0        0         0
BART Projects              0        5       40       65        40
Nuclear
 Fuel                     90      160      145      105        165
 Capacity & Life Ext      20       80      115      155        185
Total                  $1,900   $1,900   $1,700   $1,850   $1,700
Capital Expenditures by Op Co
Dollars in millions

   1,900        1,900                        1,850
                               1,700                    1,700


   2007          2008          2009          2010       2011
       NSPM             PSCO           SPS           NSPW
Capital Expenditures by Op Co
Dollars in millions
                      2007    2008    2009    2010    2011
NSP-MN                 995    1,050   1,000   1,090    995
PSCo                   690      635     515     580    490
SPS                    140      130     130     120    150
NSP-WI                  75       85      55      60     65
Total                 1,900   1,900   1,700   1,850   1,700
Capital Expenditures by Function
Dollars in millions
                      2007    2008    2009    2010    2011
Elec Gen               837     874     624     683     658
Elec Tran              390     251     307     428     318
Elec Dist              317     318     325     329     298
Gas                    117     141     165     139     121
Nuclear Fuel            87     161     147     105     165
Common/Other           152     155     132     167     140
Total                 1,900   1,900   1,700   1,850   1,700
Xcel Energy and Wind Potential
               Source: National Renewable Energy Laboratory


Wind Density
       High
                                Xcel Energy
                                States Served
       Low
Projected Wind Generation
MW
                       6,000


             2,800

     1,300


     2006    2007      2020
Strong Operational Performance
       Nuclear Capacity Factors           System Reliability (SAIDI) - Minutes
                                            105
                                   92.8                                        Good
         92.3                                                 99.5
                 91.2   90.4
                                                    81.4               79.2


Good
        2003    2004    2005      2006      2003    2004    2005      2006
                                           Residential Satisfaction
       OSHA Incident Rate
Good                                        88%      85%     85%      85%
         3.62
                 3.40
                         2.76      2.53


                                                                              Good
                                                                              Good
                        2005       2006     2003    2004    2005      2006
        2003    2004
Senior Debt Ratings

                    Secured              Unsecured
              Fitch Moody’s S&P    Fitch   Moody’s   S&P
                    Moody’s                Moody’s
Holding Co.                        BBB+      Baa1    BBB-
                                                     BBB-
NSPM           A+      A2     A-     A        A3     BBB-
                              A-                     BBB-
NSPW           A+      A2     A-     A        A3     BBB
                              A-
PSCo           A       A3     A-     A-      Baa1    BBB-
                              A-     A-              BBB-
SPS                                BBB+      Baa1    BBB
Debt Maturities
        Dollars in millions
1,200
                                                Xcel
1,000                                           NSPM
                                                NSPW
 800
                                                PSCo
 600                                            SPS

 400

 200

   0
        2007 2008 2009 2010 2011 2012 2013 2014 2015

 PSCO                         Xcel Energy
 $100M due 3/1/07 @ 7.11%     $230M due 11/1/07 @ 7.50%
2006 Rate Base and ROE
                                     W/N
Dollars in Millions
                        Rate Base   Earned ROE
Minnesota Electric        $3,599     10.3%
Minnesota Gas                441       6.1
North Dakota Electric        188       8.9
North Dakota Gas              44       7.5
South Dakota Electric        232       NR
Colorado Electric          3,292       7.7
Colorado Gas               1,106       7.8
Wisconsin Electric           556      10.7
Wisconsin Gas                 77       4.6
Texas Electric               977       NR
New Mexico Electric          311       6.2
Wholesale                    879       NR
Total Rate Base          $11,702
NR = Not Reported

More Related Content

What's hot

xcel energy AGA_May_2008
xcel energy  AGA_May_2008xcel energy  AGA_May_2008
xcel energy AGA_May_2008finance26
 
xcel energy BAC_Presentation_112007_Final
xcel energy  BAC_Presentation_112007_Finalxcel energy  BAC_Presentation_112007_Final
xcel energy BAC_Presentation_112007_Finalfinance26
 
xcel energy EEI_Pres_November_2007SEC
xcel energy  EEI_Pres_November_2007SECxcel energy  EEI_Pres_November_2007SEC
xcel energy EEI_Pres_November_2007SECfinance26
 
xcel energy 3-19-2008_Boston_Pres
xcel energy  3-19-2008_Boston_Presxcel energy  3-19-2008_Boston_Pres
xcel energy 3-19-2008_Boston_Presfinance26
 
xcel energy RBC_August_2008
xcel energy  RBC_August_2008xcel energy  RBC_August_2008
xcel energy RBC_August_2008finance26
 
xcel energy RBC_July_2008
xcel energy  RBC_July_2008xcel energy  RBC_July_2008
xcel energy RBC_July_2008finance26
 

What's hot (7)

xcel energy AGA_May_2008
xcel energy  AGA_May_2008xcel energy  AGA_May_2008
xcel energy AGA_May_2008
 
xcel energy BAC_Presentation_112007_Final
xcel energy  BAC_Presentation_112007_Finalxcel energy  BAC_Presentation_112007_Final
xcel energy BAC_Presentation_112007_Final
 
xcel energy EEI_Pres_November_2007SEC
xcel energy  EEI_Pres_November_2007SECxcel energy  EEI_Pres_November_2007SEC
xcel energy EEI_Pres_November_2007SEC
 
xcel energy 3-19-2008_Boston_Pres
xcel energy  3-19-2008_Boston_Presxcel energy  3-19-2008_Boston_Pres
xcel energy 3-19-2008_Boston_Pres
 
xcel energy RBC_August_2008
xcel energy  RBC_August_2008xcel energy  RBC_August_2008
xcel energy RBC_August_2008
 
xcel energy RBC_July_2008
xcel energy  RBC_July_2008xcel energy  RBC_July_2008
xcel energy RBC_July_2008
 
xel_062106
xel_062106xel_062106
xel_062106
 

Viewers also liked

xcel energy 10k PSCo_rev
xcel energy 10k PSCo_revxcel energy 10k PSCo_rev
xcel energy 10k PSCo_revfinance26
 
Ict Emerging Trends May 2009
Ict Emerging Trends May 2009Ict Emerging Trends May 2009
Ict Emerging Trends May 2009Maurizio Milazzo
 
Housing In Two U.S. Cities
Housing In Two U.S. CitiesHousing In Two U.S. Cities
Housing In Two U.S. Citiesmundotrekker
 
xel_05/25/01b
xel_05/25/01bxel_05/25/01b
xel_05/25/01bfinance26
 
Xpi final presentation
Xpi final presentationXpi final presentation
Xpi final presentationmercixpress
 
xcel energy 2007 NSP-WI10-K
xcel energy 2007 NSP-WI10-Kxcel energy 2007 NSP-WI10-K
xcel energy 2007 NSP-WI10-Kfinance26
 
xel_062006_CapX
xel_062006_CapXxel_062006_CapX
xel_062006_CapXfinance26
 
Smartlife 13 ottobre 2011 italian short
Smartlife 13 ottobre 2011 italian shortSmartlife 13 ottobre 2011 italian short
Smartlife 13 ottobre 2011 italian shortMaurizio Milazzo
 
From Unstructured Sales to Professional Selling
From Unstructured Sales to Professional Selling From Unstructured Sales to Professional Selling
From Unstructured Sales to Professional Selling Maurizio Milazzo
 
ESL Advanced Halloween
ESL  Advanced  HalloweenESL  Advanced  Halloween
ESL Advanced Halloweenmundotrekker
 
limited brands annual report 2003 financials
limited brands annual report 2003 financialslimited brands annual report 2003 financials
limited brands annual report 2003 financialsfinance26
 
Security Governance Isp Eng
Security Governance Isp EngSecurity Governance Isp Eng
Security Governance Isp EngMaurizio Milazzo
 
Infomation Leakage Prevention Ita
Infomation Leakage Prevention ItaInfomation Leakage Prevention Ita
Infomation Leakage Prevention ItaMaurizio Milazzo
 
Elections In The United States
Elections In The United StatesElections In The United States
Elections In The United Statesmundotrekker
 

Viewers also liked (19)

xcel energy 10k PSCo_rev
xcel energy 10k PSCo_revxcel energy 10k PSCo_rev
xcel energy 10k PSCo_rev
 
Access governance en
Access governance enAccess governance en
Access governance en
 
Ict Emerging Trends May 2009
Ict Emerging Trends May 2009Ict Emerging Trends May 2009
Ict Emerging Trends May 2009
 
Housing In Two U.S. Cities
Housing In Two U.S. CitiesHousing In Two U.S. Cities
Housing In Two U.S. Cities
 
xel_05/25/01b
xel_05/25/01bxel_05/25/01b
xel_05/25/01b
 
Xpi final presentation
Xpi final presentationXpi final presentation
Xpi final presentation
 
XEL_Q405
XEL_Q405XEL_Q405
XEL_Q405
 
xcel energy 2007 NSP-WI10-K
xcel energy 2007 NSP-WI10-Kxcel energy 2007 NSP-WI10-K
xcel energy 2007 NSP-WI10-K
 
xel_062006_CapX
xel_062006_CapXxel_062006_CapX
xel_062006_CapX
 
Smartlife 13 ottobre 2011 italian short
Smartlife 13 ottobre 2011 italian shortSmartlife 13 ottobre 2011 italian short
Smartlife 13 ottobre 2011 italian short
 
From Unstructured Sales to Professional Selling
From Unstructured Sales to Professional Selling From Unstructured Sales to Professional Selling
From Unstructured Sales to Professional Selling
 
ESL Advanced Halloween
ESL  Advanced  HalloweenESL  Advanced  Halloween
ESL Advanced Halloween
 
limited brands annual report 2003 financials
limited brands annual report 2003 financialslimited brands annual report 2003 financials
limited brands annual report 2003 financials
 
xel_092404
xel_092404xel_092404
xel_092404
 
xel_021104
xel_021104xel_021104
xel_021104
 
xel 2000ar1
xel 2000ar1xel 2000ar1
xel 2000ar1
 
Security Governance Isp Eng
Security Governance Isp EngSecurity Governance Isp Eng
Security Governance Isp Eng
 
Infomation Leakage Prevention Ita
Infomation Leakage Prevention ItaInfomation Leakage Prevention Ita
Infomation Leakage Prevention Ita
 
Elections In The United States
Elections In The United StatesElections In The United States
Elections In The United States
 

Similar to xcel energy 8_16_2007KohlerPresentation8172007SEC

xcel energy 9_4LehmanConfPresentation952007SEC
xcel energy  9_4LehmanConfPresentation952007SECxcel energy  9_4LehmanConfPresentation952007SEC
xcel energy 9_4LehmanConfPresentation952007SECfinance26
 
xcel energy 9_8888LehmanConfPresentation952007SEC
xcel energy  9_8888LehmanConfPresentation952007SECxcel energy  9_8888LehmanConfPresentation952007SEC
xcel energy 9_8888LehmanConfPresentation952007SECfinance26
 
xcel energy 9_11EuropeanRoadShowPresentationSeptember2007
xcel energy  9_11EuropeanRoadShowPresentationSeptember2007xcel energy  9_11EuropeanRoadShowPresentationSeptember2007
xcel energy 9_11EuropeanRoadShowPresentationSeptember2007finance26
 
xcel energy 5_25CanadianPresentation2007
xcel energy  5_25CanadianPresentation2007xcel energy  5_25CanadianPresentation2007
xcel energy 5_25CanadianPresentation2007finance26
 
xcel energy 5_25CanadianPresentation2007
xcel energy  5_25CanadianPresentation2007xcel energy  5_25CanadianPresentation2007
xcel energy 5_25CanadianPresentation2007finance26
 
xcel energy 6_12AGEdwardsSECPresentation
xcel energy  6_12AGEdwardsSECPresentationxcel energy  6_12AGEdwardsSECPresentation
xcel energy 6_12AGEdwardsSECPresentationfinance26
 
xcel energy 6_12AGEdwardsSECPresentation
xcel energy  6_12AGEdwardsSECPresentationxcel energy  6_12AGEdwardsSECPresentation
xcel energy 6_12AGEdwardsSECPresentationfinance26
 
5_2 AGASEC 04/29 /2007
5_2 AGASEC 04/29 /20075_2 AGASEC 04/29 /2007
5_2 AGASEC 04/29 /2007finance26
 
xcel energy 5_2A GASEC04/29/2007
xcel energy  5_2A GASEC04/29/2007xcel energy  5_2A GASEC04/29/2007
xcel energy 5_2A GASEC04/29/2007finance26
 
XEL_Fixed_Income_Presentation_February2008
XEL_Fixed_Income_Presentation_February2008XEL_Fixed_Income_Presentation_February2008
XEL_Fixed_Income_Presentation_February2008finance26
 
xcel energy 4_10MinneapolisInvestorMtgSECApril2007
xcel energy  4_10MinneapolisInvestorMtgSECApril2007xcel energy  4_10MinneapolisInvestorMtgSECApril2007
xcel energy 4_10MinneapolisInvestorMtgSECApril2007finance26
 
xcel energy 4_10MinneapolisInvestorMtgSECApril2007
xcel energy  4_10MinneapolisInvestorMtgSECApril2007xcel energy  4_10MinneapolisInvestorMtgSECApril2007
xcel energy 4_10MinneapolisInvestorMtgSECApril2007finance26
 
xcel energy Lehman_Sept_2008-SEC
xcel energy  Lehman_Sept_2008-SECxcel energy  Lehman_Sept_2008-SEC
xcel energy Lehman_Sept_2008-SECfinance26
 
xcel energy Lehman_Sept_2008-SEC
xcel energy  Lehman_Sept_2008-SECxcel energy  Lehman_Sept_2008-SEC
xcel energy Lehman_Sept_2008-SECfinance26
 
xcel energy ML_Sept_2008
xcel energy  ML_Sept_2008xcel energy  ML_Sept_2008
xcel energy ML_Sept_2008finance26
 
xcel energy ML_Sept_2008
xcel energy  ML_Sept_2008xcel energy  ML_Sept_2008
xcel energy ML_Sept_2008finance26
 
xcel energy 09/30/08_Texas
xcel energy  09/30/08_Texasxcel energy  09/30/08_Texas
xcel energy 09/30/08_Texasfinance26
 
09/30/08_Texas
09/30/08_Texas09/30/08_Texas
09/30/08_Texasfinance26
 
xcel energy AGA_Meeting_10-2-08
xcel energy  AGA_Meeting_10-2-08xcel energy  AGA_Meeting_10-2-08
xcel energy AGA_Meeting_10-2-08finance26
 
xcel energy AGA_Meeting_10-2-08
xcel energy  AGA_Meeting_10-2-08xcel energy  AGA_Meeting_10-2-08
xcel energy AGA_Meeting_10-2-08finance26
 

Similar to xcel energy 8_16_2007KohlerPresentation8172007SEC (20)

xcel energy 9_4LehmanConfPresentation952007SEC
xcel energy  9_4LehmanConfPresentation952007SECxcel energy  9_4LehmanConfPresentation952007SEC
xcel energy 9_4LehmanConfPresentation952007SEC
 
xcel energy 9_8888LehmanConfPresentation952007SEC
xcel energy  9_8888LehmanConfPresentation952007SECxcel energy  9_8888LehmanConfPresentation952007SEC
xcel energy 9_8888LehmanConfPresentation952007SEC
 
xcel energy 9_11EuropeanRoadShowPresentationSeptember2007
xcel energy  9_11EuropeanRoadShowPresentationSeptember2007xcel energy  9_11EuropeanRoadShowPresentationSeptember2007
xcel energy 9_11EuropeanRoadShowPresentationSeptember2007
 
xcel energy 5_25CanadianPresentation2007
xcel energy  5_25CanadianPresentation2007xcel energy  5_25CanadianPresentation2007
xcel energy 5_25CanadianPresentation2007
 
xcel energy 5_25CanadianPresentation2007
xcel energy  5_25CanadianPresentation2007xcel energy  5_25CanadianPresentation2007
xcel energy 5_25CanadianPresentation2007
 
xcel energy 6_12AGEdwardsSECPresentation
xcel energy  6_12AGEdwardsSECPresentationxcel energy  6_12AGEdwardsSECPresentation
xcel energy 6_12AGEdwardsSECPresentation
 
xcel energy 6_12AGEdwardsSECPresentation
xcel energy  6_12AGEdwardsSECPresentationxcel energy  6_12AGEdwardsSECPresentation
xcel energy 6_12AGEdwardsSECPresentation
 
5_2 AGASEC 04/29 /2007
5_2 AGASEC 04/29 /20075_2 AGASEC 04/29 /2007
5_2 AGASEC 04/29 /2007
 
xcel energy 5_2A GASEC04/29/2007
xcel energy  5_2A GASEC04/29/2007xcel energy  5_2A GASEC04/29/2007
xcel energy 5_2A GASEC04/29/2007
 
XEL_Fixed_Income_Presentation_February2008
XEL_Fixed_Income_Presentation_February2008XEL_Fixed_Income_Presentation_February2008
XEL_Fixed_Income_Presentation_February2008
 
xcel energy 4_10MinneapolisInvestorMtgSECApril2007
xcel energy  4_10MinneapolisInvestorMtgSECApril2007xcel energy  4_10MinneapolisInvestorMtgSECApril2007
xcel energy 4_10MinneapolisInvestorMtgSECApril2007
 
xcel energy 4_10MinneapolisInvestorMtgSECApril2007
xcel energy  4_10MinneapolisInvestorMtgSECApril2007xcel energy  4_10MinneapolisInvestorMtgSECApril2007
xcel energy 4_10MinneapolisInvestorMtgSECApril2007
 
xcel energy Lehman_Sept_2008-SEC
xcel energy  Lehman_Sept_2008-SECxcel energy  Lehman_Sept_2008-SEC
xcel energy Lehman_Sept_2008-SEC
 
xcel energy Lehman_Sept_2008-SEC
xcel energy  Lehman_Sept_2008-SECxcel energy  Lehman_Sept_2008-SEC
xcel energy Lehman_Sept_2008-SEC
 
xcel energy ML_Sept_2008
xcel energy  ML_Sept_2008xcel energy  ML_Sept_2008
xcel energy ML_Sept_2008
 
xcel energy ML_Sept_2008
xcel energy  ML_Sept_2008xcel energy  ML_Sept_2008
xcel energy ML_Sept_2008
 
xcel energy 09/30/08_Texas
xcel energy  09/30/08_Texasxcel energy  09/30/08_Texas
xcel energy 09/30/08_Texas
 
09/30/08_Texas
09/30/08_Texas09/30/08_Texas
09/30/08_Texas
 
xcel energy AGA_Meeting_10-2-08
xcel energy  AGA_Meeting_10-2-08xcel energy  AGA_Meeting_10-2-08
xcel energy AGA_Meeting_10-2-08
 
xcel energy AGA_Meeting_10-2-08
xcel energy  AGA_Meeting_10-2-08xcel energy  AGA_Meeting_10-2-08
xcel energy AGA_Meeting_10-2-08
 

More from finance26

xcel energy merrill_09/16//03
xcel energy  merrill_09/16//03xcel energy  merrill_09/16//03
xcel energy merrill_09/16//03finance26
 
xcel energy merrill_09/16/03
xcel energy  merrill_09/16/03xcel energy  merrill_09/16/03
xcel energy merrill_09/16/03finance26
 
xcel energy merrill_09/16/03
xcel energy  merrill_09/16/03xcel energy  merrill_09/16/03
xcel energy merrill_09/16/03finance26
 
xcel energy BofA_09/16/03
xcel energy  BofA_09/16/03xcel energy  BofA_09/16/03
xcel energy BofA_09/16/03finance26
 
xcel energy BofA_09/16/03
xcel energy  BofA_09/16/03xcel energy  BofA_09/16/03
xcel energy BofA_09/16/03finance26
 
xcel energy BofA_09/16/03
xcel energy  BofA_09/16/03xcel energy  BofA_09/16/03
xcel energy BofA_09/16/03finance26
 

More from finance26 (20)

xcel energy merrill_09/16//03
xcel energy  merrill_09/16//03xcel energy  merrill_09/16//03
xcel energy merrill_09/16//03
 
xcel energy merrill_09/16/03
xcel energy  merrill_09/16/03xcel energy  merrill_09/16/03
xcel energy merrill_09/16/03
 
xcel energy merrill_09/16/03
xcel energy  merrill_09/16/03xcel energy  merrill_09/16/03
xcel energy merrill_09/16/03
 
xcel energy BofA_09/16/03
xcel energy  BofA_09/16/03xcel energy  BofA_09/16/03
xcel energy BofA_09/16/03
 
xcel energy BofA_09/16/03
xcel energy  BofA_09/16/03xcel energy  BofA_09/16/03
xcel energy BofA_09/16/03
 
xcel energy BofA_09/16/03
xcel energy  BofA_09/16/03xcel energy  BofA_09/16/03
xcel energy BofA_09/16/03
 
xel_102303b
xel_102303bxel_102303b
xel_102303b
 
xel_102303b
xel_102303bxel_102303b
xel_102303b
 
xel_102303b
xel_102303bxel_102303b
xel_102303b
 
xel_111403
xel_111403xel_111403
xel_111403
 
xel_111403
xel_111403xel_111403
xel_111403
 
xel_111403
xel_111403xel_111403
xel_111403
 
xel_021104
xel_021104xel_021104
xel_021104
 
xel_021104
xel_021104xel_021104
xel_021104
 
xel_072804
xel_072804xel_072804
xel_072804
 
xel_090804
xel_090804xel_090804
xel_090804
 
xel_092404
xel_092404xel_092404
xel_092404
 
xel_092404
xel_092404xel_092404
xel_092404
 
xel_102204
xel_102204xel_102204
xel_102204
 
EEI_1004
EEI_1004EEI_1004
EEI_1004
 

Recently uploaded

Vip B Aizawl Call Girls #9907093804 Contact Number Escorts Service Aizawl
Vip B Aizawl Call Girls #9907093804 Contact Number Escorts Service AizawlVip B Aizawl Call Girls #9907093804 Contact Number Escorts Service Aizawl
Vip B Aizawl Call Girls #9907093804 Contact Number Escorts Service Aizawlmakika9823
 
Russian Call Girls In Gtb Nagar (Delhi) 9711199012 💋✔💕😘 Naughty Call Girls Se...
Russian Call Girls In Gtb Nagar (Delhi) 9711199012 💋✔💕😘 Naughty Call Girls Se...Russian Call Girls In Gtb Nagar (Delhi) 9711199012 💋✔💕😘 Naughty Call Girls Se...
Russian Call Girls In Gtb Nagar (Delhi) 9711199012 💋✔💕😘 Naughty Call Girls Se...shivangimorya083
 
00_Main ppt_MeetupDORA&CyberSecurity.pptx
00_Main ppt_MeetupDORA&CyberSecurity.pptx00_Main ppt_MeetupDORA&CyberSecurity.pptx
00_Main ppt_MeetupDORA&CyberSecurity.pptxFinTech Belgium
 
Call Girls Service Nagpur Maya Call 7001035870 Meet With Nagpur Escorts
Call Girls Service Nagpur Maya Call 7001035870 Meet With Nagpur EscortsCall Girls Service Nagpur Maya Call 7001035870 Meet With Nagpur Escorts
Call Girls Service Nagpur Maya Call 7001035870 Meet With Nagpur Escortsranjana rawat
 
OAT_RI_Ep19 WeighingTheRisks_Apr24_TheYellowMetal.pptx
OAT_RI_Ep19 WeighingTheRisks_Apr24_TheYellowMetal.pptxOAT_RI_Ep19 WeighingTheRisks_Apr24_TheYellowMetal.pptx
OAT_RI_Ep19 WeighingTheRisks_Apr24_TheYellowMetal.pptxhiddenlevers
 
The Economic History of the U.S. Lecture 19.pdf
The Economic History of the U.S. Lecture 19.pdfThe Economic History of the U.S. Lecture 19.pdf
The Economic History of the U.S. Lecture 19.pdfGale Pooley
 
The Economic History of the U.S. Lecture 20.pdf
The Economic History of the U.S. Lecture 20.pdfThe Economic History of the U.S. Lecture 20.pdf
The Economic History of the U.S. Lecture 20.pdfGale Pooley
 
Solution Manual for Financial Accounting, 11th Edition by Robert Libby, Patri...
Solution Manual for Financial Accounting, 11th Edition by Robert Libby, Patri...Solution Manual for Financial Accounting, 11th Edition by Robert Libby, Patri...
Solution Manual for Financial Accounting, 11th Edition by Robert Libby, Patri...ssifa0344
 
The Economic History of the U.S. Lecture 18.pdf
The Economic History of the U.S. Lecture 18.pdfThe Economic History of the U.S. Lecture 18.pdf
The Economic History of the U.S. Lecture 18.pdfGale Pooley
 
Dharavi Russian callg Girls, { 09892124323 } || Call Girl In Mumbai ...
Dharavi Russian callg Girls, { 09892124323 } || Call Girl In Mumbai ...Dharavi Russian callg Girls, { 09892124323 } || Call Girl In Mumbai ...
Dharavi Russian callg Girls, { 09892124323 } || Call Girl In Mumbai ...Pooja Nehwal
 
20240417-Calibre-April-2024-Investor-Presentation.pdf
20240417-Calibre-April-2024-Investor-Presentation.pdf20240417-Calibre-April-2024-Investor-Presentation.pdf
20240417-Calibre-April-2024-Investor-Presentation.pdfAdnet Communications
 
Log your LOA pain with Pension Lab's brilliant campaign
Log your LOA pain with Pension Lab's brilliant campaignLog your LOA pain with Pension Lab's brilliant campaign
Log your LOA pain with Pension Lab's brilliant campaignHenry Tapper
 
Dividend Policy and Dividend Decision Theories.pptx
Dividend Policy and Dividend Decision Theories.pptxDividend Policy and Dividend Decision Theories.pptx
Dividend Policy and Dividend Decision Theories.pptxanshikagoel52
 
Bladex Earnings Call Presentation 1Q2024
Bladex Earnings Call Presentation 1Q2024Bladex Earnings Call Presentation 1Q2024
Bladex Earnings Call Presentation 1Q2024Bladex
 
Monthly Market Risk Update: April 2024 [SlideShare]
Monthly Market Risk Update: April 2024 [SlideShare]Monthly Market Risk Update: April 2024 [SlideShare]
Monthly Market Risk Update: April 2024 [SlideShare]Commonwealth
 
VVIP Pune Call Girls Katraj (7001035870) Pune Escorts Nearby with Complete Sa...
VVIP Pune Call Girls Katraj (7001035870) Pune Escorts Nearby with Complete Sa...VVIP Pune Call Girls Katraj (7001035870) Pune Escorts Nearby with Complete Sa...
VVIP Pune Call Girls Katraj (7001035870) Pune Escorts Nearby with Complete Sa...Call Girls in Nagpur High Profile
 
Lundin Gold April 2024 Corporate Presentation v4.pdf
Lundin Gold April 2024 Corporate Presentation v4.pdfLundin Gold April 2024 Corporate Presentation v4.pdf
Lundin Gold April 2024 Corporate Presentation v4.pdfAdnet Communications
 
VIP Call Girls Service Dilsukhnagar Hyderabad Call +91-8250192130
VIP Call Girls Service Dilsukhnagar Hyderabad Call +91-8250192130VIP Call Girls Service Dilsukhnagar Hyderabad Call +91-8250192130
VIP Call Girls Service Dilsukhnagar Hyderabad Call +91-8250192130Suhani Kapoor
 
06_Joeri Van Speybroek_Dell_MeetupDora&Cybersecurity.pdf
06_Joeri Van Speybroek_Dell_MeetupDora&Cybersecurity.pdf06_Joeri Van Speybroek_Dell_MeetupDora&Cybersecurity.pdf
06_Joeri Van Speybroek_Dell_MeetupDora&Cybersecurity.pdfFinTech Belgium
 

Recently uploaded (20)

Vip B Aizawl Call Girls #9907093804 Contact Number Escorts Service Aizawl
Vip B Aizawl Call Girls #9907093804 Contact Number Escorts Service AizawlVip B Aizawl Call Girls #9907093804 Contact Number Escorts Service Aizawl
Vip B Aizawl Call Girls #9907093804 Contact Number Escorts Service Aizawl
 
Russian Call Girls In Gtb Nagar (Delhi) 9711199012 💋✔💕😘 Naughty Call Girls Se...
Russian Call Girls In Gtb Nagar (Delhi) 9711199012 💋✔💕😘 Naughty Call Girls Se...Russian Call Girls In Gtb Nagar (Delhi) 9711199012 💋✔💕😘 Naughty Call Girls Se...
Russian Call Girls In Gtb Nagar (Delhi) 9711199012 💋✔💕😘 Naughty Call Girls Se...
 
00_Main ppt_MeetupDORA&CyberSecurity.pptx
00_Main ppt_MeetupDORA&CyberSecurity.pptx00_Main ppt_MeetupDORA&CyberSecurity.pptx
00_Main ppt_MeetupDORA&CyberSecurity.pptx
 
Call Girls Service Nagpur Maya Call 7001035870 Meet With Nagpur Escorts
Call Girls Service Nagpur Maya Call 7001035870 Meet With Nagpur EscortsCall Girls Service Nagpur Maya Call 7001035870 Meet With Nagpur Escorts
Call Girls Service Nagpur Maya Call 7001035870 Meet With Nagpur Escorts
 
OAT_RI_Ep19 WeighingTheRisks_Apr24_TheYellowMetal.pptx
OAT_RI_Ep19 WeighingTheRisks_Apr24_TheYellowMetal.pptxOAT_RI_Ep19 WeighingTheRisks_Apr24_TheYellowMetal.pptx
OAT_RI_Ep19 WeighingTheRisks_Apr24_TheYellowMetal.pptx
 
The Economic History of the U.S. Lecture 19.pdf
The Economic History of the U.S. Lecture 19.pdfThe Economic History of the U.S. Lecture 19.pdf
The Economic History of the U.S. Lecture 19.pdf
 
The Economic History of the U.S. Lecture 20.pdf
The Economic History of the U.S. Lecture 20.pdfThe Economic History of the U.S. Lecture 20.pdf
The Economic History of the U.S. Lecture 20.pdf
 
Solution Manual for Financial Accounting, 11th Edition by Robert Libby, Patri...
Solution Manual for Financial Accounting, 11th Edition by Robert Libby, Patri...Solution Manual for Financial Accounting, 11th Edition by Robert Libby, Patri...
Solution Manual for Financial Accounting, 11th Edition by Robert Libby, Patri...
 
The Economic History of the U.S. Lecture 18.pdf
The Economic History of the U.S. Lecture 18.pdfThe Economic History of the U.S. Lecture 18.pdf
The Economic History of the U.S. Lecture 18.pdf
 
Dharavi Russian callg Girls, { 09892124323 } || Call Girl In Mumbai ...
Dharavi Russian callg Girls, { 09892124323 } || Call Girl In Mumbai ...Dharavi Russian callg Girls, { 09892124323 } || Call Girl In Mumbai ...
Dharavi Russian callg Girls, { 09892124323 } || Call Girl In Mumbai ...
 
20240417-Calibre-April-2024-Investor-Presentation.pdf
20240417-Calibre-April-2024-Investor-Presentation.pdf20240417-Calibre-April-2024-Investor-Presentation.pdf
20240417-Calibre-April-2024-Investor-Presentation.pdf
 
Log your LOA pain with Pension Lab's brilliant campaign
Log your LOA pain with Pension Lab's brilliant campaignLog your LOA pain with Pension Lab's brilliant campaign
Log your LOA pain with Pension Lab's brilliant campaign
 
Dividend Policy and Dividend Decision Theories.pptx
Dividend Policy and Dividend Decision Theories.pptxDividend Policy and Dividend Decision Theories.pptx
Dividend Policy and Dividend Decision Theories.pptx
 
Bladex Earnings Call Presentation 1Q2024
Bladex Earnings Call Presentation 1Q2024Bladex Earnings Call Presentation 1Q2024
Bladex Earnings Call Presentation 1Q2024
 
Monthly Market Risk Update: April 2024 [SlideShare]
Monthly Market Risk Update: April 2024 [SlideShare]Monthly Market Risk Update: April 2024 [SlideShare]
Monthly Market Risk Update: April 2024 [SlideShare]
 
VVIP Pune Call Girls Katraj (7001035870) Pune Escorts Nearby with Complete Sa...
VVIP Pune Call Girls Katraj (7001035870) Pune Escorts Nearby with Complete Sa...VVIP Pune Call Girls Katraj (7001035870) Pune Escorts Nearby with Complete Sa...
VVIP Pune Call Girls Katraj (7001035870) Pune Escorts Nearby with Complete Sa...
 
Lundin Gold April 2024 Corporate Presentation v4.pdf
Lundin Gold April 2024 Corporate Presentation v4.pdfLundin Gold April 2024 Corporate Presentation v4.pdf
Lundin Gold April 2024 Corporate Presentation v4.pdf
 
VIP Call Girls Service Dilsukhnagar Hyderabad Call +91-8250192130
VIP Call Girls Service Dilsukhnagar Hyderabad Call +91-8250192130VIP Call Girls Service Dilsukhnagar Hyderabad Call +91-8250192130
VIP Call Girls Service Dilsukhnagar Hyderabad Call +91-8250192130
 
Commercial Bank Economic Capsule - April 2024
Commercial Bank Economic Capsule - April 2024Commercial Bank Economic Capsule - April 2024
Commercial Bank Economic Capsule - April 2024
 
06_Joeri Van Speybroek_Dell_MeetupDora&Cybersecurity.pdf
06_Joeri Van Speybroek_Dell_MeetupDora&Cybersecurity.pdf06_Joeri Van Speybroek_Dell_MeetupDora&Cybersecurity.pdf
06_Joeri Van Speybroek_Dell_MeetupDora&Cybersecurity.pdf
 

xcel energy 8_16_2007KohlerPresentation8172007SEC

  • 1. Delivering on Expectations Kohler, Wisconsin August 17, 2007 Xcel Energy Inc. 414 Nicollet Mall Minneapolis, MN 55401 www.xcelenergy.com
  • 3. Safe Harbor This material includes forward-looking statements that are subject to certain risks, uncertainties and assumptions. Such forward-looking statements include projected earnings, cash flows, capital expenditures and other statements and are identified in this document by the words “anticipate,” “estimate,” “expect,” “projected,” “objective,” “outlook,” “possible,” “potential” and similar expressions. Actual results may vary materially. Factors that could cause actual results to differ materially include, but are not limited to: general economic conditions, including the availability of credit, actions of rating agencies and their impact on capital expenditures; business conditions in the energy industry; competitive factors; unusual weather; effects of geopolitical events, including war and acts of terrorism; changes in federal or state legislation; regulation; costs and other effects of legal administrative proceedings, settlements, investigations and claims including litigation related to company-owned life insurance (COLI); actions of accounting regulatory bodies; the higher degree of risk associated with Xcel Energy’s nonregulated businesses compared with Xcel Energy’s regulated business; and other risk factors listed from time to time by Xcel Energy in reports filed with the SEC, including Exhibit 99.01 to Xcel Energy’s report on Form 10-K for year 2006.
  • 4. Value Proposition • Low risk, fully regulated and integrated utility • Constructive regulatory environment with enhanced recovery of major capital projects • Pipeline of investment opportunities • Environmental leader, well-positioned for changing rules Attractive Total Return Sustainable 5% – 7% earnings per share growth ~ 4.5% Dividend yield Dividend growth of 2% – 4% per year
  • 5. Delivering on Expectations 2007 Accomplishments • Positive resolution of the COLI program • Completed the upgrade of the King plant • Signed 100-MW wind development project • Filed Certificate of Need for CapX 2020 • Constructive resolutions of rate cases in Colorado, North Dakota and Texas • Filed rate cases in Wisconsin and New Mexico • Increased dividend 3.4% • Positioned to deliver 2007 earnings from continuing operations at the high-end or potentially exceeding guidance range
  • 6. Delivering on Expectations Strong Construction Management • Minnesota Emissions Reduction Project – Approximately 75% of capital spent – King upgrade completed on schedule – Project is within 5% of original budget • Comanche 3 – Approximately 45% of capital spent – Project is on schedule – Project is on budget – Estimated plant cost is approximately $1,400/kw – Estimated all-in cost is approximately $1,800/kw
  • 7. Capital Investment Opportunities Capital Expenditures by Function (Dollars in millions) 1,900 1,900 1,850 1,700 1,700 2007 2008 2009 2010 2011 Elec Gen Elec Tran Elec Dist Gas Nuclear Fuel Common/Other
  • 8. Transmission Expansion - CapX 2020 North Dakota Minnesota Group I ~ ~ Total Cost $1.4 - 1.7 Billion ~ ~ Wisconsin Xcel Share $800-900 Million Certificate of Need Filed In Service in 2014 Post Group I South Dakota In Service 2014 – 2020 Iowa Group I Group II
  • 9. CapX 2020 Permitting Timeline 2007 2008 2009 2010 MN Certificate of Need – 345kV Projects MN Certificate of Need – 345kV Projects Analyses of Routes Bemidji 230kV Project Need and Route Bemidji 230kV Project Need and Route WI, ND, SD: Need, Route Permits WI, ND, SD: Need, Route Permits MN Route Permits MN Route Permits Federal Environmental Review Federal Environmental Review
  • 10. Nuclear Life Extension and Uprate • Monticello – Life extension approximately $150 million – Power uprate approximately $130 million ($1,850/kw) • 15 MW new capacity in 2009 • 56 MW new capacity in 2011 • Prairie Island – Life extension approximately $400 million • Includes Unit 2 steam generator replacement – Power uprate approximately $320 million ($1,900/kw) • 82 MW new capacity on Unit 1 in 2012 • 82 MW new capacity on Unit 2 in 2015
  • 11. Nuclear Plant Life Extension • Federal License Renewal Process – Complete for Monticello – Plan to submit Prairie Island applications in 2008 – Expect Prairie Island renewed licenses in 2010 • State Certificate of Need for Spent Fuel Storage – Complete for Monticello – Plan to submit Prairie Island application in December 2007 with completion expected June 2010
  • 12. Enhanced Recovery on Capital Investment Capital Expenditures ($Millions) 2,000 1,600 1,200 800 400 0 2007 2008 2009 2010 2011 Depreciation Traditional Enhanced Recovery
  • 13. Delivering on Rate Base Growth Dollars in Billions $15.5 $15.1 CAGR = 6% $14.4 $13.7 $12.8 $11.7 2006A 2007 2008 2009 2010 2011
  • 14. Delivering on EPS Growth Objective 2007 Continuing Operations EPS Guidance $1.30-$1.40 Guidance $1.30 $1.15 Range 13% >7% 2005 Actual 2006 Actual 2007 Guidance Utility Operations $1.45 – $1.55 Holding Company & Other (0.15) Continuing Operations $1.30 – $1.40* Disc Ops $(0.10) - $(0.08) Total Xcel Energy $1.20 - $1.32 * Xcel Energy is positioned to deliver 2007 earnings from continuing operations at the high-end or potentially exceeding guidance range
  • 15. Delivering on Dividend Growth Objective Annualized dividend per share 2004-2007 CAGR = 3.5% $0.92 $0.89 $0.86 $0.83 $0.75 2003 2004 2005 2006 2007
  • 16. Delivering on Expectations Additional Catalysts • Colorado rate case to be filed in fall 2007 – Based on forecast test year • Resource plans to be filed – Colorado: October 2007 – Minnesota: December 2007 • Additional capital investment opportunities • Actions to improve earned ROE in jurisdictions where we aren’t earning our authorized return
  • 18. Northern States Power – Minnesota 2006 Financials ($Millions) North Dakota Minnesota Earnings Cont. Op $272 Assets $9,079 GAAP ROE 11.2% Equity Ratio 52.3% 2006 Owned Generation (MW) (NSP System) Coal 3,590 South Dakota Nuclear 1,817 Gas 2,335 Renewable 399 2006 Customers Electric 1,360,000 2006 Retail Sales Gas 465,000 (Thousands of Mwh / MMBtu) Electric 35,923 Gas 70,497
  • 19. NSP-M 2006 Rate Base and ROE Dollars in Millions W/N Rate Base Earned ROE Minnesota Electric $3,599 10.3% Minnesota Gas 441 6.1 North Dakota Electric 188 8.9 North Dakota Gas 44 7.5 South Dakota Electric 232 NR Wholesale 27 NR Total Rate Base $4,531 Regulated Equity Ratio = 51.6% NR = Not Reported
  • 20. NSP-M Capital Expenditures Dollars in millions $1,090 $1,050 $1,000 $995 $995 2007 2008 2009 2010 2011
  • 21. Minnesota Recovery Mechanisms • Forward test year with interim rates • MERP rider • Transmission rider • Conservation improvement program rider • Mercury reduction & environmental improvement rider • RDF rider • State energy policy rider • Fuel clause adjustment • Purchased gas adjustment
  • 22. Dakota’s Recovery Mechanisms • Forward test year with interim rates (ND) • Historical test year (SD) • Environmental rider (ND & SD) • Transmission rider (ND & SD) • Fuel clause adjustment (ND & SD) • Full decoupling on retail natural gas (ND)
  • 23. Public Service Company of Colorado 2006 Financials ($Millions) Colorado Earnings Cont. Op $221 Assets $8,363 GAAP ROE 7.8% Equity Ratio 56.5% 2006 Owned Generation (MW) Coal 2,656 Gas 1,026 Wind 54 Renewable 358 2006 Customers 2006 Retail Sales Electric 1,320,000 (Thousands of Mwh / MMBtu) Gas 1,250,000 Electric 27,198 Gas 125,123
  • 24. PSCo 2006 Rate Base and ROE Dollars in Millions W/N Rate Base Earned ROE Colorado Electric $3,292 7.7% Colorado Gas 1,106 7.8 Wholesale 418 NR Total Rate Base $4,816 Regulated Equity Ratio = 60.3% NR = Not Reported
  • 25. PSCo Capital Expenditures Dollars in millions $690 $635 $580 $515 $490 2007 2008 2009 2010 2011
  • 26. Colorado Recovery Mechanisms • Ability to file either historical or forecast test years • Purchased capacity cost adjustment • Comanche 3 – forward CWIP via general rate case • Transmission rider • Renewable energy rider • IGCC rider (if there is an approved project) • Demand side management cost adjustment rider • Air quality improvement rider • Energy cost adjustment • Gas cost adjustment • Partial decoupling on retail natural gas
  • 27. Northern States Power – Wisconsin Upper Michigan 2006 Financials ($Millions) Earnings Cont. Op $44 Assets $1,251 GAAP ROE 9.7% Equity Ratio 57.1% 2006 Owned Generation (MW) Included in NSP System Wisconsin 2006 Retail Sales (Thousands of Mwh / MMBtu) Electric 6,173 2006 Customers Gas 14,568 Electric 245,000 Gas 100,000
  • 28. NSP-W 2006 Rate Base and ROE Dollars in Millions W/N Rate Base Earned ROE Wisconsin Electric $556 10.7% Wisconsin Gas 77 4.6 Wholesale 29 4.4 Michigan Electric 14 8.4 Michigan Gas 3 2.2 Total Rate Base $679 Regulated Equity Ratio = 56.1%
  • 29. NSP-W Capital Expenditures Dollars in millions $85 $75 $65 $60 $55 2007 2008 2009 2010 2011
  • 30. Wisconsin Recovery Mechanisms • Forward test year • Ability to file for prospective fuel & purchase energy adjustments (Wisconsin) • Fuel clause adjustment – wholesale • Purchased gas adjustment • Fuel clause factor (Michigan retail)
  • 31. Southwestern Public Service New Mexico 2006 Financials ($Millions) Earnings Cont. Op $48 Assets $2,619 GAAP ROE 5.9% Equity Ratio 49.1% 2006 Owned Generation (MW) Coal 2,073 Texas Gas 2,078 2006 Retail Sales 2006 Customers (Thousands of Mwh / MMBtu) Electric 385,000 Electric 17,291
  • 32. SPS 2006 Rate Base and ROE Dollars in Millions W/N Rate Base Earned ROE Texas Electric $977 NR New Mexico Electric 311 6.2% Wholesale 404 NR Total Rate Base $1,692 Regulated Equity Ratio = 50.1% NR = Not Reported
  • 33. SPS Capital Expenditures Dollars in millions $150 $140 $130 $130 $120 2007 2008 2009 2010 2011
  • 34. SPS Recovery Mechanisms • Historical test year (Texas & New Mexico) • Texas fixed fuel factor recovery • New Mexico fuel clause adjustment • Ability to establish interim rates through rate case to recover capacity costs associated the Lea Power contract (Texas)
  • 35. Key Take-Aways • Strong regulatory recovery mechanisms – Forward test years – Riders for major capital projects – Fuel clause and PGA recovery • Opportunities exist to improve earned ROE in jurisdictions where we aren’t earning our authorized return • Significant capital investment opportunities exist • We are disciplined portfolio managers • Capital investment is driven by customer requirements and economic signals
  • 36. Value Proposition • Low risk, fully regulated and integrated utility • Constructive regulatory environment with enhanced recovery of major capital projects • Pipeline of investment opportunities • Environmental leader, well-positioned for changing rules Attractive Total Return Sustainable 5% – 7% earnings per share growth ~ 4.5% Dividend yield Dividend growth of 2% – 4% per year
  • 37. Upcoming Analyst Meeting December 5th Date: Location: New York Marriott Marquis Times Square Details to follow in the coming weeks
  • 39. Profile NSP- Minnesota Traditional Regulation NSP- Wisconsin 47% Net Income 7% Net Income Operate in 8 States Combination Utility: • Electric 85% net income • Gas 15% net income PSCo 38% Net Income Customers: • 3.3 million electric • 1.8 million gas 2006 Financial Stats: • NI Cont Op = $548 million • Assets = $22 billion SPS • Equity Ratio = 43% 8% Net Income • GAAP ROE = 10.1% 2006 EPS $1.30 continuing operations 2007 Dividend $0.92 per share annualized
  • 40. Xcel Energy Supply Sources 2006 2006 Owned Energy Supply Mix* Generating Facilities Gas & Oil Nuclear Unit Type Units MW 27% 12% Coal 35 8,182 Renewables 9% Natural Gas 58 4,987 Nuclear 3 1,668 Hydro 83 508 Oil 24 460 RDF 6 67 Coal ** Wind 37 27 52% Total 15,899 * Includes purchases ** Low-sulfur western coal Low-sulfur
  • 41. Delivering Competitively Priced Energy Summer 2006 EEI Typical Bills Cents per kWh (Retail) 21 18 15 12 9 7.79 6.64 7.01 6 3 0 C uis City ines City rillo aul ago ver kee nix n D C mi ton York o . L ake Mo as ma St. P hic en wau hoe gto Mia Bos ew St L es ns A s / C D i l P h in N al t pl h Ka M as D M S W
  • 42. Environmental Leadership • Number 1 utility wind provider — 1,300 MW on-line on-line — 2,800 MW projected by year-end 2007 year-end • Over 2,000 MW of conservation and DSM achieved • One of the largest U.S. solar photovoltaic projects • Evaluating an IGCC with sequestration • Reducing emissions and increasing efficiency — MERP — Comanche — Sherco Upgrade Project • Nuclear life extension and capacity increases • Member of Dow Jones Sustainability Index
  • 43. Constructive Regulation 2006 rate case outcomes Dollars in millions Dollar Increase Return on Equity Requested Granted Requested Granted Colorado Gas $34.5 $22.0 11.0% 10.5% Wisconsin Electric 53.1 43.4 11.9% 11.0% Wisconsin Gas 7.8 3.9 11.9% 11.0% Minnesota Electric 156 131/115* 11.0% 10.54% Colorado Electric 208 151 11.0% 10.5% * $131 million for 2006 reduced to $115 million in 2007 for large customer coming on-line January 1, 2007
  • 44. 2007 Rate Cases Dollars in millions Dollar Increase Return on Equity Requested Granted Requested Granted Colorado Gas $41.9 $32.3 11.0% 10.25% North Dakota Gas $2.8 $2.3 11.3% 10.75% Texas Electric $48 $23 11.6% NA
  • 45. Pending Rate Cases Dollars in millions Revenue Requested Interim Jurisdiction Request ROE Rate Decision Minnesota Gas $16.8 10.75% $15.9 Summer 2007 Wisconsin Electric 67.4 11.0% NA Winter 2007 Wisconsin Gas 5.3 11.0% NA Winter 2007 New Mexico Electric 17.3 11.0% NA Summer 2008 Future Rate Cases: * Colorado electric rate case filing planned for the fall of 2007 * Texas electric rate case filing planned for 2008
  • 46. Capital Expenditure Forecast Dollars in millions Denotes enhanced recovery process 2007 2008 2009 2010 2011 Base & Other Cap Ex $ 955 $ 950 $ 950 $1,000 $ 965 MERP 275 170 35 10 0 Comanche 3 345 275 55 15 0 MN Wind Transmission 150 20 50 15 0 CapX 2020 5 20 110 240 180 Sherco Upgrade 10 65 200 245 165 Wind Generation 50 155 0 0 0 BART Projects 0 5 40 65 40 Nuclear Fuel 90 160 145 105 165 Capacity & Life Ext 20 80 115 155 185 Total $1,900 $1,900 $1,700 $1,850 $1,700
  • 47. Capital Expenditures by Op Co Dollars in millions 1,900 1,900 1,850 1,700 1,700 2007 2008 2009 2010 2011 NSPM PSCO SPS NSPW
  • 48. Capital Expenditures by Op Co Dollars in millions 2007 2008 2009 2010 2011 NSP-MN 995 1,050 1,000 1,090 995 PSCo 690 635 515 580 490 SPS 140 130 130 120 150 NSP-WI 75 85 55 60 65 Total 1,900 1,900 1,700 1,850 1,700
  • 49. Capital Expenditures by Function Dollars in millions 2007 2008 2009 2010 2011 Elec Gen 837 874 624 683 658 Elec Tran 390 251 307 428 318 Elec Dist 317 318 325 329 298 Gas 117 141 165 139 121 Nuclear Fuel 87 161 147 105 165 Common/Other 152 155 132 167 140 Total 1,900 1,900 1,700 1,850 1,700
  • 50. Xcel Energy and Wind Potential Source: National Renewable Energy Laboratory Wind Density High Xcel Energy States Served Low
  • 51. Projected Wind Generation MW 6,000 2,800 1,300 2006 2007 2020
  • 52. Strong Operational Performance Nuclear Capacity Factors System Reliability (SAIDI) - Minutes 105 92.8 Good 92.3 99.5 91.2 90.4 81.4 79.2 Good 2003 2004 2005 2006 2003 2004 2005 2006 Residential Satisfaction OSHA Incident Rate Good 88% 85% 85% 85% 3.62 3.40 2.76 2.53 Good Good 2005 2006 2003 2004 2005 2006 2003 2004
  • 53. Senior Debt Ratings Secured Unsecured Fitch Moody’s S&P Fitch Moody’s S&P Moody’s Moody’s Holding Co. BBB+ Baa1 BBB- BBB- NSPM A+ A2 A- A A3 BBB- A- BBB- NSPW A+ A2 A- A A3 BBB A- PSCo A A3 A- A- Baa1 BBB- A- A- BBB- SPS BBB+ Baa1 BBB
  • 54. Debt Maturities Dollars in millions 1,200 Xcel 1,000 NSPM NSPW 800 PSCo 600 SPS 400 200 0 2007 2008 2009 2010 2011 2012 2013 2014 2015 PSCO Xcel Energy $100M due 3/1/07 @ 7.11% $230M due 11/1/07 @ 7.50%
  • 55. 2006 Rate Base and ROE W/N Dollars in Millions Rate Base Earned ROE Minnesota Electric $3,599 10.3% Minnesota Gas 441 6.1 North Dakota Electric 188 8.9 North Dakota Gas 44 7.5 South Dakota Electric 232 NR Colorado Electric 3,292 7.7 Colorado Gas 1,106 7.8 Wisconsin Electric 556 10.7 Wisconsin Gas 77 4.6 Texas Electric 977 NR New Mexico Electric 311 6.2 Wholesale 879 NR Total Rate Base $11,702 NR = Not Reported