WhiteWave Foods produces plant-based foods and organic dairy products. The document provides an analysis of WhiteWave, including its brands, financial performance, industry growth opportunities, and stock valuation. Key points are that WhiteWave has leading market shares in several categories, the organic and plant-based food industry is poised for high growth, and WhiteWave's stock is undervalued and expected to provide a 21.14% return.
An in-depth media analysis on the recent merger of Kraft and Heinz. Using publication and social media research, this presentation analyses sentiment and message pull.
Created with Kimberly Conquest and Mew Nanavaratorn.
An in-depth media analysis on the recent merger of Kraft and Heinz. Using publication and social media research, this presentation analyses sentiment and message pull.
Created with Kimberly Conquest and Mew Nanavaratorn.
This is the transcript of the investor call presentation given by Roddy Child-Villiers, head of Nestlé IR, followed by the Q+A session with analysts, on October 20 2011, and broadcast live via ir.nestle.com
The Downward Giants and Upward New Brands—the volatile food industry东明 马
Recently, many brands in food and beverage industry have published their 2016 financial results. It can be seen that the developments of several traditional giants are declining or slowing down in different degrees in global or Chinese markets, and even some firms have experienced that for four years in succession. Most of them blame "the slow-down economy and insufficient consumption demand" or "the challenging macroeconomic environment" for this downward tendency. While in view of global and Chinese markets, there are some new brands with surging growth rate despite of the existing obstacles. And more importantly, they are grabbing the market share against those big ones. Confronted with this contrast, there are a lot of questions: What is the fundamental problem, the downward market or the giants themselves? And how can the emerging brands make it in this hard time?
Based on the data of global F&B industry, this article would analyze the overall market situation, point out the essential reasons for giants' declination, and reveal the secrets of new food brands and emerging brands' growth. It also aims at seeking out a right direction and motivation for the F&B industry.
Outline:
1) The declination of F&B giants
2) The consumption demand is weakened, yes or no?
3) In recession, who is grabbing market shares?
4) Innovation—the way of building to last
Natural and Organic Foods and Beverages in the U.S., 4th EditionMarketResearch.com
An outline of the Natural and Organic Foods and Beverages in the U.S., 4th Edition report which examines sales and growth potential, identifying key issues and trends that will affect the marketplace through 2019. The report also analyzes and profiles major marketers and retailers, examines marketing and new product trends, and tabulates consumer attitudes and behaviors toward natural/organic foods and beverages and the corresponding retail shopping patterns. Numerous tables, charts, graphs, and illustrations highlight and reinforce key points.
This is an example of an investment memo for a consumer products company, Kraft Heinz. This does not constitute investment advice and is an outdated valuation. This should only serve educational purposes.
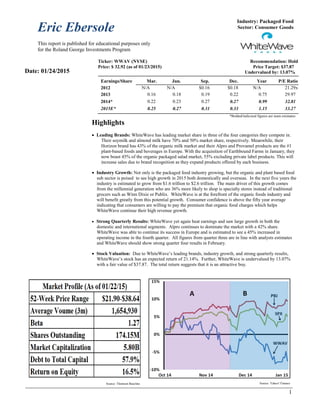
1. Eric Ebersole
This report is published for educational purposes only
for the Roland George Investments Program
1
Industry: Packaged Food
Sector: Consumer Goods
Ticker: WWAV (NYSE) Recommendation: Hold
Price: $ 32.92 (as of 01/23/2015) Price Target: $37.87
Undervalued by: 13.07%
Earnings/Share Mar. Jun. Sep. Dec. Year P/E Ratio
2012 N/A N/A $0.16 $0.18 N/A 21.29x
2013 0.16 0.18 0.19 0.22 0.75 29.97
2014* 0.22 0.23 0.27 0.27 0.99 32.81
2015E* 0.25 0.27 0.31 0.33 1.15 33.27
*Bolded/italicized figures are team estimates
Highlights
Leading Brands: WhiteWave has leading market share in three of the four categories they compete in.
Their soymilk and almond milk have 70% and 50% market share, respectively. Meanwhile, their
Horizon brand has 43% of the organic milk market and their Alpro and Provamel products are the #1
plant-based foods and beverages in Europe. With the acquisition of Earthbound Farms in January, they
now boast 45% of the organic packaged salad market, 55% excluding private label products. This will
increase sales due to brand recognition as they expand products offered by each business.
Industry Growth: Not only is the packaged food industry growing, but the organic and plant based food
sub sector is poised to see high growth in 2015 both domestically and overseas. In the next five years the
industry is estimated to grow from $1.6 trillion to $2.6 trillion. The main driver of this growth comes
from the millennial generation who are 36% more likely to shop is specialty stores instead of traditional
grocers such as Winn Dixie or Publix. WhiteWave is at the forefront of the organic foods industry and
will benefit greatly from this potential growth. Consumer confidence is above the fifty year average
indicating that consumers are willing to pay the premium that organic food charges which helps
WhiteWave continue their high revenue growth.
Strong Quarterly Results: WhiteWave yet again beat earnings and saw large growth in both the
domestic and international segments. Alpro continues to dominate the market with a 42% share.
WhiteWave was able to continue its success in Europe and is estimated to see a 45% increased in
operating income in the fourth quarter. All figures from quarter three are in line with analysts estimates
and WhiteWave should show strong quarter four results in February.
Stock Valuation: Due to WhiteWave’s leading brands, industry growth, and strong quarterly results,
WhiteWave’s stock has an expected return of 21.14%. Further, WhiteWave is undervalued by 13.07%
with a fair value of $37.87. The total return suggests that it is an attractive buy.
Source: Thomson Baseline
Date: 01/24/2015
Source: Yahoo! Finance
2. Stetson University Student Research
7/12/201615
2
Business Description
Company: WhiteWave operates in North America and Europe, specializing in plant- based
products, dairy products, coffee creamers and beverages, and fresh and frozen packaged produce.
Their plant-based line include soy, almond, and coconut products sold under through the “Silk”
and “So Delicious Dairy-Free” in North America and the “Alpro” and “Provamel” brands in
Europe. Their coffee creamer and iced coffee brands include International Delight Land O’ Lakes
Half & Half, as well as licensed rights to create creamers for brands such as Dunkin’ Donuts,
Cinnabon, York, and Coldstone Creamery. Their products are sold through grocery retailers and
foodservice distribution channels.
Products: Through owned brands and licensed brands, WhiteWave produces (% of all revenue,
FY 2013):
Premium Dairy (41%): Horizon Organic Milk and TruMoo Milk Boxes
Coffee Creamers and Beverages (36%): Land O’ Lakes Half & Half, International Delight
creamers and packages ice coffee, and Dunkin’ Donuts Creamers
Plant-Based Food and Beverages (23%): Silk, So Delicious Dairy Free, Alpro, Provamel,
and Earthbound Farms
The Revenue Breakdown has stayed nearly even over the past three years, but that will change as
So Delicious Dairy Free and Earthbound Farms are factored into the FY 2014 revenue breakdown.
These plant-based products have already shown significant top-line growth for WhiteWave.
Recent Performance
WhiteWave’s stock has seen a 10% increase over the last six months which outperformed the S&P
500 by 6%. The PowerShares Dynamic Food & Beverage ETF experienced 12% growth during
the same period showing that the packaged food industry is continuing to see growth each quarter.
WhiteWave’s stock price had a six month range of $32.42 - $38.64. At the end of 2014 the stock
gained 55.03%. WhiteWave beat earnings and net income for Q4 2014 marking 8 of the last 8
quarters experiencing figures that beat estimates.
Stage A: WhiteWave’s stock saw a gap in performance and a decrease in price in comparison due
to multiple factors over a one month span. First, reports were released showing data that the
organic milk and almond market were growing, but at slower rates than previously. While organic
milk is only 17%of sales and makes up 10% of EBIT there was a small effect on earnings and this
trend could continue. Investors are still hesitant about their joint venture into China, however, in
the quarterly report management has made progress and will look to report on the success in the
annual report and quarter four report in February. Lastly, the California drought continues to
remain a risk and caused investors to be unsure of the potential harm that could come from these
increased supply costs.
Stage B: From mid-November until January WhiteWave’s stock has experienced correlative
movement with both the S&P 500 and the PowerShares Dynamic Food & Beverage ETF. The
larger movements are a result of WhiteWave’s beta, 1.59. WhiteWave has a reputation of beating
earnings and should close the gap between both the S&P 500 and the industry in February as they
are reporting both fourth quarter earnings and their annual results.
Industry Analysis
In the Packaged Foods Industry, companies process and package various beverages, snacks, and
meals. The industry has a large group of companies, with several multinational conglomerates
producing a significant portion of revenues. These large companies include General Mills, Nestle,
Kraft, Dole Food Company, Campbell Soup Company, ConAgra and Oscar Meyer. Hundreds of
other companies occupy the space as well, many in the specialty foods category such as organic,
ethnic, and gourmet foods. The industry has seen a 10% growth historically and 18% last quarter.
According to Euromonitor International, the packaged food industry is worth as much as $1.6
trillion and is estimated to reach $2.6 trillion over the next five years.. As retailers continue to
build more supermarkets throughout developing nations and urbanization continues, the global
Brand Market Share Category Size
Horizon 43% $1.3 B
Silk 60% $1.1 B
Alpro 39% $1.2 B
Internation Delight 28% $1.7 B
Land O' Lakes 22% $793 M
Earthbound Organic 45% $1.2 B
Exhibit 1: Revenue Breakdown
Exhibit 2: 2013 Market Share
3. Stetson University Student Research
7/12/201615
3
demand for packaged food is predicted to stay strong. Growth opportunities for food producers lie
in organic foods, which have grown at a 10% rate while the total food industry has grown at only
3%. According to a recent study by Barkley, the millennial generation is 36% more likely to shop
at a specialty health food store, while they are 13% less likely to buy from traditional grocers. This
trend towards healthy food is propelling organic brands, both fresh and packaged. Consumer
confidence is finally above the fifty year average of 85.06, coming in at 86.4 for October. This
confidence will lead to higher spending on discretionary items such as natural foods.
Quarterly Performance
WhiteWave experienced yet another strong quarter consisting of high growth in revenue and an
earnings surprise of 3.15%. Within the North America segment sales grew 36% to $728 million.
Much of this came from acquisitions as organic growth only accounted for 10%. The segment
operating income grew 58% in the last year to $81 million. Plant-based food and beverages,
coffee creamers and beverages, premium dairy, and organic greens and produce grew 15%, 8%,
8%, and 14% respectively. Much of WhiteWave’s future success rests on their ability to gain
market share in Europe and continue the strong performance they have experienced in North
America. Net sales in the European segment saw a 24% increase while operating income grew
82%. This growth was driven primarily by the almond beverages and continued strong growth of
the soy beverages and plant-based creams. One of WhiteWaves main products, Alpro, continues
to hold the leading market position with a share of 42%. Management expects sales growth to be
in the low thirties on a percentage basis from continued growth across all business and the
inclusion of So Delicious. Management also estimates that organic growth will account for
approximately 11% of total yearly growth. Operating income estimates have been adjusted to
reflect and estimated 45% growth for the fourth quarter. Part of WhiteWave’s fourth quarter
success hinges on their ability to create a successful international joint venture in China. This
joint venture will cause earnings per share to decrease but if successful WhiteWave will see great
value through high growth and increase in profits. WhiteWave has already entered international
markets in Europe and has seen success so WhiteWave should see similar results in China. Kelly
Haecker, executive vice president noted in the conference call that WhiteWave “delivered another
quarter of strong top and bottom line results driven by growth across all of our platforms” and that
in the third quarter WhiteWave “continued to benefit from [its] increased scale and from past
capital investments and pricing actions that led to strong operational performance with significant
expansion, resulting in 42% earnings per share growth that exceed the high end of our guidance”.
Financial Analysis
Hain Celestial Group is the most comparable peer for WhiteWave, as they offer natural and
organic foods and beverages. In most cases, they are not directly competing against one another.
For future expected revenue and earnings, Hain Celestial Group is used to compare against
WhiteWave. For historical financial analysis WhiteWave was compared to information from both
the Industry and Hain Celestial Group.
Revenue and Earnings Growth
Revenue: According to Baseline, the 5-year compound annual revenue growth rate is 10% for the
industry. While WhiteWave was not a standalone company, they managed to grow their revenue
on average at more than twice that rate for the past six years. Their revenue will continue to
expand both organically and inorganically in fiscal year 2015 as they benefit from So Delicious
Dairy Free and Earthbound Farms increasing their top line by 21.6%. Their competitor Hain
Celestial Foods significant outgrew both the industry and WhiteWave. The top line expected
growth in 2015 for WhiteWave is 32.4% meanwhile Hain Celestial Group has revenue growth
expected at 35.2% for this year. This should not concern WhiteWave because most of Hain
Celestial Group’s growth will be from international brand growth, not domestic soy milk or
produce sales.
Earnings: By using various growth rates using measures such as earnings per share, revenue,
book value per share, and cash flow per share WhiteWave has estimated earnings growth of
23.77%. Analysts predict that earnings will grow 22.7% over the next quarter. On the other hand
Hain Celestial Group has an expected annual earnings growth of 20.50% over the next quarter and
Exhibit 3:
Packaged Food Industry Revenue
4. Stetson University Student Research
7/12/201615
4
14.10% for the full year. Over the last year WhiteWave had bottom line growth of over 58% while
Hain Celestial’s bottom line decreased.
Profitability
Profit Margin: The average profit margin of WhiteWave over the past six quarters is 4.09%,
whereas the average profit margin of Hain Celestial Group is 5.75%. This is surprising because the
gross margin for WhiteWave is significantly higher than Hain Celestial. The packaged food and
meats industry profit margin is 7.26%, while WhiteWave’s current net profit margin is 3.9%. The
lower profit margins can be attributed to the high interest expenses and SG&A expenses incurred
by WhiteWave as they break away from Dean Foods and develop their businesses. Being a
relatively young company, they have incurred higher expenses for advertising, developing their
supply chain, and building facilities. As the company grows, they expect to reduce their operating
expenses as a percentage of revenue, which will lead the way to higher profit margins. WhiteWave
has also taken losses on several divestures and disposals as their work to focus their business
model. As they mature as a company, WhiteWave should see their operating expenses go down
and they will reap the benefits of the high gross margin for dairy alternatives.
Gross Margin: The Gross Margin of WhiteWave foods have averaged 34.67% over the last six
quarters compared to Hain Celestial Group’s average gross margin of 25.25%. This may be
because Hain Celestial Group operates a larger group of smaller brands instead of small group of
larger brands. This gives WhiteWave the advantage of scale when sourcing ingredients and
processing the food. Hain Celestial is also in the packaged snack and cosmetics businesses, which
likely have different margins than dairy alternatives.
WhiteWave will likely see their gross margins not grow as much as they would like this year due
to the acquisition of Earthbound Foods. The packaged produce business has gross margins in the
high teens, far below the typical WhiteWave products. Luckily, as the operating expenses go
down, the profit margin will not be negatively affected by Earthbound Farms.
Return on Equity: WhiteWave’s current return on equity is 16.5%, up from 11.66% two years
ago. Return on equity will increase as the company matures and increases their profit margins.
They have already shown signs of reduced operating expenses due to consolidation of their
business units. The peer companies’ returns on equity are varied, but the matured companies have
much higher ones. Hain Celestial Group only have 11.6% return on equity, while Boulder Brands
has 5.8% return on equity and General Mills has a 26.5% return on equity. WhiteWave will need
to increase their margins in the coming years to be able to achieve their goals by acquiring higher-
margin businesses and lowering input costs and operating expenses.
Return on Assets: The return on assets for WhiteWave is 4.45%, which is below almost all of
their peers. Hain Celestial Group has a 5.26% return of assets, Boulder Brands has a 1.41% return
on assets, and General Mills has a 6.62% return on assets. By divesting low-growth assets,
WhiteWave should be able to increase their return on assets in the future.
Free Cash Flow
WhiteWave had a free cash flow of $53 million for fiscal year 2013. Their operating cash flow
was $185 million and $132 million was spent on capital expenditures. The free cash flow
increased in the first quarter of 2014 from incurring long term debt of $600 million to make a cash
purchase of Earthbound Farms. Free Cash Flow has been slowly decreasing in recent years due to
increased capital expenditures.
Debt
As of the end of quarter three, WhiteWave had approximately $1.5 billion loans outstanding from
long-term debt and capital lease obligations. The debt also will be increased due to financing the
So Delicious Dairy Free acquisition that closed in September. After closing that acquisitions, they
completed their first bond offering, raising $500 million to repay the loan facility, support growth
initiatives, and pursue acquisitions. The Senior Notes were prices at 5.375% and will mature in
October 2022.
Exhibit 4: Gross Margin
5. Stetson University Student Research
7/12/201615
5
Debt to Equity: WhiteWave’s debt to equity ratio is 0.69, while the average for the major
diversified foods industry is 0.89. Hain Celestial Group is well below both WhiteWave and the
industry with a debt to equity ratio of 0.53. WhiteWave has a higher debt to equity in order to
finance their acquisitions and organic growth initiatives. Their debt to equity ratio was
significantly lower before their acquisition of Earthbound Farms at the beginning of 2013. The
acquisition was funded by $615 million in new borrowings under their senior secured credit
facilities. Their debt increase also came with an increased interest expense of approximately $0.07
per share, causing the total interest expense to go from $0.10 to $0.17 per share.
Inventory Turnover
WhiteWave has an inventory turnover of 10.7, implying that they have 34 days of inventory
outstanding. Meanwhile, Hain Celestial Group has an inventory turnover ratio of 5.6, implying
that they have 66 days of inventory outstanding. This suggests WhiteWave is doing a much better
job at moving their products than Hain Celestial Group. On the other hand, it may mean that
WhiteWave is not capable of keeping up with high demand as their products begin to gain in
popularity.
Stock Price Volatility
WhiteWave Foods has a beta of 1.59, while General Mills has a beta of 0.63, Hain Celestial Group
has a beta of .1, and Boulder Brands has a beta of 1.32. General Mills and Hain Celestial must be
considered more stable and secure than Boulder and WhiteWave. General Mills and Hain Celestial
Group are near the middle-upper range of their 52-week highs, while Boulder Brands is near their
52-week low. This suggests prices have corrected for WhiteWave and Boulder Brands but not
General Mills and Hain Celestial Group.
Future Growth Rates
I considered six growth rates when determining the estimated future earnings growth for
WhiteWave. To find a reasonable long-term growth rate, I averaged the sustainable growth rate
(16.5%), book value per share growth rate (17.425%), earnings per share growth rate (18.737%),
revenue growth rate (40.861%), cash flow per share growth rate (20.035%) and the baseline five
year historical growth rate (17%). The resulting growth rate was 23.77%. These growth rates
yielded a standard deviation of 11.33% causing my pessimistic growth rate to be 12.44% and my
optimistic growth rate to be 35.1%, respectively.
Analyst Opinion
According to Bloomberg many analysts believe that WhiteWave is undervalued and that the stock
will rise to a value of $39.87. 15 analysts agree that WhiteWave is a buy, 5 believe it is a hold,
and only 1 thinks it is a sell. Yahoo Finance shows a rating of 1.9 where 1.0 is a strong buy and
5.0 is a sell. There is a consensus among companies such as Wells Fargo JP Morgan, and
Ameriprise that WhiteWave is poised to outperform the market and see similar results to last year.
Valuations
Growth Duration Model: The Growth Duration valuation, a relative P/E model, is often used to
compare a company with significant growth potential to its stable industry. It is a relevant model
for WhiteWave because they have experienced a higher volatility in growth compared with the
average firm in the Industry Peer Group. Using earnings growth rates between 12% and 35% in
the simulation, the median fair value for WhiteWave is estimated to be $$35.54, undervalued by
7.36%.
Franchise Value Model: The Sales Franchise valuation is often used when dealing with
companies that are able to produce significant franchise value, i.e. repeating its business model at
a lower cost. This model distinguishes between a company’s current return on equity and the
return that can be derived from future opportunities. The underlying assumption for WhiteWave
is that it will be able to improve its return on equity by releasing new products within the next year
while also increasing its international presence. Using its current return on equity of 16.5% and
Exhibit 5: Growth Rates
6. Stetson University Student Research
7/12/201615
6
the return on equity of 26.82%, the median fair value for WhiteWave is forecasted to be $40.19,
undervalued by 18.09%.
Average Fair Value: By averaging the valuation models used, the estimated fair value of
WhiteWave is $37.87, meaning it is undervalued by 13.07%.
7. Stetson University Student Research
7/12/201615
7
Table of Contents
Appendix 1: Income Statement 7
Appendix 2: Balance Sheet 8
Appendix 3: Statement of Cash Flow 9
Appendix 4: Franchise Value Model 10
Appendix 5: Holt’s Model 11
Appendix 6: Sources and Disclosures 12
13. 13
Reuters
Baseline
Bloomberg
Morningstar
Yahoo Finance
Google Finance
Company Website
Quarterly Report 2014 Q3
Disclosures:
Ownership and material conflicts of interest:
The author, or a member of their household, of this report does not hold a financial interest in the securities of this company.
The author, or a member of their household, of this report does not know of the existence of any conflicts of interest that might bias
the content or publication of this report.
Receipt of compensation:
Compensation of the author of this report is not based on investment banking revenue.
Position as a officer or director:
The author, or a member of their household, does not serve as an officer, director or advisory board member of the subject company.
Market making:
The author does not act as a market maker in the subject company’s securities.
Disclaimer:
The information set forth herein has been obtained or derived from sources generally available to the public and believed by the author to
be reliable, but the author does not make any representation or warranty, express or implied, as to its accuracy or completeness. The
information is not intended to be used as the basis of any investment decisions by any person or entity. This information does not constitute
investment advice, nor is it an offer or a solicitation of an offer to buy or sell any security.
Appendix 6: Sources