Download as PDF, PPTX

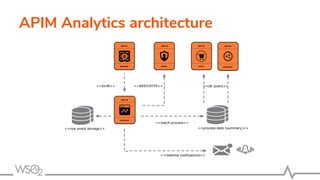

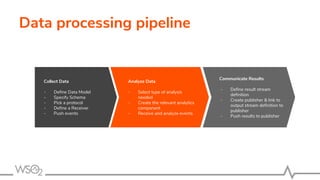
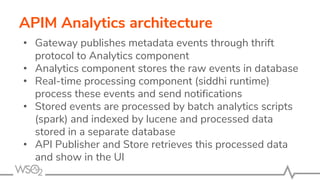
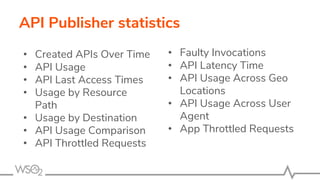
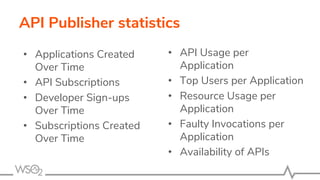

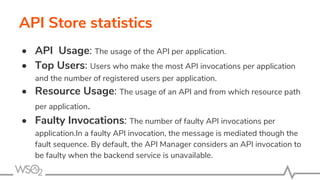
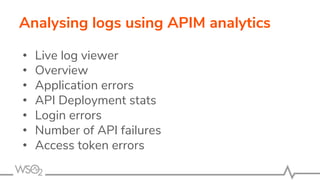

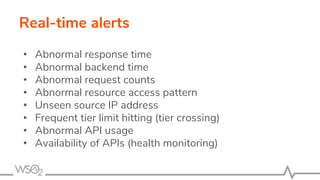
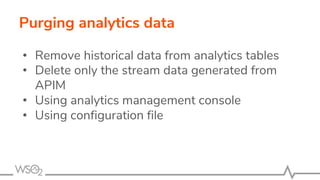

This document discusses WSO2 API Manager analytics capabilities including: 1. The APIM analytics architecture which collects data, analyzes it using WSO2 Data Analytics Server, and communicates results. 2. Analytics available at the API Publisher and Store for API usage, faults, latency, subscriptions, and more. 3. Log analysis capabilities for application errors, deployment stats, access tokens, and failures. 4. Real-time alerting for response times, backend times, request counts, resource access patterns, IPs, tier limits, and usage. 5. Purging historical analytics data from tables using the management console or configuration file.


![[WSO2Con EU 2018] WSO2 API Manager - Why, What, How, and What's Next](https://cdn.slidesharecdn.com/ss_thumbnails/eucon-2018-wso2apimanagerwhywhathowandwhatsnext-181114092949-thumbnail.jpg?width=640&height=640&fit=bounds)


![[WSO2 API Manager Community Call] Expose Services as Managed APIs](https://cdn.slidesharecdn.com/ss_thumbnails/exposeservicesasmanagedapi-communitycall-210825163143-thumbnail.jpg?width=640&height=640&fit=bounds)

![[Workshop] Managing the API lifecycle with Open Source Technologies](https://cdn.slidesharecdn.com/ss_thumbnails/workshopmanagingtheapilifecyclewithopensourcetechnologies1-190704142905-thumbnail.jpg?width=640&height=640&fit=bounds)


![[WSO2 Summit Sydney 2019] Building a Successful API Strategy from Scratch and...](https://cdn.slidesharecdn.com/ss_thumbnails/wso2summitsydney2019buildingasuccessfulapistrategyfromscratchandwinningit-190308025748-thumbnail.jpg?width=640&height=640&fit=bounds)


![Getting Started with Apache Spark: Big Data Made Simple [Free Meetup]](https://cdn.slidesharecdn.com/ss_thumbnails/apachesparkgettingstarted-260203175547-8361bcc3-thumbnail.jpg?width=640&height=640&fit=bounds)
