Download to read offline
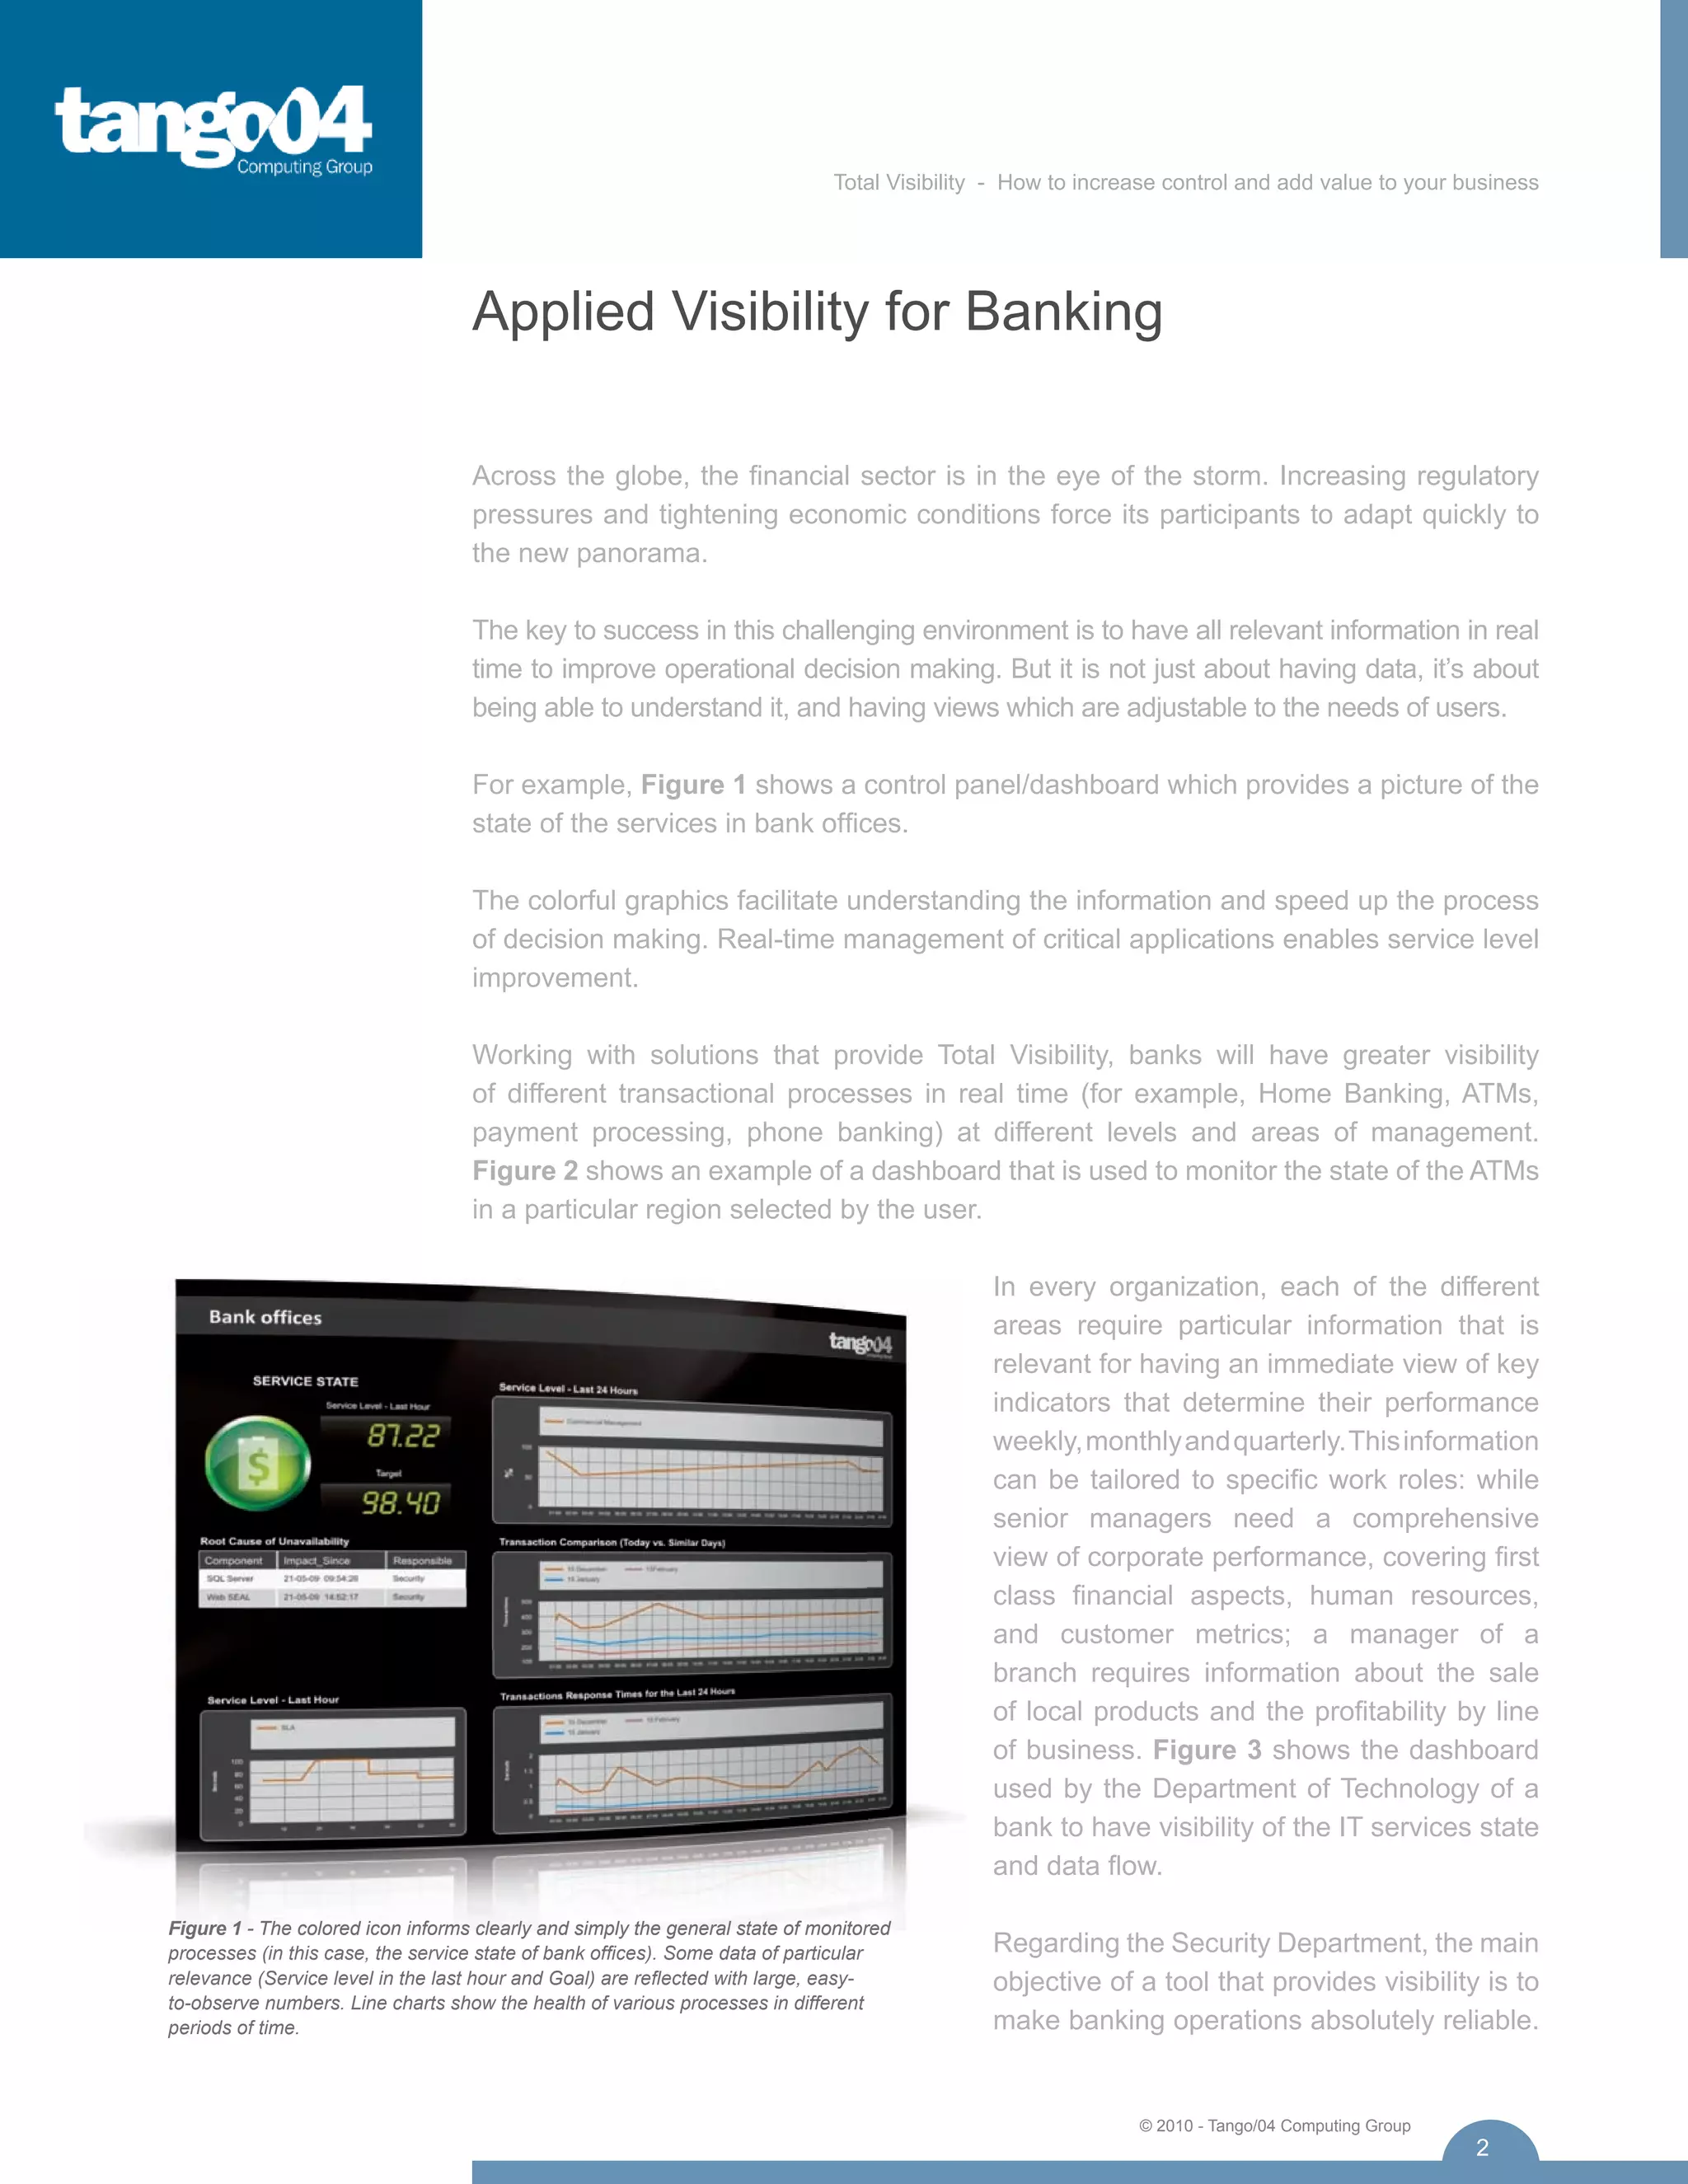
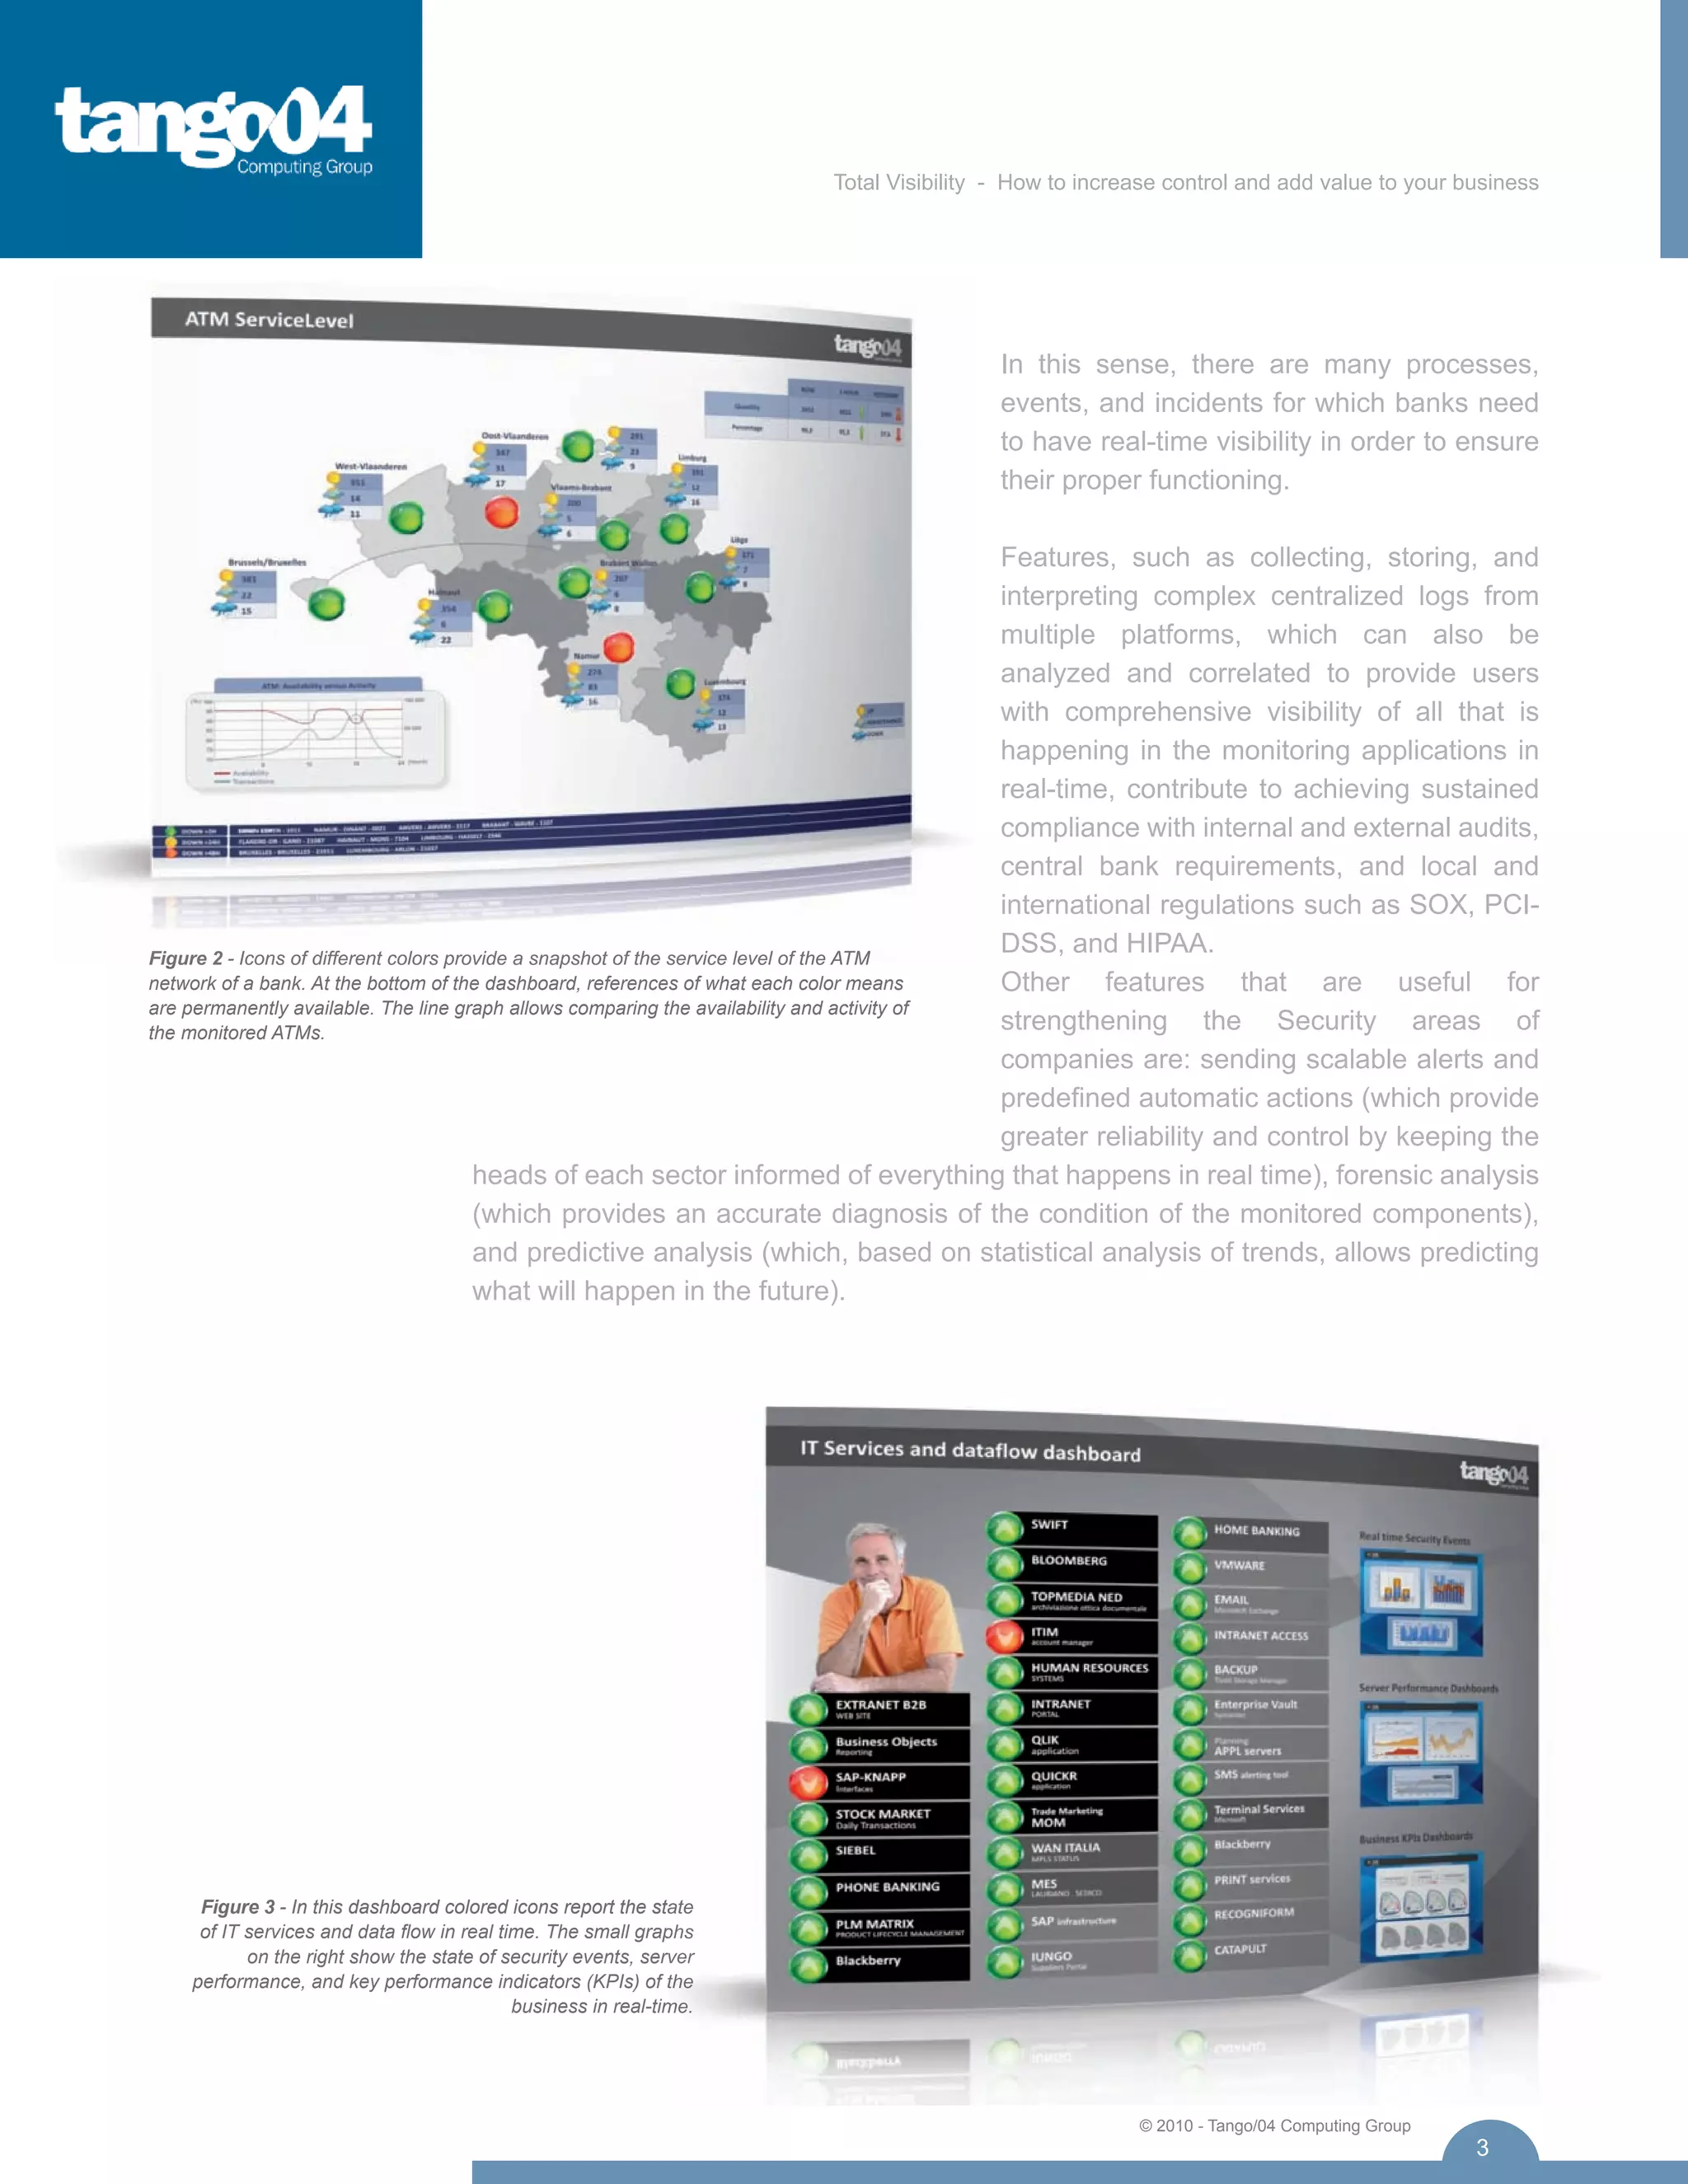
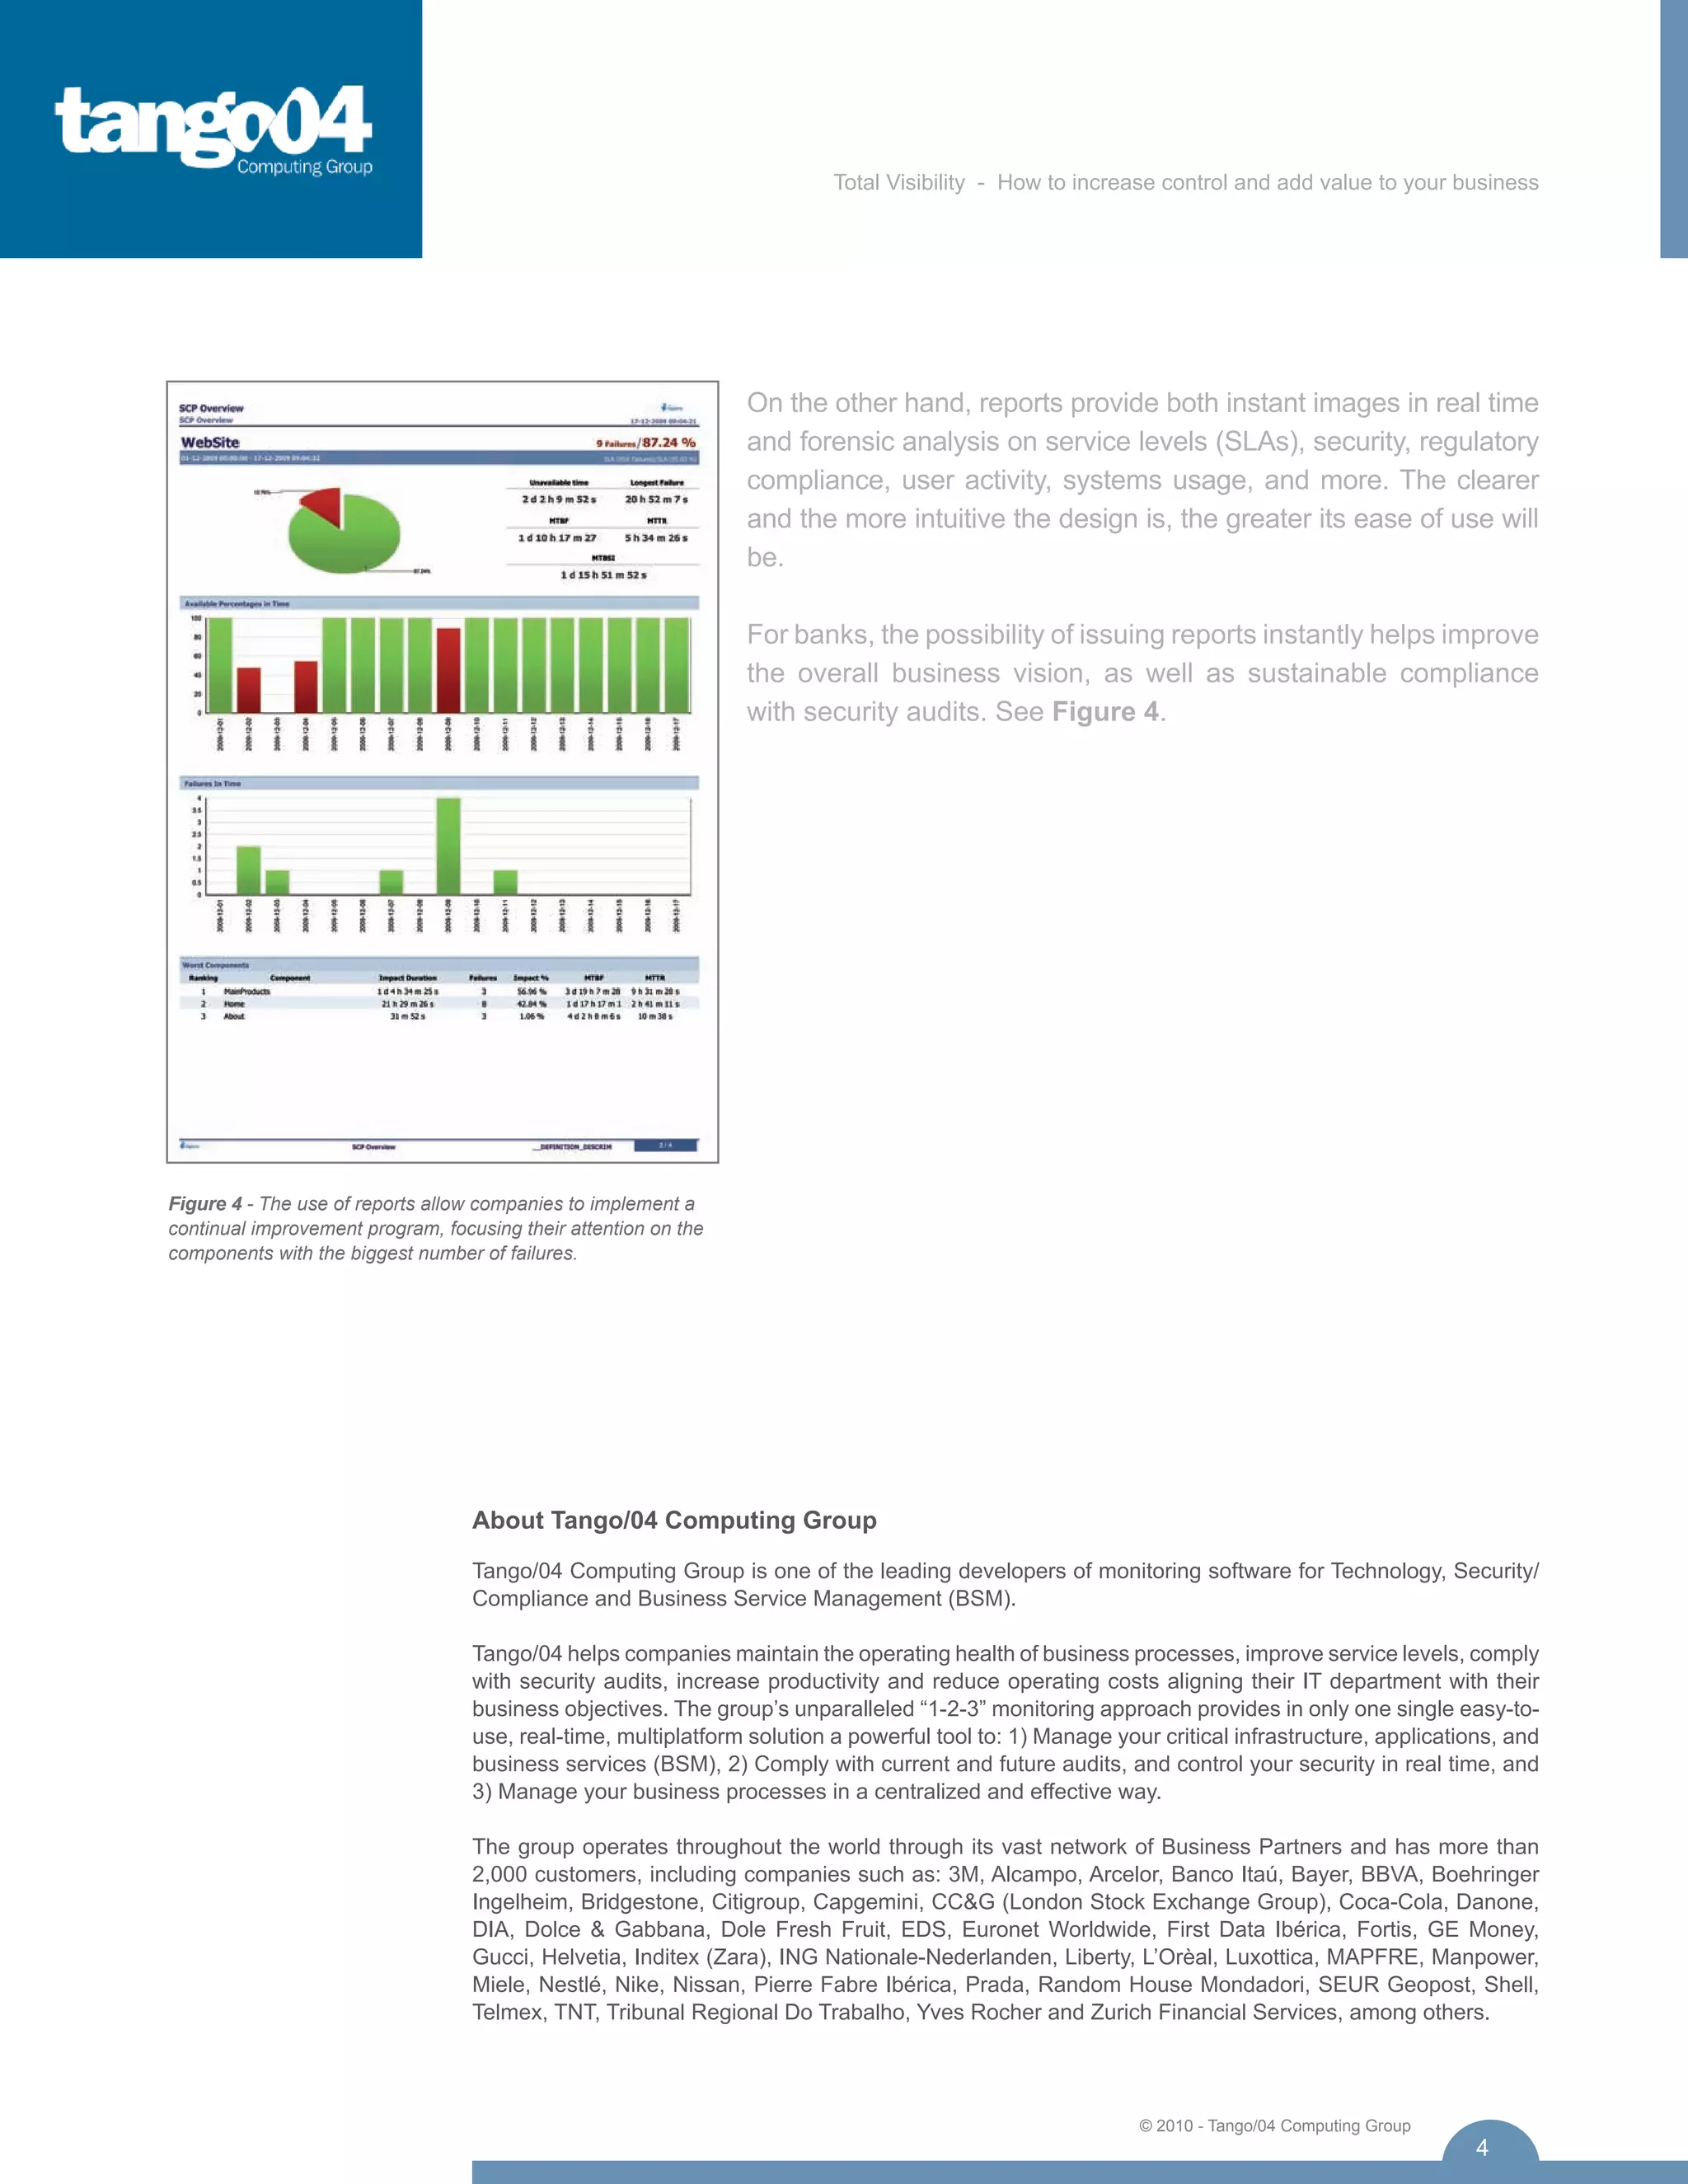

The white paper discusses how providing total visibility through real-time monitoring and analytics dashboards can help banks increase control and add value. It provides examples of dashboards that can monitor the state of bank services, ATMs, IT services, security events, and more. These dashboards equipped with real-time data and visualizations allow managers to improve operational decision making and strengthen key departments like security to ensure regulatory compliance and reliable banking operations.


