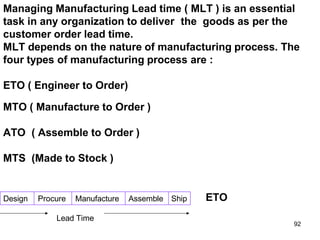
This document provides an overview of World Class Manufacturing (WCM) concepts and practices. It discusses how WCM focuses on continual improvement in quality, cost, lead time, flexibility and customer service. The document outlines some key aspects of WCM including high morale and safety, cost reduction, flexibility, lead time reduction, and quality improvement. It also discusses four principles that companies may adopt when pursuing world-class status: Just-in-Time, Total Quality Control, Total Preventive Maintenance, and Computer Integrated Manufacturing. Additionally, the document discusses lean manufacturing practices and how they aim to eliminate waste through continuous improvement.


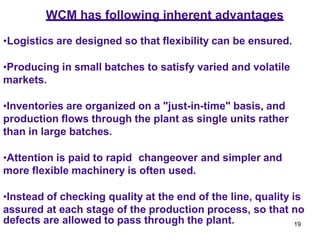

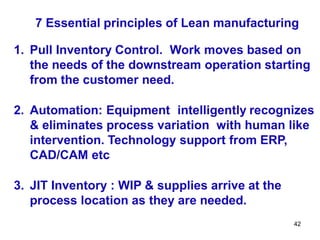

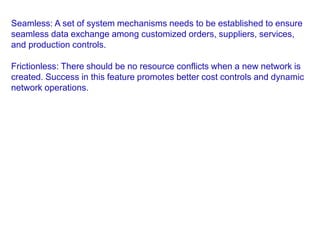

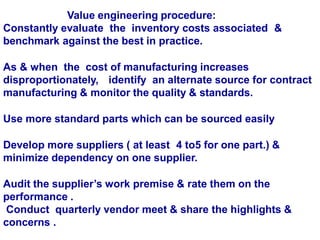

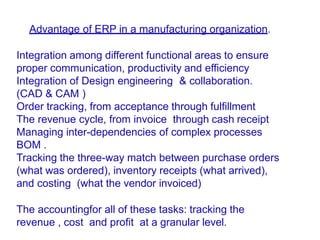


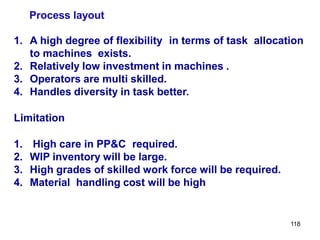


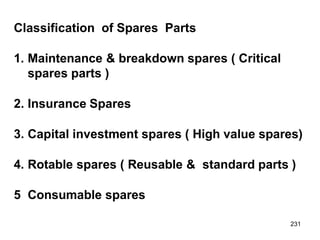
![177
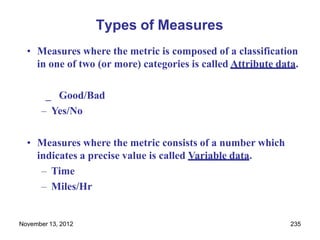
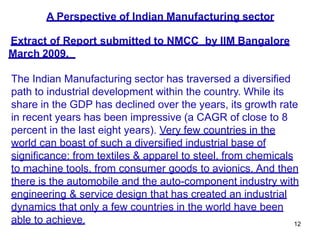
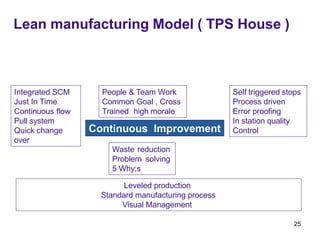
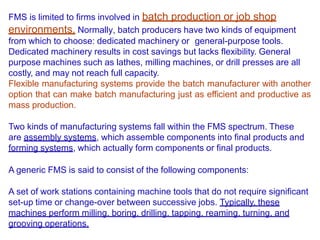
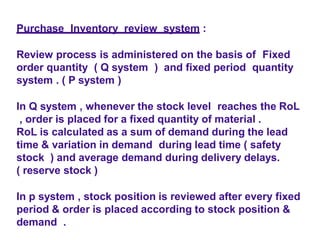
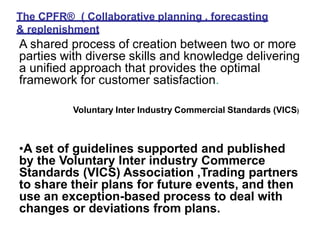
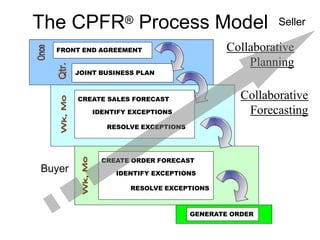
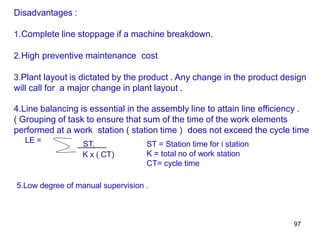
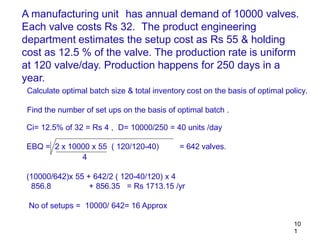
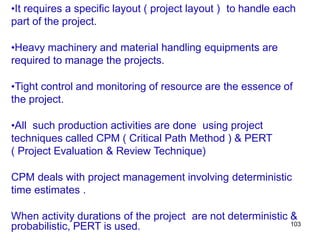
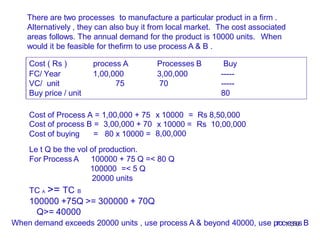
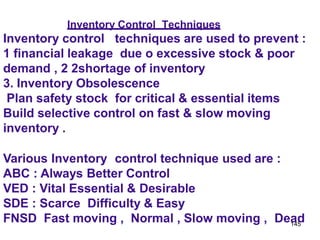
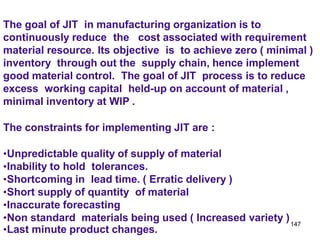
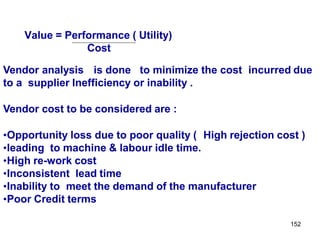
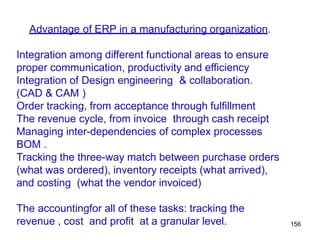
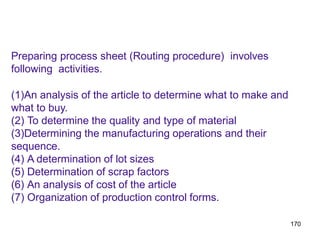
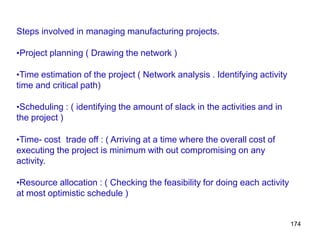
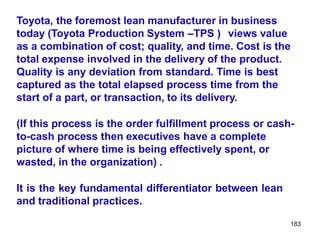
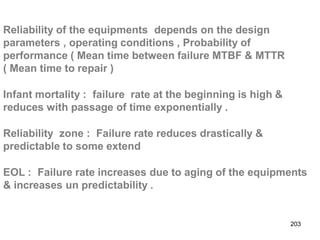
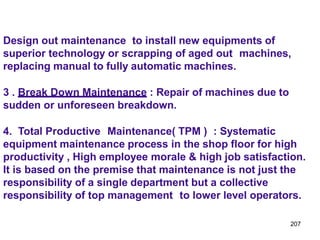
Optimistic time is the time when the execution goes
extremely good.
Pessimistic time is when the execution goes very badly.
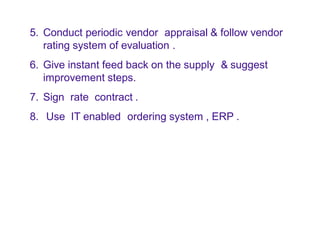
Most likely time is when execution is with in normal
expectation.
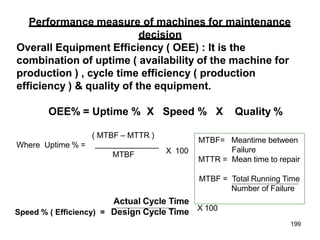
µ = Mean time = ( a+ 4m+b) / 6
²
²
(Variance ) = [(b-a)/6]](https://image.slidesharecdn.com/wcm-1-240301091901-53c2fab2/85/world-class-manufacturing-practices-for-mms-177-320.jpg)


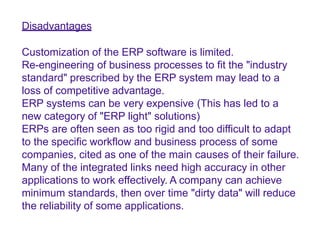
![214
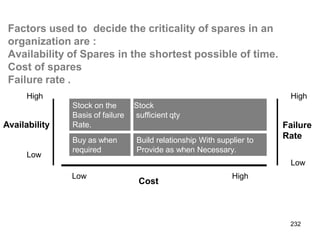
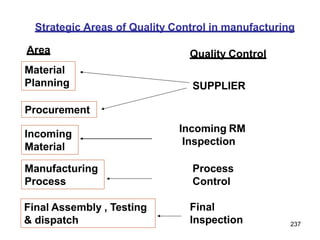
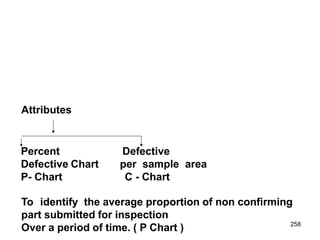
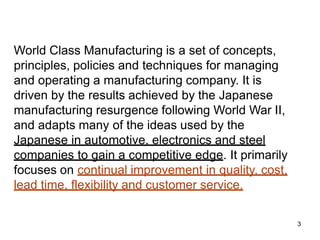
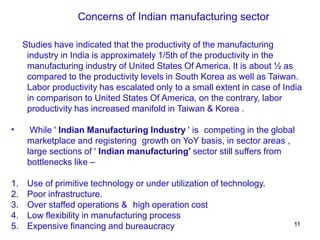
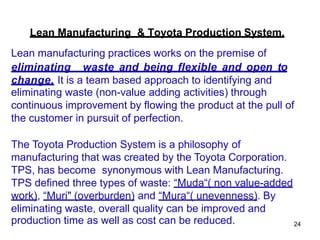
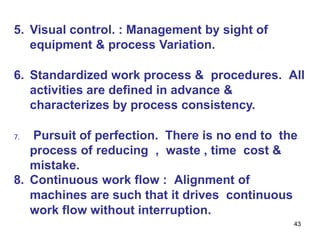
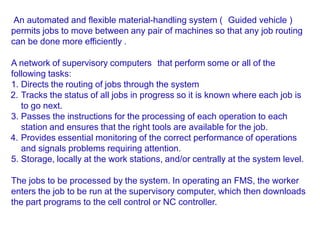
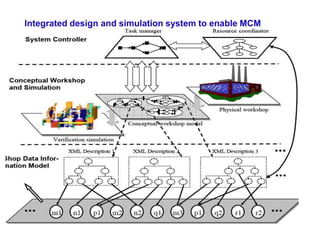
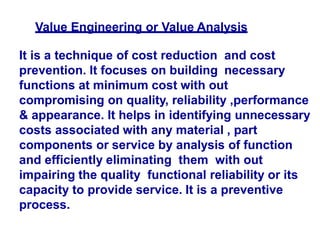
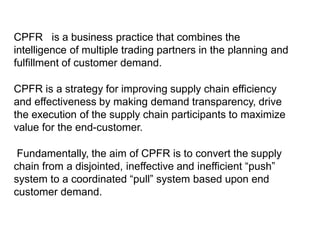
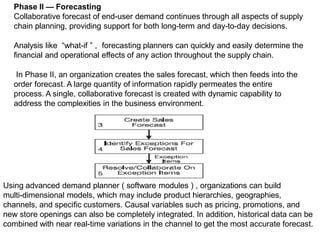
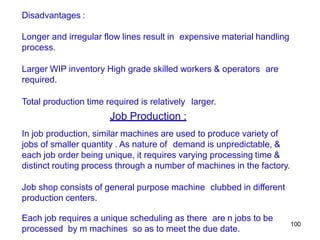
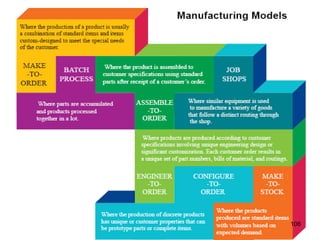
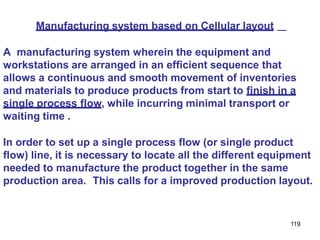
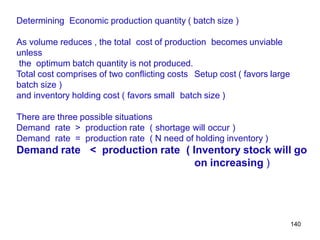
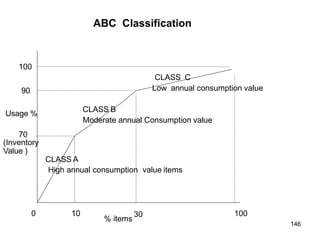
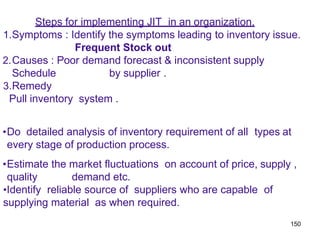
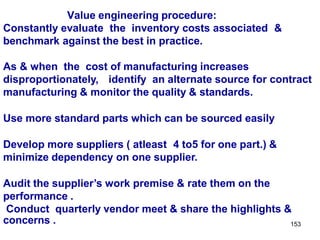
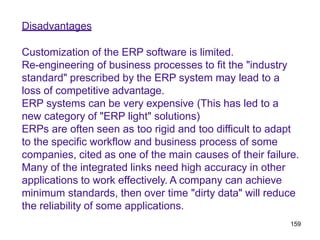
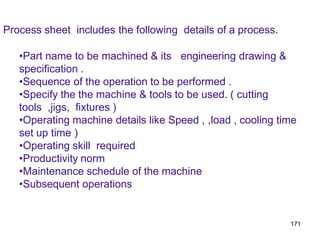
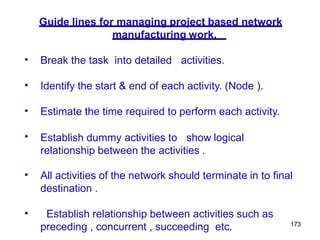
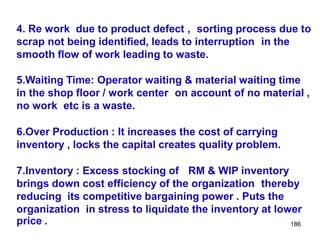
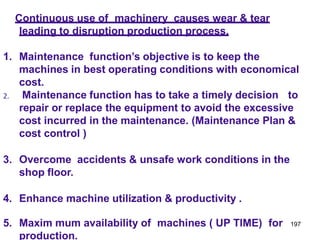
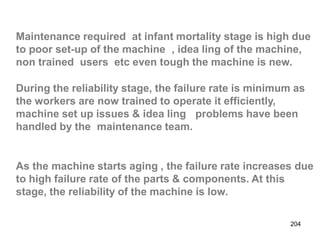
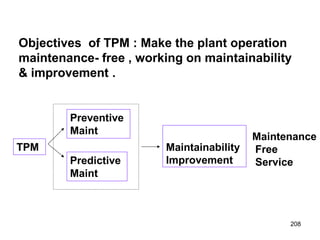
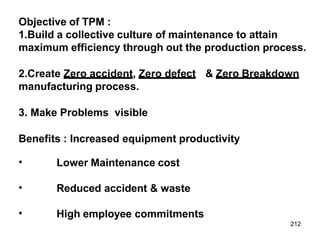
Pillars of TPM to enhance the success are :
5 S strategy of maintenance :
Seri ( Sort )
Seiton ( Systematic )
Seiso ( Sweep. Keep the place clean )
Seiketsu ( Standardize )
Shitsuke ( Self Discipline )
Kaizan [ Plan, Do Check , Act ] ( PDCA )
Autonomous Maintenance : Prepare operators for routine
maintenance so that core maintenance team can focus on
High end maintenance activities. It aims to achieve OEE &
OPE ( Overall production efficiency ) .
Planned & Quality maintenance
Training , Safety & Environment](https://image.slidesharecdn.com/wcm-1-240301091901-53c2fab2/85/world-class-manufacturing-practices-for-mms-213-320.jpg)
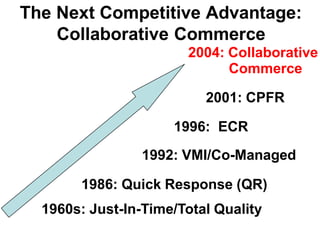
![220
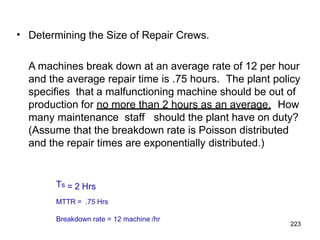
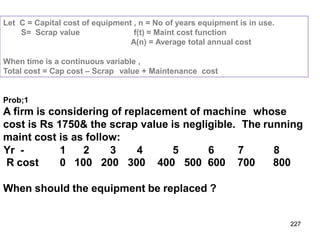
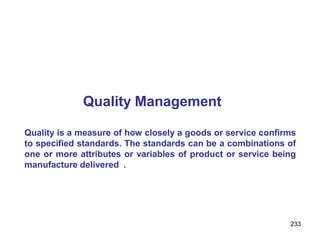
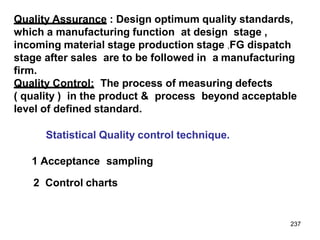
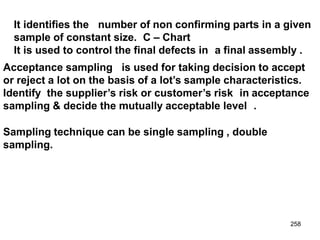
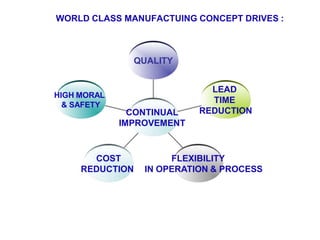
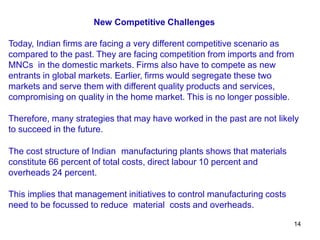
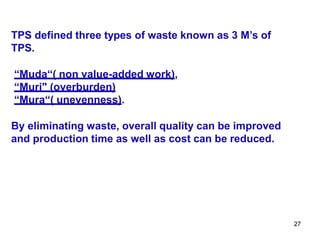
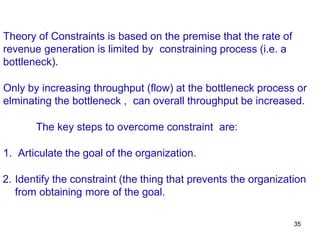
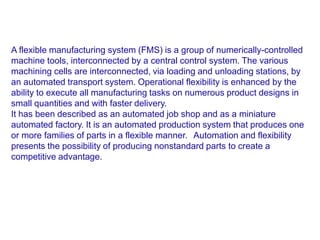
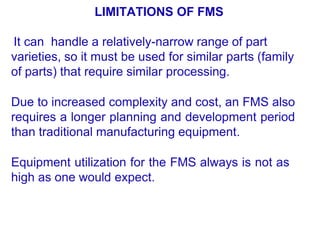
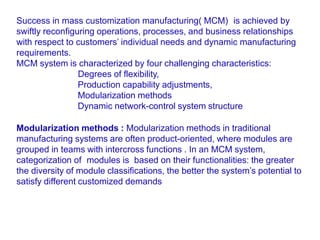
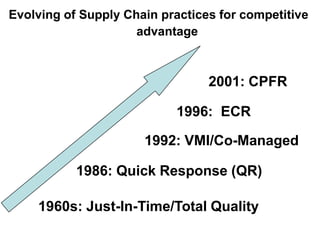
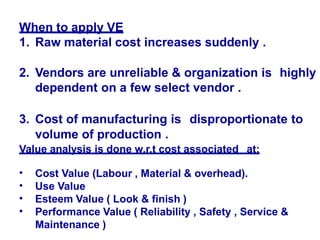
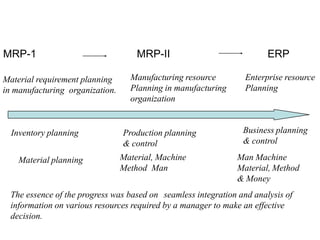
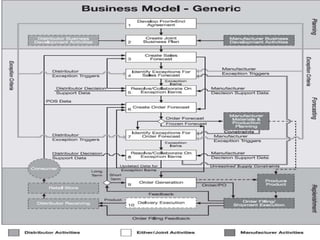
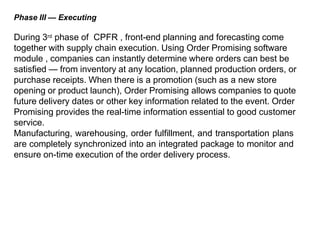
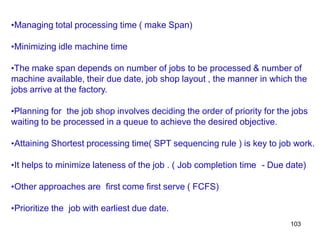
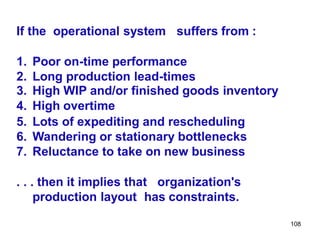
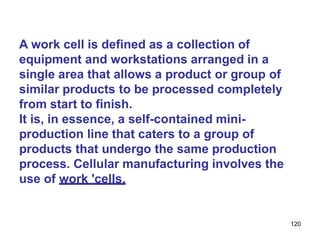
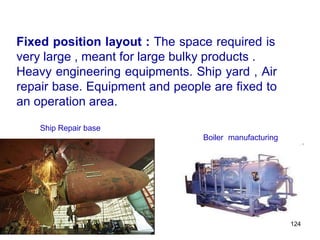
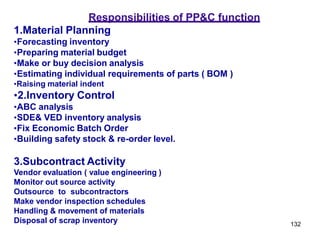
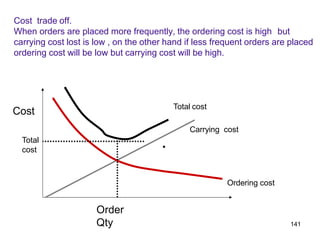
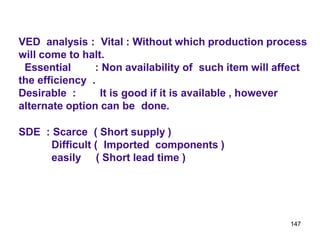
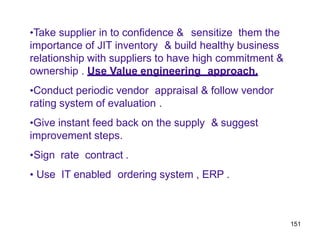
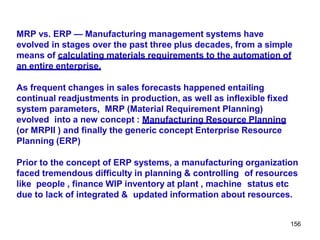
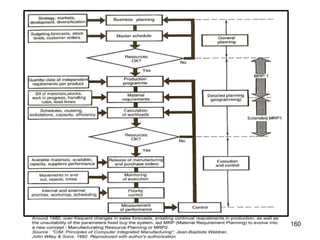
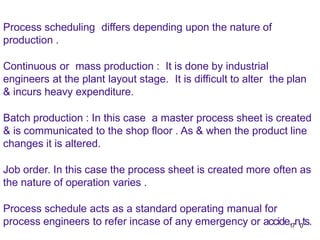
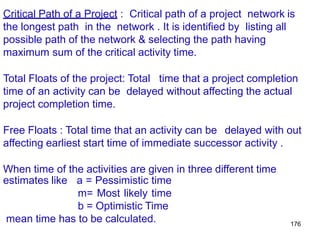
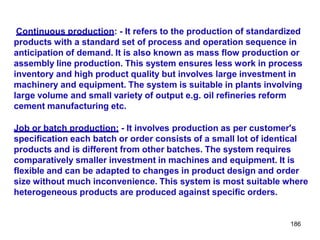
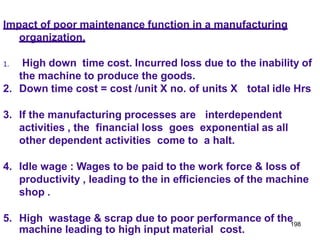
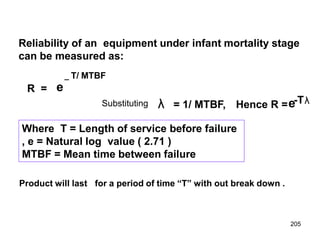
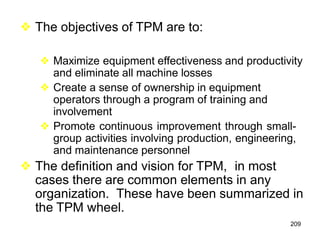
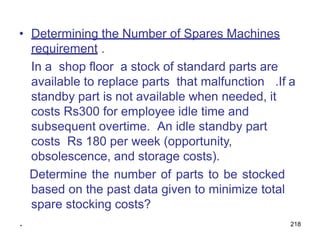
• Determining the Number of Spare parts
Step –II Create Payoff Table (Cij values in box)
SNi Standby parts Needed EC=
Sj 5 10 15 20 P(SNi)(Cij)]
5
10
15
20
P(SNi) .143 .238 .333 .286
Standby
Parts
stocked](https://image.slidesharecdn.com/wcm-1-240301091901-53c2fab2/85/world-class-manufacturing-practices-for-mms-220-320.jpg)
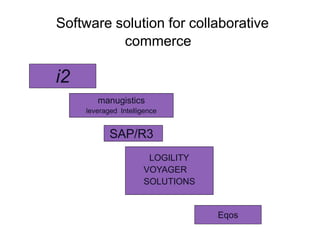
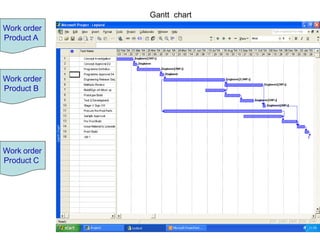
![221
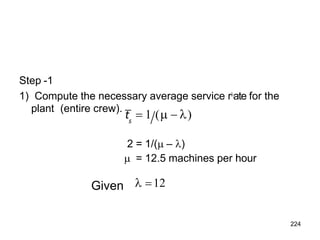
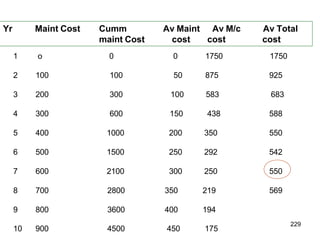
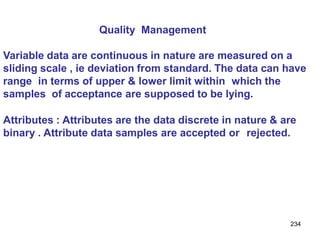
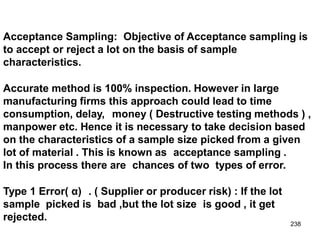
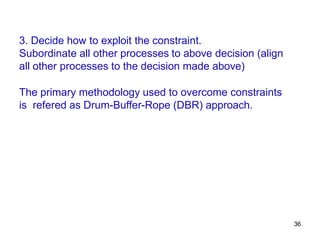
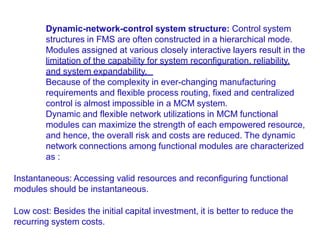
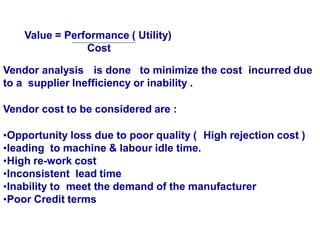
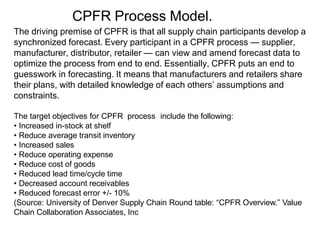
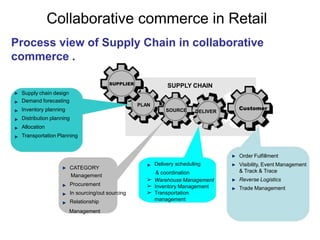
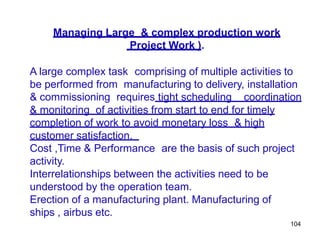
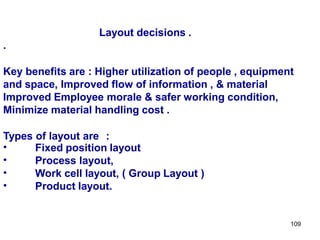
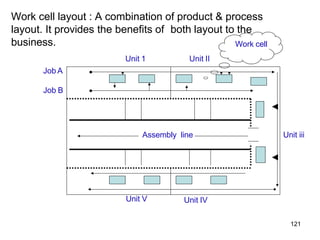
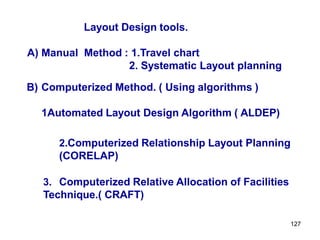
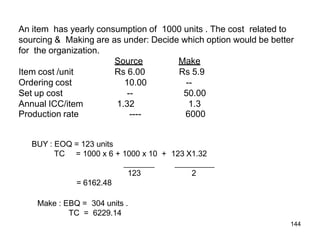
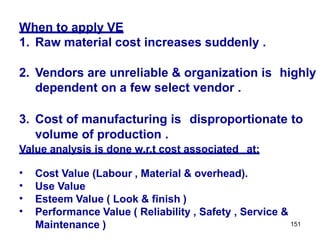
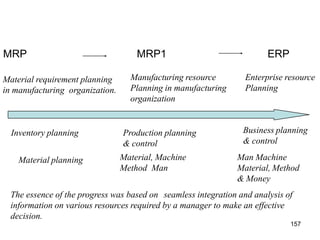
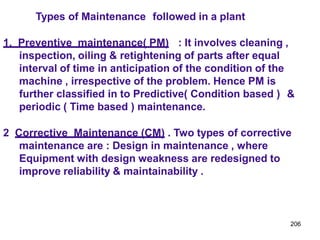
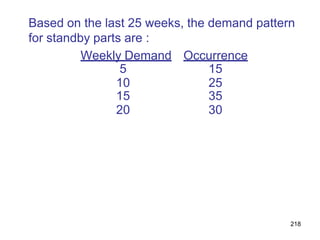
• Determining the Number of Spare parts
Step –II Create Payoff Table (Cij values in box)
SNi Standby Computers Needed EC=
Sj 5 10 15 20 P(SNi)(Cij)]
5 0 1500 3000 4500
10 900 0 1500 3000
15 1800 900 0 1500
20 2700 1800 900 0
P(SNi) .143 .238 .333 .286
Standby
Parts
stocked](https://image.slidesharecdn.com/wcm-1-240301091901-53c2fab2/85/world-class-manufacturing-practices-for-mms-221-320.jpg)
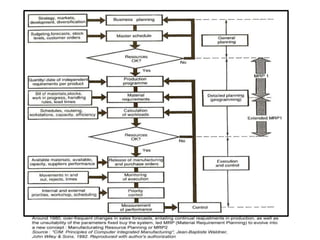
![222
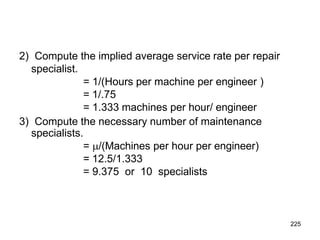
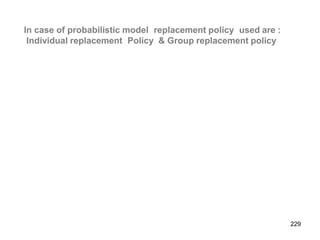
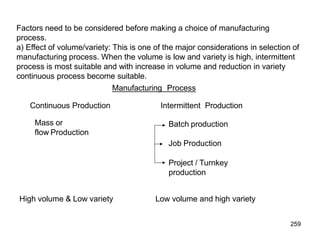
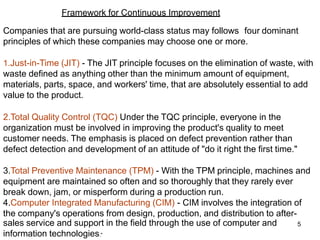
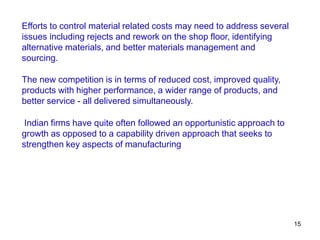
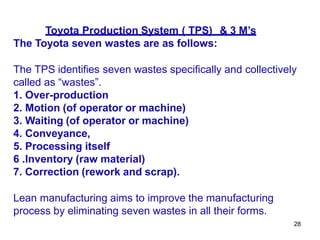
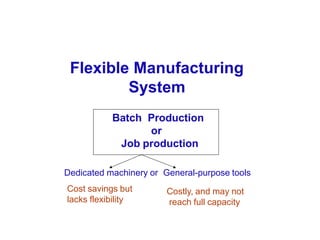
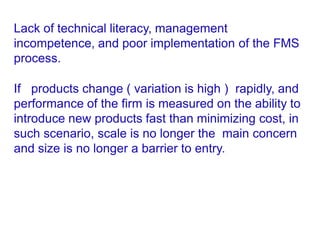
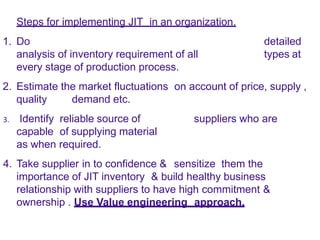
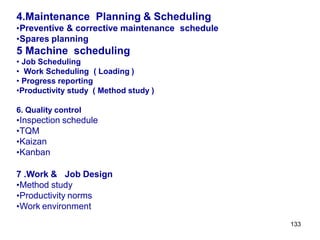
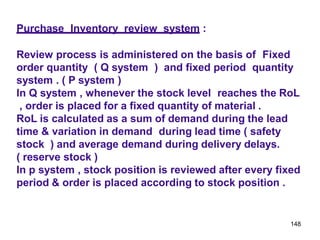
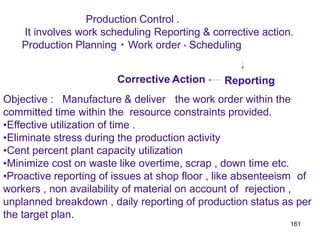
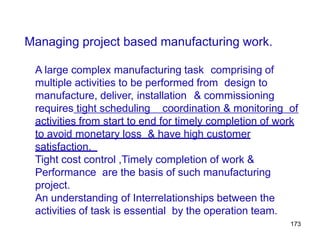
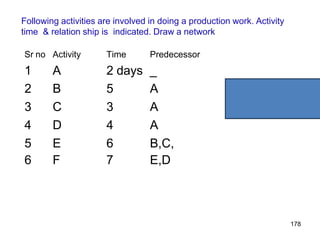
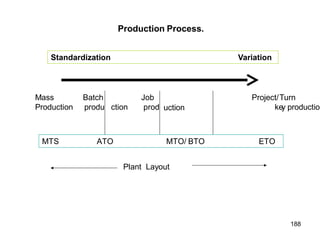
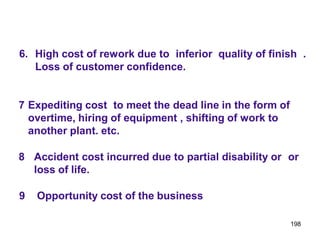
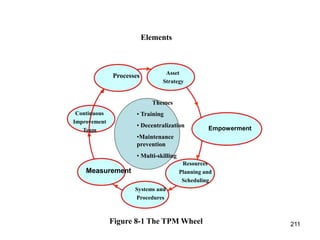
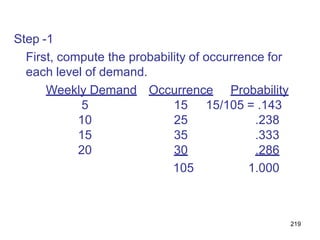
• Determining the Number of Spare parts
Step –II Create Payoff Table (Cij values in box)
SNi Standby Computers Needed EC=
Sj 5 10 15 20 P(SNi)(Cij)]
5 0 1500 3000 4500 Rs2,643.00
10 900 0 1500 3000 Rs1,486.20
15 1800 900 0 1500 Rs 900.60
20 2700 1800 900 0 Rs1,114.20
P(SNi) .143 .238 .333 .286
Standby
Parts
stocked](https://image.slidesharecdn.com/wcm-1-240301091901-53c2fab2/85/world-class-manufacturing-practices-for-mms-222-320.jpg)