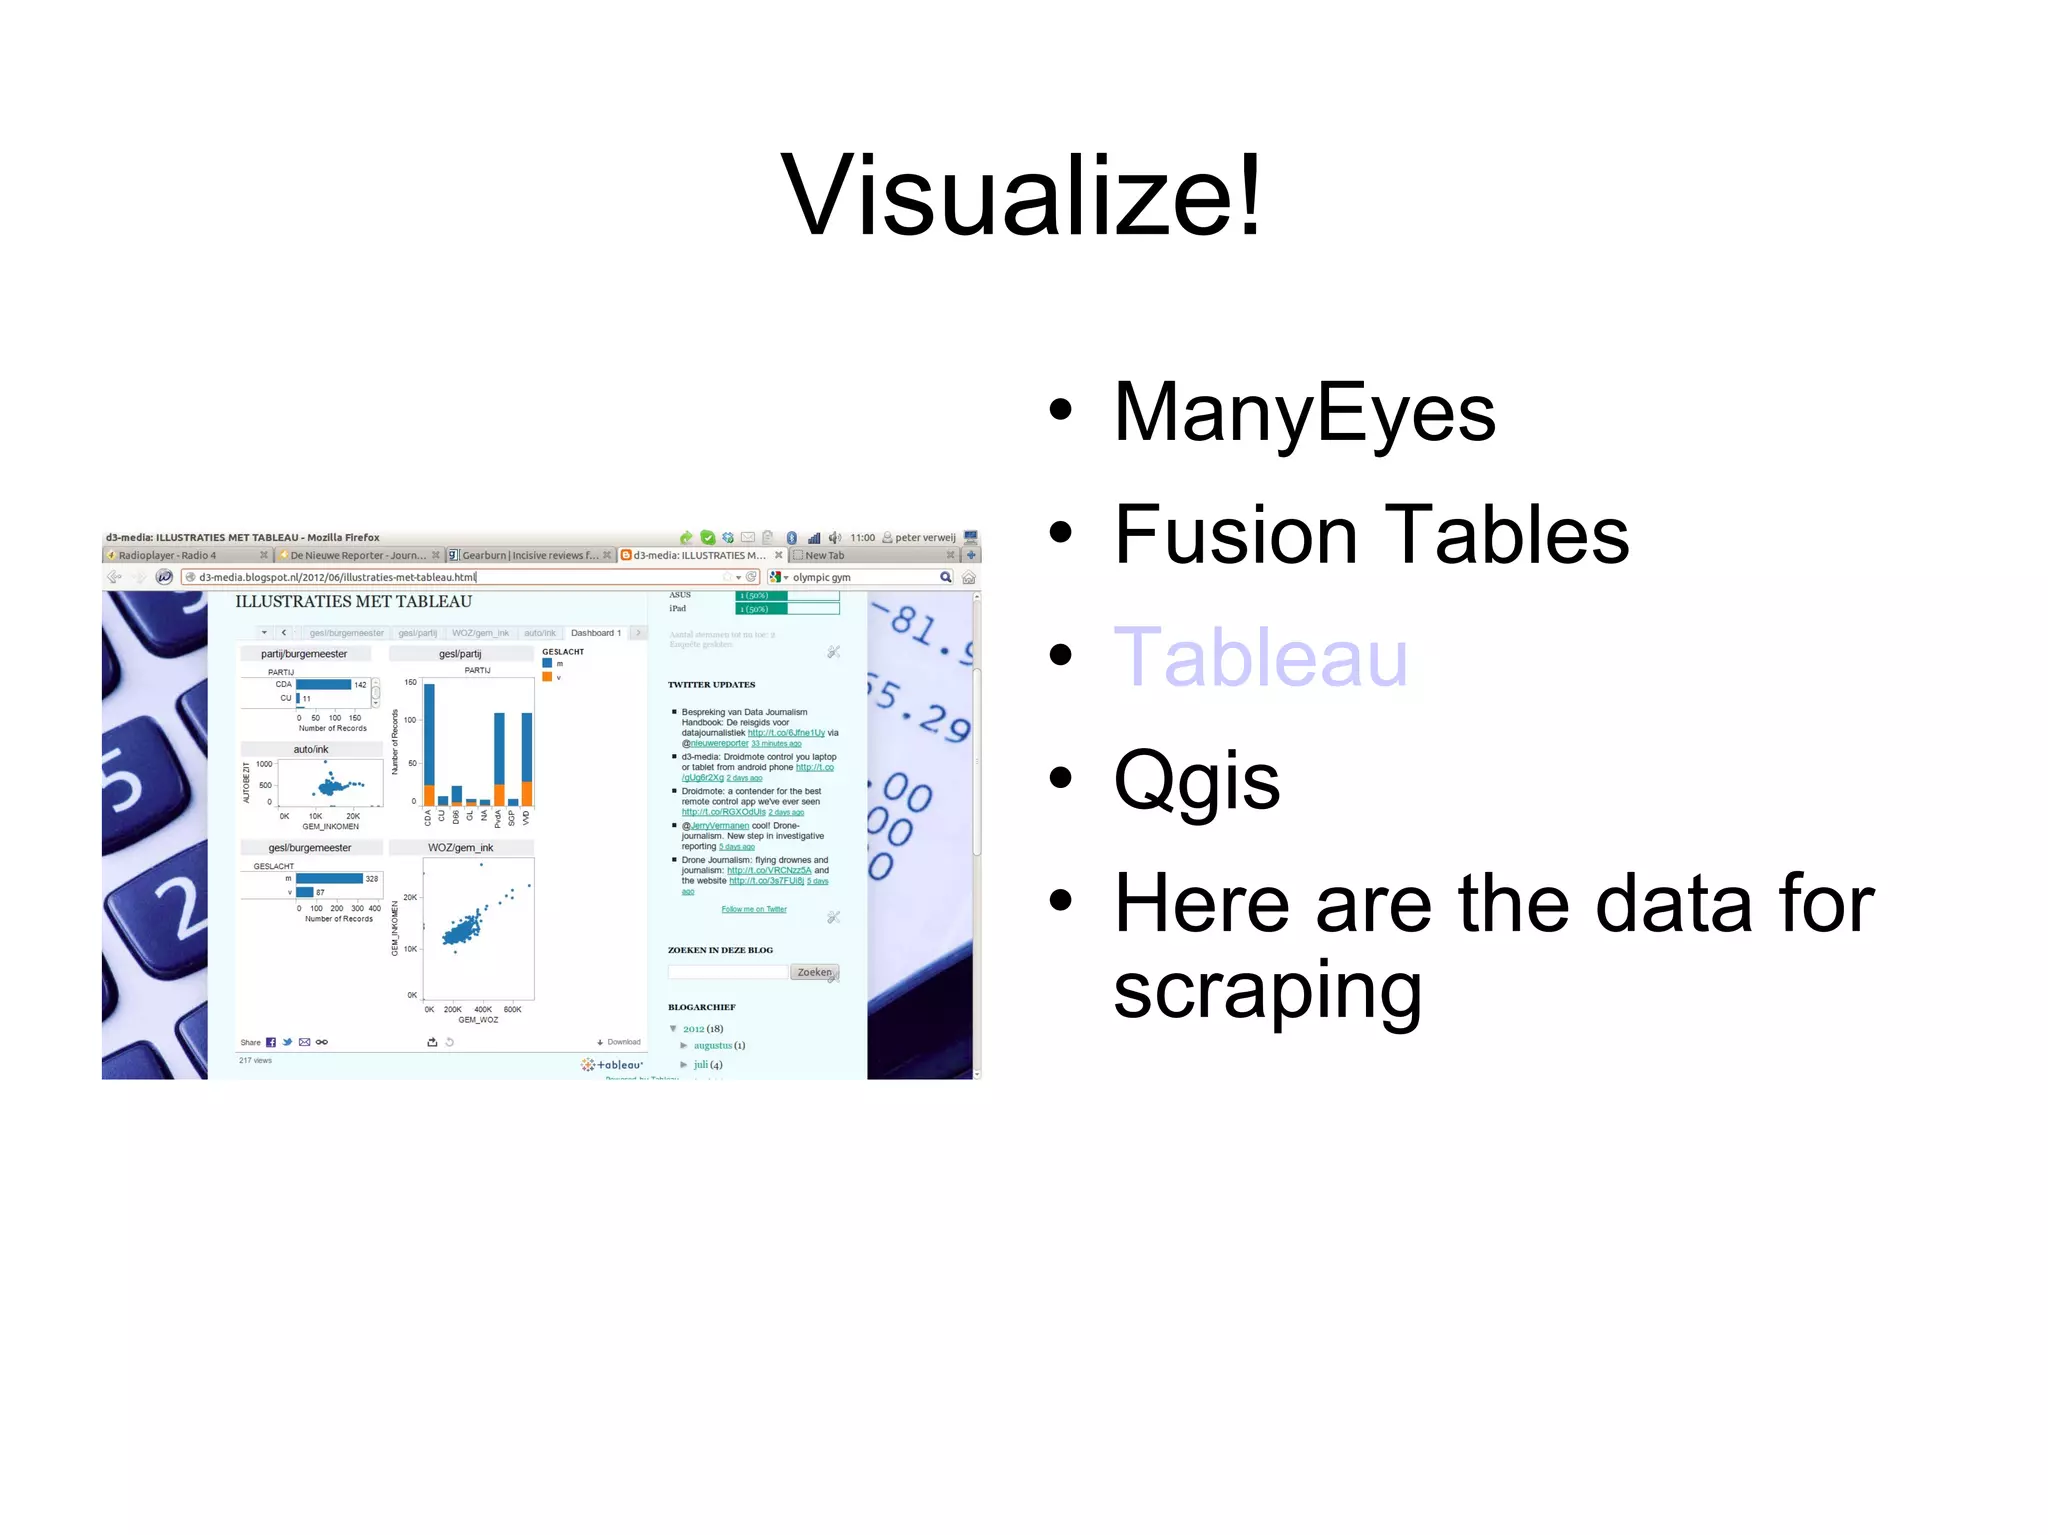
Introduction to Data Journalism
for Financial Reporters and Editors


            Peter Verweij
               Wits University
          Johannesburg Sept 2012
An Example
    Rating Agencies and
     interest rates in EU
     countries.
    Here is the Guardian:
     http://www.guardian.co.uk/new
Numbers in Journalism
             Writing a story about
              ICT and Economic
              development
             Internet user In
              southern Africa
             Google Public data
Statistics Matter

    Digging deeper:
    London Riots

    Finding Background

    Official Explanation

    EU unemployment

    Make use of
    prepared maps,
    graphs, tables: food
    prices
Traffic Accidents
           From Database:
            2000 accidents
           Top ten
           Dangerous junctions
           Map is the story
What is Data Journalism?


Producing stories truth seeking stories in the
   public interest without a legal foundation
            FROM A PILE OF DATA
Shoot out and licenses
              7 dead; 17 wounded
              Check the licenses
              What do you want to
               know?
              Methodology:
               formulate and
               hypothesis
Mayors: gender and political party
                    Appointment of
                     mayors
                    Formulate your ideas
                     first
                    Test them of the data
                    Look at the level of
                     measurement
Finding Data

    WHERE:                
                              HOW:

    National Bureau for   
                              Download
    statistics            
                              Copy-paste

    NGO's                 
                              scraping

    Web: find excel

    Web: tables
Mother of all Data Journalism

    Spreadsheets       
                           Ordering data

    MS Office: excel   
                           Simple calculations

    Open Office            for key figures
                       
                           Graphs
Visualize!
        ManyEyes
        Fusion Tables
        Tableau
        Qgis
        Here are the data for
         scraping
Data Journalism: team work and
              important

    IMPORTANT              
                               TEAM WORK

    More data              
                               Writer

    More use of data for   
                               Researcher
    policies               
                               Hacker

    Check                  
                               Designer

    Find hidden trends
Thank you!
        This is the map for
         Saturday Sept 15.
        Peter@d3-media.nl

Wits dataj intro_finance_2003

  • 1.
    Introduction to DataJournalism for Financial Reporters and Editors Peter Verweij Wits University Johannesburg Sept 2012
  • 2.
    An Example Rating Agencies and interest rates in EU countries. Here is the Guardian: http://www.guardian.co.uk/new
  • 3.
    Numbers in Journalism  Writing a story about ICT and Economic development  Internet user In southern Africa  Google Public data
  • 4.
    Statistics Matter  Digging deeper: London Riots  Finding Background  Official Explanation  EU unemployment  Make use of prepared maps, graphs, tables: food prices
  • 5.
    Traffic Accidents  From Database: 2000 accidents  Top ten  Dangerous junctions  Map is the story
  • 6.
    What is DataJournalism? Producing stories truth seeking stories in the public interest without a legal foundation FROM A PILE OF DATA
  • 7.
    Shoot out andlicenses  7 dead; 17 wounded  Check the licenses  What do you want to know?  Methodology: formulate and hypothesis
  • 8.
    Mayors: gender andpolitical party  Appointment of mayors  Formulate your ideas first  Test them of the data  Look at the level of measurement
  • 9.
    Finding Data  WHERE:  HOW:  National Bureau for  Download statistics  Copy-paste  NGO's  scraping  Web: find excel  Web: tables
  • 10.
    Mother of allData Journalism  Spreadsheets  Ordering data  MS Office: excel  Simple calculations  Open Office for key figures  Graphs
  • 11.
    Visualize!  ManyEyes  Fusion Tables  Tableau  Qgis  Here are the data for scraping
  • 12.
    Data Journalism: teamwork and important  IMPORTANT  TEAM WORK  More data  Writer  More use of data for  Researcher policies  Hacker  Check  Designer  Find hidden trends
  • 13.
    Thank you!  This is the map for Saturday Sept 15.  Peter@d3-media.nl