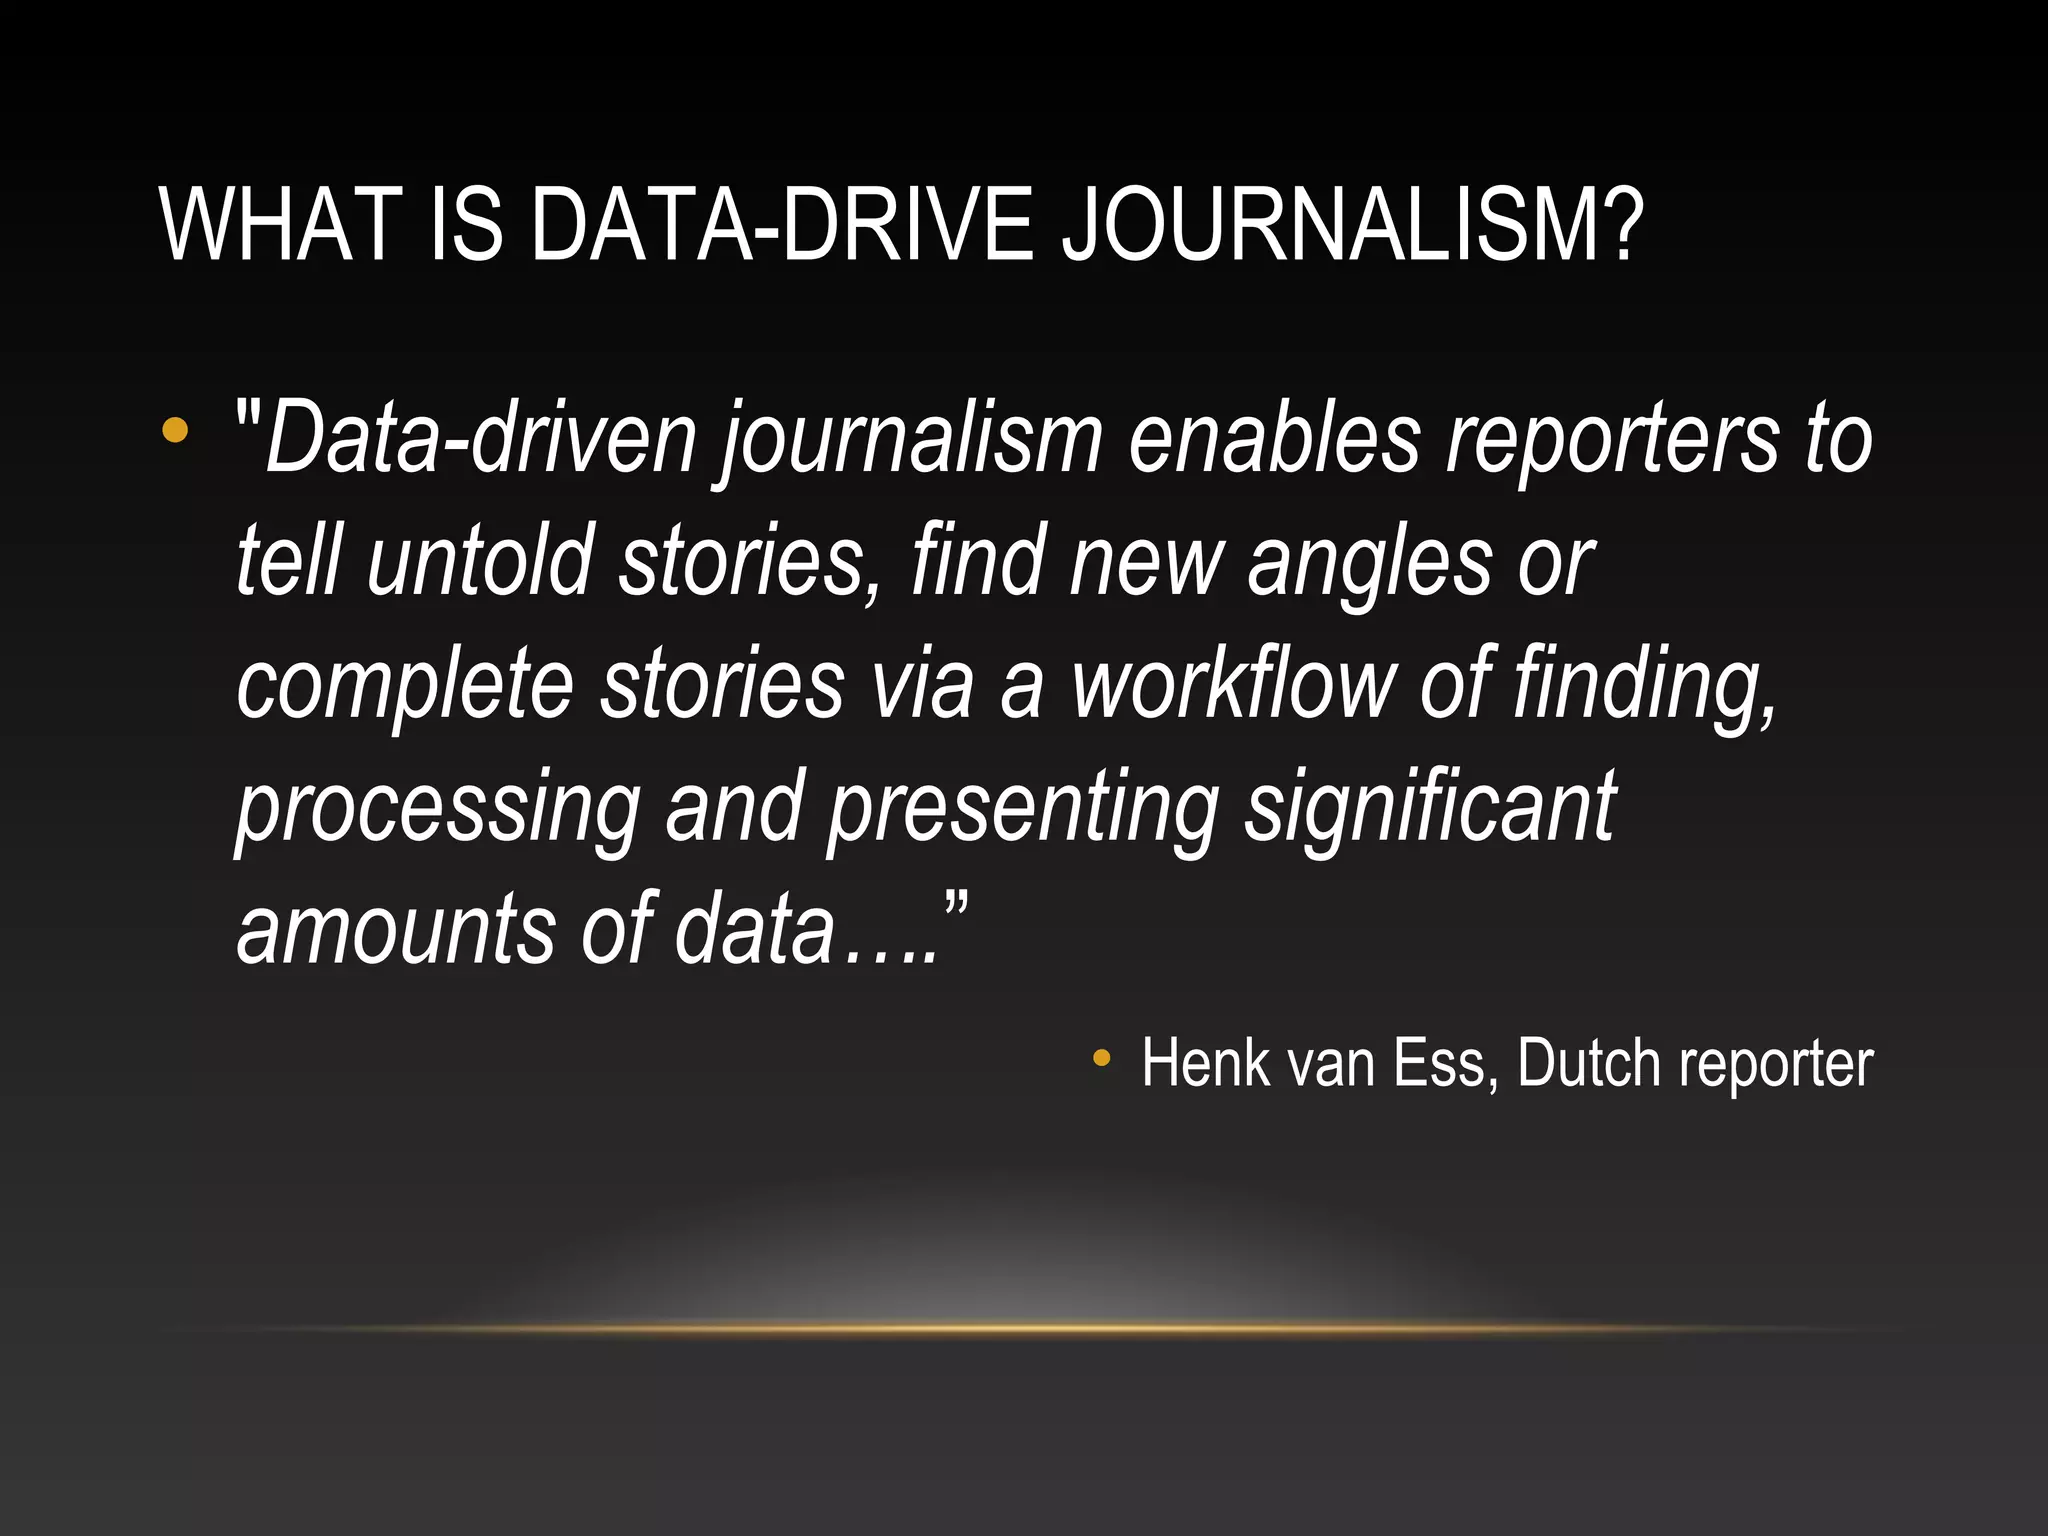
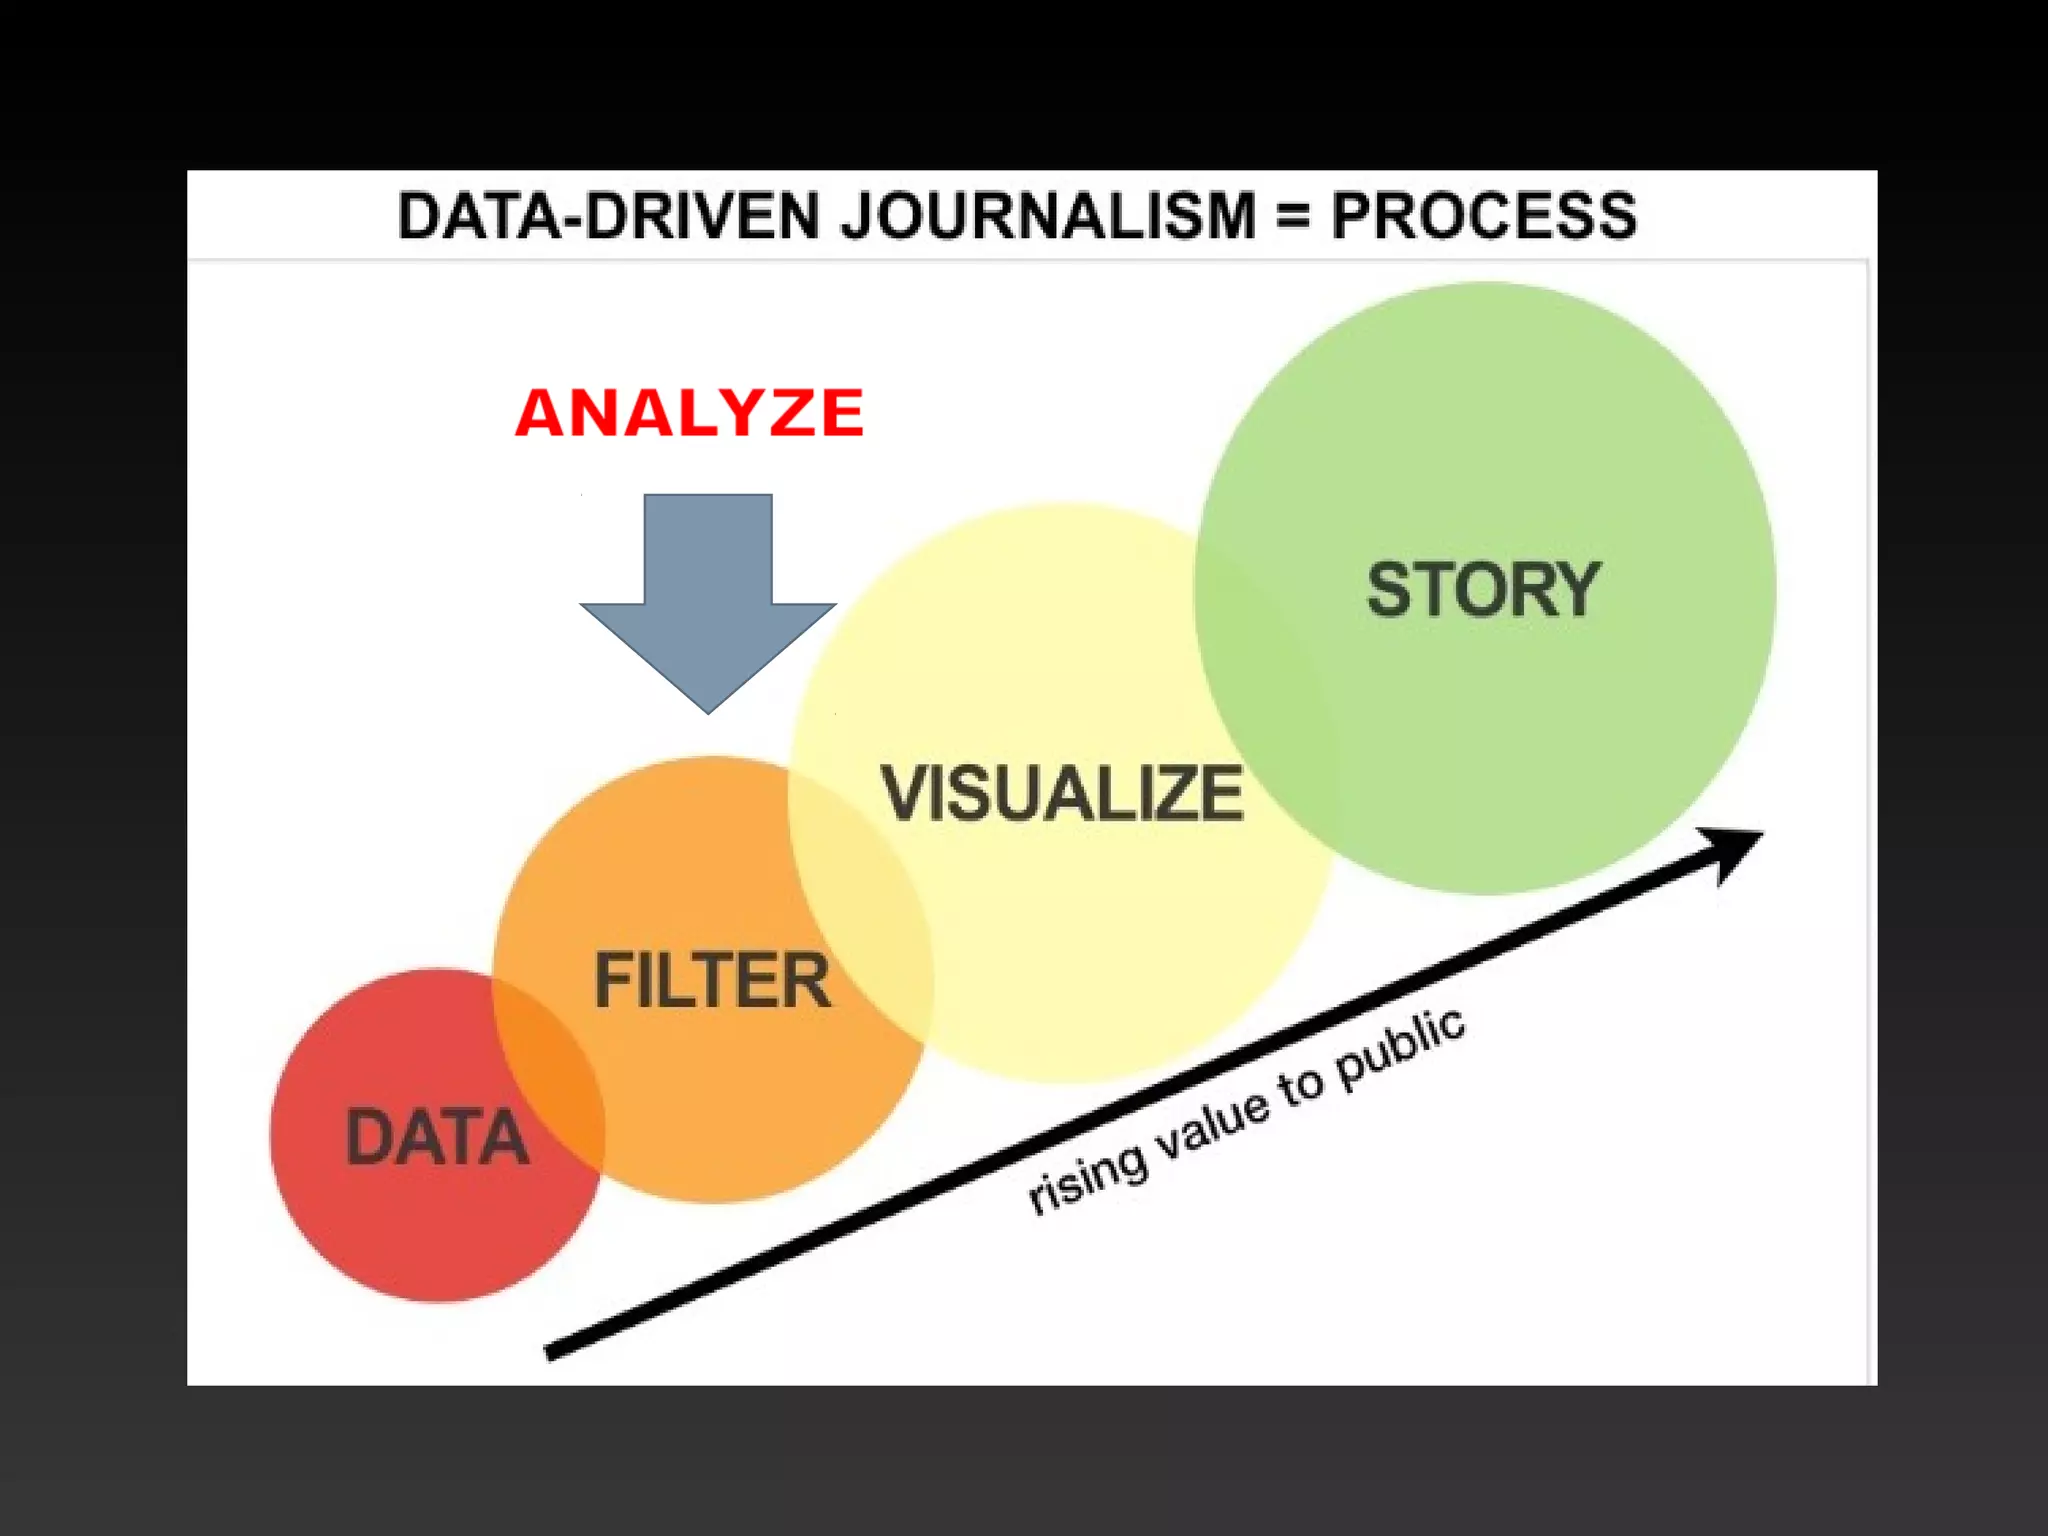
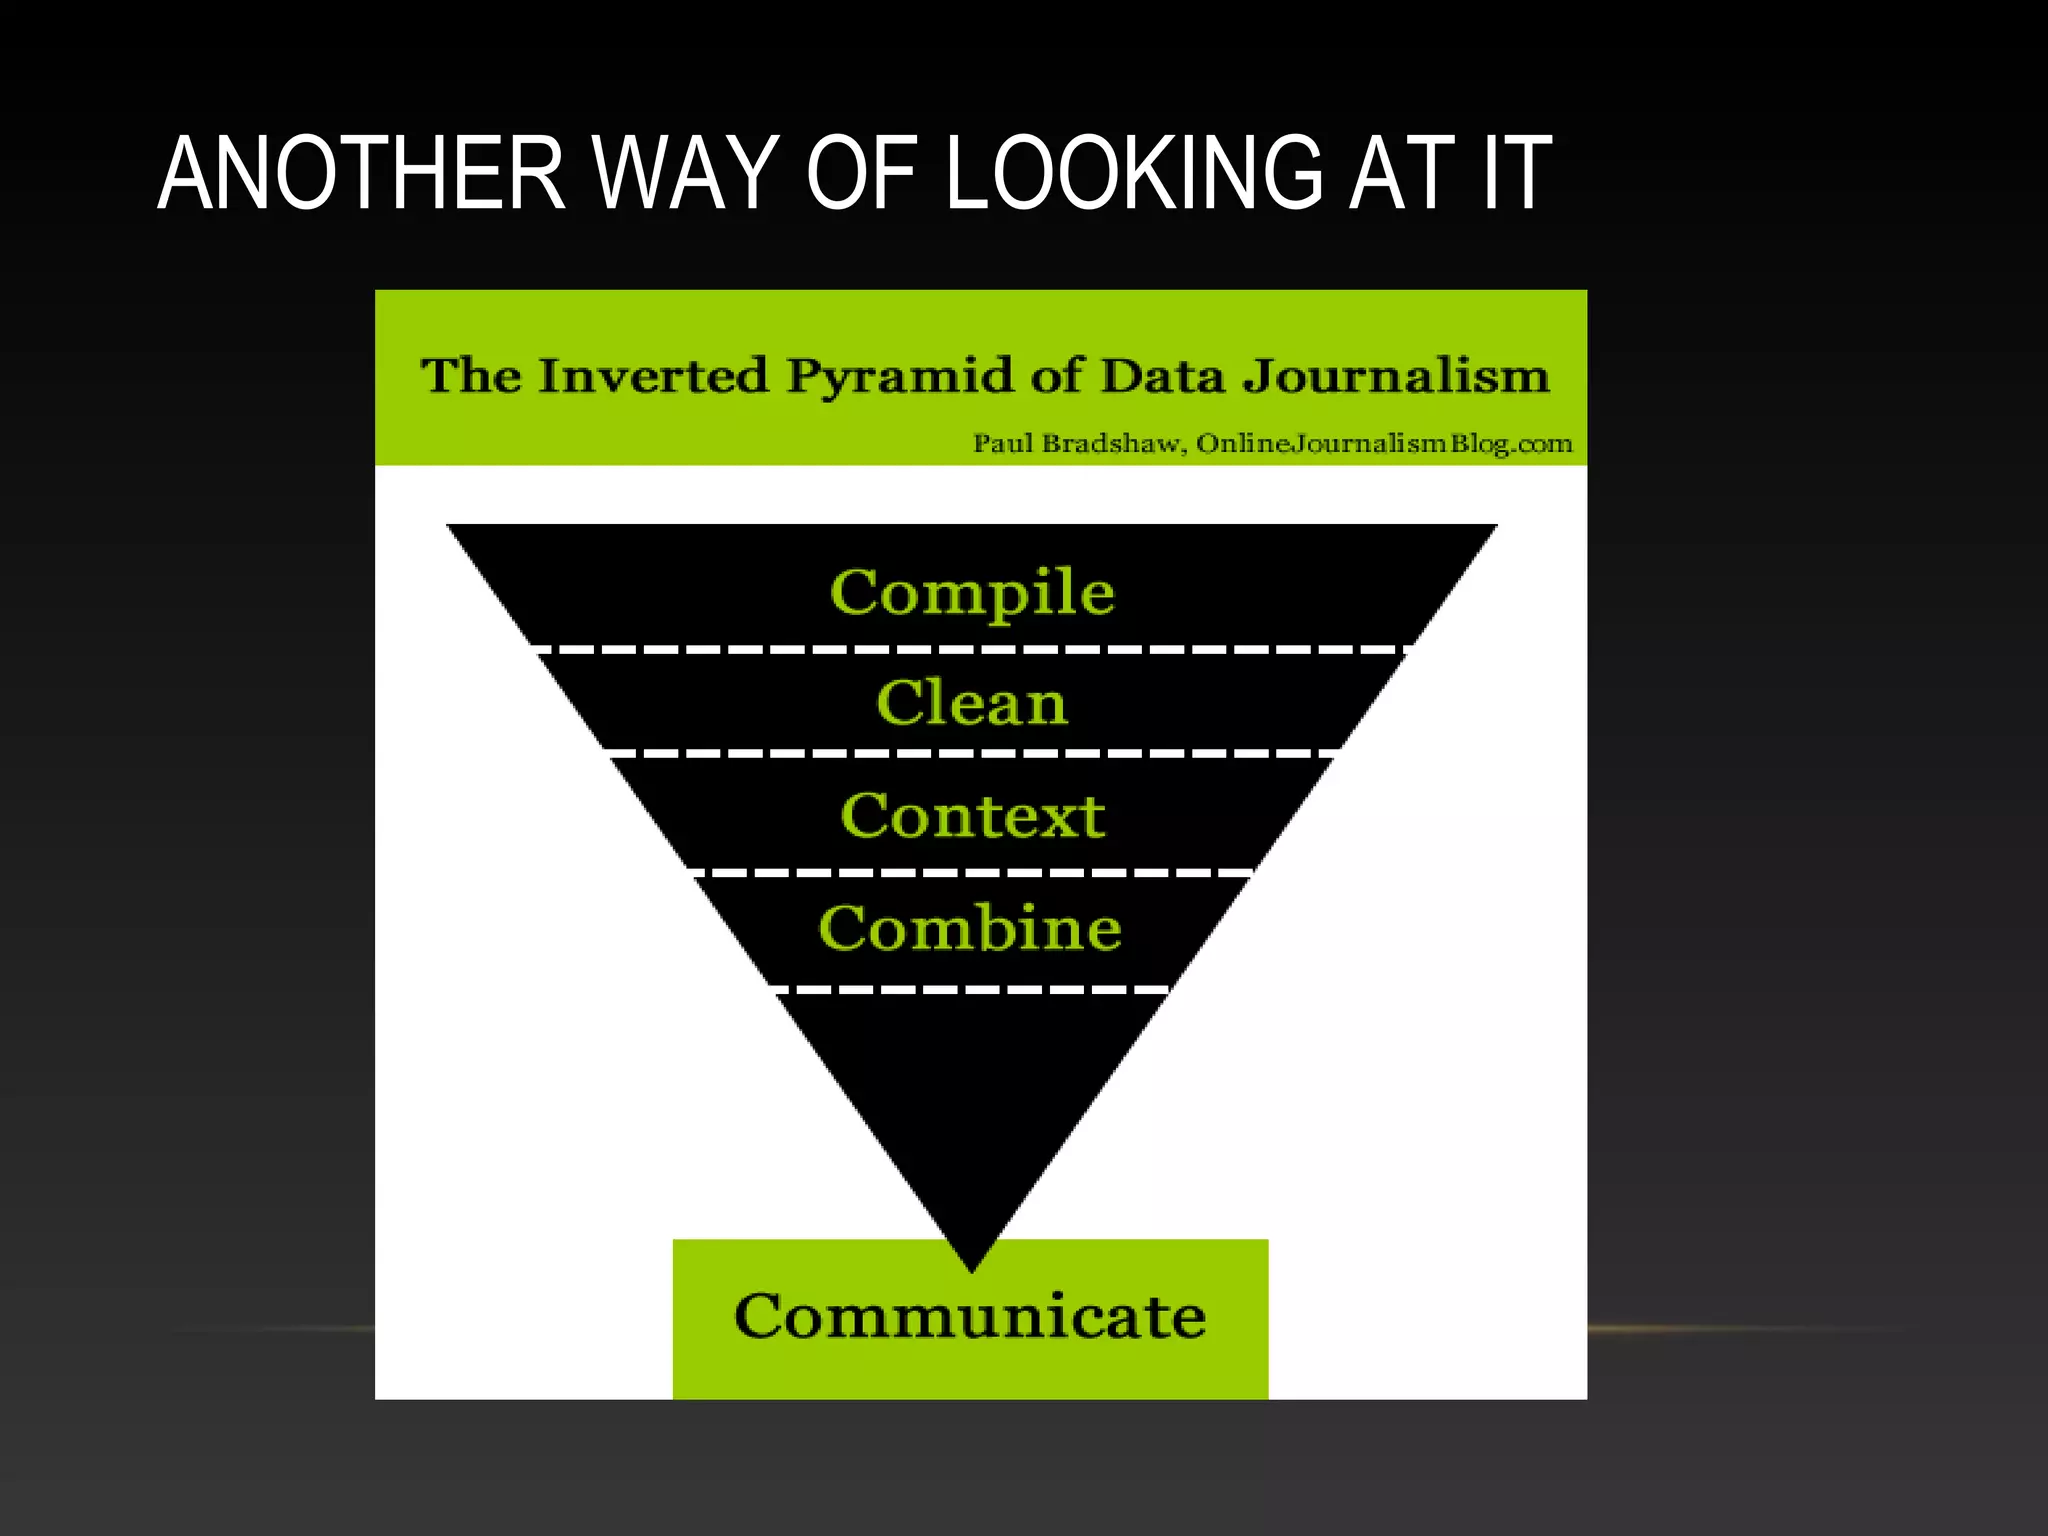
Carol Perruso
Journalism Librarian
Feb. 12, 2012
DATA-DRIVEN JOURNALISM: THE BASICS
WHAT IS DATA-DRIVE JOURNALISM?
• "Data-driven journalism enables reporters to
tell untold stories, find new angles or
complete stories via a workflow of finding,
processing and presenting significant
amounts of data….”
• Henk van Ess, Dutch reporter
ANOTHER WAY OF LOOKING AT IT
FIRST: DATA OR STORY IDEA?
• “Data journalism begins in one of two ways: either
you have a question that needs data, or a dataset
that needs questioning.” –Paul Bradshaw
WHAT’S INVOLVED?
• Data has to be found, which may involve computer
research skills or good old reporting or FOI requests.
• Reporter has to get to know the data.
• Analysis: What story does the data tell?
• Make data accessible/understandable by readers:
Story/graphics
FINDING THE DATA
• Bradshaw outlines the ways you might get data. They might be:
• Supplied by an organization (“how long until we see ‘data
releases’ alongside press releases?”)
• “Found through using advanced search techniques to plough
into the depths of government websites”
• “Compiled by scraping databases hidden behind online forms
or pages of results” using specialized tools.
• Converted from documents into a form that can be analyzed
• Pulled from APIs (application programming interfaces)
• Collected by the reporter
GETTING TO KNOW THE DATA
• CLEAN IT UP:
• Removing human error:
• Removing duplicate entries;
• Deleting blanks
• Converting descriptions to a uniform format/language (e.g.
BBC or B.B.C or British Broadcasting Corporation)
• Converting the data into a format that is consistent with other
data you are using.
• TOOLS: Find and Replace in Excel or Google Refine
INTERVIEW THE DATA
• Do you speak the same language?
• Where do you come from?
• Who created you?
• How were you gathered?
• What are your goals?
• Do they match yours?
ANALYSIS: SOME EXAMPLES
• Sort by scale: highest to lowest e.g. highest to lowest
paid public employees
• Adding it up: e.g. Total amount of salaries paid to players
of a professional baseball team
• Average: Average pay for an employee in a certain job
category
• Geographical groupings and distribution
TOOLS: WHAT ARE REPORTERS USING?
• Excel
• Google Fusion
• SPSS
• Access
• Google Refine
• Social Explorer www.socialexplorer.com
• Python
• Tableau Public
VISUALIZATION: EXAMPLES
• New York Times:
The 2012 Budget, How $3.7 trillion is spent.
• Immigration trends: New York Times
• Netflix rental patterns: New York Times
• Pay patterns: Sacramento Bee
• Gas prices: Los Angeles Times
DATA TO PLAY WITH
• Earthquake data
• Earthquakes
• Survey on gun ownership vs. gun control
• Rights to own guns survey

Data driven journalism

  • 1.
    Carol Perruso Journalism Librarian Feb.12, 2012 DATA-DRIVEN JOURNALISM: THE BASICS
  • 2.
    WHAT IS DATA-DRIVEJOURNALISM? • "Data-driven journalism enables reporters to tell untold stories, find new angles or complete stories via a workflow of finding, processing and presenting significant amounts of data….” • Henk van Ess, Dutch reporter
  • 4.
    ANOTHER WAY OFLOOKING AT IT
  • 5.
    FIRST: DATA ORSTORY IDEA? • “Data journalism begins in one of two ways: either you have a question that needs data, or a dataset that needs questioning.” –Paul Bradshaw
  • 6.
    WHAT’S INVOLVED? • Datahas to be found, which may involve computer research skills or good old reporting or FOI requests. • Reporter has to get to know the data. • Analysis: What story does the data tell? • Make data accessible/understandable by readers: Story/graphics
  • 7.
    FINDING THE DATA •Bradshaw outlines the ways you might get data. They might be: • Supplied by an organization (“how long until we see ‘data releases’ alongside press releases?”) • “Found through using advanced search techniques to plough into the depths of government websites” • “Compiled by scraping databases hidden behind online forms or pages of results” using specialized tools. • Converted from documents into a form that can be analyzed • Pulled from APIs (application programming interfaces) • Collected by the reporter
  • 8.
    GETTING TO KNOWTHE DATA • CLEAN IT UP: • Removing human error: • Removing duplicate entries; • Deleting blanks • Converting descriptions to a uniform format/language (e.g. BBC or B.B.C or British Broadcasting Corporation) • Converting the data into a format that is consistent with other data you are using. • TOOLS: Find and Replace in Excel or Google Refine
  • 9.
    INTERVIEW THE DATA •Do you speak the same language? • Where do you come from? • Who created you? • How were you gathered? • What are your goals? • Do they match yours?
  • 10.
    ANALYSIS: SOME EXAMPLES •Sort by scale: highest to lowest e.g. highest to lowest paid public employees • Adding it up: e.g. Total amount of salaries paid to players of a professional baseball team • Average: Average pay for an employee in a certain job category • Geographical groupings and distribution
  • 11.
    TOOLS: WHAT AREREPORTERS USING? • Excel • Google Fusion • SPSS • Access • Google Refine • Social Explorer www.socialexplorer.com • Python • Tableau Public
  • 12.
    VISUALIZATION: EXAMPLES • NewYork Times: The 2012 Budget, How $3.7 trillion is spent. • Immigration trends: New York Times • Netflix rental patterns: New York Times • Pay patterns: Sacramento Bee • Gas prices: Los Angeles Times
  • 13.
    DATA TO PLAYWITH • Earthquake data • Earthquakes • Survey on gun ownership vs. gun control • Rights to own guns survey