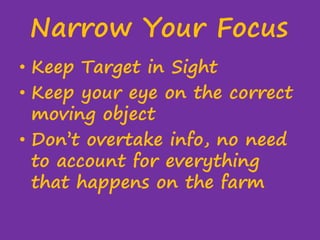
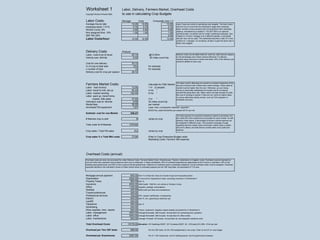
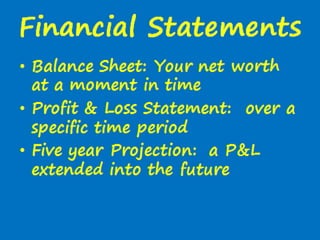
Richard Wiswall gave a presentation on farm budgeting at the ACORN Conference in Moncton, New Brunswick. He emphasized that profit equals income minus expenses, and provided lessons on scrutinizing big expenses like labor, efficiencies of scale, and having a cushion for overhead costs and bad years. Wiswall also discussed keeping budgets simple by focusing on key parameters and targets. He provided examples of budgeting for egg production from 50 layers and meat production from 50 birds to demonstrate the process.
For more classes visit
www.snaptutorial.com
ACC 434 Final Exams
1. (TCO 1) a significant limitation of activity-based costing is the (Points: 5)
2. (TCO 1) Ireland Company produces a special spray nozzle. The budgeted indirect total cost of inserting the spray nozzle is $180,000. The budgeted number of nozzles to be inserted is 80,000. What is the budgeted indirect cost allocation rate for this activity? (Points: 5)
3. (TCO 2) Overhead costs have been increasing due to all of the following except (Points: 5)
4. (TCO 2) Information pertaining to Brenton Corporation's sales revenue is presented in the following table:
February March April
Business Canvas and SWOT Analysis For mo.docxhallettfaustina
Business Canvas and SWOT Analysis
*For more detailed information see TVP2.0*
Key Partners
Rhode Island Fight
Club direct
customer
information line:
(401)316-5779.
National Food
Truck Festival
information line:
(617)254-9500.
Owners and
master brewers. Ex.
Startline Brewery,
Wormtown
Brewery, and
Treehouse Brewery.
Key Activities
Providence Festival
contact.
Reach out to
brewery owners
and gain interest.
Value Proposition
Food Truck Festival
networking.
Microbrewery
sponsorship event.
Logo exposure via
Rhode Island Food
Fight Coupons.
3rd Annual
Providence Food
Truck & Craft Beer
Festival in
Providence, RI on
August 5th, 2018.
Customer
Relationships
Entrepreneurial
Partnerships.
Target market
focuses on
transparent
professional
environments.
Customer Segments
Local college
students.
New restaurants in
the region.
Brewery’s and
Food Truck owners.
Commercial
Customers.
Immigration heavy
regions for focus
on building kitchen
staff database.
Key Resources
Respect for brand.
Strong virtual
infrastructure for
potential
consumers.
Leverage existing
entrepreneurial
relationships.
Channels
Communication
Channel: Web and
Application based.
Public Relations
Channels: Social
Media presence.
Create a hashtag
targeted towards
worker base.
Cost Structure
Highest Key Activity Cost – Rhode Island Food Fight logo
exposure via purchased space on their coupons.
The Food and Craft Beer Festival and Microbrewery’s requires
minimal costs and focus on a mutually beneficial agreement
based on the benefit of brand exposure.
Revenue Streams
Increased revenue can be seen via networking exposure.
Becoming involved in popular events for the target market is a
low cost, high profit venture.
Results could be measured with the App with a small
modification to the software.
Business Canvas and SWOT Analysis
*For more detailed information see TVP2.0*
Strengths
Affordable and convenient
Current northeast American culture
(Immediate Satisfaction)
Dual benefits for employees and employers
Experience in the restaurant industry
Knowledge of the needs
First-Mover Advantage
Weaknesses
Customer retention: Restaurant owners are
continuously cancelling and reinstating their
subscriptions
Low employee/worker database
Low consumer awareness
Little social media presence
S.W.O.T. Analysis
Opportunities
Microbrewery’s are popular among the target
market
College campuses (population of 2 million)
Social Media movements
Food Truck Festivals are an ideal way of
connecting with possible employers and food
lovers.
Threats
Loss of Momentum
Piggy backers
Economic fluctuations
As of now, SpinGig does not have any immediate ...
http://www.extension.org/67567 Composting is becoming widely accepted as a best management practice for equine facilities. Stable waste is a readily compostable feedstock which generates heat and transforms into a finished compost product in as little as 2 weeks using in-vessel technologies. Composting the stable waste is financially beneficial, turning a liability into an asset, negating disposal fees, offering a decrease in bedding expenses and creating a saleable product. In- vessel composting allows for compliance with increasing environmental regulations associated with manure management.
The primary topic will be the cost analysis of in-vessel vs. open pile composting of stable waste. The author will also compare the value of the product produced, specifically the value added with weed seed kill, reduction of pathogens, and the uniform quality and dryness of end product. The presenter will provide lab data showing compost stability and pathogen reduction using both shavings and pellet bedding. Value of the end product is seen in bedding re-use and/or soil amendment.
Discussion of cost savings will differ for different venues in the industry. Case studies will be shown for the financial analysis of a private 20 horse stable and the 65 horse stable at the US Army base at Fort Myer/Henderson Hall in Washington DC.
LF Energy Webinar: Electrical Grid Modelling and Simulation Through PowSyBl -...DanBrown980551
Do you want to learn how to model and simulate an electrical network from scratch in under an hour?
Then welcome to this PowSyBl workshop, hosted by Rte, the French Transmission System Operator (TSO)!
During the webinar, you will discover the PowSyBl ecosystem as well as handle and study an electrical network through an interactive Python notebook.
PowSyBl is an open source project hosted by LF Energy, which offers a comprehensive set of features for electrical grid modelling and simulation. Among other advanced features, PowSyBl provides:
- A fully editable and extendable library for grid component modelling;
- Visualization tools to display your network;
- Grid simulation tools, such as power flows, security analyses (with or without remedial actions) and sensitivity analyses;
The framework is mostly written in Java, with a Python binding so that Python developers can access PowSyBl functionalities as well.
What you will learn during the webinar:
- For beginners: discover PowSyBl's functionalities through a quick general presentation and the notebook, without needing any expert coding skills;
- For advanced developers: master the skills to efficiently apply PowSyBl functionalities to your real-world scenarios.
Accelerate your Kubernetes clusters with Varnish CachingThijs Feryn
A presentation about the usage and availability of Varnish on Kubernetes. This talk explores the capabilities of Varnish caching and shows how to use the Varnish Helm chart to deploy it to Kubernetes.
This presentation was delivered at K8SUG Singapore. See https://feryn.eu/presentations/accelerate-your-kubernetes-clusters-with-varnish-caching-k8sug-singapore-28-2024 for more details.
UiPath Test Automation using UiPath Test Suite series, part 3DianaGray10
Welcome to UiPath Test Automation using UiPath Test Suite series part 3. In this session, we will cover desktop automation along with UI automation.
Topics covered:
UI automation Introduction,
UI automation Sample
Desktop automation flow
Pradeep Chinnala, Senior Consultant Automation Developer @WonderBotz and UiPath MVP
Deepak Rai, Automation Practice Lead, Boundaryless Group and UiPath MVP
UiPath Test Automation using UiPath Test Suite series, part 4DianaGray10
Welcome to UiPath Test Automation using UiPath Test Suite series part 4. In this session, we will cover Test Manager overview along with SAP heatmap.
The UiPath Test Manager overview with SAP heatmap webinar offers a concise yet comprehensive exploration of the role of a Test Manager within SAP environments, coupled with the utilization of heatmaps for effective testing strategies.
Participants will gain insights into the responsibilities, challenges, and best practices associated with test management in SAP projects. Additionally, the webinar delves into the significance of heatmaps as a visual aid for identifying testing priorities, areas of risk, and resource allocation within SAP landscapes. Through this session, attendees can expect to enhance their understanding of test management principles while learning practical approaches to optimize testing processes in SAP environments using heatmap visualization techniques
What will you get from this session?
1. Insights into SAP testing best practices
2. Heatmap utilization for testing
3. Optimization of testing processes
4. Demo
Topics covered:
Execution from the test manager
Orchestrator execution result
Defect reporting
SAP heatmap example with demo
Speaker:
Deepak Rai, Automation Practice Lead, Boundaryless Group and UiPath MVP
Generative AI Deep Dive: Advancing from Proof of Concept to ProductionAggregage
Join Maher Hanafi, VP of Engineering at Betterworks, in this new session where he'll share a practical framework to transform Gen AI prototypes into impactful products! He'll delve into the complexities of data collection and management, model selection and optimization, and ensuring security, scalability, and responsible use.
Epistemic Interaction - tuning interfaces to provide information for AI supportAlan Dix
Paper presented at SYNERGY workshop at AVI 2024, Genoa, Italy. 3rd June 2024
https://alandix.com/academic/papers/synergy2024-epistemic/
As machine learning integrates deeper into human-computer interactions, the concept of epistemic interaction emerges, aiming to refine these interactions to enhance system adaptability. This approach encourages minor, intentional adjustments in user behaviour to enrich the data available for system learning. This paper introduces epistemic interaction within the context of human-system communication, illustrating how deliberate interaction design can improve system understanding and adaptation. Through concrete examples, we demonstrate the potential of epistemic interaction to significantly advance human-computer interaction by leveraging intuitive human communication strategies to inform system design and functionality, offering a novel pathway for enriching user-system engagements.
Builder.ai Founder Sachin Dev Duggal's Strategic Approach to Create an Innova...Ramesh Iyer
In today's fast-changing business world, Companies that adapt and embrace new ideas often need help to keep up with the competition. However, fostering a culture of innovation takes much work. It takes vision, leadership and willingness to take risks in the right proportion. Sachin Dev Duggal, co-founder of Builder.ai, has perfected the art of this balance, creating a company culture where creativity and growth are nurtured at each stage.
The Art of the Pitch: WordPress Relationships and SalesLaura Byrne
Clients don’t know what they don’t know. What web solutions are right for them? How does WordPress come into the picture? How do you make sure you understand scope and timeline? What do you do if sometime changes?
All these questions and more will be explored as we talk about matching clients’ needs with what your agency offers without pulling teeth or pulling your hair out. Practical tips, and strategies for successful relationship building that leads to closing the deal.
Securing your Kubernetes cluster_ a step-by-step guide to success !KatiaHIMEUR1
Today, after several years of existence, an extremely active community and an ultra-dynamic ecosystem, Kubernetes has established itself as the de facto standard in container orchestration. Thanks to a wide range of managed services, it has never been so easy to set up a ready-to-use Kubernetes cluster.
However, this ease of use means that the subject of security in Kubernetes is often left for later, or even neglected. This exposes companies to significant risks.
In this talk, I'll show you step-by-step how to secure your Kubernetes cluster for greater peace of mind and reliability.
PHP Frameworks: I want to break free (IPC Berlin 2024)Ralf Eggert
In this presentation, we examine the challenges and limitations of relying too heavily on PHP frameworks in web development. We discuss the history of PHP and its frameworks to understand how this dependence has evolved. The focus will be on providing concrete tips and strategies to reduce reliance on these frameworks, based on real-world examples and practical considerations. The goal is to equip developers with the skills and knowledge to create more flexible and future-proof web applications. We'll explore the importance of maintaining autonomy in a rapidly changing tech landscape and how to make informed decisions in PHP development.
This talk is aimed at encouraging a more independent approach to using PHP frameworks, moving towards a more flexible and future-proof approach to PHP development.
GDG Cloud Southlake #33: Boule & Rebala: Effective AppSec in SDLC using Deplo...James Anderson
Effective Application Security in Software Delivery lifecycle using Deployment Firewall and DBOM
The modern software delivery process (or the CI/CD process) includes many tools, distributed teams, open-source code, and cloud platforms. Constant focus on speed to release software to market, along with the traditional slow and manual security checks has caused gaps in continuous security as an important piece in the software supply chain. Today organizations feel more susceptible to external and internal cyber threats due to the vast attack surface in their applications supply chain and the lack of end-to-end governance and risk management.
The software team must secure its software delivery process to avoid vulnerability and security breaches. This needs to be achieved with existing tool chains and without extensive rework of the delivery processes. This talk will present strategies and techniques for providing visibility into the true risk of the existing vulnerabilities, preventing the introduction of security issues in the software, resolving vulnerabilities in production environments quickly, and capturing the deployment bill of materials (DBOM).
Speakers:
Bob Boule
Robert Boule is a technology enthusiast with PASSION for technology and making things work along with a knack for helping others understand how things work. He comes with around 20 years of solution engineering experience in application security, software continuous delivery, and SaaS platforms. He is known for his dynamic presentations in CI/CD and application security integrated in software delivery lifecycle.
Gopinath Rebala
Gopinath Rebala is the CTO of OpsMx, where he has overall responsibility for the machine learning and data processing architectures for Secure Software Delivery. Gopi also has a strong connection with our customers, leading design and architecture for strategic implementations. Gopi is a frequent speaker and well-known leader in continuous delivery and integrating security into software delivery.
9. Narrow Your Focus
• Keep Target in Sight
• Keep your eye on the correct
moving object
• Don’t overtake info, no need
to account for everything
that happens on the farm
10. Eggs from 50 layers
• Purchase 18 wk old
pullets
• Kept for 52 weeks
• 90 lb feed/layer/yr
• 22 dozen eggs/yr/bird
• $15/hour for labor
• 0% mortality (for
simplicity)
• Shelter already in
place
• Sold from front porch
50 Meat Birds
• Purchase day old
chicks
• Raised for 8 weeks
• 25lb feed/meat bird
• $15/hour for labor
• Average sale weight:
4.5 lb
• 10% mortality (45 birds
sold)
• Shelter already in
place
11. Lessons Learned
• Scrutinize big numbers first
• Labor is often a big budget item
• We all only have 24 hours in a day, use
wisely
• If your leg breaks, you will need to pay for
labor
• Budgets can look profitable without labor
expense
• Efficiencies of scale may help profitability
• Need extra cushion for overhead expenses,
bad years….
12. I am not a
Capitalist-Pig-Dog-ShysterBut:
If all remains the same, a 10% increase in sales
price translates to a 10% increase in Net
Profit
Price inelasticity is obvious barrier
14. How much does it cost to :
•
•
•
•
•
•
Run a tractor?
Produce 500 transplants?
Vend at a Farmers’ Market?
Deliver to wholesale accounts?
Irrigate a field?
Pay for all the overhead costs ? (like
mortgage, taxes, phone, advertising,
office supplies, and labor for upkeep
and managing your business).
15.
16. Worksheet 1
Copyright Richard Wiswall 2009
Labor, Delivery, Farmers Market, Overhead Costs
to use in calculating Crop Budgets
Labor Costs:
Manager
Average Hourly rate:
employee taxes: 7.51%
Worker Comp: 8%
Non assigned time: 10%
SEP IRA 25%
10.00
0.75
0.80
1.00
Crew
10.00
0.75
0.80
1.00
Labor Costs/hour:
12.55
12.55
Delivery Costs
Composite crew 1:3
10.00
0.75
0.80
1.00
0.00
12.55
Labor Costs are critical to calculating crop budgets. The farm's labor
cost per hour is more than the employee's wage when employer
taxes, workers comp insurance and non-production time (meetings,
cleanup, maintenance) is added in. The SEP IRA is an optional
retirement plan, an added cost for certain qualifying employees. See
Chapter 6. If a farm manager is at a different payrate, a composite
rate per hour can be used. This worksheet assumes a ratio of 3 crew
workers to 1 manager. For simplicity, all labor is paid the same rate in
these crop budgets.
Produce
Labor: Load truck & travel
Vehicle cost .40/mile
25.10
8.00
@12.55/hr
20 miles round trip
Cost for one delivery
% of crop to total load
x number of trips
Delivery cost for crop per season
33.10
10%
12
39.72
Delivery Costs can be determined for: each trip, total trips per season,
or the percentage cost of each product delivered. If a delivery
contains equal amounts of carrots and beets, 50% of the delivery cost
would be allotted to each crop.
for example
for example
Farmers Market Costs:
Labor: load truck(s)
Labor: travel to mkt, set up
Labor: market vending
Labor: pack up, travel home,
unpack, tally sales
Vehicle(s) cost at .40/mile
Rental fees
Amortized FM equipment
Subtotal: cost for one Market
Calculate for ONE Market
1 hr (2 people)
4 hrs "
8 hrs "
12.55
50.20
100.40
The base cost for attending one market is constant irrespective of the
amount of product sold (unless labor needs change). Gross sales at
market must be higher than the cost. Otherwise, you are losing
money or personally subsidizing the market cost by not paying
yourself the going labor rate. Sales need to be high enough to justify
the cost of vending at market. If they are not, strive for higher sales,
or pursue alternative selling venues, such as CSA programs or
wholesale accounts.
246.47
37.65
8.00
30.00
7.67
3 hr
"
20 miles round trip
per market
scales 1500, umbrellas400, tables200, signs200=
$2300/15yr useful life/20mkts per season=$7.67 per mkt
# Markets crop is sold
Total costs for # Markets
Crop sales / Total FM sales
Crop sales % x Total Mkt costs
6
varies by crop
1478.82
5%
varies by crop
73.94
The total expense for equipment needed at market is amortized over
the useful life of the equipment and prorated for each market. As with
Delivery Costs above, a percentage of farmers market expense can
be assigned to different crops. The important message, though,
regarding farmers market costs is that each market costs a certain
amount to attend, and that farmers market sales must justify that
expense.
Enter in Crop Enterprise Budget under
Marketing Costs: Farmers' Mkt expense
Overhead Costs (annual)
Overhead costs are ones not accounted for under Delivery Costs, Farmers Market Costs, Greenhouses, Tractors, Implements or Irrigation costs. Overhead costs are spread out
over the entire farm operation and prorated to each crop or enterprise. In these worksheets, 50% of overhead expenses are apportioned to the 5 acres in cultivation, 25% to the
bedding plant greenhouse, and 25% to the in-ground tomato greenhouse. Allotment of overhead costs is somewhat subjective, but all overhead costs must be assigned. Overhead
expenses allotted to the cultivated 5 acres is further broken down to overhead expense per two 350' long beds, the equivalent of 1/10 acre.
Mortgage annual payment
Depreciation
Property Taxes
Insurance
Office
Website
Travel/conferences
Professional services
Electric
Landfill
Telephone
Advertising
Shop supplies, misc. repairs
Labor: management
Labor: office
Labor: maintenance
Total Overhead Costs:
Overhead per Two 350' beds:
Overhead per Greenhouse
600.00
2000.00
800.00
4000.00
1100.00
400.00
300.00
700.00
600.00
250.00
550.00
200.00
500.00
3263.00
3263.00
653.00
Farm % of total bill. Does not include house and housesite portion.
To account for replacement costs, excluding machinery in Worksheet 4
farm %
3000 health, 1000 fire; not vehicle or Workers Comp.
Supplies, postage, subscriptions
$20/month plus fees and maintenance
CPA, organic certification, snowplowing
farm %, w/o greenhouse electrical use
farm %
Tractor, implement, irrigation repairs already accounted for in Worksheet 4
Average 5hrs/week: 260 hrs/year. Annual labor for overseeing farm operation
Average 5hrs/week: 260 hrs/year. Annual labor for office duties.
Average 1hr/week: 52 hrs/year. Annual labor for non assigned maintence work.
19179.00 Allocation: GH Seedlings $2397, GH Tomatoes $2397, 5A (100 beds) $14,385= $144 per bed
288.00
2397.00
Per two 350' beds, for 5A (100 beds)planted to row crops. Enter on line 67 on crop budget.
Per 21' x 96' hoophouse: one for bedding plants ,one for greenhouse tomatoes
17. Worksheet 2
Copyright Richard Wiswall 2009
Greenhouse Flat Costs for Calculating Worksheet 3 Bedding Plant Cost
Costs of Soil, Plastic containers and Labor filling
In order to calculate what a farm-raised seedling costs, we first need to know the cost of the plastic container, the cost of the soil in the
container and the cost of labor to fill the container. Below is a table that lists common pack sizes used in greenhouse production and the
associated costs with that size. A 1020 is a 10" x 20" open plastic tray. One 1020 will hold 18 3.5" square pots. 606 stands for six 6 packs per
1020 tray. An 804 is a 4 pack sized to fit eight packs per 1020. 128 and 98 stand for the number of molded individual cells in a 1020 sized tray.
Reuse of plastic containers will lower costs.
Container size
3.5" square pot
606
804
806
1020
128
98
6" pot: Each Pot
A
B
C
D: C/B
E
F
G: F/G
H: A+D+G
single use # containers price per soil cost in # flats filled labor cost cost of labor Total cost of plastic, soil
cost/flat
per yard soil yard soil
container per hour
per hour to fill flat and labor (w/o 1020)
1.62
125
105
0.84
40
12.55
0.31
2.77
0.39
144
105
0.73
60
12.55
0.21
1.32
0.39
144
105
0.73
60
12.55
0.21
1.32
0.39
171
105
0.61
60
12.55
0.21
1.21
0.72
100
105
1.05
60
12.55
0.21
1.98
0.95
216
105
0.49
60
12.55
0.21
1.64
0.95
216
105
0.49
60
12.55
0.21
1.64
0.28
350
105
0.30
240
12.55
0.05
0.63
18. Worksheet 3
Greenhouse Costs
Copyright Richard Wiswall 2009
Two types of greenhouse operations are portrayed: one for growing bedding plants and one for growing in-ground tomatoes. Both greenhouses are 21' x 96' hoop houses with 2
layers of plastic that are inflated. Each has a furnace, exhaust fan, intake shutters and automatic controls. The longer-lived structure and equipment costs are totaled and divded
by their useful life (20 years). Annual costs of heating fuel, electricity, and 5 year plastic covers are listed separately. Overhead expenses from Worksheet 1 (25% of total
overhead) are added in after the Annual expense subtotal. The bedding plant greenhouse is more involved and listed first. The bedding plant greenhouse benches hold 1000 flats
(1020 size), and two flats can occupy the same bench space during the course of the bedding plant season (one cycling of inventory). Worksheet 2 lists costs for plastic
containers, soil, and the labor to fill the containers, as shown under Production costs per flat . Other production costs per flat are listed, with optional categories like thinning and
fertilizing left blank for simplicity. The total cost per flat is a very useful number, and will be used in the Crop Budgets when crops are raised from transplants.
Bedding Plants, March 1st start up
Structure cost: 21' x 96', 2 layer poly covered hoop house
Frame cost 2400, install 1004, (80 hr), wood 300
3704.00
Furnace 2000,fans 800, installation 377 (30hr)
3177.00
Benches 500, plumbing 400, irrig 400
1300.00
GH 1020 capacity: 1000 x 2
Total Annual exp/total flats=
2000 one cycling of bench space
2.59 per flat
GH annual cost/flat
2.59
Production costs per flat
Total Structure cost
8181.00
Cost of plastic flat, soil, labor filling
Cost of seed in flat
divide by # years of useful life
Annual structure cost
20
409.05
Labor to seed flat:12flats/hr=1.05/flat
If needed:subtotal/#finished trays
2.59
2.59
804s
3.5" sq. pots
1.32
2.77
1.00
1.00
1.05
1.05
128s
1.64
1.00
1.05
Labor: TP to one flat: 10flat/hr=1.26
2nd plastic flat, soil, labor filling
Subtotal for TP flat
Other Annual expenses:
Labor moving: 60/hr=.21/flat each move
Poly cost 600, installation 100 (8 hr), /5 years
Electricity
5 x $15/month
Fuel for heat
300g @3/g
Watering labor 2hr x 50 times=100hrs
140.00
75.00
900.00
1255.00
Subtotal Annual expenses
Farm Overhead Allocation from Worksheet 1
Total Annual expenses with overhead allotment
2370.00
2397.00
5176.05
0.21
0.21
0.21
6.17
7.62
6.49
Labor to thin: 100/hr=.13/flat
Fertilizer cost: .02/flat
Fertilizer labor: .05/flat
Total Cost per Flat
Greenhouse Tomatoes, transplanted in ground April 1 in northern U.S.
The annual structure cost and other annual expenses are similar to the bedding plant greenhouse shown above. Overhead costs from Worksheet 1 (25% of total overhead) are
added in after Total Annual expenses. This greenhouse is used to grow tomatoes in the ground for an early and extended harvest of top quality fruit. Tomato plants are
transplanted from 3.5" pots into the greenhouse soil around April 1st. Plants are irrigated with drip lines on a battery operated water timer. The ground is mulched to reduce
weeding labor. Heating and venting are on thermostatic controls. Roll up sidewalls promote air flow when outside temperatures permit. Tomato plants are trellised from strings
hanging from the greenhouse frame. A separate crop budget is calculated for greenhouse tomatoes, shown in the Crop Budget section. The total annual expense seen below will
be used as an expense in the Crop Budget.
Structure cost: 21' x 96' 2 layer poly covered hoop house
Frame cost 2400, installation 1004, wood 300
3704.00
Furnace 2000, fans 800, install 377 (30 hrs)
3177.00
Total structure cost
6881.00
Annual structure cost :divide by 20 years
344.05
Other Annual expenses:
Poly cost 600, install 100 (8 hr), /5 years
Electricity
6 x $15/month
Fuel for heat
200g at $3/g
Subtotal annual expenses
140.00
90.00
600.00
830.00
Farm Overhead Allocation from Worksheet 1
Total Annual Expenses
2397.00
3227.00
19. Worksheet 4
Tractor, Implement, Irrigation Costs
Copyright Richard Wiswall 2009
Tractor Costs
The hourly cost of a tractor is calculated by first dividing the purchase price of the tractor by the tractor's years of useful life. Next, annual
expenses of repairs and fuel are added in, giving you the total cost to own and operate the tractor per year. Divide this total annual cost by
the number of hours the tractor runs in a year, and the result is an average cost per tractor hour. I was surprised at first at how inexpensive
running a tractor can be, but remember, a tractor used 50 hours a year has a much higher hourly rate than a tractor used 300 hours per year.
The three tractors shown below are ones that I have owned. The numbers are based on personal experience. Annual repairs are listed as an
average: some years are expensive, some are not.
Tractor model
JD 2240
Ford 4000
Cub
Original Cost/useful life=
Annual Cost, w/o interest
Average Annual Repairs
Annual Fuel Cost: @3/gallon
7000/25
280.00
500.00
480.00
4400/25
176.00
300.00
480.00
1000/25
40.00
200.00 some years $0, some lots
80.00
1260.00
956.00
320.00
Annual Hours used
200
300
60
Tractor cost/hour
6.30
3.19
5.33
Tractor driver hourly rate
12.55
12.55
12.55
Tractor with driver: $/hour
18.85
15.74
17.88
Total Annual cost
Implement Costs
Tracking various implements' costs is similar to tractors but without the fuel expense. Some implements have lots of moving parts
(combines, manure spreaders) and cost more to operate than implements like a bedlifter that has no moving parts. I list three of the more
common and costly implements to run. Because a farm may have numerous implements, I make a note below these three implement costs
for easy calculations to use as a short cut for budget work.
PTO Tiller
Original cost/Useful life=
Annual cost, w/o interest
Implement annual repairs, ave.
Annual hours used
Implement Cost/hour
Manure Spreader
Bush hog
800/25
32.00
20.00
40
1.30
1100/20
55.00
20.00
20
3.75
600/20
30.00
20.00
50
1.00
A $500 simpler implement with a useful life of 25 years costs about $20/year to own. Figure $.50/hour for quick calculating.
A $1000 simpler implement with a useful life of 25 years costs about $40/year to own. Figure $1/hour for quick calculating.
Irrigation Costs
Irrigation cost takes into account the annual equipment cost and any repair expense (similar to tractors and implements) and also time for
setup, running, and taking down (or moving) the system, calculated for the area that is watered each time. The example below shows an
irrigation system that waters an acre in area, and is used four times per season. The irrigation cost per acre is then calculated for 1/10 of an
acre, or two 350' long beds.
Cost of pipe, pump,sprinklers
Useful life in years
Annual equipment cost
Average Annual repairs
Total Annual Cost
Total annual cost/uses per season=
Setup, takedown labor per irrig. area
4 hours tractor use
Irrigation costs/irrigated area, each use
Irrigation costs for two 350' beds, each use
4600.00
25
184.00
50.00
234.00
58.50
75.30
25.20
159.00
15.90
Used PTO pump, 4" and 2" alum. pipe for 1 acre
say $250 every 5 years
4 uses per season
1A coverage, 6hrs total @ 12.55/hr
at $6.30/hr tractor only
per acre, each use
per two 350' beds, each use; $7.53 Labor, $8.37 Machinery
20. Crop Enterprise Budget
Crop year:
Copyright Richard Wiswall 2009
Crop:
Unit area: Two 350' beds
Bed feet or acre: 700' or 1/10A
Rows/bed&plant spacing: 2 rows/bed, 12" transplant spacing
Broccoli
Note: 20 350' beds= 1 acre
and specify: early, mid, late
Today's Date:
Costs in $:
Remember to Prorate to unit area
$
$
$
Field:
Prepare Soil:
Labor cost
NOTES: Labor at $12.55/hr. See Worksheet 1
Disk 1x
Chisel 1x
Rototill 1x,2x
Bedform 2x
Fertilizer
Manure, Compost
Other
Plastic mulch
1.26
2.51
Machinery cost Product cost
0.73
0.74
Figures below are for Two 350' beds
1A at a time: 1 hr total for 20 beds = 6 min/2 beds; $.1.26L, $..63+.10=.73M
w/ JD, See Worksheet 4
.5A at a time:1hr total for 10 beds = 12 min/2 beds; $2.51L, $..64+.10=.74M
w/ Ford 4000
.5A at a time: 2 hr total for 10 beds = 24 min/2beds; $5.02L, $1.28 tractor + .52 tiller = $1.80M
5.02
1.26
2.52
w/ Ford 4000
.5A at a time: 1 hr total for 10 beds = 12 min/2beds; $2.51L, $.64+.10=.74M for ONE pass
1.48
0.68
1.02
w/ Ford 4000
10.00 4-3-3 500#/A at a time: I hour total for 20 beds = 6 min per 2 beds; $.1.26L, $.63+.05=.68M, $10Pr, w/ JD
25.00 1A at a time:Compost at $25/yd, 10yds/A: 2 hr total for 20 beds = 12 min per 2 beds: $2.51L, 1.26+ .75 = $2.01M, $25Pr, w/ JD
.5A at a time: 1.5hr/A laying= 10 min per 2 beds; $2.09L, $.53+.17=.70M, $20Pr, w/ Ford 4000
Seed/TPlant:
Seeding in field
Cost of transplants
Transplanting labor
2 beds at a time: 30 min/2beds total= $6.28L
84.00 $6.49/128= .06/plant
25.23
1400 plants at $.06
3 row by hand: 3hr/2beds total; $37.65L
only rows/bed
2 row w/ transplanter: 6 beds at a time; 1 hr prep plants, 1.5hrx3 people TP, 2hr machinery; for 2 beds $22.78L, 2.11+.66=$2.77M
Cultivation:
Reemay on/off
Hoeing 1x,2x, 3x
Handweeding 1
Handweeding 2
Handweeding 3
Straw mulch
Irrigating 1x
Tractor cult. 6x
Sidedressing
Spraying
Flame weeding
Other
Subtotals
Harvest:
For 2 beds: $105/3 uses=35$Pr, .75 hr laying: $9.41L
12.55
25.10
at 12.55/hr: average 1hr/2beds
$12.55/2 beds
at 12.55/hr: average 8hr/2beds
$100.40/2beds
at 12.55/hr: average 4hr/2beds
$50.20/2beds
at 12.55/hr: average 2hr/2beds
$25.10/2beds
40 bales at $3, 1hr/2beds; $12.55L, $120.00Pr
7.53
7.56
8.37
3.48
2.51
0.74
93.05
17.24
$7.53L, $8.37M per 2 beds, each use, w/ JD
1A at a time: 1 hour/A = 6 min/2beds; $1.26L, $.53+.05=.58M per pass, w/ Cub mostly
Spin 500# 4-3-3/A, 1 hr total/20 beds= 6min/2beds; $.1.26L,$.32+.05=.37M, $10Pr, w/ Ford 4000
6.00 1 hr/.5A total time= 12 min/2beds; $2.51L, $.64+.10=$.74M, $6Pr, w/ Ford 4000
10 beds/hr = 12 min/2beds; $2.51L, $.64+.10=.74M, $6Pr, w/ Ford 4000
125.00
Total yield for two 350' beds =
Total hours to harvest two 350' beds
=
235.29 Pre-harvest costs for two beds
36 cs
6 hr
season ave: 500 bunches, 14 count case
at 12.55/hr
6 hr
at 12.55/hr
12 case/hour packing
6 case/hour
NOTES:
Field to packhouse
Packhouse to cooler
Bags, boxes, labels
75.30
37.65
Delivery
30.12
9.60
See Worksheet 1
2.09
0.70
6 beds at a time: 10 min/2beds; $2.09L, .53+.17 = $.70M, w/ Ford 4000
1.26
1.26
0.73
0.68
8.00 1A at a time: 1 hr/20 beds = 6min/2beds; $1.26L, $.63+.05=.68M, $8Pr, w/ JD
19.44 .25/bag, 1.00/box, .07/label
1.07 per box/ 2 uses
Post Harvest:
Mow crop
Remove mulch
Disking
Sow cover crop: spinner
Sow cover crop: Brillion
Other
Subtotals:
1 hour /2beds: $12.55L
$1.26L, $.63+.10=.73M w/ JD, see disking above.
1A at a time: 2 hr/20 beds = 12 min/2beds; $2.51L, 1.26+.20=$1.46M, 8Pr, w/ JD
240.73
28.95
152.44
=
422.12 Harvested cost for 2 beds
Marketing costs:
Labor: sales calls for
season(for this crop only)
Commissions
Farmers Mkt expense
ave. 10 min/week for 3 weeks: .5 hr
60.24
4.70
Total Crop costs:
307.25
33.65
Overhead costs:
288.00
Apportionment for two 350' beds. See Worksheet 1
790.34
Total costs per two 350' beds
6.28
Commissions, if any, to growers' coop, broker or salesperson
9.00 See Worksheet 1
161.44
=
502.34 Total Crop costs
Total Costs
Total costs & Overhead:
Sales:
Retail:
Wholesale:
Other:
Total units
Total sales:
# of units
price per unit Total $
12.00
31.50
378.00
24.00
22.00
528.00
0.00
36.00
906.00 For two 350' beds
Net Profit:
Total sales- total costs=
Net Profit/Acre:
Cost/unit:
Net profit/unit:
115.66
1156.60
Net profit for two 350' beds (1/10 acre)
Standardize to one acre
21.95
Total cost/total units
3.21
Net profit/total units
21. Crop Enterprise Budget
Crop year:
Copyright Richard Wiswall 2009
Crop:
Kale: bunches Unit area:
Two 350' beds
Note: 20 350' beds= 1 acre
Bed feet or acre: 700' or 1/10A
and specify: early, mid, late
Today's Date:
Rows/bed&plant spacing:
2 rows/bed, 24" spacing, Tplanted
Costs in $:
Remember to Prorate to unit area
$
$
$
Field:
Prepare Soil:
Labor cost
NOTES: Labor at $12.55/hr. See Worksheet 1
Disk 1x
Chisel 1x
Rototill 1x,2x
Bedform 2x
Fertilizer
Manure, Compost
Other
Plastic mulch
1.26
2.51
Machinery cost Product cost
0.73
0.74
Figures below are for Two 350' beds
1A at a time: 1 hr total for 20 beds = 6 min/2 beds; $.1.26L, $..63+.10=.73M
w/ JD, See Worksheet 4
.5A at a time:1hr total for 10 beds = 12 min/2 beds; $2.51L, $..64+.10=.74M
w/ Ford 4000
.5A at a time: 2 hr total for 10 beds = 24 min/2beds; $5.02L, $1.28 tractor + .52 tiller = $1.80M
5.02
1.26
2.52
w/ Ford 4000
.5A at a time: 1 hr total for 10 beds = 12 min/2beds; $2.51L, $.64+.10=.74M for ONE pass
1.48
0.68
1.02
w/ Ford 4000
10.00 4-3-3 500#/A at a time: I hour total for 20 beds = 6 min per 2 beds; $.1.26L, $.63+.05=.68M, $10Pr, w/ JD
25.00 1A at a time:Compost at $25/yd, 10yds/A: 2 hr total for 20 beds = 12 min per 2 beds: $2.51L, 1.26+ .75 = $2.01M, $25Pr, w/ JD
.5A at a time: 1.5hr/A laying= 10 min per 2 beds; $2.09L, $.53+.17=.70M, $20Pr, w/ Ford 4000
Seed/TPlant:
Seeding in field
Cost of transplants
Transplanting labor
2 beds at a time: 30 min/2beds total= $6.28L
42.00 $6.49/128= .06/plant
25.23
700 plants
3 row by hand: 3hr/2beds total; $37.65L
2/3 of 3 row time
2 row w/ transplanter: 6 beds at a time; 1 hr prep plants, 1.5hrx3 people TP, 2hr machinery; for 2 beds $22.78L, 2.11+.66=$2.77M
Cultivation:
Reemay on/off
Hoeing 1x,2x, 3x
Handweeding 1
Handweeding 2
Handweeding 3
Straw mulch
Irrigating 1x
Tractor cult. 6x
Sidedressing
Spraying
Flame weeding
Other
Subtotals
Harvest:
For 2 beds: $105/3 uses=35$Pr, .75 hr laying: $9.41L
25.10
50.20
25.10
at 12.55/hr: average 1hr/2beds
$12.55/2 beds
at 12.55/hr: average 8hr/2beds
$100.40/2beds
at 12.55/hr: average 4hr/2beds
$50.20/2beds
at 12.55/hr: average 2hr/2beds
$25.10/2beds
40 bales at $3, 1hr/2beds; $12.55L, $120.00Pr
7.53
7.56
8.37
3.48
5.02
1.48
158.31
17.98
$7.53L, $8.37M per 2 beds, each use, w/ JD
1A at a time: 1 hour/A = 6 min/2beds; $1.26L, $.53+.05=.58M per pass, w/ Cub mostly
Spin 500# 4-3-3/A, 1 hr total/20 beds= 6min/2beds; $.1.26L,$.32+.05=.37M, $10Pr, w/ Ford 4000
12.00 1 hr/.5A total time= 12 min/2beds; $2.51L, $.64+.10=$.74M, $6Pr, w/ Ford 4000
10 beds/hr = 12 min/2beds; $2.51L, $.64+.10=.74M, $6Pr, w/ Ford 4000
89.00
Total yield for two 350' beds =
Total hours to harvest two 350' beds
=
265.29 Pre-harvest costs for two beds
2800 bunches
18.7 hr
150 bunch/hr
at 12.55/hr
18.7 hr
at 12.55/hr
120 bunches/hr: 23.3 hr
NOTES:
Field to packhouse
Packhouse to cooler
Bags, boxes, labels
Delivery
234.69
292.42
166.92 .25/bag, 1.00/box, .07/label
156 18ct boxes at 1.07
30.12
9.60
See Worksheet 1
2.09
0.70
6 beds at a time: 10 min/2beds; $2.09L, .53+.17 = $.70M, w/ Ford 4000
1.26
1.26
0.73
0.68
8.00 1A at a time: 1 hr/20 beds = 6min/2beds; $1.26L, $.63+.05=.68M, $8Pr, w/ JD
Post Harvest:
Mow crop
Remove mulch
Disking
Sow cover crop: spinner
Sow cover crop: Brillion
Other
Subtotals:
1 hour /2beds: $12.55L
$1.26L, $.63+.10=.73M w/ JD, see disking above.
1A at a time: 2 hr/20 beds = 12 min/2beds; $2.51L, 1.26+.20=$1.46M, 8Pr, w/ JD
720.15
29.69
263.92
=
1013.76 Harvested cost for 2 beds
Marketing costs:
Labor: sales calls for
season(for this crop only)
Commissions
Farmers Mkt expense
ave. 10 min/week for 3 weeks: .5 hr
6.28
60.24
4.70
Total Crop costs:
786.67
34.39
Overhead costs:
288.00
Commissions, if any, to growers' coop, broker or salesperson
9.00 See Worksheet 1
272.92
=
1093.98 Total Crop costs
Apportionment for two 350' beds. See Worksheet 1
Total Costs
Total costs & Overhead:
Sales:
Retail:
Wholesale:
Other:
Total units
Total sales:
1381.98
Total costs per two 350' beds
# of units
price per unit Total $
460.00
2.00
920.00
2340.00
1.25
2925.00
0.00
2800.00
3845.00 For two 350' beds
Net Profit:
Total sales- total costs=
Net Profit/Acre:
2463.02
24630.20
Net profit for two 350' beds (1/10 acre)
Standardize to one acre
Cost/unit:
0.49
Total cost/total units
Net profit/unit:
0.88
Net profit/total units
22. Standards Page
Rates of commonly performed tasks
Copyright Richard Wiswall 2009
Based on experience in northeast USA, rates may vary.
Task
Rate
Other
Disk
.5 hr/A
Plus .5hr attaching, travel, detaching
Chisel beds
1.5 hr/A
Plus .5hr attaching, travel, detaching
Rototill beds
3.5hr/A
Plus .5hr attaching, travel, detaching
Bedform beds
1.5hr/A
Plus .5hr attaching, travel, detaching
Spinner spread fertilizer
1.5hr/A
Plus .5hr attaching, travel, detaching
Manure Spreading
1.5hr/A
Plus .5hr attaching, travel, detaching
Lay plastic mulch
1hr/A
Plus .5hr attaching, travel, detaching
Soil Preparation
Seed/Transplant
15 min/3 row 700'bed
Plus .25hr getting seed, travel, calibrating seeder
2-3 units bolted together
Planet Jr. push seeder
5 min/700'bed
Plus .5hr getting seed, travel, selecting plates
Hand Transplant 3 row
3hr/700' bed
Earthway push seeder:
Cultivation
Row cover on/off
45 min/700' bed
Hoeing
1 hr/700' bed
Handweeding
10-20hr/700' bed
Apply straw mulch
2-5 hr/700' bed
Irrigate 1A: set up, take down
3-6 hr/A
depends on: if pump is already set, how far a move
Cultivate with tractor
1hr/A
depends some: on speed, travel, adjustment
Topdress fertilizer
20 min/A
Plus 40 min. set up, load fertilizer, travel, rinse, take off
Spray with tractor
45 min/A
Plus I.25 hr set up, mix tank, travel, rinse, take off
Flame weed with tractor
1hr/A
Plus 1hr set up, travel, take off
Vegetables & Fruits:
per hour picking
yield per 700' bed
wash/pack per hour
Beans: bush
9-15 lb/hr
500 lb
300 lb/hr
Beets: bunches
60 bunch/hr
1100 bunches
120 bunch/hr
Beets: roots
140 lb./hr
60 25 lb bags
10 25 lb bags/hr
Broccoli
6 case/hr
36 14ct cases
12 case/hr
Cabbage
8 50lb case/hr
40 50lb cases
10 50lb case/hr
Carrots: bunches
50 bunch/hr
1100 bunches
120 bunch/hr
Carrots: roots
100 lb/hr
80 25 lb bags
7 25 lb bags/hr
Celeriac: roots
12 15lb box/hr
120 15lb boxes
10 15lb box/hr
110 dozen
field packed
WIDE variation
Harvest
Corn: sweet
Cucumbers: slicing
bedlifter dug
25 50lb boxes
Kale
150 bunches/hr
2800 bunches
120 bunches/hr
Leeks
40 bunches of 3 /hr
1200 bunches of 3
30 bunches/hr
Lettuce: heads
5 24ct case/hr
ave: 45-58 cs
5 24ct case/hr
Onions: full size
20 50lb bags/hr
40 50lb bags
10 50lb bags/hr
Parsnips
125 lb/hr
60 25 lb bags
8 25 bags/hr
Peas: snap
bedlifter dug
320 lbs.
Peppers: green bell
6-10 bushel/hr
40 bushels
15 bushel/hr
Potatoes
5 50 lb case/hr
25 50 lb cases
5 50 lb case/hr
Spinach
ave: 30-40 lb/hr
700 lb
120 lb/hr
Squash: summer
8 20 lb case/hr
60 20 lb boxes
15 20 lb case/hr
Squash: winter
4 45 lb cases/hr
30 45lb cases
6 45 lb case/hr
Swiss chard: bunches
60 bunches/hr
2000 bunches
90 bunch/hr
Tomatoes; field
100 20lb boxes
Tomatoes: 21' x 96' greenhouse
4500 lbs A+ grade
Herbs:
Basil: bunches
ave: 60 bunch/hr
4000 bunches
600 bunch/hr
Cilantro: bunches
100-200 bunches/hr
2000 bunches
400-800 bunch/hr
Dandelion: greens
90 bunches/hr
2000 bunches
200 bunch/hr
Dandelion: roots
27 lb./ hour
445 lb.
125 lb./ hour washing
Dill: bunches
100-150 bunches/hr
2000 bunches
400-800 bunch/hr
Echinacea: 3rd year roots
18 lb./ hr
525 lb.
15 lb./hr
Parsley: bunches
60 bunches/hr
12,600 bunches
200-400 bunch/hr
Valerian: roots
25 lb/hr
250 lb
25 lb/hr
chain dug
chain dug
chain dug
25. Balance Sheet
on December 31, 2012
Assets
Liabilities
Current assets
Current Liabilities (due in less
than 12 months)
Farm checking
Savings account
Accounts receivable
Crop and feed inventory
Farm supplies on hand
Other:
Total Current Assets
Operating loan balance
Line of Credit balance
Credit card balance
Other:
Total Current Liabilities
Intermediate Assets
Farm machinery
Farm vehicles
Livestock
Retirement accounts
Other:
Total Intermediate Assets
Intermediate Liabilities
Tractor loan balance
Truck loan balance
Other:
Long term Assets
Farmland
Farm buildings
Farmhouse
Other:
Total Long term Assets
Long term Liabilities
Long term loan 1 balance
Long term loan 2 balance
Other:
Total Assets
Total Intermediate Liabilities
Total Long term Liabilities
$
Total Liabilities
$
Net Worth $
NOTES: Use back of sheet for inventory and other notes, if needed.
26. Profit and Loss Statement
Income
Sales: Wholesale
CSA
Farmers Market
Total Sales
Expenses
Advertising
Donations
Fertilizer
Fuel and Oil
Greenhouse Supplies
Insurance: farm share
Interest expense: farm share
Internet, web site
Livestock expenses
Miscellaneous
Office
Payroll
Professional services
Rent paid
Repairs and maintenance
Seed, Plants purchased
Supplies
Taxes: farm share
Trucking, freight
Utilities: farm share
Total Expenses
Net Profit
January 1, 2012 through December 31, 2012
27. Cash Flow Projection
2012 to 2016
2012
Income
Sales: Wholesale
CSA
Farmers Market
Total Sales
Expenses
Advertising
Donations
Fertilizer
Fuel and Oil
Greenhouse Supplies
Insurance: farm share
Interest expense: farm share
Internet, web site
Livestock expenses
Miscellaneous
Office
Payroll
Professional services
Rent paid
Repairs and maintenance
Seed, Plants purchased
Supplies
Taxes: farm share
Trucking, freight
Utilities: farm share
Capital Purchases
Total Expenses
Net Profit
2013
2014
2015
2016