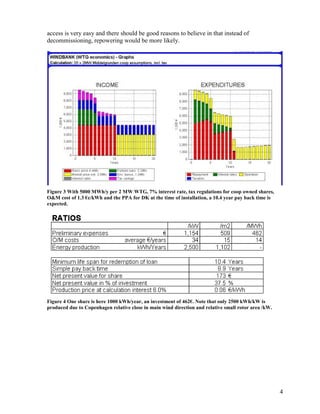
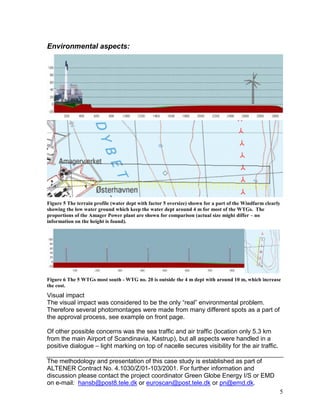
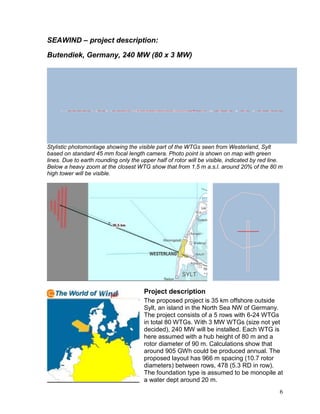
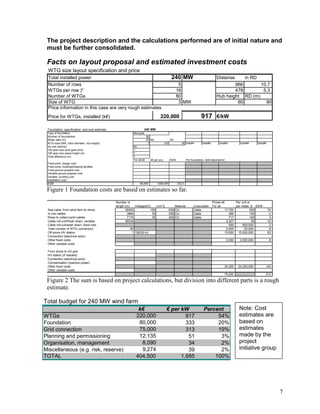
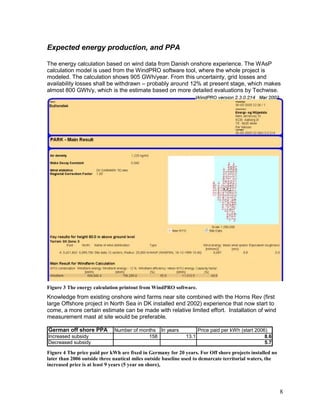
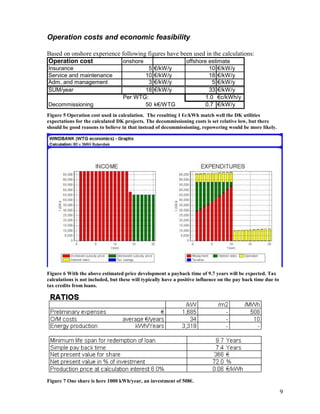
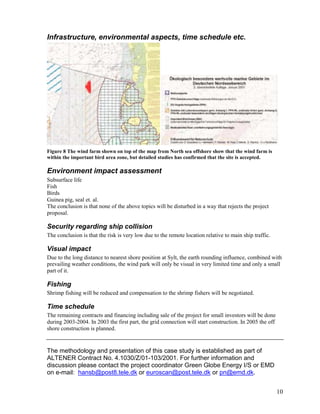
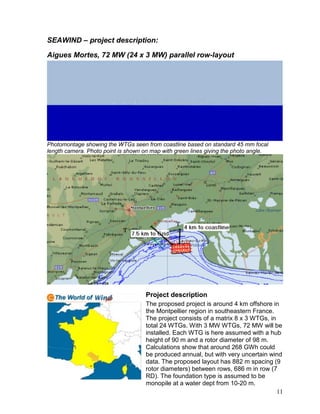
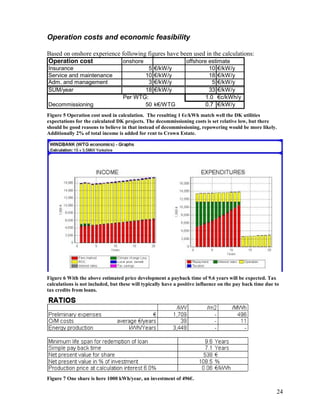
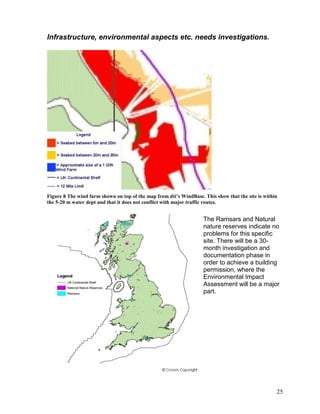
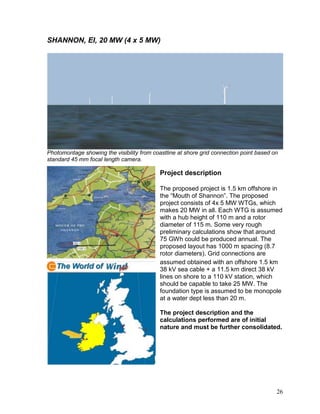
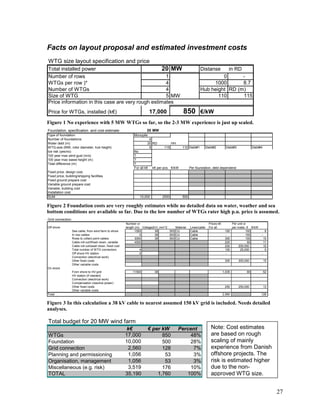
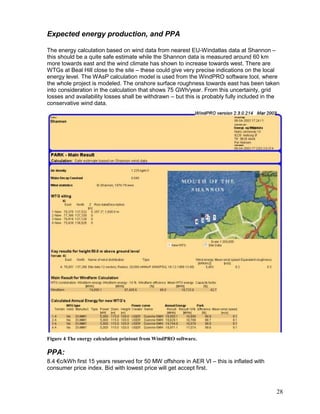
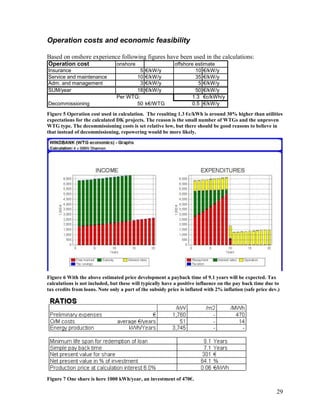
SEAWIND – project descriptions


Following cases in a pre-feasibility study format:


1.   MIDDELGRUNDEN, Denmark, 40 MW (20 x 2 MW)
2.   BUTENDIEK, Germany, 240 MW (80 x 3 MW)
3.   AIGUES MORTES, France 72 MW (24 x 3 MW) parallel row-layout
4.   EBRO DELTA, Spain, 210 MW (60 x 3.5 MW) arc-layout
5.   YORKSHIRE FORELAND, UK, 52.5 MW (15 x 3.5 MW)
6.   SHANNON, Ireland, 20 MW (4 x 5 MW)


The methodology and presentation of this case studies is established as part of
ALTENER Contract No. 4.1030/Z/01-103/2001. For further information and
discussion please contact the project coordinator Green Globe Energy I/S or EMD
on e-mail: hansb@post8.tele.dk or euroscan@post.tele.dk or pn@emd.dk.
SEAWIND – project description:
MIDDELGRUNDEN, Denmark, 40 MW (20 x 2 MW)


Figure 1 Photomontage from Copenhagen, 4,3 km from WTGs

                                                 Project description
                                                Just 1.6 km to nearest part of the Capital
                                                of Denmark, Copenhagen, and less than 5
                                                km from the “heart” of Copenhagen, the
                                                royal castle Amalienborg. A row (arc) of 20
                                                x 2 MW Bonus WTGs at 64 m hub height
                                                and 76 m rotor diameter. The spacing is
                                                175 m, which is only 2.3 RD.
                                                Grid connections from the trafo’s in each
                                                WTG (30 kV) are made with 2 parallel 30
                                                kV lines from a collection point in the
                                                middle of the Windfarm to the power plant
                                                “Amagerværket” just at the shore. This is
                                                only 2.7 km away. The foundation type is
                                                gravity made of steel with an ice-breaking
                                       cone made of concrete. The water dept is 3-10 m.

                                       Organization and planning procedure
                                       The planning started 1998 initiated by the local
                                       environment and energy office in Copenhagen, a
                                       “grass root” organization. Together with the local
                                       utility “Copenhagen Electricity”, the development took
                                       form and with help from the Danish Energy Agency
                                       there were sponsored around 100 k€ to perform the
                                       needed investigations/planning. The project was
                                       given the final permission in 2000. This project was
                                       established in December 2000 – January 2001.

                                                                                           1
Facts on layout proposal and estimated investment costs
WTG size layout specification and price
Total installed power                              40 MW                                                        Distanse              in RD
Number of rows                                      1                                                                           -
WTGs per row )*                                    20                                                                  175      2.3
Number of WTGs                                     20                                                           Hub height RD (m)
Size of WTG                                         2 MW                                                                64        76
Price information in this case are very rough estimates
Price for WTGs, installed (k€)                                             26,840                   671         €/kW

Foundation, specification and cost estimate:                       40 MW
Type of foundation                                       Gravity
Number of foundations:                                             20
Water debt (m)                                                      5 RD             HH
WTG-size (MW, rotor diameter, hub height)                           2           76         64 Debt#1       Debt#2        Debt#3              Debt#4        Debt#5
Ice risk (yes/no)                                        Yes
100 year max wind gust (m/s)                             ?
100 year max wawe height (m)                             ?
Tidal difference (m)                                     ?
                                                         For all k€     k€ per pcs. €/kW         Per foundation, debt dependend
Fixed price. design cost,
Fixed price, building/shipping facilities
Fixed ground prepare cost
Variable ground prepare cost
Variable, building cost
Installation cost
SUM                                                           9,920            496         248


Grid connection:
Division into components partly estimated                Number or                                                       Prices k€           Per unit or
Off shore                                                length (m) Voltage(kV) mm^2     Material          Lines/cable   For all             per meter, € €/kW
                  Sea cable, from wind farm to shore            5400         30      300 CU                Cable                      540               100          14
                  In row cables                                    0         30      300 CU                Cable                      -                 100         -
                  Rows to collect point cables                  3325         30      300 CU                Cable                      333               100           8
                  Cable roll out/Wash down, variable            6025                                                                  301                50           8
                  Cable roll out/wash down, fixed cost                                                                                500         500,000            13
                  Total number of WTG connectors *)                20                                                                 900          45,000            23
                  Off shore HV station                              0                                                                 -                             -
                  Connection (electrical work)
                  Other fixed costs                                                                                                  1,000     1,000,000            25
                  Other variable costs
On shore
                  From shore to HV-grid
                  HV station (if needed)
                  Connection (electrical work)
                  Compensation (reactive power)
                  Other fixed costs                                                                                                  1,000     1,000,000            25
                  Other variable costs
Total             *) Incl. Transformers in WTGs !!                                                                                   4,574                          114


Total budget for 40 MW wind farm
                                                             k€                 € per kW                 Percent                     Note: There has
WTGs                                                        26,840                    671                    58%                     been added some
Foundation                                                   9,920                    248                    21%                     subsidy in the
Grid connection                                              4,574                    114                    10%                     planning phase.
Planning and permissioning                                   2,141                     54                     5%                     NOTE: In this
Organisation, management                                     1,071                     27                     2%                     description, the
Miscellaneous (e.g. risk)                                    1,606                     40                     3%                     WTG transformers
TOTAL                                                       46,152                  1,154                   100%                     are not included in
                                                                                                                                     WTG price, but in
                                                                                                                                     grid connection.


                                                                                                                                                                          2
Energy production, operation cost, PPA and economic feasibility.

There were established a measure mast, 50m off shore near the site and measured for
around 1 year. Unfortunately, the quality of the measurements was quite low due to low
availability. Off shore measurements are more critically to perform than onshore.
Based on as well local measurements as general wind data for Denmark, calculated mean
wind speed for the site is around 7.4 m/s, slightly higher based on local mast. But especially
the array losses are calculated much different due to different wind direction distribution.

Based on local measure mast: 4500 MWh/year/WTG – array loss 14%
Based on general wind data for DK: 5200 MWh/year/WTG – array loss 7%

Experiences so far show around 5000 MWh/year/WTG as expected long-term energy
production, corrected for availability and wind index.
            Goodness (actual wind index and availability corrected AEP/calculated This means that
                   AEP) for Middelgrunden base on 1 year of operation             calculations based
   1.20
                                                                                  on general
   1.10                                                                           experience from on
                                                                                  shore wind data
   1.00                                                                           gives a more
                                                                                  precise estimate for
   0.90                            Goodness, local off shore mast calc.
                                                                                  this wind farm than
                                   Goodness, DK92 on shore extrapolated wind data local off shore
   0.80                                                                           measurements –


                                                                                                       Avg
           1
               2
                   3
                       4
                           5
                               6
                                   7
                                       8
                                           9
                                               10
                                                    11
                                                         12
                                                              13
                                                                   14
                                                                        15
                                                                              16
                                                                                   17
                                                                                        18
                                                                                             19
                                                                                                  20
                                                                                  but the wind farm
                                        WTG number                                are close to the
                                                                                  shore, so it might
not be a general conclusion that on shore extrapolations is better or good enough.


Power purchase agreement
Power purchace agreement
                                           øre/kWh                                                           €c/kWh
For first 10 year, base price                    33           fixed (until 2003)                                  4.44
CO2-bonus, extra all 20 years                    10           fixed (politically decided)                         1.35
First 12000 full load hour, extra                17           fixed (untill 2001)                                 2.29
Marked price after 10 year                       23           Estimated                                           3.10

Operation costs and economic feasibility
Based on onshore experience following figures have been used in the calculations:
Operation cost                     onshore                                   offshore estimate
Insurance                                   5        €/kW/y                           10 €/kW/y
Service and maintenance                   10         €/kW/y                           18 €/kW/y
Adm. and management                         3        €/kW/y                             5 €/kW/y
SUM/year                                  18         €/kW/y                           33 €/kW/y
                                   Per WTG:                                          1.3 €c/kWh/y
Decommissioning                           25         k€/WTG                          0.6 €/kW/y
Figure 2 Operation cost used in calculation. The resulting 1.3 €c/kWh is a little higher than
expected for large-scale projects. The decommissioning costs is set very low here, while


                                                                                                                         3
access is very easy and there should be good reasons to believe in that instead of
decommissioning, repowering would be more likely.


Figure 3 With 5000 MWh/y per 2 MW WTG, 7% interest rate, tax regulations for coop owned shares,
O&M cost of 1.3 €c/kWh and the PPA for DK at the time of installation, a 10.4 year pay back time is
expected.


Figure 4 One share is here 1000 kWh/year, an investment of 462€. Note that only 2500 kWh/kW is
produced due to Copenhagen relative close in main wind direction and relative small rotor area /kW.


                                                                                                      4
Environmental aspects:


Figure 5 The terrain profile (water dept with factor 5 oversize) shown for a part of the Windfarm clearly
showing the low water ground which keep the water dept around 4 m for most of the WTGs. The
proportions of the Amager Power plant are shown for comparison (actual size might differ – no
information on the height is found).


Figure 6 The 5 WTGs most south - WTG no. 20 is outside the 4 m dept with around 10 m, which increase
the cost.
Visual impact
The visual impact was considered to be the only “real” environmental problem.
Therefore several photomontages were made from many different spots as a part of
the approval process, see example on front page.

Of other possible concerns was the sea traffic and air traffic (location only 5.3 km
from the main Airport of Scandinavia, Kastrup), but all aspects were handled in a
positive dialogue – light marking on top of nacelle secures visibility for the air traffic.

The methodology and presentation of this case study is established as part of
ALTENER Contract No. 4.1030/Z/01-103/2001. For further information and
discussion please contact the project coordinator Green Globe Energy I/S or EMD
on e-mail: hansb@post8.tele.dk or euroscan@post.tele.dk or pn@emd.dk.
                                                                                                        5
SEAWIND – project description:

Butendiek, Germany, 240 MW (80 x 3 MW)


Stylistic photomontage showing the visible part of the WTGs seen from Westerland, Sylt
based on standard 45 mm focal length camera. Photo point is shown on map with green
lines. Due to earth rounding only the upper half of rotor will be visible, indicated by red line.
Below a heavy zoom at the closest WTG show that from 1.5 m a.s.l. around 20% of the 80 m
high tower will be visible.


                                       Project description
                                       The proposed project is 35 km offshore outside
                                       Sylt, an island in the North Sea NW of Germany.
                                       The project consists of a 5 rows with 6-24 WTGs
                                       in total 80 WTGs. With 3 MW WTGs (size not yet
                                       decided), 240 MW will be installed. Each WTG is
                                       here assumed with a hub height of 80 m and a
                                       rotor diameter of 90 m. Calculations show that
                                       around 905 GWh could be produced annual. The
                                       proposed layout has 966 m spacing (10.7 rotor
                                       diameters) between rows, 478 (5.3 RD in row).
                                       The foundation type is assumed to be monopile at
                                       a water dept around 20 m.
                                                                                               6
The project description and the calculations performed are of initial nature and
 must be further consolidated.

 Facts on layout proposal and estimated investment costs
 WTG size layout specification and price
 Total installed power                                                                         240 MW                               Distanse              in RD
 Number of rows                                                                                       5                                     966       10.7
 WTGs per row )*                                                                                     16                                     478        5.3
 Number of WTGs                                                                                      80                             Hub height RD (m)
 Size of WTG                                                                                          3 MW                                   80         90
 Price information in this case are very rough estimates
 Price for WTGs, installed (k€)                                                   220,000                               917         €/kW

 Foundation, specification and cost estimate:                       240 MW
 Type of foundation                                        Monopile
 Number of foundations:                                                 80
 Water debt (m)                                                         20 RD                 HH
 WTG-size (MW, rotor diameter, hub height)                               3              100             95 Debt#1        Debt#2       Debt#3           Debt#4      Debt#5
 Ice risk (yes/no)                                         No
 100 year max wind gust (m/s)                              ?
 100 year max wawe height (m)                              ?
 Tidal difference (m)                                      ?
                                                           For all k€     k€ per pcs.         €/kW           Per foundation, debt dependend
 Fixed price. design cost,
 Fixed price, building/shipping facilities
 Fixed ground prepare cost
 Variable ground prepare cost
 Variable, building cost
 Installation cost
 SUM                                                            80,000          1000.005             333.3

 Figure 1 Foundation costs are based on estimates so far.
                                                Number or                                                                         Prices k€       Per unit or
                                                length (m)   Voltage(kV)    mm^2                  Material        Lines/cable     For all         per meter, € €/kW
 Sea cable, from wind farm to shore                    35500            150                   630 CU              Cable                    17,750           500             74
 In row cables                                          3864             30                   300 CU              Cable                       386           100              2
 Rows to collect point cables                           7170             30                   300 CU              Cable                       717           100              3
 Cable roll out/Wash down, variable                    46534                                                                                2,327             50            10
 Cable roll out/wash down, fixed cost                                                                                                         500      500,000               2
 Total number of WTG connectors                          80                                                                                 2,000       25,000               8
 Off shore HV station                                     1 150/30 kV                                                                      15,000 15,000,000                63
 Connection (electrical work)
 Other fixed costs                                                                                                                            2,000    2,000,000            8
 Other variable costs

 From shore to HV-grid
 HV station (if needed)
 Connection (electrical work)
 Compensation (reactive power)
 Other fixed costs                                                                                                                        34,320      34,320,000        143
 Other variable costs
                                                                                                                                          75,000                        313

 Figure 2 The sum is based on project calculations, but division into different parts is a rough
 estimate.

Total budget for 240 MW wind farm
                                                              k€                         € per kW                         Percent                     Note: Cost
WTGs                                                         220,000                             917                           54%                    estimates are
Foundation                                                    80,000                             333                           20%                    based on
Grid connection                                               75,000                             313                           19%                    estimates
Planning and permissioning                                    12,135                              51                            3%                    made by the
Organisation, management                                       8,090                              34                            2%                    project
Miscellaneous (e.g. risk, reserve)                             9,274                              39                            2%                    initiative group
TOTAL                                                        404,500                           1,685                          100%


                                                                                                                                                                                 7
Expected energy production, and PPA

The energy calculation based on wind data from Danish onshore experience. The WAsP
calculation model is used from the WindPRO software tool, where the whole project is
modeled. The calculation shows 905 GWh/year. From this uncertainty, grid losses and
availability losses shall be withdrawn – probably around 12% at present stage, which makes
almost 800 GWh/y, which is the estimate based on more detailed evaluations by Techwise.


Figure 3 The energy calculation printout from WindPRO software.
Knowledge from existing onshore wind farms near site combined with the Horns Rev (first
large Offshore project in North Sea in DK installed end 2002) experience that now start to
come, a more certain estimate can be made with relative limited effort. Installation of wind
measurement mast at site would be preferable.

German off shore PPA          Number of months In years              Price paid per kWh (start 2006)
Increased subsidy                          158                13.1                                 8.6
Decreased subsidy                                                                                  5.7

Figure 4 The price paid per kWh are fixed in Germany for 20 years. For Off shore projects installed no
later than 2006 outside three nautical miles outside baseline used to demarcate territorial waters, the
increased price is at least 9 years (5 year on shore),


                                                                                                          8
Operation costs and economic feasibility

Based on onshore experience following figures have been used in the calculations:
Operation cost              onshore                  offshore estimate
Insurance                                   5    €/kW/y                   10    €/kW/y
Service and maintenance                   10     €/kW/y                   18    €/kW/y
Adm. and management                         3    €/kW/y                     5   €/kW/y
SUM/year                                  18     €/kW/y                   33    €/kW/y
                                   Per WTG:                              1.0    €c/kWh/y
Decommissioning                           50     k€/WTG                  0.7    €/kW/y
Figure 5 Operation cost used in calculation. The resulting 1 €c/kWh match well the DK utilities
expectations for the calculated DK projects. The decommissioning costs is set relative low, but there
should be good reasons to believe in that instead of decommissioning, repowering would be more likely.


Figure 6 With the above estimated price development a payback time of 9.7 years will be expected. Tax
calculations is not included, but these will typically have a positive influence on the pay back time due to
tax credits from loans.


Figure 7 One share is here 1000 kWh/year, an investment of 508€.

                                                                                                               9
Infrastructure, environmental aspects, time schedule etc.


Figure 8 The wind farm shown on top of the map from North sea offshore show that the wind farm is
within the important bird area zone, but detailed studies has confirmed that the site is accepted.

Environment impact assessment
Subsurface life
Fish
Birds
Guinea pig, seal et. al.
The conclusion is that none of the above topics will be disturbed in a way that rejects the project
proposal.

Security regarding ship collision
The conclusion is that the risk is very low due to the remote location relative to main ship traffic.

Visual impact
Due to the long distance to nearest shore position at Sylt, the earth rounding influence, combined with
prevailing weather conditions, the wind park will only be visual in very limited time and only a small
part of it.

Fishing
Shrimp fishing will be reduced and compensation to the shrimp fishers will be negotiated.

Time schedule
The remaining contracts and financing including sale of the project for small investors will be done
during 2003-2004. In 2003 the first part, the grid connection will start construction. In 2005 the off
shore construction is planned.


The methodology and presentation of this case study is established as part of
ALTENER Contract No. 4.1030/Z/01-103/2001. For further information and
discussion please contact the project coordinator Green Globe Energy I/S or EMD
on e-mail: hansb@post8.tele.dk or euroscan@post.tele.dk or pn@emd.dk.


                                                                                                         10
SEAWIND – project description:

Aigues Mortes, 72 MW (24 x 3 MW) parallel row-layout


Photomontage showing the WTGs seen from coastline based on standard 45 mm focal
length camera. Photo point is shown on map with green lines giving the photo angle.


                                     Project description
                                     The proposed project is around 4 km offshore in
                                     the Montpellier region in southeastern France.
                                     The project consists of a matrix 8 x 3 WTGs, in
                                     total 24 WTGs. With 3 MW WTGs, 72 MW will be
                                     installed. Each WTG is here assumed with a hub
                                     height of 90 m and a rotor diameter of 98 m.
                                     Calculations show that around 268 GWh could
                                     be produced annual, but with very uncertain wind
                                     data. The proposed layout has 882 m spacing (9
                                     rotor diameters) between rows, 686 m in row (7
                                     RD). The foundation type is assumed to be
                                     monopile at a water dept from 10-20 m.
                                                                                     11
Facts on layout proposal and estimated investment costs
WTG size layout specification and price
Total installed power                                                                                 72 MW                               Distanse    in RD
Number of rows                                                                                           3                                        882       9.8
WTGs per row )*                                                                                          8                                        686       7.6
Number of WTGs                                                                                          24                                Hub height RD (m)
Size of WTG                                                                                              3 MW                                      80        90
Price information in this case are very rough estimates
Price for WTGs, installed (k€)                                                             61,200                          850            €/kW

Foundation, specification and cost estimate:                               72 MW
Type of foundation                                            Monopile
Number of foundations:                                                     24
Water debt (m)                                                             20 RD                 HH
WTG-size (MW, rotor diameter, hub height)                                   3              100             95 Debt#1        Debt#2         Debt#3              Debt#4        Debt#5
Ice risk (yes/no)                                             No
100 year max wind gust (m/s)                                  ?
100 year max wawe height (m)                                  ?
Tidal difference (m)                                          ?
                                                              For all k€     k€ per pcs.         €/kW           Per foundation, debt dependend
Fixed price. design cost,
Fixed price, building/shipping facilities
Fixed ground prepare cost
Variable ground prepare cost
Variable, building cost
Installation cost
SUM                                                                24,000          1000.005             333.3


Figure 1 Foundation costs are very roughly estimates while no detailed data on water, weather and sea
bottom conditions are available so far.
Grid connection:
                                                              Number or                                                                    Prices k€           Per unit or
Off shore                                                     length (m)   Voltage(kV)    mm^2                Material      Lines/cable    For all             per meter, € €/kW
                       Sea cable, from wind farm to shore             8000             30                 630 CU            Cable                      4,000             500           56
                       In row cables                                  4802             30                 300 CU            Cable                        480             100            7
                       Rows to collect point cables                   1764             30                 300 CU            Cable                        176             100            2
                       Cable roll out/Wash down, variable            10566                                                                               528               50           7
                       Cable roll out/wash down, fixed cost                                                                                              500        500,000             7
                       Total number of WTG connectors                      24                                                                            600         25,000             8
                       Off shore HV station                                 0 150/30 kV                                                                  -      15,000,000            -
                       Connection (electrical work)
                       Other fixed costs                                                                                                               1,000     1,000,000            14
                       Other variable costs
On shore
                       From shore to HV-grid
                       HV station (if needed)
                       Connection (electrical work)
                       Compensation (reactive power)
                       Other fixed costs                                                                                                                500        500,000             7
                       Other variable costs
Total                                                                                                                                                  7,785                          108

Figure 2 No detailed specifications available, but 2 x 30 kV lines in parallel is assumed sufficient for
connection for nearest 30 kV line.


Total budget for 72 MW wind farm
                                                                  k€                        € per kW                        Percent                      Note: Cost
WTGs                                                              61,200                            850                          61%                     estimates are
Foundation                                                        24,000                            333                          24%                     based on rough
Grid connection                                                    7,785                            108                           8%                     scaling of mainly
Planning and permissioning                                         3,009                             42                           3%                     experience from
Organisation, management                                           2,006                             28                           2%                     Danish offshore
Miscellaneous (e.g. risk, reserve)                                 2,300                             32                           2%                     projects.
TOTAL                                                            100,300                          1,393                         100%


                                                                                                                                                                                            12
Expected energy production, and PPA

The energy calculation based on wind data from EU-Windatlas data at Perpignan get a
calculated mean wind speed level at 9.2 m/s in 50 m h.a.s.l. This is probably some
optimistic. The WAsP calculation model is used from the WindPRO software tool, where the
whole project is modeled. The onshore surface roughness has been taken into consideration
in the calculation that shows 252 GWh/year. From this uncertainty, grid losses and
availability losses shall be withdrawn – especially due to the lack of local wind data, 20% at
present stage is withdrawn, which makes 202 GWh.


Figure 3 The energy calculation printout from WindPRO software.
Knowledge from existing onshore wind farms near site combined with the Horns Rev (first
large Offshore project in North Sea in DK installed end 2002) experience that now start to
come, a more certain estimate can be made with relative limited effort. Installation of wind
measurement mast at site would be preferable.

Power purchase agreement
For offshore wind farms no regulations is known so far, so the estimates from Spain is used.
Here analyses indicates that a level of 6.3 €c/kWh should be a realistic level. This value is
used in the economic calculation with an inflation of 2% per year. But this is an uncertain
factor that shall be evaluated further.


                                                                                               13
Operation costs and economic feasibility

Based on onshore experience following figures have been used in the calculations:
Operation cost                       onshore                         offshore estimate
Insurance                                        5   €/kW/y                    10 €/kW/y
Service and maintenance                         10   €/kW/y                    18 €/kW/y
Adm. and management                              3   €/kW/y                      5 €/kW/y
SUM/year                                        18   €/kW/y                    33 €/kW/y
                                     Per WTG:                                 1.2 €c/kWh/y
Decommissioning                                 50 k€/WTG                     0.8 €/kW/y
Figure 4 Operation cost used in calculation. The resulting 1.2 €c/kWh is a little more than DK utilities
expectations for the calculated DK projects. The decommissioning costs is set relative low, but there
should be good reasons to believe in that instead of decommissioning, repowering would be more likely.


Figure 5 With the above estimated price development a payback time of 14.1 years will be expected. Tax
calculations are not included. The feasibility is not looking to promising, more investigations that indicate
reduced costs, better energy production or higher PPA will be needed.


Figure 6 One share is here 1000 kWh/year, an investment of 498€.

                                                                                                          14
Infrastructure, environmental aspects etc. needs investigations.


Figure 7 A map with different restriction zones and the proposed sites for offshore wind farms (red
boxes). Due to the fast increasing water dept, probably only a few of the sites will be realistic with present
technology. The red lines show 30 kV grid and green the 150 kV grid lines. Blue lines are water dept.


Figure 8 The seabed profile from shore including the 3 rows of WTGs
The Environmental Impact Assessment will be a major part of the needed project
documentation.


The methodology and presentation of this case study is established as part of
ALTENER Contract No. 4.1030/Z/01-103/2001. For further information and
discussion please contact the project coordinator Green Globe Energy I/S or EMD
on e-mail: hansb@post8.tele.dk or euroscan@post.tele.dk or pn@emd.dk.
                                                                                                           15
SEAWIND – project description:

Ebro Delta, Spain, 210 MW (60 x 3.5 MW) arc-layout.


Photomontage showing the WTGs seen from Ampolla based on standard 45 mm focal
length camera. Photo point is shown on map with green lines giving the photo angle.

                                                     Project description
                                                     The proposed project is around 5
                                                     km offshore outside the Ebro
                                                     Delta in northeastern Spain. The
                                                     project consists of a 4 arcs with
                                                     15 WTGs in total 60 WTGs. With
                                                     3.5 MW WTGs, 210 MW will be
                                                     installed. Each WTG is here
                                                     assumed with a hub height of 95
                                                     m and a rotor diameter of 100 m.
                                                     Calculations show that around
                                                     580 GWh could be produced
                                                     annual, but with very uncertain
                                                     wind data. The proposed layout
                                                     has 1183 m spacing (11.8 rotor
                                                     diameters) between arcs, 600 m
                                                     in average (410-800) in the arcs
                                   (6 RD). The foundation type is assumed to be
                                   monopile at a water dept from 5-25 m.
                                   This layout proposal is very special and will have
                                   an “origin” from where all WTGs can be seen as
                                   parallel rows. This should for sure be the place
                                   where an “info building” should be made and this
                                   could be an attractive “tourism spot” where many
                                   would like to come and see the Windfarm.
                                   The project description and the calculations
                                   performed are of initial nature and must be
                                   further consolidated.
                                                                                       16
Facts on layout proposal and estimated investment costs
WTG size layout specification and price
Total installed power                            210 MW                                                       Distanse    in RD
Number of rows                                       4                                                              1183       11.8
WTGs per row )*                                    15 Average                                                        600        6.0
Number of WTGs                                     60                                                         Hub height RD (m)
Size of WTG                                        3.5 MW                                                              95       100
Price information in this case are very rough estimates
Price for WTGs, installed (k€)                                         178,500                    850         €/kW

Foundation, specification and cost estimate:                     210 MW
Type of foundation                                         Monopile
Number of foundations:                                               60
Water debt (m)                                                       20 RD        HH
WTG-size (MW, rotor diameter, hub height)                           3.5       100         95 Debt#1      Debt#2        Debt#3              Debt#4        Debt#5
Ice risk (yes/no)                                          No
100 year max wind gust (m/s)                               ?
100 year max wawe height (m)                               ?
Tidal difference (m)                                       ?
                                                           For all k€ k€ per pcs. €/kW         Per foundation, debt dependend
Fixed price. design cost,
Fixed price, building/shipping facilities
Fixed ground prepare cost
Variable ground prepare cost
Variable, building cost
Installation cost
SUM                                                           94,500        1575         450


Figure 1 Foundation costs are very roughly estimates while no detailed data on water, weather and sea
bottom conditions are available so far.
Grid connection:
                                                           Number or                                                   Prices k€           Per unit or
Off shore                                                  length (m) Voltage(kV) mm^2     Material      Lines/cable   For all             per meter, € €/kW
                    Sea cable, from wind farm to shore          18000         150      630 CU            Cable                   9,000                500         43
                    In row cables                                 3549         30      300 CU            Cable                     355                100          2
                    Rows to collect point cables                  8400         30      300 CU            Cable                     840                100          4
                    Cable roll out/Wash down, variable          29949                                                            1,497                 50          7
                    Cable roll out/wash down, fixed cost                                                                           500          500,000            2
                    Total number of WTG connectors                 60                                                            1,500           25,000            7
                    Off shore HV station                            1 150/30 kV                                                 10,000      10,000,000            48
                    Connection (electrical work)
                    Other fixed costs                                                                                              1,000     1,000,000             5
                    Other variable costs
On shore
                    From shore to HV-grid
                    HV station (if needed)
                    Connection (electrical work)
                    Compensation (reactive power)
                    Other fixed costs                                                                                              1,000     1,000,000             5
                    Other variable costs
Total                                                                                                                           25,692                            122


Figure 2 No detailed specifications available. Needs detailed analyses.

Total budget for 210 MW wind farm
                                                              k€              € per kW                 Percent                     Note: Cost
WTGs                                                        178,500                 850                    50%
                                                                                                                                   estimates are
                                                                                                                                   based on rough
Foundation                                                   94,500                 450                    27%
                                                                                                                                   scaling of mainly
Grid connection                                              25,692                 122                     7%
                                                                                                                                   experience from
Planning and permissioning                                   28,447                 135                     8%                     Danish offshore
Organisation, management                                     10,668                  51                     3%                     projects.
Miscellaneous (e.g. risk)                                    17,779                  85                     5%
TOTAL                                                       355,586               1,693                   100%


                                                                                                                                                                        17
Expected energy production, and PPA

The energy calculation based on wind data from EU-Windatlas data at Zaragossa mixed with
some very short local measurement from Munesia. The mix is used to get a calculated mean
wind speed level at 7.7 m/s in 100m h.a.s.l. which is the level indicated by a study performed
based on many different sources, that indicate from 6.7 – 8.5 m/s. The WAsP calculation
model is used from the WindPRO software tool, where the whole project is modeled. The
onshore surface roughness has been taken into consideration in the calculation that shows
583 GWh/year. From this uncertainty, grid losses and availability losses shall be withdrawn –
especially due to the lack of local wind data, 25% at present stage is withdrawn, which
makes 437 GWh. But this will be too small production for feasibility. Therefore the economic
calculations are based on the calculated value – so more precise wind data is a must here.


Figure 3 The energy calculation printout from WindPRO software.
Knowledge from existing onshore wind farms near site combined with the Horns Rev (first
large Offshore project in North Sea in DK installed end 2002) experience that now start to
come, a more certain estimate can be made with relative limited effort. Installation of wind
measurement mast at site would be preferable.


Power purchase agreement
In Spain, both a fixed and a variable tariff structure are available. Analyses indicates that a
level of 6.3 €c/kWh should be a realistic level. This value is used in the economic calculation
with an inflation of 2% per year. But this is an uncertain factor that shall be evaluated further.
                                                                                               18
Operation costs and economic feasibility

Based on onshore experience following figures have been used in the calculations:
Operation cost              onshore                  offshore estimate
Insurance                                   5    €/kW/y                   10    €/kW/y
Service and maintenance                   10     €/kW/y                   18    €/kW/y
Adm. and management                         3    €/kW/y                     5   €/kW/y
SUM/year                                  18     €/kW/y                   33    €/kW/y
                                   Per WTG:                              1.0    €c/kWh/y
Decommissioning                           50     k€/WTG                  0.7    €/kW/y
Figure 4 Operation cost used in calculation. The resulting 1 €c/kWh match well the DK utilities
expectations for the calculated DK projects. The decommissioning costs is set relative low, but there
should be good reasons to believe in that instead of decommissioning, repowering would be more likely.


Figure 5 With the above estimated price development a payback time of 16.5 years will be expected. Tax
calculations are not included. The feasibility is not looking to promising, more investigations that indicate
reduced costs or better energy production will be needed.


Figure 6 One share is here 1000 kWh/year, an investment of 610€.
                                                                                                          19
Infrastructure, environmental aspects etc. needs investigations.


Figure 7 A photomontage of the wind farm from the top of the Water tower.


The Environmental Impact Assessment will be a major part of the needed project
documentation.


The methodology and presentation of this case study is established as part of
ALTENER Contract No. 4.1030/Z/01-103/2001. For further information and
discussion please contact the project coordinator Green Globe Energy I/S or EMD
on e-mail: hansb@post8.tele.dk or euroscan@post.tele.dk or pn@emd.dk.


                                                                                  20
YORKSHIRE FORELAND, UK, 52.5 MW (15 x 3.5 MW)


Photomontage showing the visibility from coastline at Easington based on standard 45 mm
focal length camera. Photo point is shown on map with green lines.

                                        Project description

                                        The proposed project is 4.5 km offshore
                                        outside Kilnsea, Humberside, around 18 km
                                        east of Grimsby. The project consists of a
                                        bow with 15 3,5 MW WTGs which makes
                                        52,5 MW in all. Each WTG is assumed with a
                                        hub height of 95 m and a rotor diameter of
                                        100 m. Some very rough preliminary
                                        calculations show that around 800 GWh could
                                        be produced annual. The proposed layout
                                        has 600 m spacing (6 rotor diameters) – the
                                        circle bow has 10 km radius. Grid
                                        connections are assumed obtained with one
                                        or more direct 30 kV lines to Grimsby. The
                                        foundation type is assumed to be monopole
                                        at a water dept less than 20 m.

                                        The project description and the
                                        calculations performed are of initial nature
                                        and must be further consolidated.


                                                                                      21
Facts on layout proposal and estimated investment costs
WTG size layout specification and price
Total installed power                                                                              52.5 MW                         Distance                in RD
Number of rows                                                                                           1                                   x    x
WTGs per row )*                                                                                        15                                 600      6.0
Number of WTGs                                                                                         15                          Hub height RD (m)
Size of WTG                                                                                            3.5 MW                              95       100
Price information in this case are very rough estimates

Price for WTGs, installed (k€)                                                                  44,625                 850         €/kW

Foundation, specification and cost estimate:                    52.5 MW
Type of foundation                                         Monopile
Number of foundations:                                               15
Water debt (m)                                                       20 RD        HH
WTG-size (MW, rotor diameter, hub height)                           3.5       100         95 Debt#1      Debt#2        Debt#3              Debt#4          Debt#5
Ice risk (yes/no)                                          No
100 year max wind gust (m/s)                               ?
100 year max wawe height (m)                               ?
Tidal difference (m)                                       ?
                                                           For all k€ k€ per pcs. €/kW         Per foundation, debt dependend
Fixed price. design cost,
Fixed price, building/shipping facilities
Fixed ground prepare cost
Variable ground prepare cost
Variable, building cost
Installation cost
SUM                                                           23,625        1575         450


Figure 1 Foundation costs are very roughly estimates while no detailed data on water, weather and sea
bottom conditions are available so far.
Grid connection:
                                                           Number or                                                   Prices k€           Per unit or
Off shore                                                  length (m) Voltage(kV) mm^2     Material      Lines/cable   For all             per meter, € €/kW
                    Sea cable, from wind farm to shore          36000          30      300 CU            Cable                     3,600              100            69
                    In row cables                                    0         30      300 CU            Cable                       -                100           -
                    Rows to collect point cables                  8400         30      300 CU            Cable                       840              100            16
                    Cable roll out/Wash down, variable          26400                                                              1,320               50            25
                    Cable roll out/wash down, fixed cost                                                                             200        200,000               4
                    Total number of WTG connectors                 15                                                                375         25,000               7
                    Off shore HV station                            0                                                                -                              -
                    Connection (electrical work)
                    Other fixed costs                                                                                               300          300,000             6
                    Other variable costs
On shore
                    From shore to HV-grid
                    HV station (if needed)
                    Connection (electrical work)
                    Compensation (reactive power)
                    Other fixed costs                                                                                               500          500,000            10
                    Other variable costs
Total                                                                                                                              7,135                            136


Figure 2 In this calculation 2 parallel 30 kV cables are assumed to Grimsby. Needs detailed analyses.


Total budget for 52.5 MW wind farm
                                                               k€             € per kW                 Percent                     Note: Cost
WTGs                                                          44,625                850                    50%                     estimates are
Foundation                                                    23,625                450                    26%                     based on rough
Grid connection                                                7,135                136                     8%                     scaling of mainly
Planning and permissioning                                     7,180                137                     8%                     experience from
Organisation, management                                       2,692                 51                     3%                     Danish offshore
Miscellaneous (e.g. risk)                                      4,487                 85                     5%                     projects.
TOTAL                                                         89,744              1,709                   100%


                                                                                                                                                                          22
Expected energy production, and PPA

The energy calculation based on wind data from nearest EU-Windatlas data at Waddington
(which might be quite uncertain) is performed. The WAsP calculation model is used from the
WindPRO software tool, where the whole project is modeled. The onshore surface
roughness towards west has been taken into consideration in the calculation that shows 226
GWh/year. From this uncertainty, grid losses and availability losses shall be withdrawn –
probably around 20% at present stage, which makes 181 GWh.


Figure 3 The energy calculation printout from WindPRO software.
Knowledge from existing onshore wind farms near site combined with the Horns Rev (first
large Offshore project in North Sea in DK installed end 2002) experience that now start to
come, a more certain estimate can be made with relative limited effort. Installation of wind
measurement mast at site would be preferable.

UK-WTG electricity price    £/MWh           €/kWh
                            min    max      min      max     Average Comment
Brown electricity price         12      18     0.019   0.029   0.024 Inflated
Climatee Change Levy                    4.3    0.000   0.007   0.003 limited to 12000 full load hour
Ren. Obl. Cert. (ROC)           30      50     0.048   0.081   0.065 non inflated, very uncertain
Local prod. benefit                     1.5    0.000   0.002   0.001 Inflated
Total                           42     73.8    0.068   0.119   0.094

Figure 4 The price paid per kWh and especially the development is uncertain. To minimize the risk, it
could be an option to make long-term contracts, especially for the ROC's. The CCL is only included the
first 12000 full load hours, simply due to lack of knowledge of future expectations.

                                                                                                       23
Operation costs and economic feasibility

Based on onshore experience following figures have been used in the calculations:
Operation cost              onshore                  offshore estimate
Insurance                                   5    €/kW/y                   10    €/kW/y
Service and maintenance                   10     €/kW/y                   18    €/kW/y
Adm. and management                         3    €/kW/y                     5   €/kW/y
SUM/year                                  18     €/kW/y                   33    €/kW/y
                                   Per WTG:                              1.0    €c/kWh/y
Decommissioning                           50     k€/WTG                  0.7    €/kW/y
Figure 5 Operation cost used in calculation. The resulting 1 €c/kWh match well the DK utilities
expectations for the calculated DK projects. The decommissioning costs is set relative low, but there
should be good reasons to believe in that instead of decommissioning, repowering would be more likely.
Additionally 2% of total income is added for rent to Crown Estate.


Figure 6 With the above estimated price development a payback time of 9.6 years will be expected. Tax
calculations is not included, but these will typically have a positive influence on the pay back time due to
tax credits from loans.


Figure 7 One share is here 1000 kWh/year, an investment of 496€.

                                                                                                          24
Infrastructure, environmental aspects etc. needs investigations.


Figure 8 The wind farm shown on top of the map from dti’s WindBase. This show that the site is within
the 5-20 m water dept and that it does not conflict with major traffic routes.


                                                                    The Ramsars and Natural
                                                                    nature reserves indicate no
                                                                    problems for this specific
                                                                    site. There will be a 30-
                                                                    month investigation and
                                                                    documentation phase in
                                                                    order to achieve a building
                                                                    permission, where the
                                                                    Environmental Impact
                                                                    Assessment will be a major
                                                                    part.


                                                                                                    25
SHANNON, EI, 20 MW (4 x 5 MW)


Photomontage showing the visibility from coastline at shore grid connection point based on
standard 45 mm focal length camera.

                                            Project description

                                            The proposed project is 1.5 km offshore in
                                            the “Mouth of Shannon”. The proposed
                                            project consists of 4x 5 MW WTGs, which
                                            makes 20 MW in all. Each WTG is assumed
                                            with a hub height of 110 m and a rotor
                                            diameter of 115 m. Some very rough
                                            preliminary calculations show that around
                                            75 GWh could be produced annual. The
                                            proposed layout has 1000 m spacing (8.7
                                            rotor diameters). Grid connections are
                                            assumed obtained with an offshore 1.5 km
                                            38 kV sea cable + a 11.5 km direct 38 kV
                                            lines on shore to a 110 kV station, which
                                            should be capable to take 25 MW. The
                                            foundation type is assumed to be monopole
                                            at a water dept less than 20 m.

                                            The project description and the
                                            calculations performed are of initial
                                            nature and must be further consolidated.


                                                                                         26
Facts on layout proposal and estimated investment costs
WTG size layout specification and price
Total installed power                              20 MW                                                     Distanse                in RD
Number of rows                                      1                                                                 0      -
WTGs per row )*                                     4                                                             1000       8.7
Number of WTGs                                      4                                                        Hub height RD (m)
Size of WTG                                         5 MW                                                            110      115
Price information in this case are very rough estimates
Price for WTGs, installed (k€)                                              17,000              850          €/kW
Figure 1 No experience with 5 MW WTGs so far, so the 2-3 MW experience is just up scaled.
Foundation, specification and cost estimate:                            20 MW
Type of foundation                                             Monopile
Number of foundations:                                                   4
Water debt (m)                                                          20 RD             HH
WTG-size (MW, rotor diameter, hub height)                                5          115         110 Debt#1          Debt#2         Debt#3              Debt#4
Ice risk (yes/no)                                              No
100 year max wind gust (m/s)                                   ?
100 year max wawe height (m)                                   ?
Tidal difference (m)                                           ?
                                                               For all k€    k€ per pcs. €/kW         Per foundation, debt dependend
Fixed price. design cost,
Fixed price, building/shipping facilities
Fixed ground prepare cost
Variable ground prepare cost
Variable, building cost
Installation cost
SUM                                                                10,000          2500         500

Figure 2 Foundation costs are very roughly estimates while no detailed data on water, weather and sea
bottom conditions are available so far. Due to the low number of WTGs rater high p.u. price is assumed.
Grid connection:
                                                          Number or                                                  Prices k€           Per unit or
Off shore                                                 length (m) Voltage(kV) mm^2     Material    Lines/cable    For all             per meter, € €/kW
                   Sea cable, from wind farm to shore            1500         38      300 CU          Cable                       150              100           8
                   In row cables                                    0         38      300 CU          Cable                       -                100       -
                   Rows to collect point cables                  3000         38      300 CU          Cable                       300              100           15
                   Cable roll out/Wash down, variable            4500                                                             225                50          11
                   Cable roll out/wash down, fixed cost                                                                           200         200,000            10
                   Total number of WTG connectors                  4                                                              100          25,000             5
                   Off shore HV station                            0                                                              -                          -
                   Connection (electrical work)
                   Other fixed costs                                                                                              300        300,000             15
                   Other variable costs
On shore
                   From shore to HV-grid                      11500           38                                                 1,035            90             52
                   HV station (if needed)
                   Connection (electrical work)
                   Compensation (reactive power)
                   Other fixed costs                                                                                              250        250,000             13
                   Other variable costs
Total                                                                                                                            2,560                       128


Figure 3 In this calculation a 38 kV cable to nearest assumed 150 kV grid is included. Needs detailed
analyses.

Total budget for 20 MW wind farm
                                                           k€             € per kW             Percent                 Note: Cost estimates
WTGs                                                      17,000                850                48%                 are based on rough
Foundation                                                10,000                500                28%                 scaling of mainly
Grid connection                                            2,560                128                 7%                 experience from Danish
Planning and permissioning                                 1,056                 53                 3%                 offshore projects. The
Organisation, management                                   1,056                 53                 3%                 risk is estimated higher
Miscellaneous (e.g. risk)                                  3,519                176                10%                 due to the non-
TOTAL                                                     35,190              1,760               100%                 approved WTG size.


                                                                                                                                                                      27
Expected energy production, and PPA

The energy calculation based on wind data from nearest EU-Windatlas data at Shannon –
this should be a quite safe estimate while the Shannon data is measured around 60 km
more towards east and the wind climate has shown to increase towards west. There are
WTGs at Beal Hill close to the site – these could give very precise indications on the local
energy level. The WAsP calculation model is used from the WindPRO software tool, where
the whole project is modeled. The onshore surface roughness towards east has been taken
into consideration in the calculation that shows 75 GWh/year. From this uncertainty, grid
losses and availability losses shall be withdrawn – but this is probably fully included in the
conservative wind data.


Figure 4 The energy calculation printout from WindPRO software.

PPA:
8.4 €c/kWh first 15 years reserved for 50 MW offshore in AER VI – this is inflated with
consumer price index. Bid with lowest price will get accept first.


                                                                                            28
Operation costs and economic feasibility

Based on onshore experience following figures have been used in the calculations:
Operation cost                  onshore                    offshore estimate
Insurance                                5   €/kW/y                 10 €/kW/y
Service and maintenance                10    €/kW/y                 35 €/kW/y
Adm. and management                      3   €/kW/y                   5 €/kW/y
SUM/year                               18    €/kW/y                 50 €/kW/y
                                Per WTG:                           1.3 €c/kWh/y
Decommissioning                        50    k€/WTG                0.5 €/kW/y
Figure 5 Operation cost used in calculation. The resulting 1.3 €c/kWh is around 30% higher than utilities
expectations for the calculated DK projects. The reason is the small number of WTGs and the unproven
WTG type. The decommissioning costs is set relative low, but there should be good reasons to believe in
that instead of decommissioning, repowering would be more likely.


Figure 6 With the above estimated price development a payback time of 9.1 years will be expected. Tax
calculations is not included, but these will typically have a positive influence on the pay back time due to
tax credits from loans. Note only a part of the subsidy price is inflated with 2% inflation (safe price dev.)


Figure 7 One share is here 1000 kWh/year, an investment of 470€.

                                                                                                           29

Wind farm offshore projects in France, Denmark, Spain, Germany

  • 1.
    SEAWIND – projectdescriptions Following cases in a pre-feasibility study format: 1. MIDDELGRUNDEN, Denmark, 40 MW (20 x 2 MW) 2. BUTENDIEK, Germany, 240 MW (80 x 3 MW) 3. AIGUES MORTES, France 72 MW (24 x 3 MW) parallel row-layout 4. EBRO DELTA, Spain, 210 MW (60 x 3.5 MW) arc-layout 5. YORKSHIRE FORELAND, UK, 52.5 MW (15 x 3.5 MW) 6. SHANNON, Ireland, 20 MW (4 x 5 MW) The methodology and presentation of this case studies is established as part of ALTENER Contract No. 4.1030/Z/01-103/2001. For further information and discussion please contact the project coordinator Green Globe Energy I/S or EMD on e-mail: hansb@post8.tele.dk or euroscan@post.tele.dk or pn@emd.dk.
  • 2.
    SEAWIND – projectdescription: MIDDELGRUNDEN, Denmark, 40 MW (20 x 2 MW) Figure 1 Photomontage from Copenhagen, 4,3 km from WTGs Project description Just 1.6 km to nearest part of the Capital of Denmark, Copenhagen, and less than 5 km from the “heart” of Copenhagen, the royal castle Amalienborg. A row (arc) of 20 x 2 MW Bonus WTGs at 64 m hub height and 76 m rotor diameter. The spacing is 175 m, which is only 2.3 RD. Grid connections from the trafo’s in each WTG (30 kV) are made with 2 parallel 30 kV lines from a collection point in the middle of the Windfarm to the power plant “Amagerværket” just at the shore. This is only 2.7 km away. The foundation type is gravity made of steel with an ice-breaking cone made of concrete. The water dept is 3-10 m. Organization and planning procedure The planning started 1998 initiated by the local environment and energy office in Copenhagen, a “grass root” organization. Together with the local utility “Copenhagen Electricity”, the development took form and with help from the Danish Energy Agency there were sponsored around 100 k€ to perform the needed investigations/planning. The project was given the final permission in 2000. This project was established in December 2000 – January 2001. 1
  • 3.
    Facts on layoutproposal and estimated investment costs WTG size layout specification and price Total installed power 40 MW Distanse in RD Number of rows 1 - WTGs per row )* 20 175 2.3 Number of WTGs 20 Hub height RD (m) Size of WTG 2 MW 64 76 Price information in this case are very rough estimates Price for WTGs, installed (k€) 26,840 671 €/kW Foundation, specification and cost estimate: 40 MW Type of foundation Gravity Number of foundations: 20 Water debt (m) 5 RD HH WTG-size (MW, rotor diameter, hub height) 2 76 64 Debt#1 Debt#2 Debt#3 Debt#4 Debt#5 Ice risk (yes/no) Yes 100 year max wind gust (m/s) ? 100 year max wawe height (m) ? Tidal difference (m) ? For all k€ k€ per pcs. €/kW Per foundation, debt dependend Fixed price. design cost, Fixed price, building/shipping facilities Fixed ground prepare cost Variable ground prepare cost Variable, building cost Installation cost SUM 9,920 496 248 Grid connection: Division into components partly estimated Number or Prices k€ Per unit or Off shore length (m) Voltage(kV) mm^2 Material Lines/cable For all per meter, € €/kW Sea cable, from wind farm to shore 5400 30 300 CU Cable 540 100 14 In row cables 0 30 300 CU Cable - 100 - Rows to collect point cables 3325 30 300 CU Cable 333 100 8 Cable roll out/Wash down, variable 6025 301 50 8 Cable roll out/wash down, fixed cost 500 500,000 13 Total number of WTG connectors *) 20 900 45,000 23 Off shore HV station 0 - - Connection (electrical work) Other fixed costs 1,000 1,000,000 25 Other variable costs On shore From shore to HV-grid HV station (if needed) Connection (electrical work) Compensation (reactive power) Other fixed costs 1,000 1,000,000 25 Other variable costs Total *) Incl. Transformers in WTGs !! 4,574 114 Total budget for 40 MW wind farm k€ € per kW Percent Note: There has WTGs 26,840 671 58% been added some Foundation 9,920 248 21% subsidy in the Grid connection 4,574 114 10% planning phase. Planning and permissioning 2,141 54 5% NOTE: In this Organisation, management 1,071 27 2% description, the Miscellaneous (e.g. risk) 1,606 40 3% WTG transformers TOTAL 46,152 1,154 100% are not included in WTG price, but in grid connection. 2
  • 4.
    Energy production, operationcost, PPA and economic feasibility. There were established a measure mast, 50m off shore near the site and measured for around 1 year. Unfortunately, the quality of the measurements was quite low due to low availability. Off shore measurements are more critically to perform than onshore. Based on as well local measurements as general wind data for Denmark, calculated mean wind speed for the site is around 7.4 m/s, slightly higher based on local mast. But especially the array losses are calculated much different due to different wind direction distribution. Based on local measure mast: 4500 MWh/year/WTG – array loss 14% Based on general wind data for DK: 5200 MWh/year/WTG – array loss 7% Experiences so far show around 5000 MWh/year/WTG as expected long-term energy production, corrected for availability and wind index. Goodness (actual wind index and availability corrected AEP/calculated This means that AEP) for Middelgrunden base on 1 year of operation calculations based 1.20 on general 1.10 experience from on shore wind data 1.00 gives a more precise estimate for 0.90 Goodness, local off shore mast calc. this wind farm than Goodness, DK92 on shore extrapolated wind data local off shore 0.80 measurements – Avg 1 2 3 4 5 6 7 8 9 10 11 12 13 14 15 16 17 18 19 20 but the wind farm WTG number are close to the shore, so it might not be a general conclusion that on shore extrapolations is better or good enough. Power purchase agreement Power purchace agreement øre/kWh €c/kWh For first 10 year, base price 33 fixed (until 2003) 4.44 CO2-bonus, extra all 20 years 10 fixed (politically decided) 1.35 First 12000 full load hour, extra 17 fixed (untill 2001) 2.29 Marked price after 10 year 23 Estimated 3.10 Operation costs and economic feasibility Based on onshore experience following figures have been used in the calculations: Operation cost onshore offshore estimate Insurance 5 €/kW/y 10 €/kW/y Service and maintenance 10 €/kW/y 18 €/kW/y Adm. and management 3 €/kW/y 5 €/kW/y SUM/year 18 €/kW/y 33 €/kW/y Per WTG: 1.3 €c/kWh/y Decommissioning 25 k€/WTG 0.6 €/kW/y Figure 2 Operation cost used in calculation. The resulting 1.3 €c/kWh is a little higher than expected for large-scale projects. The decommissioning costs is set very low here, while 3
  • 5.
    access is veryeasy and there should be good reasons to believe in that instead of decommissioning, repowering would be more likely. Figure 3 With 5000 MWh/y per 2 MW WTG, 7% interest rate, tax regulations for coop owned shares, O&M cost of 1.3 €c/kWh and the PPA for DK at the time of installation, a 10.4 year pay back time is expected. Figure 4 One share is here 1000 kWh/year, an investment of 462€. Note that only 2500 kWh/kW is produced due to Copenhagen relative close in main wind direction and relative small rotor area /kW. 4
  • 6.
    Environmental aspects: Figure 5The terrain profile (water dept with factor 5 oversize) shown for a part of the Windfarm clearly showing the low water ground which keep the water dept around 4 m for most of the WTGs. The proportions of the Amager Power plant are shown for comparison (actual size might differ – no information on the height is found). Figure 6 The 5 WTGs most south - WTG no. 20 is outside the 4 m dept with around 10 m, which increase the cost. Visual impact The visual impact was considered to be the only “real” environmental problem. Therefore several photomontages were made from many different spots as a part of the approval process, see example on front page. Of other possible concerns was the sea traffic and air traffic (location only 5.3 km from the main Airport of Scandinavia, Kastrup), but all aspects were handled in a positive dialogue – light marking on top of nacelle secures visibility for the air traffic. The methodology and presentation of this case study is established as part of ALTENER Contract No. 4.1030/Z/01-103/2001. For further information and discussion please contact the project coordinator Green Globe Energy I/S or EMD on e-mail: hansb@post8.tele.dk or euroscan@post.tele.dk or pn@emd.dk. 5
  • 7.
    SEAWIND – projectdescription: Butendiek, Germany, 240 MW (80 x 3 MW) Stylistic photomontage showing the visible part of the WTGs seen from Westerland, Sylt based on standard 45 mm focal length camera. Photo point is shown on map with green lines. Due to earth rounding only the upper half of rotor will be visible, indicated by red line. Below a heavy zoom at the closest WTG show that from 1.5 m a.s.l. around 20% of the 80 m high tower will be visible. Project description The proposed project is 35 km offshore outside Sylt, an island in the North Sea NW of Germany. The project consists of a 5 rows with 6-24 WTGs in total 80 WTGs. With 3 MW WTGs (size not yet decided), 240 MW will be installed. Each WTG is here assumed with a hub height of 80 m and a rotor diameter of 90 m. Calculations show that around 905 GWh could be produced annual. The proposed layout has 966 m spacing (10.7 rotor diameters) between rows, 478 (5.3 RD in row). The foundation type is assumed to be monopile at a water dept around 20 m. 6
  • 8.
    The project descriptionand the calculations performed are of initial nature and must be further consolidated. Facts on layout proposal and estimated investment costs WTG size layout specification and price Total installed power 240 MW Distanse in RD Number of rows 5 966 10.7 WTGs per row )* 16 478 5.3 Number of WTGs 80 Hub height RD (m) Size of WTG 3 MW 80 90 Price information in this case are very rough estimates Price for WTGs, installed (k€) 220,000 917 €/kW Foundation, specification and cost estimate: 240 MW Type of foundation Monopile Number of foundations: 80 Water debt (m) 20 RD HH WTG-size (MW, rotor diameter, hub height) 3 100 95 Debt#1 Debt#2 Debt#3 Debt#4 Debt#5 Ice risk (yes/no) No 100 year max wind gust (m/s) ? 100 year max wawe height (m) ? Tidal difference (m) ? For all k€ k€ per pcs. €/kW Per foundation, debt dependend Fixed price. design cost, Fixed price, building/shipping facilities Fixed ground prepare cost Variable ground prepare cost Variable, building cost Installation cost SUM 80,000 1000.005 333.3 Figure 1 Foundation costs are based on estimates so far. Number or Prices k€ Per unit or length (m) Voltage(kV) mm^2 Material Lines/cable For all per meter, € €/kW Sea cable, from wind farm to shore 35500 150 630 CU Cable 17,750 500 74 In row cables 3864 30 300 CU Cable 386 100 2 Rows to collect point cables 7170 30 300 CU Cable 717 100 3 Cable roll out/Wash down, variable 46534 2,327 50 10 Cable roll out/wash down, fixed cost 500 500,000 2 Total number of WTG connectors 80 2,000 25,000 8 Off shore HV station 1 150/30 kV 15,000 15,000,000 63 Connection (electrical work) Other fixed costs 2,000 2,000,000 8 Other variable costs From shore to HV-grid HV station (if needed) Connection (electrical work) Compensation (reactive power) Other fixed costs 34,320 34,320,000 143 Other variable costs 75,000 313 Figure 2 The sum is based on project calculations, but division into different parts is a rough estimate. Total budget for 240 MW wind farm k€ € per kW Percent Note: Cost WTGs 220,000 917 54% estimates are Foundation 80,000 333 20% based on Grid connection 75,000 313 19% estimates Planning and permissioning 12,135 51 3% made by the Organisation, management 8,090 34 2% project Miscellaneous (e.g. risk, reserve) 9,274 39 2% initiative group TOTAL 404,500 1,685 100% 7
  • 9.
    Expected energy production,and PPA The energy calculation based on wind data from Danish onshore experience. The WAsP calculation model is used from the WindPRO software tool, where the whole project is modeled. The calculation shows 905 GWh/year. From this uncertainty, grid losses and availability losses shall be withdrawn – probably around 12% at present stage, which makes almost 800 GWh/y, which is the estimate based on more detailed evaluations by Techwise. Figure 3 The energy calculation printout from WindPRO software. Knowledge from existing onshore wind farms near site combined with the Horns Rev (first large Offshore project in North Sea in DK installed end 2002) experience that now start to come, a more certain estimate can be made with relative limited effort. Installation of wind measurement mast at site would be preferable. German off shore PPA Number of months In years Price paid per kWh (start 2006) Increased subsidy 158 13.1 8.6 Decreased subsidy 5.7 Figure 4 The price paid per kWh are fixed in Germany for 20 years. For Off shore projects installed no later than 2006 outside three nautical miles outside baseline used to demarcate territorial waters, the increased price is at least 9 years (5 year on shore), 8
  • 10.
    Operation costs andeconomic feasibility Based on onshore experience following figures have been used in the calculations: Operation cost onshore offshore estimate Insurance 5 €/kW/y 10 €/kW/y Service and maintenance 10 €/kW/y 18 €/kW/y Adm. and management 3 €/kW/y 5 €/kW/y SUM/year 18 €/kW/y 33 €/kW/y Per WTG: 1.0 €c/kWh/y Decommissioning 50 k€/WTG 0.7 €/kW/y Figure 5 Operation cost used in calculation. The resulting 1 €c/kWh match well the DK utilities expectations for the calculated DK projects. The decommissioning costs is set relative low, but there should be good reasons to believe in that instead of decommissioning, repowering would be more likely. Figure 6 With the above estimated price development a payback time of 9.7 years will be expected. Tax calculations is not included, but these will typically have a positive influence on the pay back time due to tax credits from loans. Figure 7 One share is here 1000 kWh/year, an investment of 508€. 9
  • 11.
    Infrastructure, environmental aspects,time schedule etc. Figure 8 The wind farm shown on top of the map from North sea offshore show that the wind farm is within the important bird area zone, but detailed studies has confirmed that the site is accepted. Environment impact assessment Subsurface life Fish Birds Guinea pig, seal et. al. The conclusion is that none of the above topics will be disturbed in a way that rejects the project proposal. Security regarding ship collision The conclusion is that the risk is very low due to the remote location relative to main ship traffic. Visual impact Due to the long distance to nearest shore position at Sylt, the earth rounding influence, combined with prevailing weather conditions, the wind park will only be visual in very limited time and only a small part of it. Fishing Shrimp fishing will be reduced and compensation to the shrimp fishers will be negotiated. Time schedule The remaining contracts and financing including sale of the project for small investors will be done during 2003-2004. In 2003 the first part, the grid connection will start construction. In 2005 the off shore construction is planned. The methodology and presentation of this case study is established as part of ALTENER Contract No. 4.1030/Z/01-103/2001. For further information and discussion please contact the project coordinator Green Globe Energy I/S or EMD on e-mail: hansb@post8.tele.dk or euroscan@post.tele.dk or pn@emd.dk. 10
  • 12.
    SEAWIND – projectdescription: Aigues Mortes, 72 MW (24 x 3 MW) parallel row-layout Photomontage showing the WTGs seen from coastline based on standard 45 mm focal length camera. Photo point is shown on map with green lines giving the photo angle. Project description The proposed project is around 4 km offshore in the Montpellier region in southeastern France. The project consists of a matrix 8 x 3 WTGs, in total 24 WTGs. With 3 MW WTGs, 72 MW will be installed. Each WTG is here assumed with a hub height of 90 m and a rotor diameter of 98 m. Calculations show that around 268 GWh could be produced annual, but with very uncertain wind data. The proposed layout has 882 m spacing (9 rotor diameters) between rows, 686 m in row (7 RD). The foundation type is assumed to be monopile at a water dept from 10-20 m. 11
  • 13.
    Facts on layoutproposal and estimated investment costs WTG size layout specification and price Total installed power 72 MW Distanse in RD Number of rows 3 882 9.8 WTGs per row )* 8 686 7.6 Number of WTGs 24 Hub height RD (m) Size of WTG 3 MW 80 90 Price information in this case are very rough estimates Price for WTGs, installed (k€) 61,200 850 €/kW Foundation, specification and cost estimate: 72 MW Type of foundation Monopile Number of foundations: 24 Water debt (m) 20 RD HH WTG-size (MW, rotor diameter, hub height) 3 100 95 Debt#1 Debt#2 Debt#3 Debt#4 Debt#5 Ice risk (yes/no) No 100 year max wind gust (m/s) ? 100 year max wawe height (m) ? Tidal difference (m) ? For all k€ k€ per pcs. €/kW Per foundation, debt dependend Fixed price. design cost, Fixed price, building/shipping facilities Fixed ground prepare cost Variable ground prepare cost Variable, building cost Installation cost SUM 24,000 1000.005 333.3 Figure 1 Foundation costs are very roughly estimates while no detailed data on water, weather and sea bottom conditions are available so far. Grid connection: Number or Prices k€ Per unit or Off shore length (m) Voltage(kV) mm^2 Material Lines/cable For all per meter, € €/kW Sea cable, from wind farm to shore 8000 30 630 CU Cable 4,000 500 56 In row cables 4802 30 300 CU Cable 480 100 7 Rows to collect point cables 1764 30 300 CU Cable 176 100 2 Cable roll out/Wash down, variable 10566 528 50 7 Cable roll out/wash down, fixed cost 500 500,000 7 Total number of WTG connectors 24 600 25,000 8 Off shore HV station 0 150/30 kV - 15,000,000 - Connection (electrical work) Other fixed costs 1,000 1,000,000 14 Other variable costs On shore From shore to HV-grid HV station (if needed) Connection (electrical work) Compensation (reactive power) Other fixed costs 500 500,000 7 Other variable costs Total 7,785 108 Figure 2 No detailed specifications available, but 2 x 30 kV lines in parallel is assumed sufficient for connection for nearest 30 kV line. Total budget for 72 MW wind farm k€ € per kW Percent Note: Cost WTGs 61,200 850 61% estimates are Foundation 24,000 333 24% based on rough Grid connection 7,785 108 8% scaling of mainly Planning and permissioning 3,009 42 3% experience from Organisation, management 2,006 28 2% Danish offshore Miscellaneous (e.g. risk, reserve) 2,300 32 2% projects. TOTAL 100,300 1,393 100% 12
  • 14.
    Expected energy production,and PPA The energy calculation based on wind data from EU-Windatlas data at Perpignan get a calculated mean wind speed level at 9.2 m/s in 50 m h.a.s.l. This is probably some optimistic. The WAsP calculation model is used from the WindPRO software tool, where the whole project is modeled. The onshore surface roughness has been taken into consideration in the calculation that shows 252 GWh/year. From this uncertainty, grid losses and availability losses shall be withdrawn – especially due to the lack of local wind data, 20% at present stage is withdrawn, which makes 202 GWh. Figure 3 The energy calculation printout from WindPRO software. Knowledge from existing onshore wind farms near site combined with the Horns Rev (first large Offshore project in North Sea in DK installed end 2002) experience that now start to come, a more certain estimate can be made with relative limited effort. Installation of wind measurement mast at site would be preferable. Power purchase agreement For offshore wind farms no regulations is known so far, so the estimates from Spain is used. Here analyses indicates that a level of 6.3 €c/kWh should be a realistic level. This value is used in the economic calculation with an inflation of 2% per year. But this is an uncertain factor that shall be evaluated further. 13
  • 15.
    Operation costs andeconomic feasibility Based on onshore experience following figures have been used in the calculations: Operation cost onshore offshore estimate Insurance 5 €/kW/y 10 €/kW/y Service and maintenance 10 €/kW/y 18 €/kW/y Adm. and management 3 €/kW/y 5 €/kW/y SUM/year 18 €/kW/y 33 €/kW/y Per WTG: 1.2 €c/kWh/y Decommissioning 50 k€/WTG 0.8 €/kW/y Figure 4 Operation cost used in calculation. The resulting 1.2 €c/kWh is a little more than DK utilities expectations for the calculated DK projects. The decommissioning costs is set relative low, but there should be good reasons to believe in that instead of decommissioning, repowering would be more likely. Figure 5 With the above estimated price development a payback time of 14.1 years will be expected. Tax calculations are not included. The feasibility is not looking to promising, more investigations that indicate reduced costs, better energy production or higher PPA will be needed. Figure 6 One share is here 1000 kWh/year, an investment of 498€. 14
  • 16.
    Infrastructure, environmental aspectsetc. needs investigations. Figure 7 A map with different restriction zones and the proposed sites for offshore wind farms (red boxes). Due to the fast increasing water dept, probably only a few of the sites will be realistic with present technology. The red lines show 30 kV grid and green the 150 kV grid lines. Blue lines are water dept. Figure 8 The seabed profile from shore including the 3 rows of WTGs The Environmental Impact Assessment will be a major part of the needed project documentation. The methodology and presentation of this case study is established as part of ALTENER Contract No. 4.1030/Z/01-103/2001. For further information and discussion please contact the project coordinator Green Globe Energy I/S or EMD on e-mail: hansb@post8.tele.dk or euroscan@post.tele.dk or pn@emd.dk. 15
  • 17.
    SEAWIND – projectdescription: Ebro Delta, Spain, 210 MW (60 x 3.5 MW) arc-layout. Photomontage showing the WTGs seen from Ampolla based on standard 45 mm focal length camera. Photo point is shown on map with green lines giving the photo angle. Project description The proposed project is around 5 km offshore outside the Ebro Delta in northeastern Spain. The project consists of a 4 arcs with 15 WTGs in total 60 WTGs. With 3.5 MW WTGs, 210 MW will be installed. Each WTG is here assumed with a hub height of 95 m and a rotor diameter of 100 m. Calculations show that around 580 GWh could be produced annual, but with very uncertain wind data. The proposed layout has 1183 m spacing (11.8 rotor diameters) between arcs, 600 m in average (410-800) in the arcs (6 RD). The foundation type is assumed to be monopile at a water dept from 5-25 m. This layout proposal is very special and will have an “origin” from where all WTGs can be seen as parallel rows. This should for sure be the place where an “info building” should be made and this could be an attractive “tourism spot” where many would like to come and see the Windfarm. The project description and the calculations performed are of initial nature and must be further consolidated. 16
  • 18.
    Facts on layoutproposal and estimated investment costs WTG size layout specification and price Total installed power 210 MW Distanse in RD Number of rows 4 1183 11.8 WTGs per row )* 15 Average 600 6.0 Number of WTGs 60 Hub height RD (m) Size of WTG 3.5 MW 95 100 Price information in this case are very rough estimates Price for WTGs, installed (k€) 178,500 850 €/kW Foundation, specification and cost estimate: 210 MW Type of foundation Monopile Number of foundations: 60 Water debt (m) 20 RD HH WTG-size (MW, rotor diameter, hub height) 3.5 100 95 Debt#1 Debt#2 Debt#3 Debt#4 Debt#5 Ice risk (yes/no) No 100 year max wind gust (m/s) ? 100 year max wawe height (m) ? Tidal difference (m) ? For all k€ k€ per pcs. €/kW Per foundation, debt dependend Fixed price. design cost, Fixed price, building/shipping facilities Fixed ground prepare cost Variable ground prepare cost Variable, building cost Installation cost SUM 94,500 1575 450 Figure 1 Foundation costs are very roughly estimates while no detailed data on water, weather and sea bottom conditions are available so far. Grid connection: Number or Prices k€ Per unit or Off shore length (m) Voltage(kV) mm^2 Material Lines/cable For all per meter, € €/kW Sea cable, from wind farm to shore 18000 150 630 CU Cable 9,000 500 43 In row cables 3549 30 300 CU Cable 355 100 2 Rows to collect point cables 8400 30 300 CU Cable 840 100 4 Cable roll out/Wash down, variable 29949 1,497 50 7 Cable roll out/wash down, fixed cost 500 500,000 2 Total number of WTG connectors 60 1,500 25,000 7 Off shore HV station 1 150/30 kV 10,000 10,000,000 48 Connection (electrical work) Other fixed costs 1,000 1,000,000 5 Other variable costs On shore From shore to HV-grid HV station (if needed) Connection (electrical work) Compensation (reactive power) Other fixed costs 1,000 1,000,000 5 Other variable costs Total 25,692 122 Figure 2 No detailed specifications available. Needs detailed analyses. Total budget for 210 MW wind farm k€ € per kW Percent Note: Cost WTGs 178,500 850 50% estimates are based on rough Foundation 94,500 450 27% scaling of mainly Grid connection 25,692 122 7% experience from Planning and permissioning 28,447 135 8% Danish offshore Organisation, management 10,668 51 3% projects. Miscellaneous (e.g. risk) 17,779 85 5% TOTAL 355,586 1,693 100% 17
  • 19.
    Expected energy production,and PPA The energy calculation based on wind data from EU-Windatlas data at Zaragossa mixed with some very short local measurement from Munesia. The mix is used to get a calculated mean wind speed level at 7.7 m/s in 100m h.a.s.l. which is the level indicated by a study performed based on many different sources, that indicate from 6.7 – 8.5 m/s. The WAsP calculation model is used from the WindPRO software tool, where the whole project is modeled. The onshore surface roughness has been taken into consideration in the calculation that shows 583 GWh/year. From this uncertainty, grid losses and availability losses shall be withdrawn – especially due to the lack of local wind data, 25% at present stage is withdrawn, which makes 437 GWh. But this will be too small production for feasibility. Therefore the economic calculations are based on the calculated value – so more precise wind data is a must here. Figure 3 The energy calculation printout from WindPRO software. Knowledge from existing onshore wind farms near site combined with the Horns Rev (first large Offshore project in North Sea in DK installed end 2002) experience that now start to come, a more certain estimate can be made with relative limited effort. Installation of wind measurement mast at site would be preferable. Power purchase agreement In Spain, both a fixed and a variable tariff structure are available. Analyses indicates that a level of 6.3 €c/kWh should be a realistic level. This value is used in the economic calculation with an inflation of 2% per year. But this is an uncertain factor that shall be evaluated further. 18
  • 20.
    Operation costs andeconomic feasibility Based on onshore experience following figures have been used in the calculations: Operation cost onshore offshore estimate Insurance 5 €/kW/y 10 €/kW/y Service and maintenance 10 €/kW/y 18 €/kW/y Adm. and management 3 €/kW/y 5 €/kW/y SUM/year 18 €/kW/y 33 €/kW/y Per WTG: 1.0 €c/kWh/y Decommissioning 50 k€/WTG 0.7 €/kW/y Figure 4 Operation cost used in calculation. The resulting 1 €c/kWh match well the DK utilities expectations for the calculated DK projects. The decommissioning costs is set relative low, but there should be good reasons to believe in that instead of decommissioning, repowering would be more likely. Figure 5 With the above estimated price development a payback time of 16.5 years will be expected. Tax calculations are not included. The feasibility is not looking to promising, more investigations that indicate reduced costs or better energy production will be needed. Figure 6 One share is here 1000 kWh/year, an investment of 610€. 19
  • 21.
    Infrastructure, environmental aspectsetc. needs investigations. Figure 7 A photomontage of the wind farm from the top of the Water tower. The Environmental Impact Assessment will be a major part of the needed project documentation. The methodology and presentation of this case study is established as part of ALTENER Contract No. 4.1030/Z/01-103/2001. For further information and discussion please contact the project coordinator Green Globe Energy I/S or EMD on e-mail: hansb@post8.tele.dk or euroscan@post.tele.dk or pn@emd.dk. 20
  • 22.
    YORKSHIRE FORELAND, UK,52.5 MW (15 x 3.5 MW) Photomontage showing the visibility from coastline at Easington based on standard 45 mm focal length camera. Photo point is shown on map with green lines. Project description The proposed project is 4.5 km offshore outside Kilnsea, Humberside, around 18 km east of Grimsby. The project consists of a bow with 15 3,5 MW WTGs which makes 52,5 MW in all. Each WTG is assumed with a hub height of 95 m and a rotor diameter of 100 m. Some very rough preliminary calculations show that around 800 GWh could be produced annual. The proposed layout has 600 m spacing (6 rotor diameters) – the circle bow has 10 km radius. Grid connections are assumed obtained with one or more direct 30 kV lines to Grimsby. The foundation type is assumed to be monopole at a water dept less than 20 m. The project description and the calculations performed are of initial nature and must be further consolidated. 21
  • 23.
    Facts on layoutproposal and estimated investment costs WTG size layout specification and price Total installed power 52.5 MW Distance in RD Number of rows 1 x x WTGs per row )* 15 600 6.0 Number of WTGs 15 Hub height RD (m) Size of WTG 3.5 MW 95 100 Price information in this case are very rough estimates Price for WTGs, installed (k€) 44,625 850 €/kW Foundation, specification and cost estimate: 52.5 MW Type of foundation Monopile Number of foundations: 15 Water debt (m) 20 RD HH WTG-size (MW, rotor diameter, hub height) 3.5 100 95 Debt#1 Debt#2 Debt#3 Debt#4 Debt#5 Ice risk (yes/no) No 100 year max wind gust (m/s) ? 100 year max wawe height (m) ? Tidal difference (m) ? For all k€ k€ per pcs. €/kW Per foundation, debt dependend Fixed price. design cost, Fixed price, building/shipping facilities Fixed ground prepare cost Variable ground prepare cost Variable, building cost Installation cost SUM 23,625 1575 450 Figure 1 Foundation costs are very roughly estimates while no detailed data on water, weather and sea bottom conditions are available so far. Grid connection: Number or Prices k€ Per unit or Off shore length (m) Voltage(kV) mm^2 Material Lines/cable For all per meter, € €/kW Sea cable, from wind farm to shore 36000 30 300 CU Cable 3,600 100 69 In row cables 0 30 300 CU Cable - 100 - Rows to collect point cables 8400 30 300 CU Cable 840 100 16 Cable roll out/Wash down, variable 26400 1,320 50 25 Cable roll out/wash down, fixed cost 200 200,000 4 Total number of WTG connectors 15 375 25,000 7 Off shore HV station 0 - - Connection (electrical work) Other fixed costs 300 300,000 6 Other variable costs On shore From shore to HV-grid HV station (if needed) Connection (electrical work) Compensation (reactive power) Other fixed costs 500 500,000 10 Other variable costs Total 7,135 136 Figure 2 In this calculation 2 parallel 30 kV cables are assumed to Grimsby. Needs detailed analyses. Total budget for 52.5 MW wind farm k€ € per kW Percent Note: Cost WTGs 44,625 850 50% estimates are Foundation 23,625 450 26% based on rough Grid connection 7,135 136 8% scaling of mainly Planning and permissioning 7,180 137 8% experience from Organisation, management 2,692 51 3% Danish offshore Miscellaneous (e.g. risk) 4,487 85 5% projects. TOTAL 89,744 1,709 100% 22
  • 24.
    Expected energy production,and PPA The energy calculation based on wind data from nearest EU-Windatlas data at Waddington (which might be quite uncertain) is performed. The WAsP calculation model is used from the WindPRO software tool, where the whole project is modeled. The onshore surface roughness towards west has been taken into consideration in the calculation that shows 226 GWh/year. From this uncertainty, grid losses and availability losses shall be withdrawn – probably around 20% at present stage, which makes 181 GWh. Figure 3 The energy calculation printout from WindPRO software. Knowledge from existing onshore wind farms near site combined with the Horns Rev (first large Offshore project in North Sea in DK installed end 2002) experience that now start to come, a more certain estimate can be made with relative limited effort. Installation of wind measurement mast at site would be preferable. UK-WTG electricity price £/MWh €/kWh min max min max Average Comment Brown electricity price 12 18 0.019 0.029 0.024 Inflated Climatee Change Levy 4.3 0.000 0.007 0.003 limited to 12000 full load hour Ren. Obl. Cert. (ROC) 30 50 0.048 0.081 0.065 non inflated, very uncertain Local prod. benefit 1.5 0.000 0.002 0.001 Inflated Total 42 73.8 0.068 0.119 0.094 Figure 4 The price paid per kWh and especially the development is uncertain. To minimize the risk, it could be an option to make long-term contracts, especially for the ROC's. The CCL is only included the first 12000 full load hours, simply due to lack of knowledge of future expectations. 23
  • 25.
    Operation costs andeconomic feasibility Based on onshore experience following figures have been used in the calculations: Operation cost onshore offshore estimate Insurance 5 €/kW/y 10 €/kW/y Service and maintenance 10 €/kW/y 18 €/kW/y Adm. and management 3 €/kW/y 5 €/kW/y SUM/year 18 €/kW/y 33 €/kW/y Per WTG: 1.0 €c/kWh/y Decommissioning 50 k€/WTG 0.7 €/kW/y Figure 5 Operation cost used in calculation. The resulting 1 €c/kWh match well the DK utilities expectations for the calculated DK projects. The decommissioning costs is set relative low, but there should be good reasons to believe in that instead of decommissioning, repowering would be more likely. Additionally 2% of total income is added for rent to Crown Estate. Figure 6 With the above estimated price development a payback time of 9.6 years will be expected. Tax calculations is not included, but these will typically have a positive influence on the pay back time due to tax credits from loans. Figure 7 One share is here 1000 kWh/year, an investment of 496€. 24
  • 26.
    Infrastructure, environmental aspectsetc. needs investigations. Figure 8 The wind farm shown on top of the map from dti’s WindBase. This show that the site is within the 5-20 m water dept and that it does not conflict with major traffic routes. The Ramsars and Natural nature reserves indicate no problems for this specific site. There will be a 30- month investigation and documentation phase in order to achieve a building permission, where the Environmental Impact Assessment will be a major part. 25
  • 27.
    SHANNON, EI, 20MW (4 x 5 MW) Photomontage showing the visibility from coastline at shore grid connection point based on standard 45 mm focal length camera. Project description The proposed project is 1.5 km offshore in the “Mouth of Shannon”. The proposed project consists of 4x 5 MW WTGs, which makes 20 MW in all. Each WTG is assumed with a hub height of 110 m and a rotor diameter of 115 m. Some very rough preliminary calculations show that around 75 GWh could be produced annual. The proposed layout has 1000 m spacing (8.7 rotor diameters). Grid connections are assumed obtained with an offshore 1.5 km 38 kV sea cable + a 11.5 km direct 38 kV lines on shore to a 110 kV station, which should be capable to take 25 MW. The foundation type is assumed to be monopole at a water dept less than 20 m. The project description and the calculations performed are of initial nature and must be further consolidated. 26
  • 28.
    Facts on layoutproposal and estimated investment costs WTG size layout specification and price Total installed power 20 MW Distanse in RD Number of rows 1 0 - WTGs per row )* 4 1000 8.7 Number of WTGs 4 Hub height RD (m) Size of WTG 5 MW 110 115 Price information in this case are very rough estimates Price for WTGs, installed (k€) 17,000 850 €/kW Figure 1 No experience with 5 MW WTGs so far, so the 2-3 MW experience is just up scaled. Foundation, specification and cost estimate: 20 MW Type of foundation Monopile Number of foundations: 4 Water debt (m) 20 RD HH WTG-size (MW, rotor diameter, hub height) 5 115 110 Debt#1 Debt#2 Debt#3 Debt#4 Ice risk (yes/no) No 100 year max wind gust (m/s) ? 100 year max wawe height (m) ? Tidal difference (m) ? For all k€ k€ per pcs. €/kW Per foundation, debt dependend Fixed price. design cost, Fixed price, building/shipping facilities Fixed ground prepare cost Variable ground prepare cost Variable, building cost Installation cost SUM 10,000 2500 500 Figure 2 Foundation costs are very roughly estimates while no detailed data on water, weather and sea bottom conditions are available so far. Due to the low number of WTGs rater high p.u. price is assumed. Grid connection: Number or Prices k€ Per unit or Off shore length (m) Voltage(kV) mm^2 Material Lines/cable For all per meter, € €/kW Sea cable, from wind farm to shore 1500 38 300 CU Cable 150 100 8 In row cables 0 38 300 CU Cable - 100 - Rows to collect point cables 3000 38 300 CU Cable 300 100 15 Cable roll out/Wash down, variable 4500 225 50 11 Cable roll out/wash down, fixed cost 200 200,000 10 Total number of WTG connectors 4 100 25,000 5 Off shore HV station 0 - - Connection (electrical work) Other fixed costs 300 300,000 15 Other variable costs On shore From shore to HV-grid 11500 38 1,035 90 52 HV station (if needed) Connection (electrical work) Compensation (reactive power) Other fixed costs 250 250,000 13 Other variable costs Total 2,560 128 Figure 3 In this calculation a 38 kV cable to nearest assumed 150 kV grid is included. Needs detailed analyses. Total budget for 20 MW wind farm k€ € per kW Percent Note: Cost estimates WTGs 17,000 850 48% are based on rough Foundation 10,000 500 28% scaling of mainly Grid connection 2,560 128 7% experience from Danish Planning and permissioning 1,056 53 3% offshore projects. The Organisation, management 1,056 53 3% risk is estimated higher Miscellaneous (e.g. risk) 3,519 176 10% due to the non- TOTAL 35,190 1,760 100% approved WTG size. 27
  • 29.
    Expected energy production,and PPA The energy calculation based on wind data from nearest EU-Windatlas data at Shannon – this should be a quite safe estimate while the Shannon data is measured around 60 km more towards east and the wind climate has shown to increase towards west. There are WTGs at Beal Hill close to the site – these could give very precise indications on the local energy level. The WAsP calculation model is used from the WindPRO software tool, where the whole project is modeled. The onshore surface roughness towards east has been taken into consideration in the calculation that shows 75 GWh/year. From this uncertainty, grid losses and availability losses shall be withdrawn – but this is probably fully included in the conservative wind data. Figure 4 The energy calculation printout from WindPRO software. PPA: 8.4 €c/kWh first 15 years reserved for 50 MW offshore in AER VI – this is inflated with consumer price index. Bid with lowest price will get accept first. 28
  • 30.
    Operation costs andeconomic feasibility Based on onshore experience following figures have been used in the calculations: Operation cost onshore offshore estimate Insurance 5 €/kW/y 10 €/kW/y Service and maintenance 10 €/kW/y 35 €/kW/y Adm. and management 3 €/kW/y 5 €/kW/y SUM/year 18 €/kW/y 50 €/kW/y Per WTG: 1.3 €c/kWh/y Decommissioning 50 k€/WTG 0.5 €/kW/y Figure 5 Operation cost used in calculation. The resulting 1.3 €c/kWh is around 30% higher than utilities expectations for the calculated DK projects. The reason is the small number of WTGs and the unproven WTG type. The decommissioning costs is set relative low, but there should be good reasons to believe in that instead of decommissioning, repowering would be more likely. Figure 6 With the above estimated price development a payback time of 9.1 years will be expected. Tax calculations is not included, but these will typically have a positive influence on the pay back time due to tax credits from loans. Note only a part of the subsidy price is inflated with 2% inflation (safe price dev.) Figure 7 One share is here 1000 kWh/year, an investment of 470€. 29