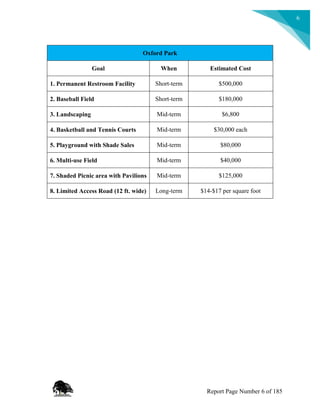
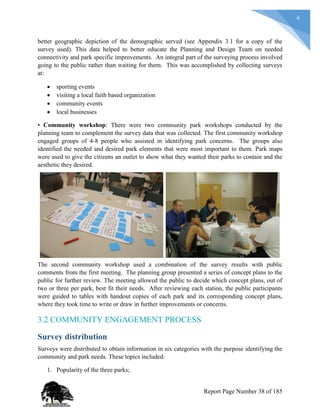
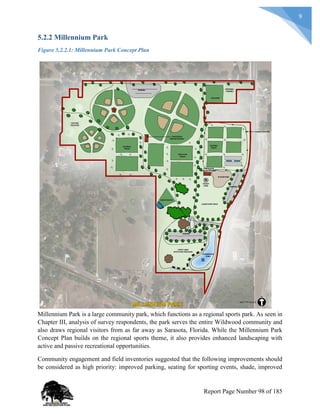
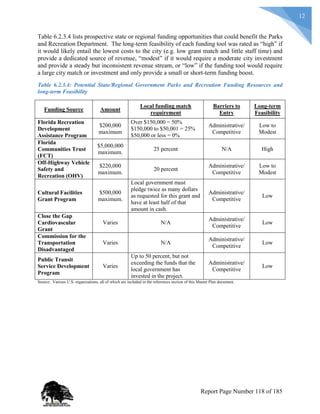
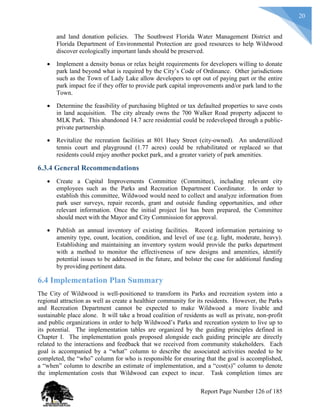
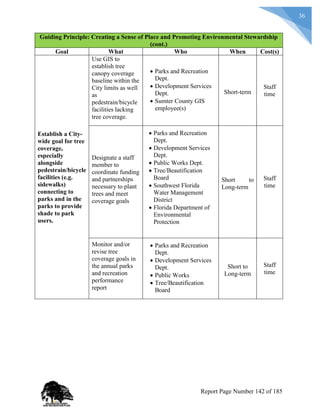
This document provides an introduction and overview for the City of Wildwood Parks and Recreation Master Plan. The purpose is to evaluate the existing park system and provide recommendations to meet the needs of the current and future population over the next 20 years. Key parks included are Millennium Park, Martin Luther King Jr. Park, and Oxford Park. The plan establishes a vision, goals, and guiding principles focused on community engagement, sense of place, accessibility, and equitable distribution of resources. Benefits of well-maintained park systems are outlined such as increased property values, health cost savings, and stormwater management. An overview of the planning process is also provided.
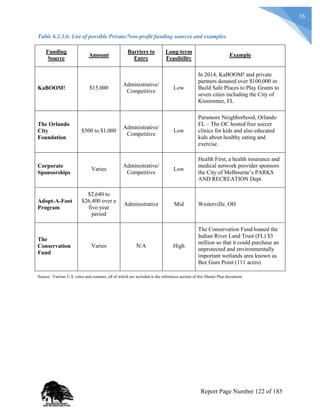

![Works Cited
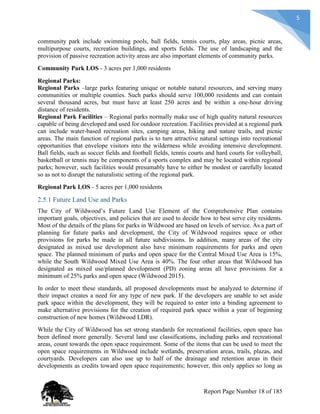
BEBR. (n.d.). Population Studies Program. Retrieved from Bureau of Economic and
Business Research:
https://www.bebr.ufl.edu/sites/default/files/Research%20Reports/projections_2016.pdf
Become a Partner - National Inclusion Project. (n.d.). Retrieved March 17, 2016, from
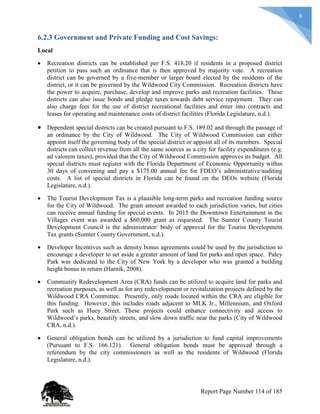
http://www.inclusionproject.org/lets-all-play/become-a-partner/
Before I Die. (n.d.). Retrieved April 16, 2016 from http://beforeidie.cc
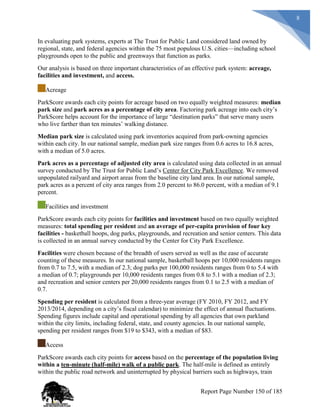
Cape Coral Department of Community Development. (2013). Recreation and
Open Space: Goals, Objectives, and Policies.
City of Apopka. (n.d.). Audited financial statements. Retrieved March 12,
2016, from http://www.apopka.net/departments/finance/
financial-services/audited-financial-statements.html
City of Apopka. (n.d.). City budgets. Retrieved March 12, 2016, from
http://www.apopka.net/departments/finance/financial-services/
city-budgets.html
City of Apopka. (2015, January 5). City of Apopka Impact Fee Information
Guide 2015 [PDF]. Retrieved from http://www.apopka.net/images/
2015%20City%20Impact%20Fee%20Guide.pdf
City of Apopka. (n.d.). Home Page. Retrieved from City of Apopka:
http://www.apopka.net/index.php
City of Belleview. (n.d.). Budgets. Retrieved March 12, 2016, from
http://www.belleviewfl.org/Finance/Pages/Budgets.aspx
City of Belleview. (n.d.). CAFRs. Retrieved March 12, 2016, from
http://www.belleviewfl.org/Finance/Pages/CAFRs.aspx
City of Belleview. (n.d.). Chapter 58: Parks and recreation. Retrieved March
12, 2016, from https://www.municode.com/library/fl/belleview/codes/
code_of_ordinances
City of Belleview. (2009) City Of Belleview Comprehensive Plan. Retrieved from
http://www.belleviewfl.org/ds/Documents/compplan.pdf
City of Belleview. (n.d.). Home Page. Retrieved from City of Bellview, City With Small
Town Charm: http://www.belleviewfl.org/Pages/default.aspx
City of Fort Myers. (2010, October 26). City of Fort Myers Comprehensive Plan. Retrieved from
http://www.cityftmyers.com/DocumentCenter/View/586
City of Henderson. (2009, April 24). City of Henderson parks and recreation
master plan [PDF]. Retrieved from http://www.cityofhenderson
.com/docs/default-source/Parks-Recreation/parks-and-recreation-
master-plan.pdf?sfvrsn=0
City of Melbourne. (2016). Parks & Recreation. Retrieved March 17, 2016, from
http://www.melbourneflorida.org/departments/parks-recreation
City of Miami. (2007, July 2). Miami parks and public spaces master plan
[PDF]. Retrieved from http://www.miamigov.com/planning/docs/plans
/MP/Parks_Master_Plan.pdf
City of Orlando. (n.d.). Orlando Community & Youth Trust. Retrieved March 17, 2016, from
http://www.cityoforlando.net/fpr/orlando-community-youth-trust/
Report Page Number 181 of 185](https://image.slidesharecdn.com/89ff9653-e304-4208-a630-b145f91856a6-160513015919/85/Wildwood_Final_Report-182-320.jpg)
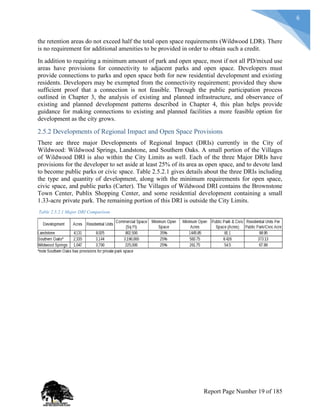
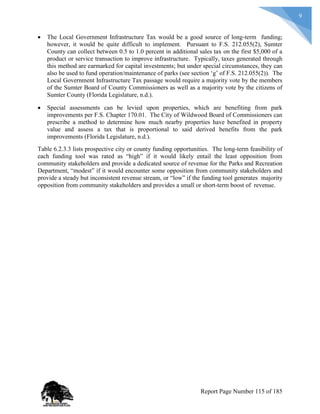
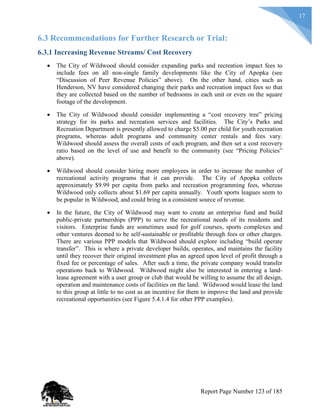
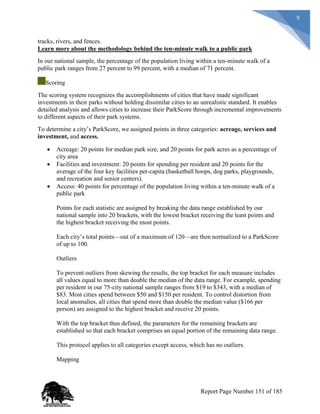
![National Endowment for the Arts. (n.d.). Grants. Retrieved March 17, 2016, from
https://www.arts.gov/grants-organizations/our-town/we-do-not-fund
National Recreation and Park Association. (2015, April 1). NRPA's 2015 field
report: A parks and recreation national database anaylsis [PDF].
Retrieved from http://www.nrpa.org/uploadedFiles/PageBuilder
_Proragis/Content/common_elelments/Field-Report.pdf
National Recreation and Park Association. (2016). CAPRA Standards. Retrieved from
National Recreation and Park Association:
http://www.nrpa.org/Professional-Development/Accreditation/CAPRA/CAPRA-
Standards/
Orlando City Foundation. (2016). Success Stories. Retrieved March 17, 2016, from
http://www.orlandocitysc.com/foundation/successes
Parks, Recreation, & Cultural Services. (2016, February 25). National Inclusion Project
Announces Partnership. Retrieved March 14, 2016, from
https://parks.coloradosprings.gov/cat/explore-play/play-programs/therapeutic-
recreation/national-inlcusion-project-announces-0
Pinellas County Government. (n.d.). Penny for Pinellas: Penny overview
[PDF]. Retrieved from http://www.pinellascounty.org/Penny/
overview.html
Promoting Trails & Greenways in Indiana. (2016). Retrieved March 17, 2016, from
http://www.indygreenways.org/about.html
Randolph, J. (2004). Environmental Land Use Planning and Management: Creating Sustainable
Communities, Watersheds, and Ecosystems (Vol. Second Edition). Washington, DC:
Island Press.
Remote Lock (n.d.). Property Management. Retrieved April 16, 2016 from
http://remotelock.com/solutions/property-management/
Rodrigue, J.-P. (n.d.). Public private partnership options. Retrieved March
15, 2016, from https://people.hofstra.edu/geotrans/eng/ch7en/
ppl7en/ppp.html
Schimberg. (n.d.). Housing Profile Wildwood, Florida. Retrieved March 22, 2016, from Florida
Housing Data Clearinghouse:
http://flhousingdata.shimberg.ufl.edu/a/profiles?action=results&nid=6018&image2.x=16
&image2.y=15
Smith, P. (2015, November 06). Trails and Sidewalks, GIS Layer File. Orlando, Florida, United
States.
Stricklen, Albert L. (2011) Appraisal of The Proposed CR 468 Fee Simple Acquisition, WRA B
and WRA C located in the Proposed Southern Oaks DRI in the City of Wildwood.
Retrieved from
http://www.sumtercountyfl.gov/AgendaCenter/ViewFile/Item/361?fileID=711
Sumter County Government. (n.d.). Tourist development council
information. Retrieved March 12, 2016, from http://www.sumter
countyfl.gov/621/Agendas-and-Minutes
Sumter County Property Appraiser. (n.d.). Retrieved March 12, 2016, from
http://www.sumterpa.com/GIS/
Report Page Number 184 of 185](https://image.slidesharecdn.com/89ff9653-e304-4208-a630-b145f91856a6-160513015919/85/Wildwood_Final_Report-185-320.jpg)
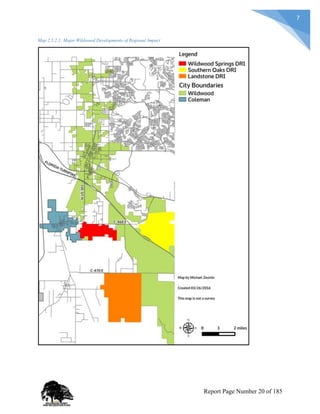
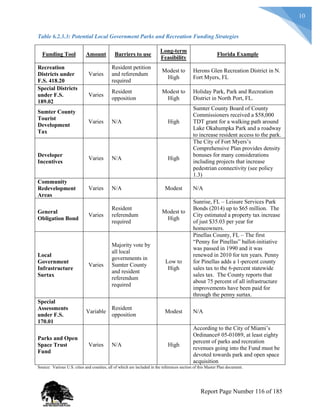
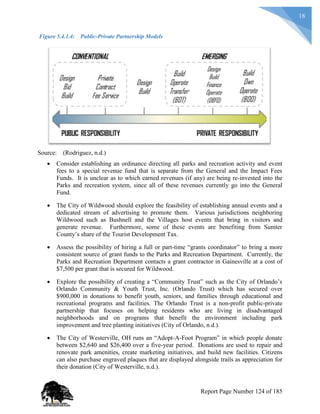
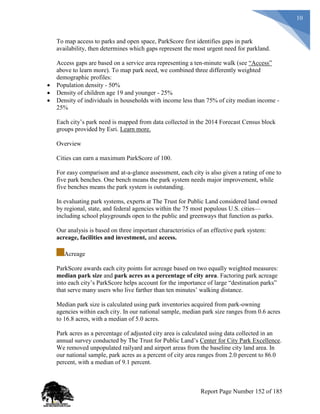
![Synapse (2016). Outdoor Lighting Solutions. Retrieved April 16, 2016 from http://synapse-
wireless.com/industry-iot-solutions/lighting-controls/outdoor
The Conservation Fund. (2016). Land Conservation Loans. Retrieved March 17, 2016, from
http://www.conservationfund.org/what-we-do/land-conservation-loans
The Trust For Public Lands. (2015). Methodology. Retrieved February 27, 2016, from
ParkScore: http://parkscore.tpl.org/methodology.php
Town of Lady Lake. (n.d.). Finance. Retrieved March 12, 2016, from
http://ladylake.org/departments/finance
Town of Lady Lake. (2010). Home Page. Retrieved from Town of Lady Lake:
http://ladylake.org/
Town of Lady Lake. (2010, March 25). Ordinance No. 2008-30 [PDF].
Retrieved from http://ladylake.org/wp-content/uploads/2010/07/
Park-Impact-Fee-Ord-2008-30.pdf
University of Florida Bureau of Economic and Business Research. (n.d.).
Profiles. Retrieved March 12, 2016, from http://flhousingdata.
shimberg.ufl.edu/
University of Florida IFAS Extension. (2006). Sumter County 4-H Youth Development.
Retrieved March 17, 2016, from http://sumter.ifas.ufl.edu/4-h/
U.S. Census Bureau (2011) Age and Sex Composition: 2010; 2010 Census Briefs. Retrieved
from http://www.census.gov/prod/cen2010/briefs/c2010br-03.pdf
United States Census Bureau. (n.d.). Community Facts. Retrieved March 12, 2016, from
American Fact Finder:
http://factfinder.census.gov/faces/nav/jsf/pages/community_facts.xhtml
Vandal Shields (2014). Outdoor Lighting Protection Accessories. Retrieved April 16, 2016 from
http://www.vandalshields.com/
Volunteer Florida. (2016). Grants. Retrieved March 17, 2016, from
http://www.volunteerflorida.org/grants/
Wildwood Development Services. (2016, March 02). Approved Development Plans. Wildwood,
Florida, United States.
Report Page Number 185 of 185](https://image.slidesharecdn.com/89ff9653-e304-4208-a630-b145f91856a6-160513015919/85/Wildwood_Final_Report-186-320.jpg)