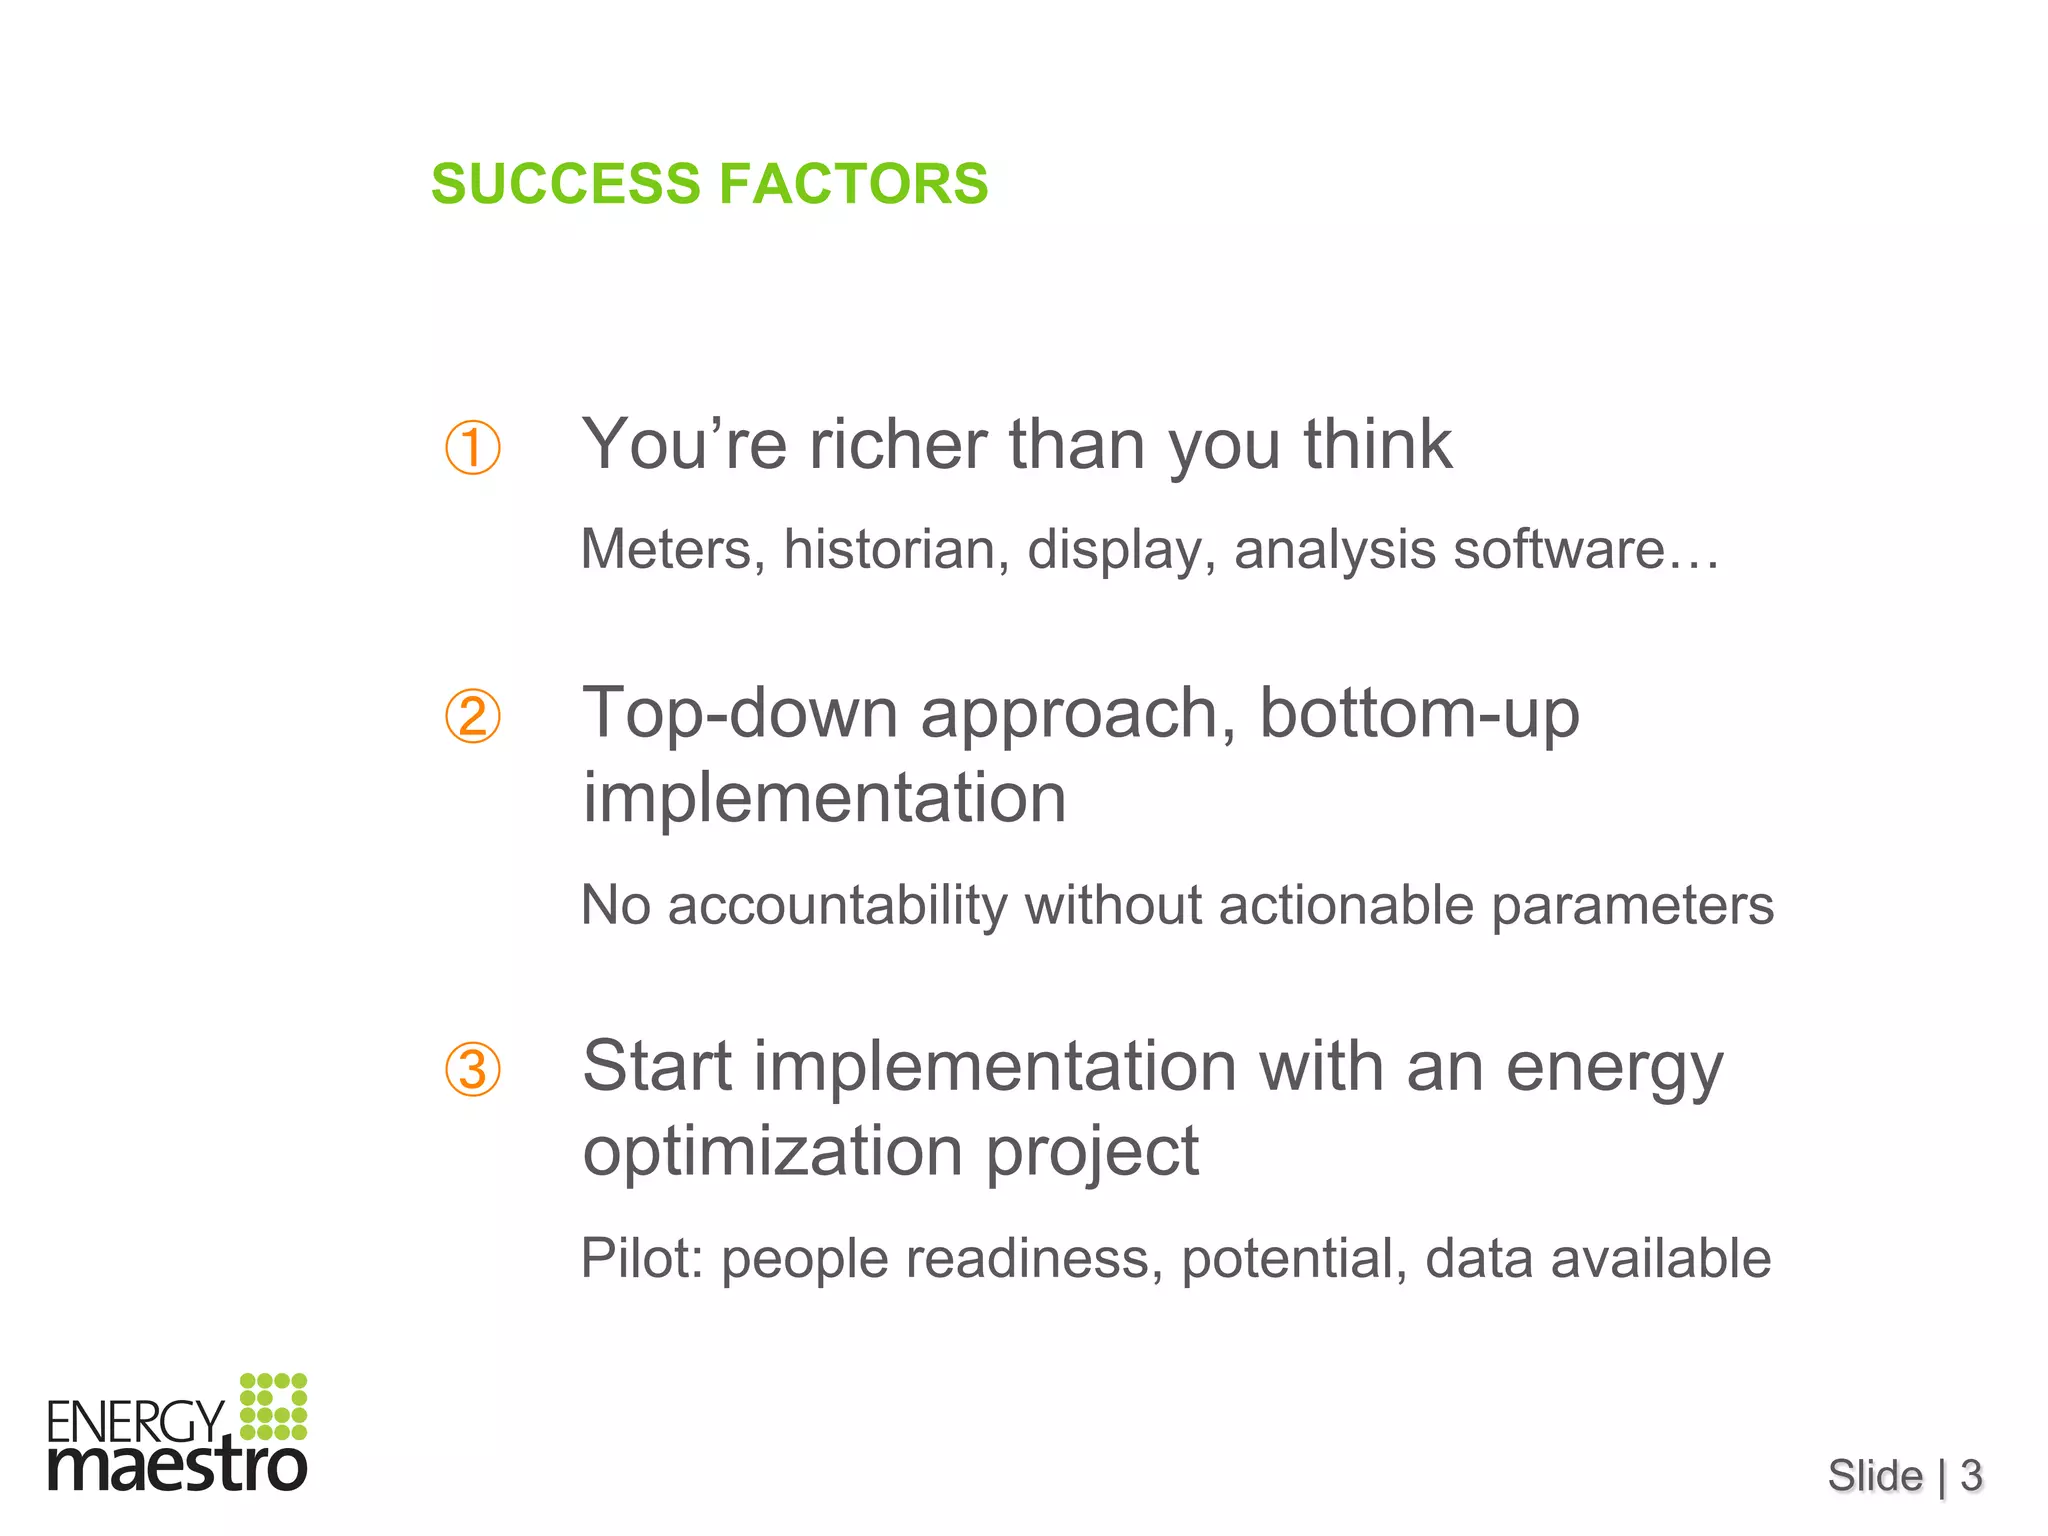
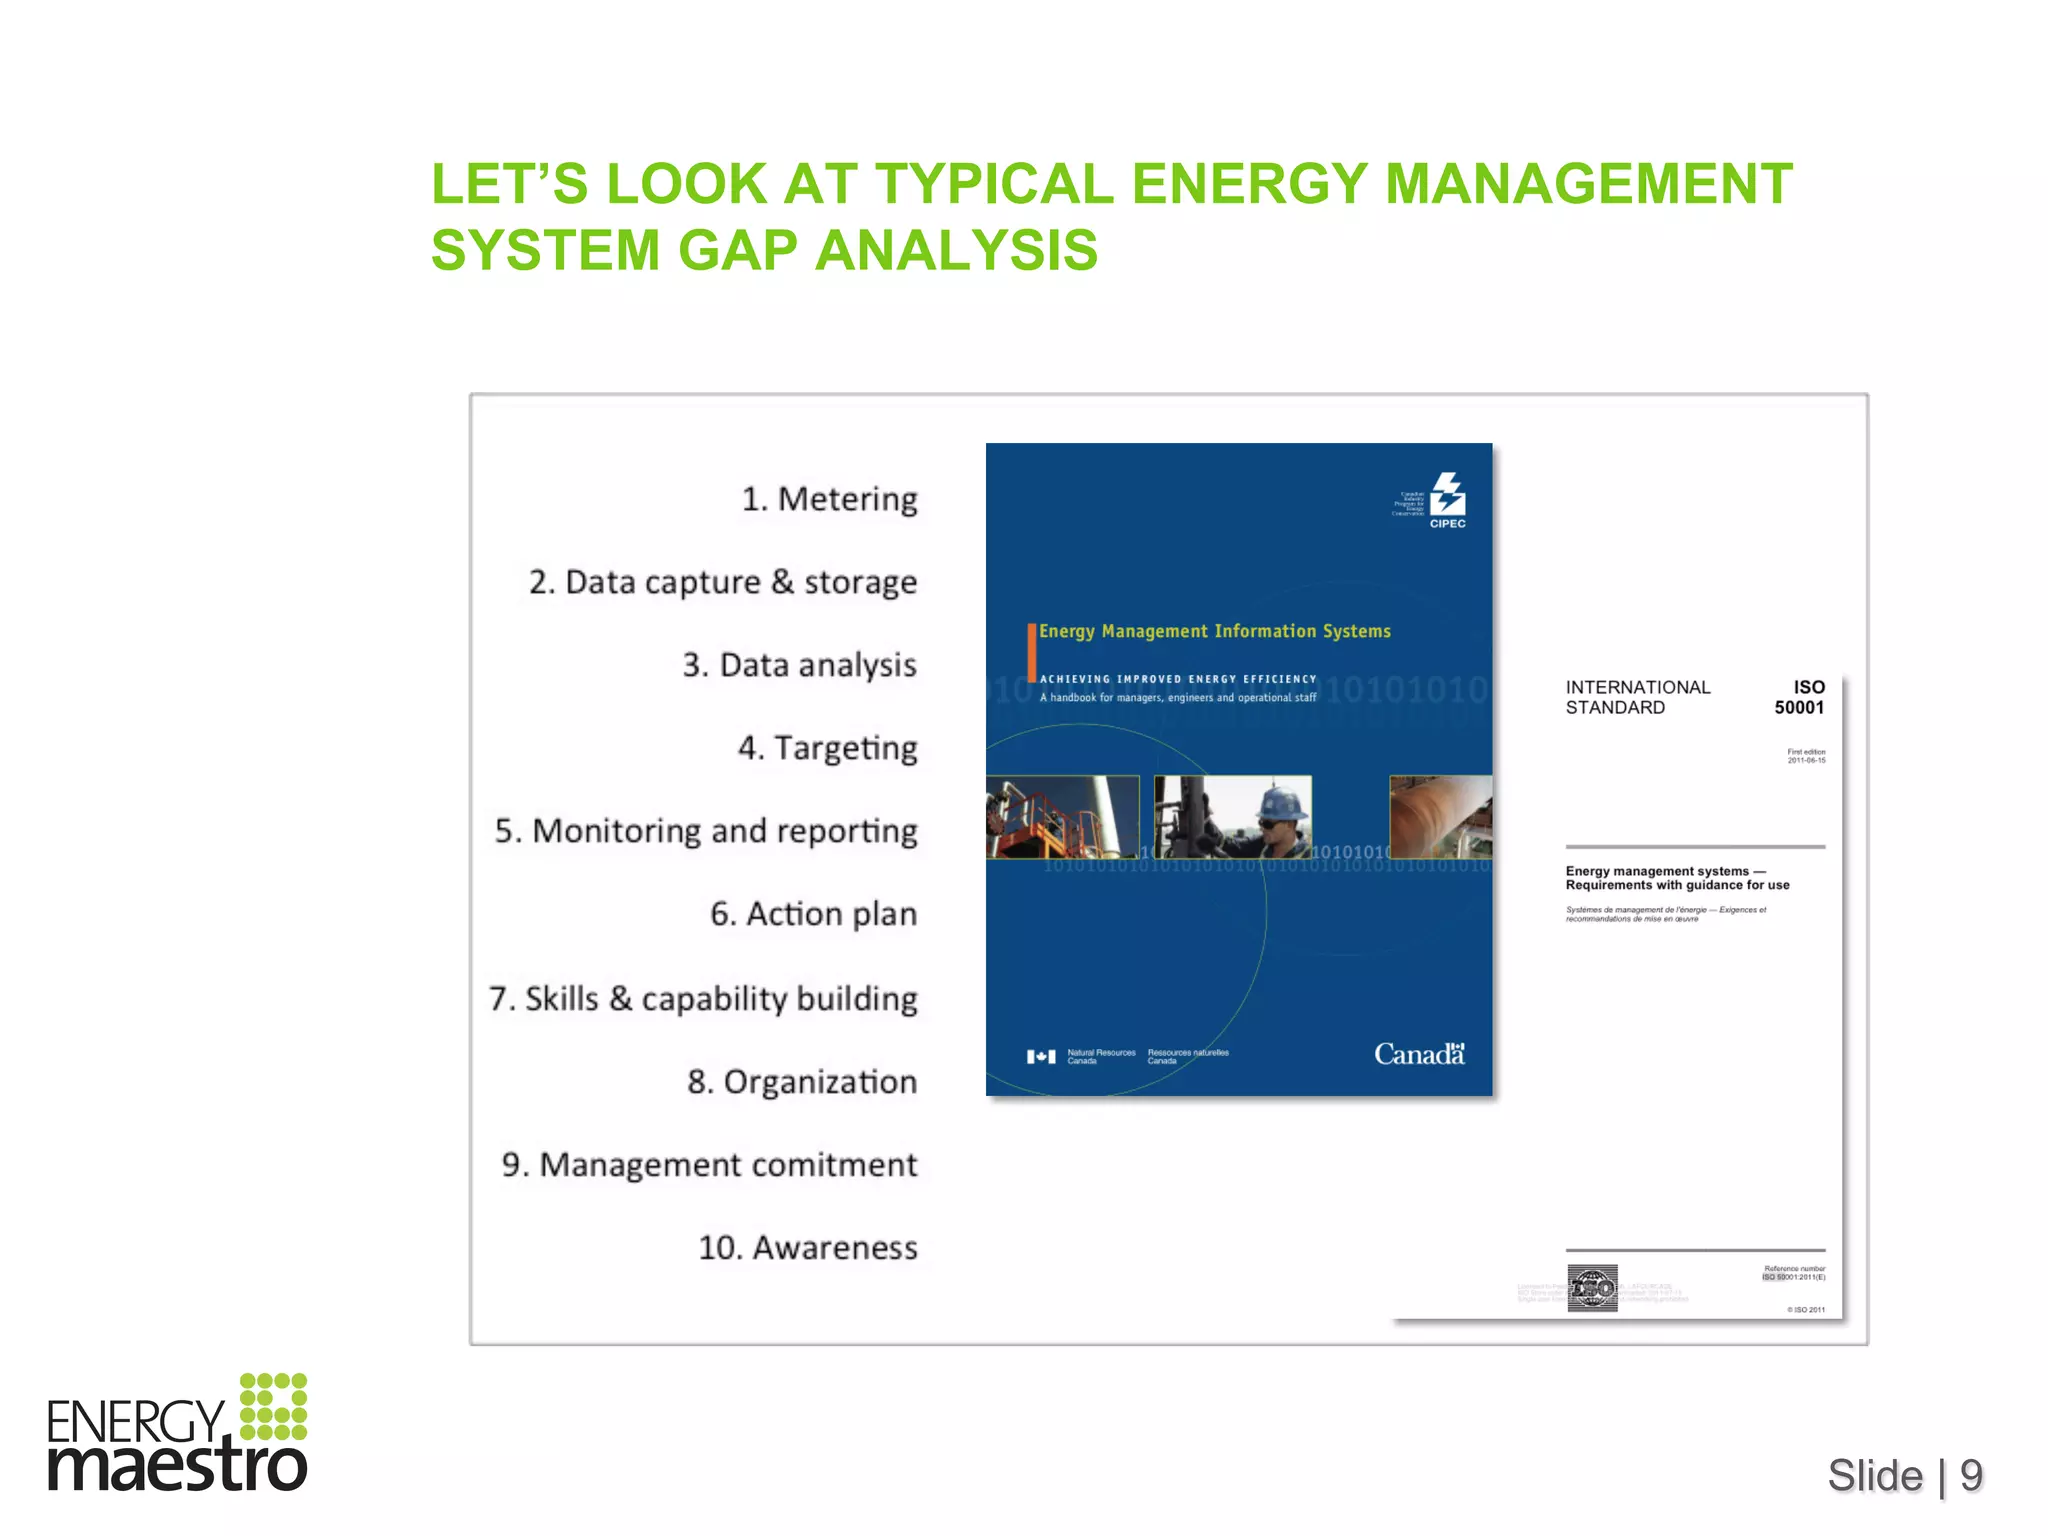
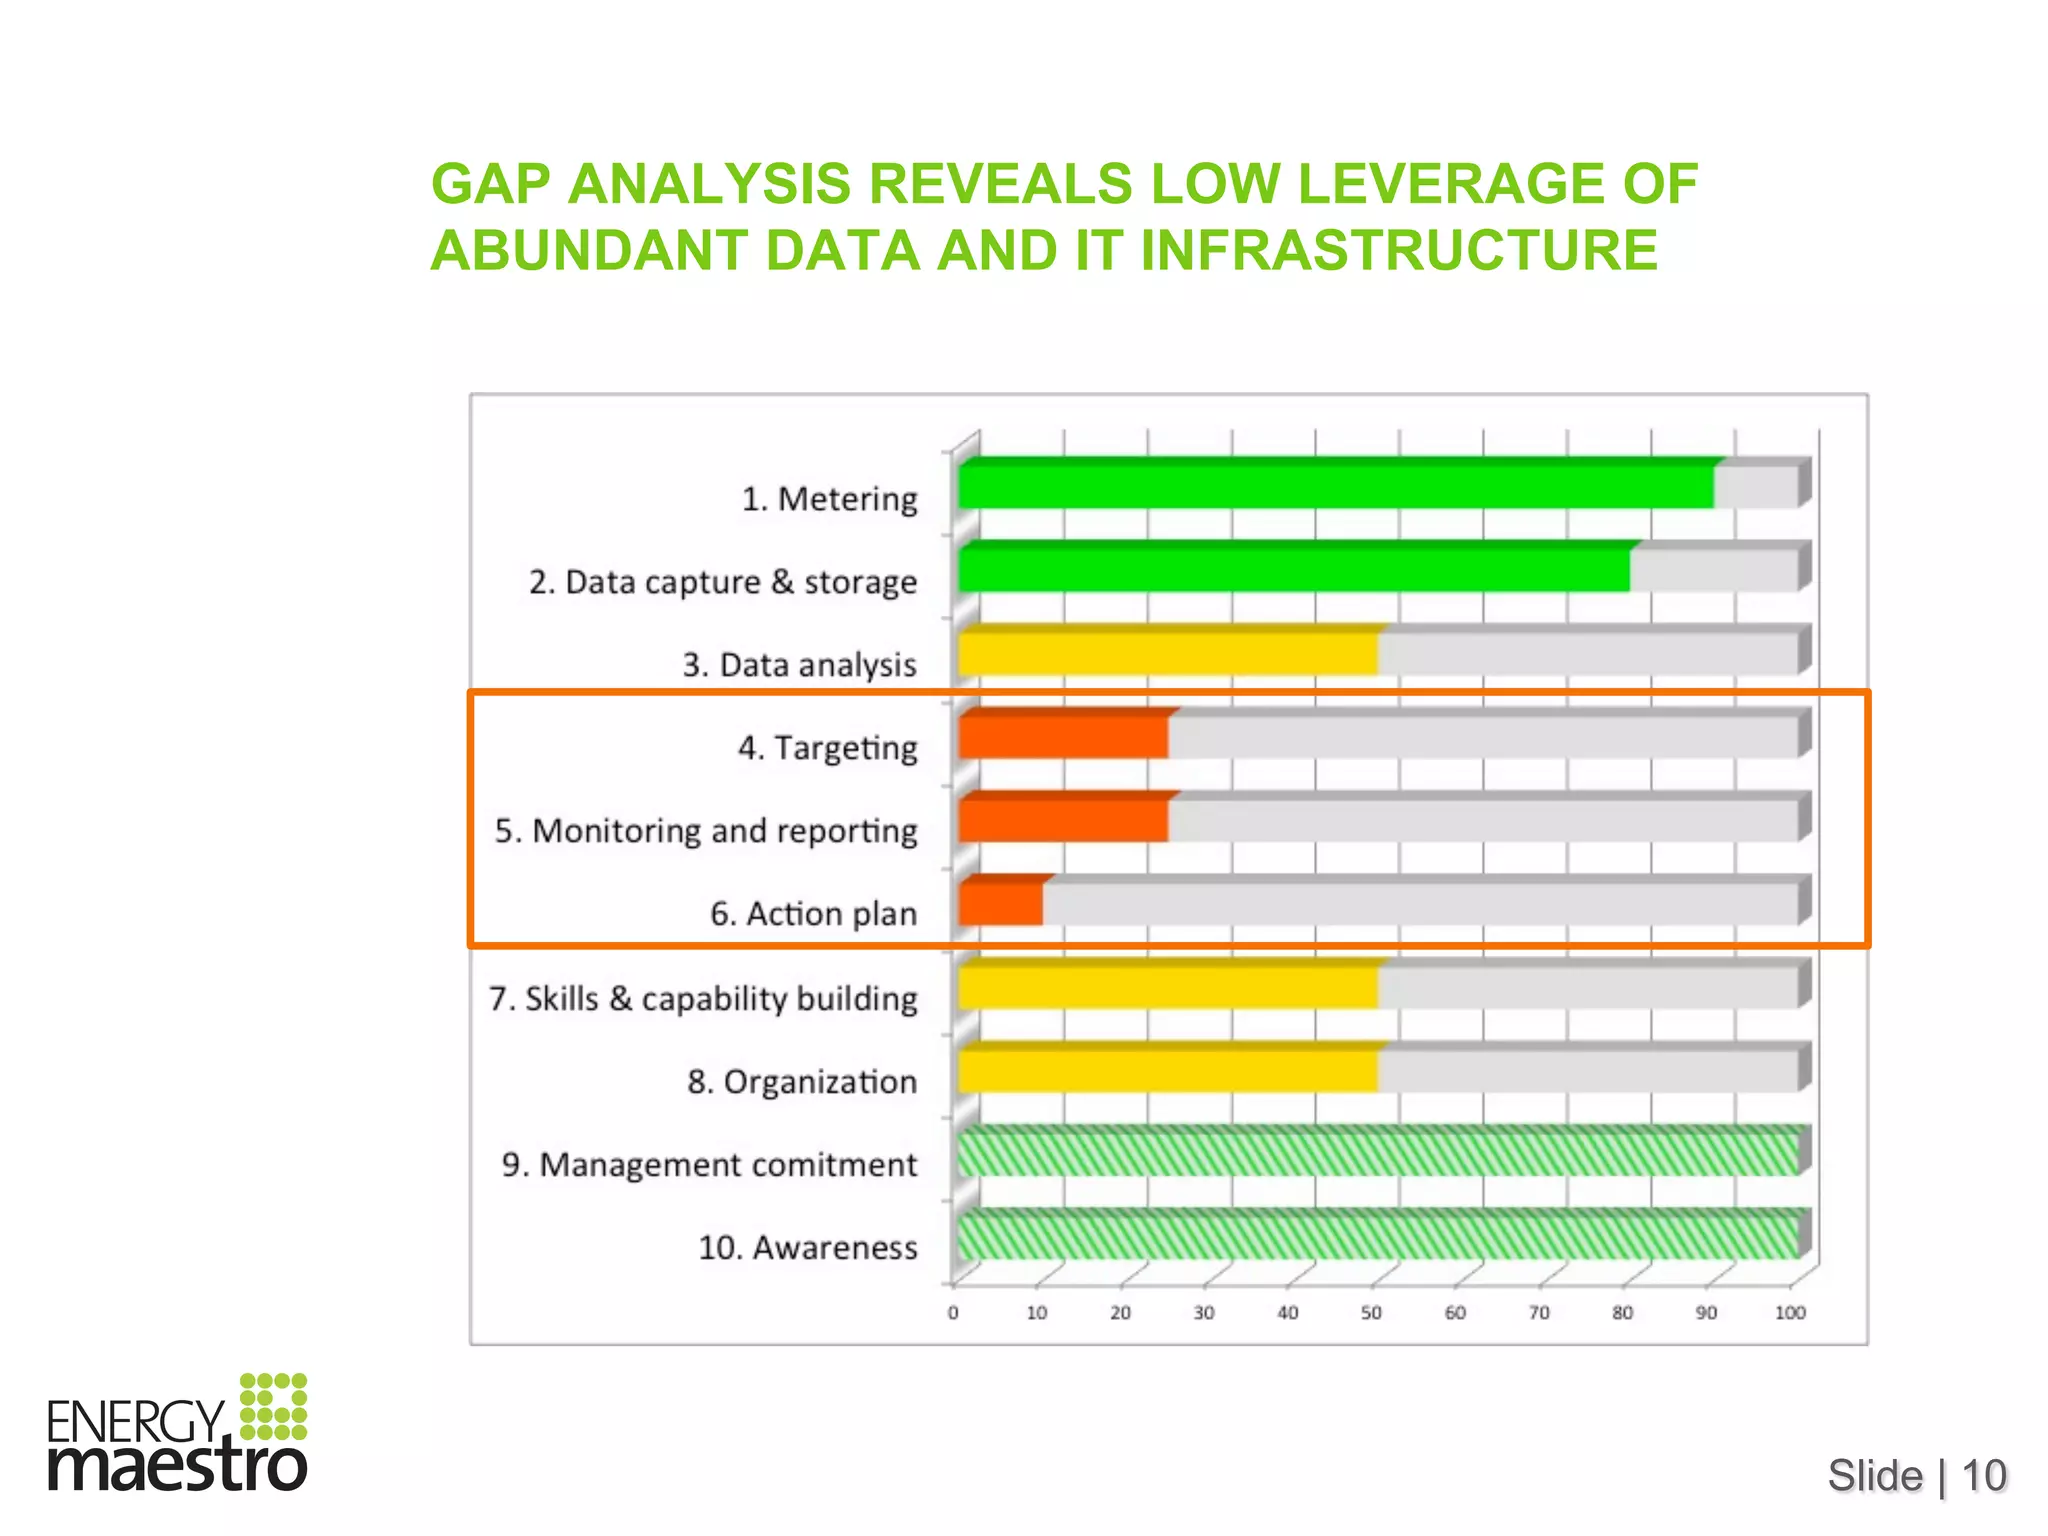
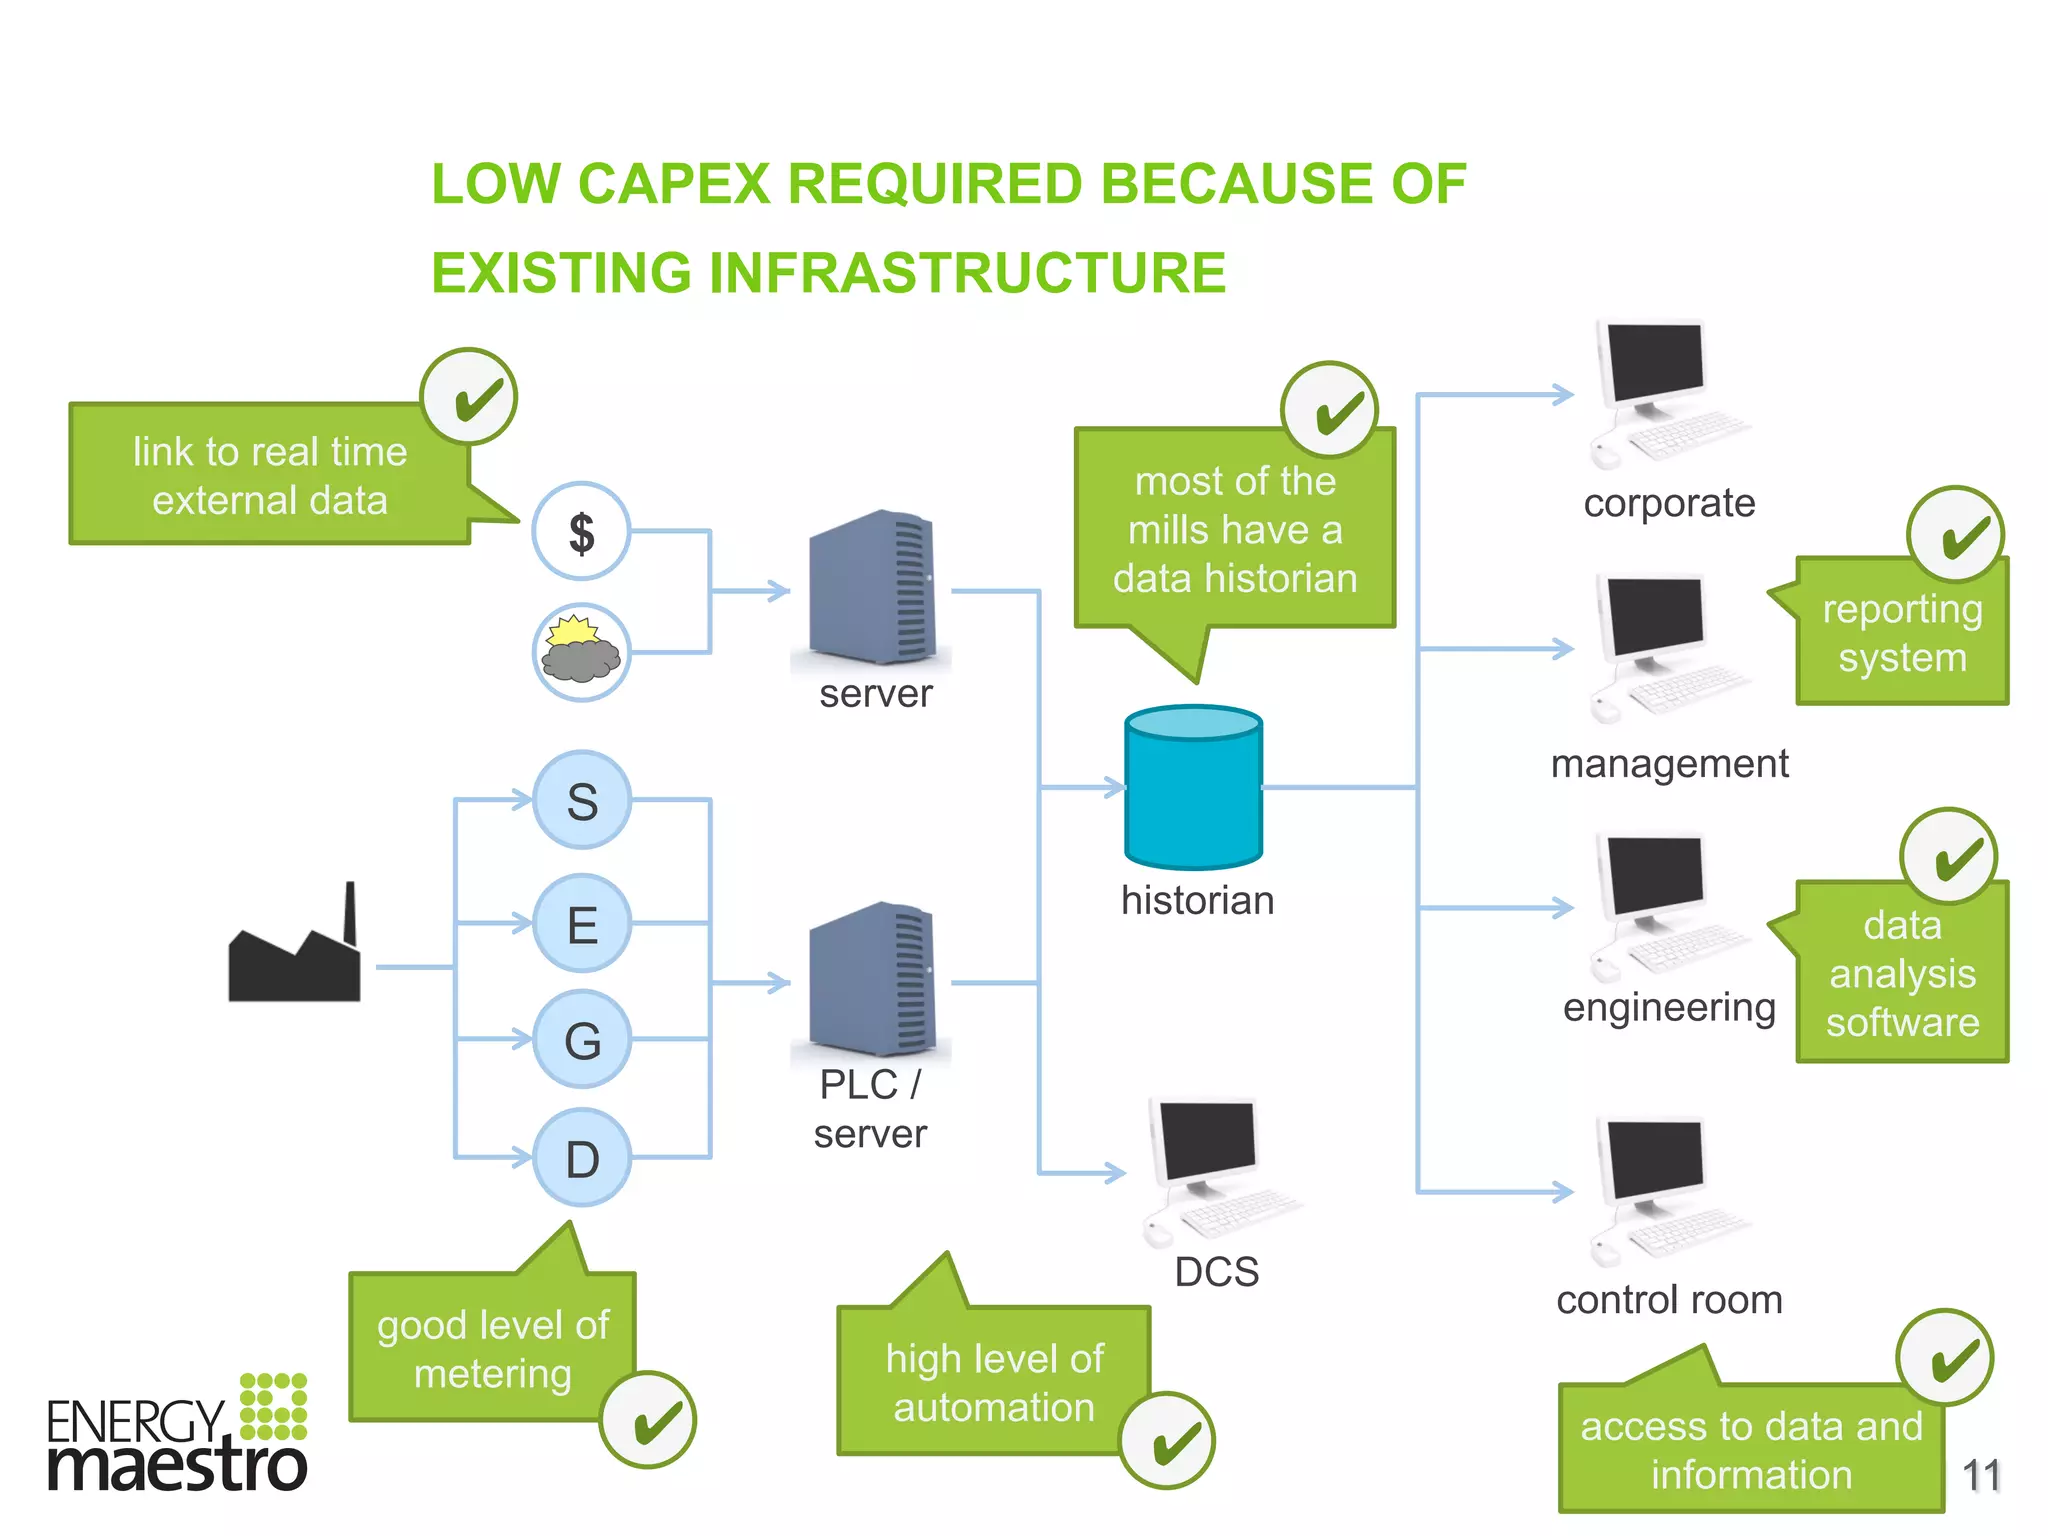
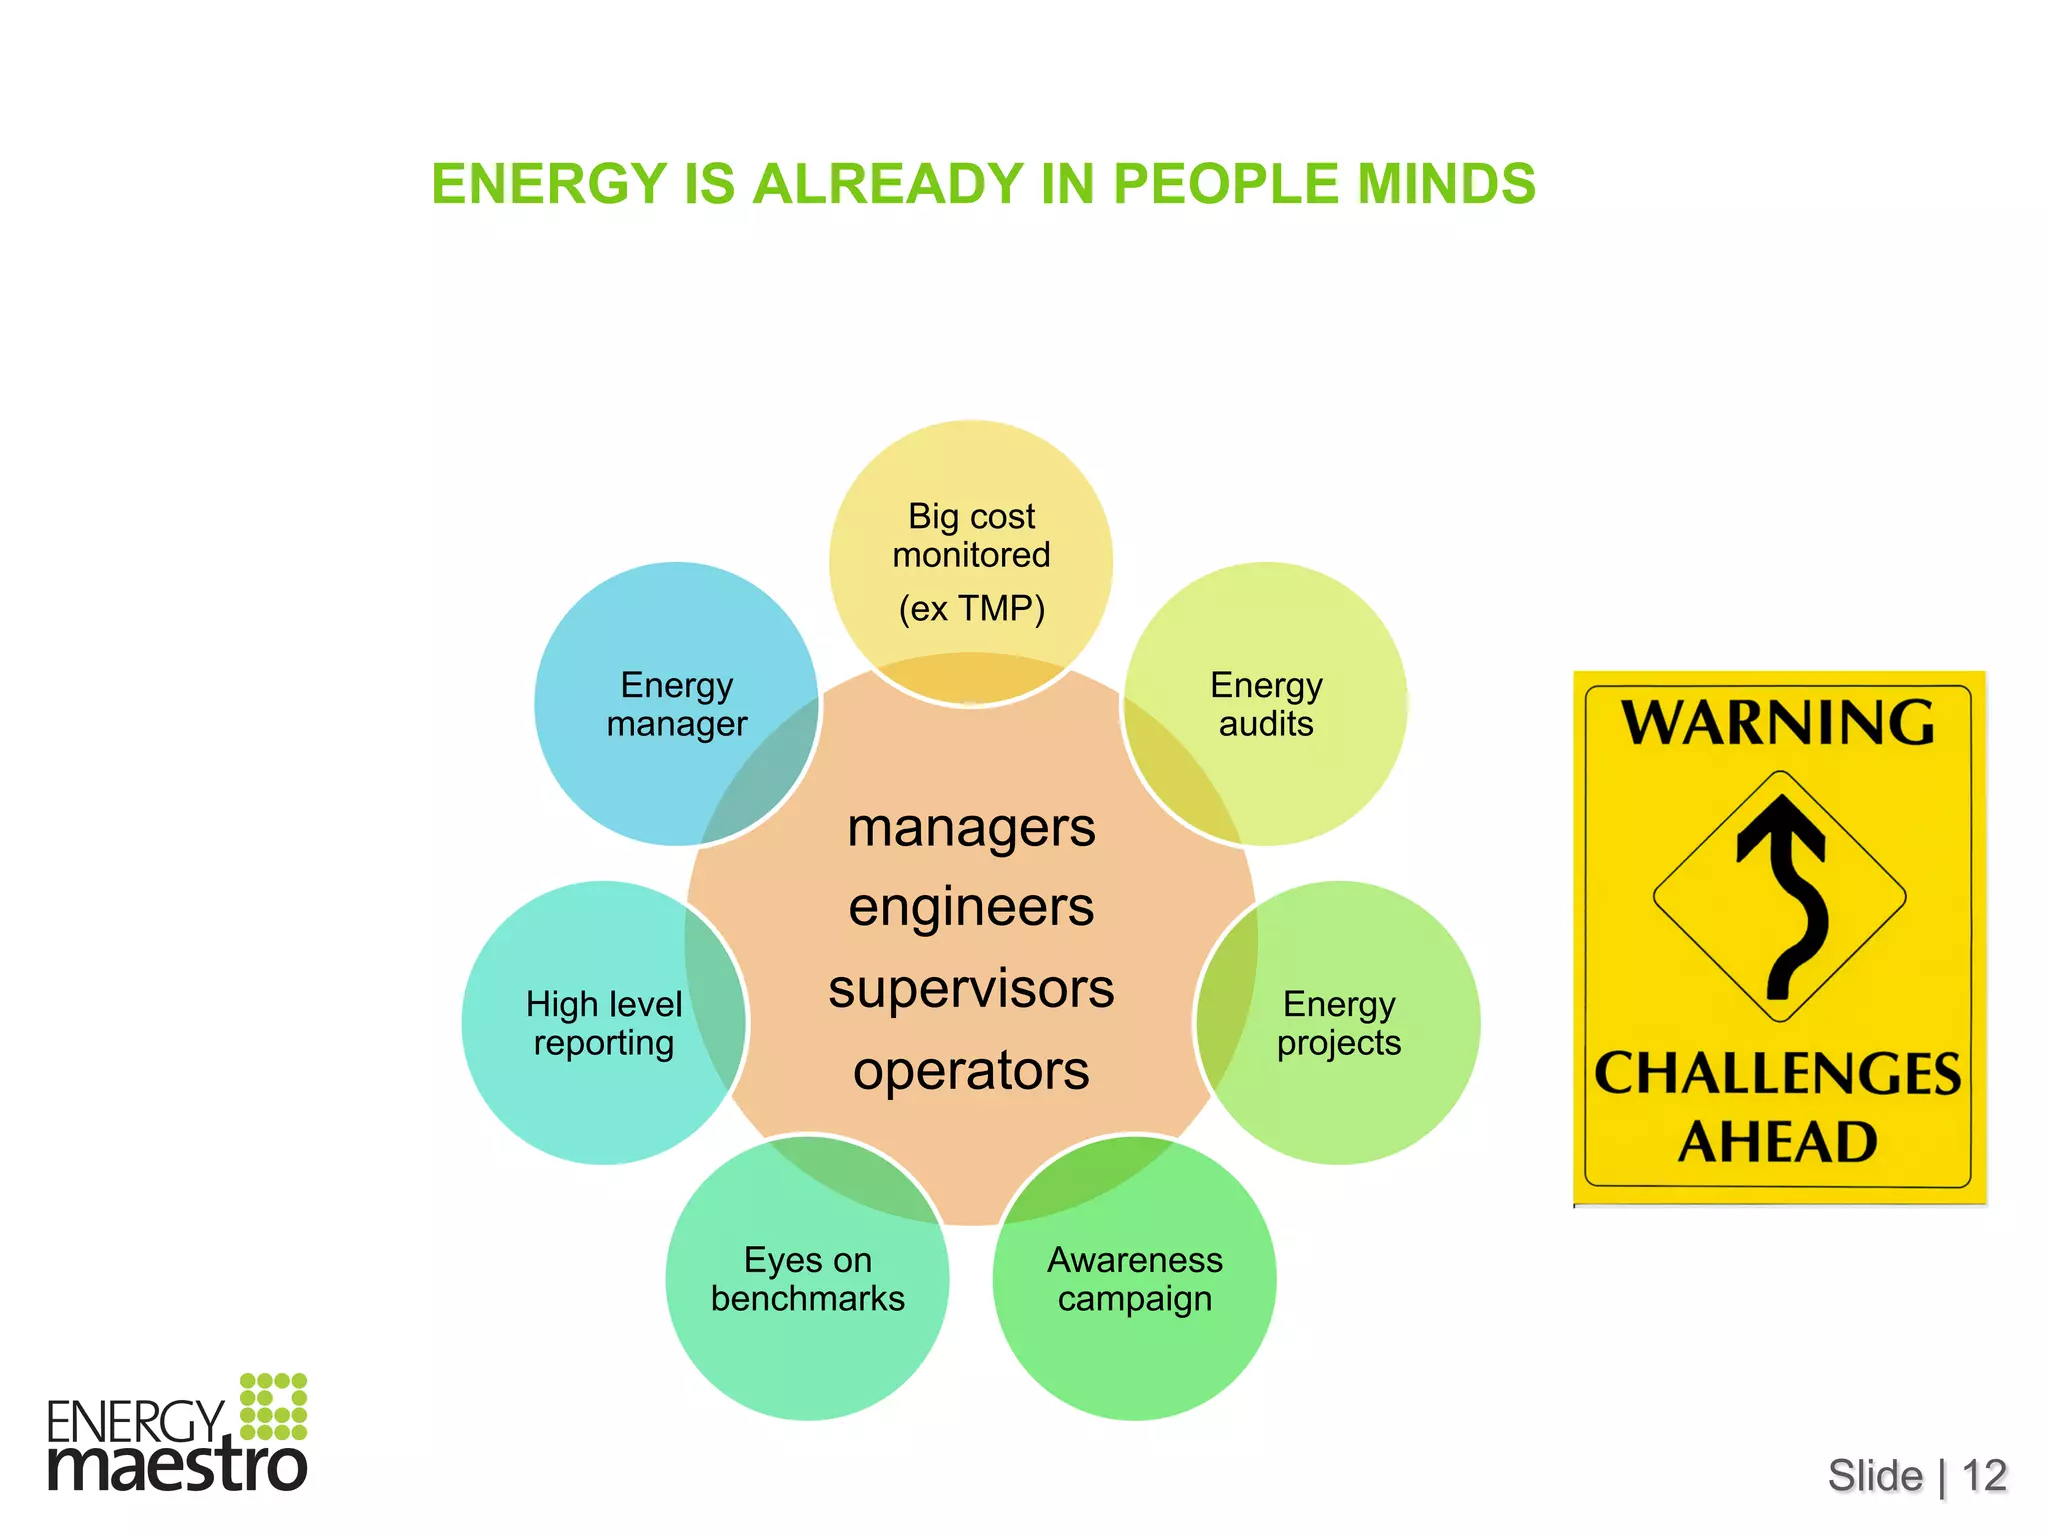
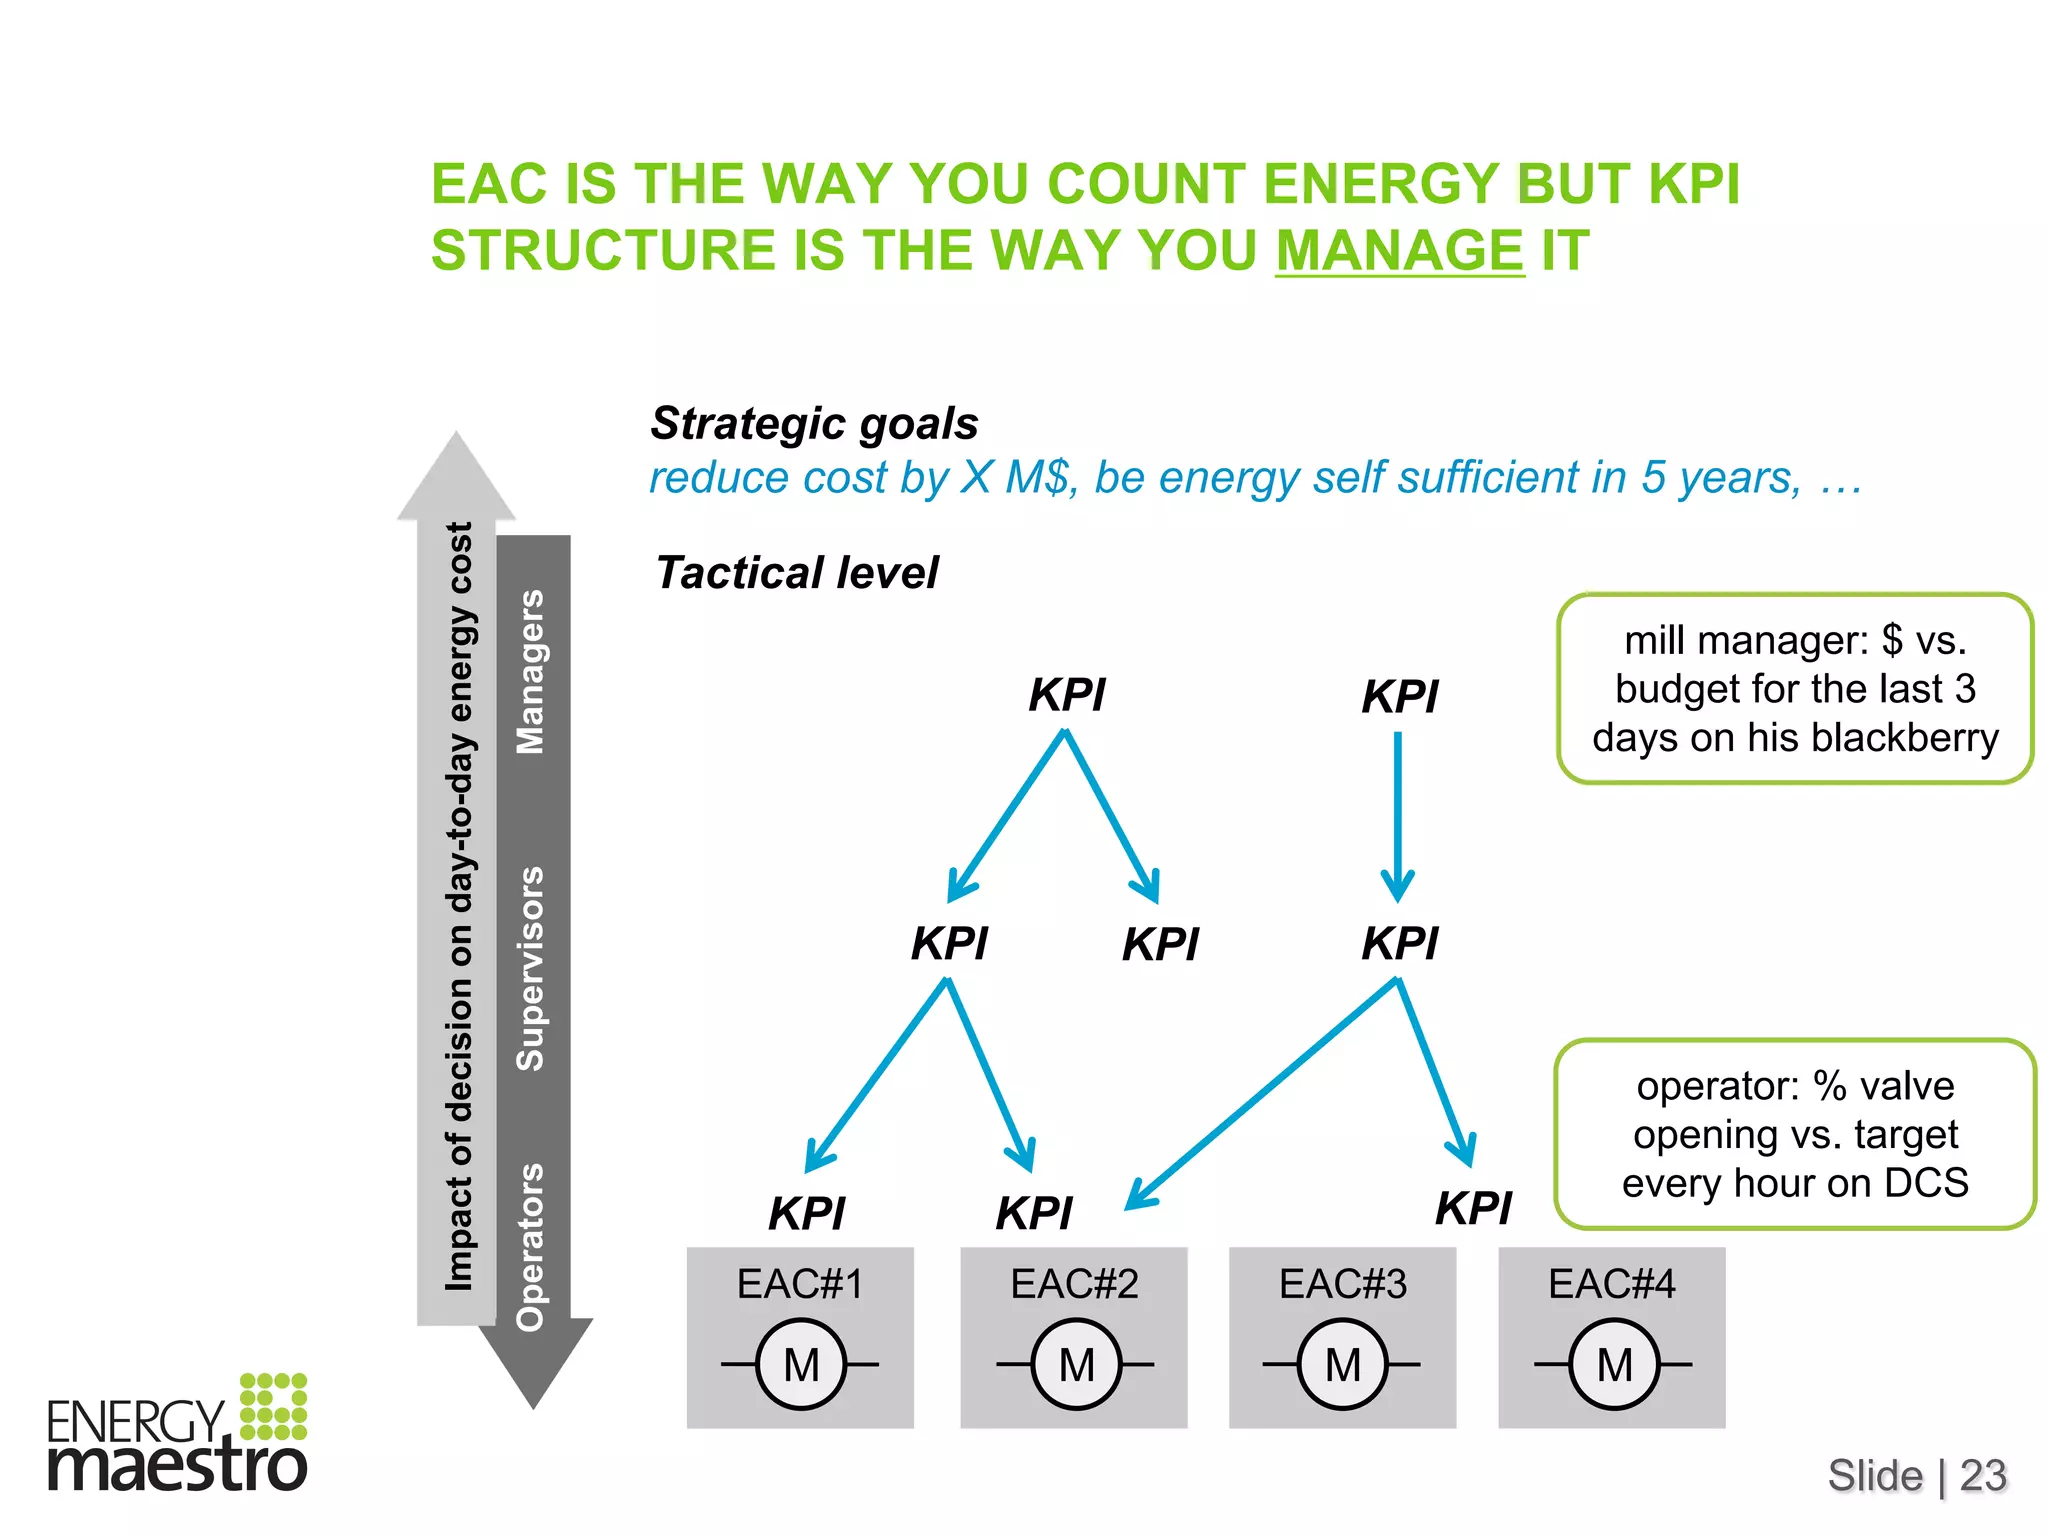
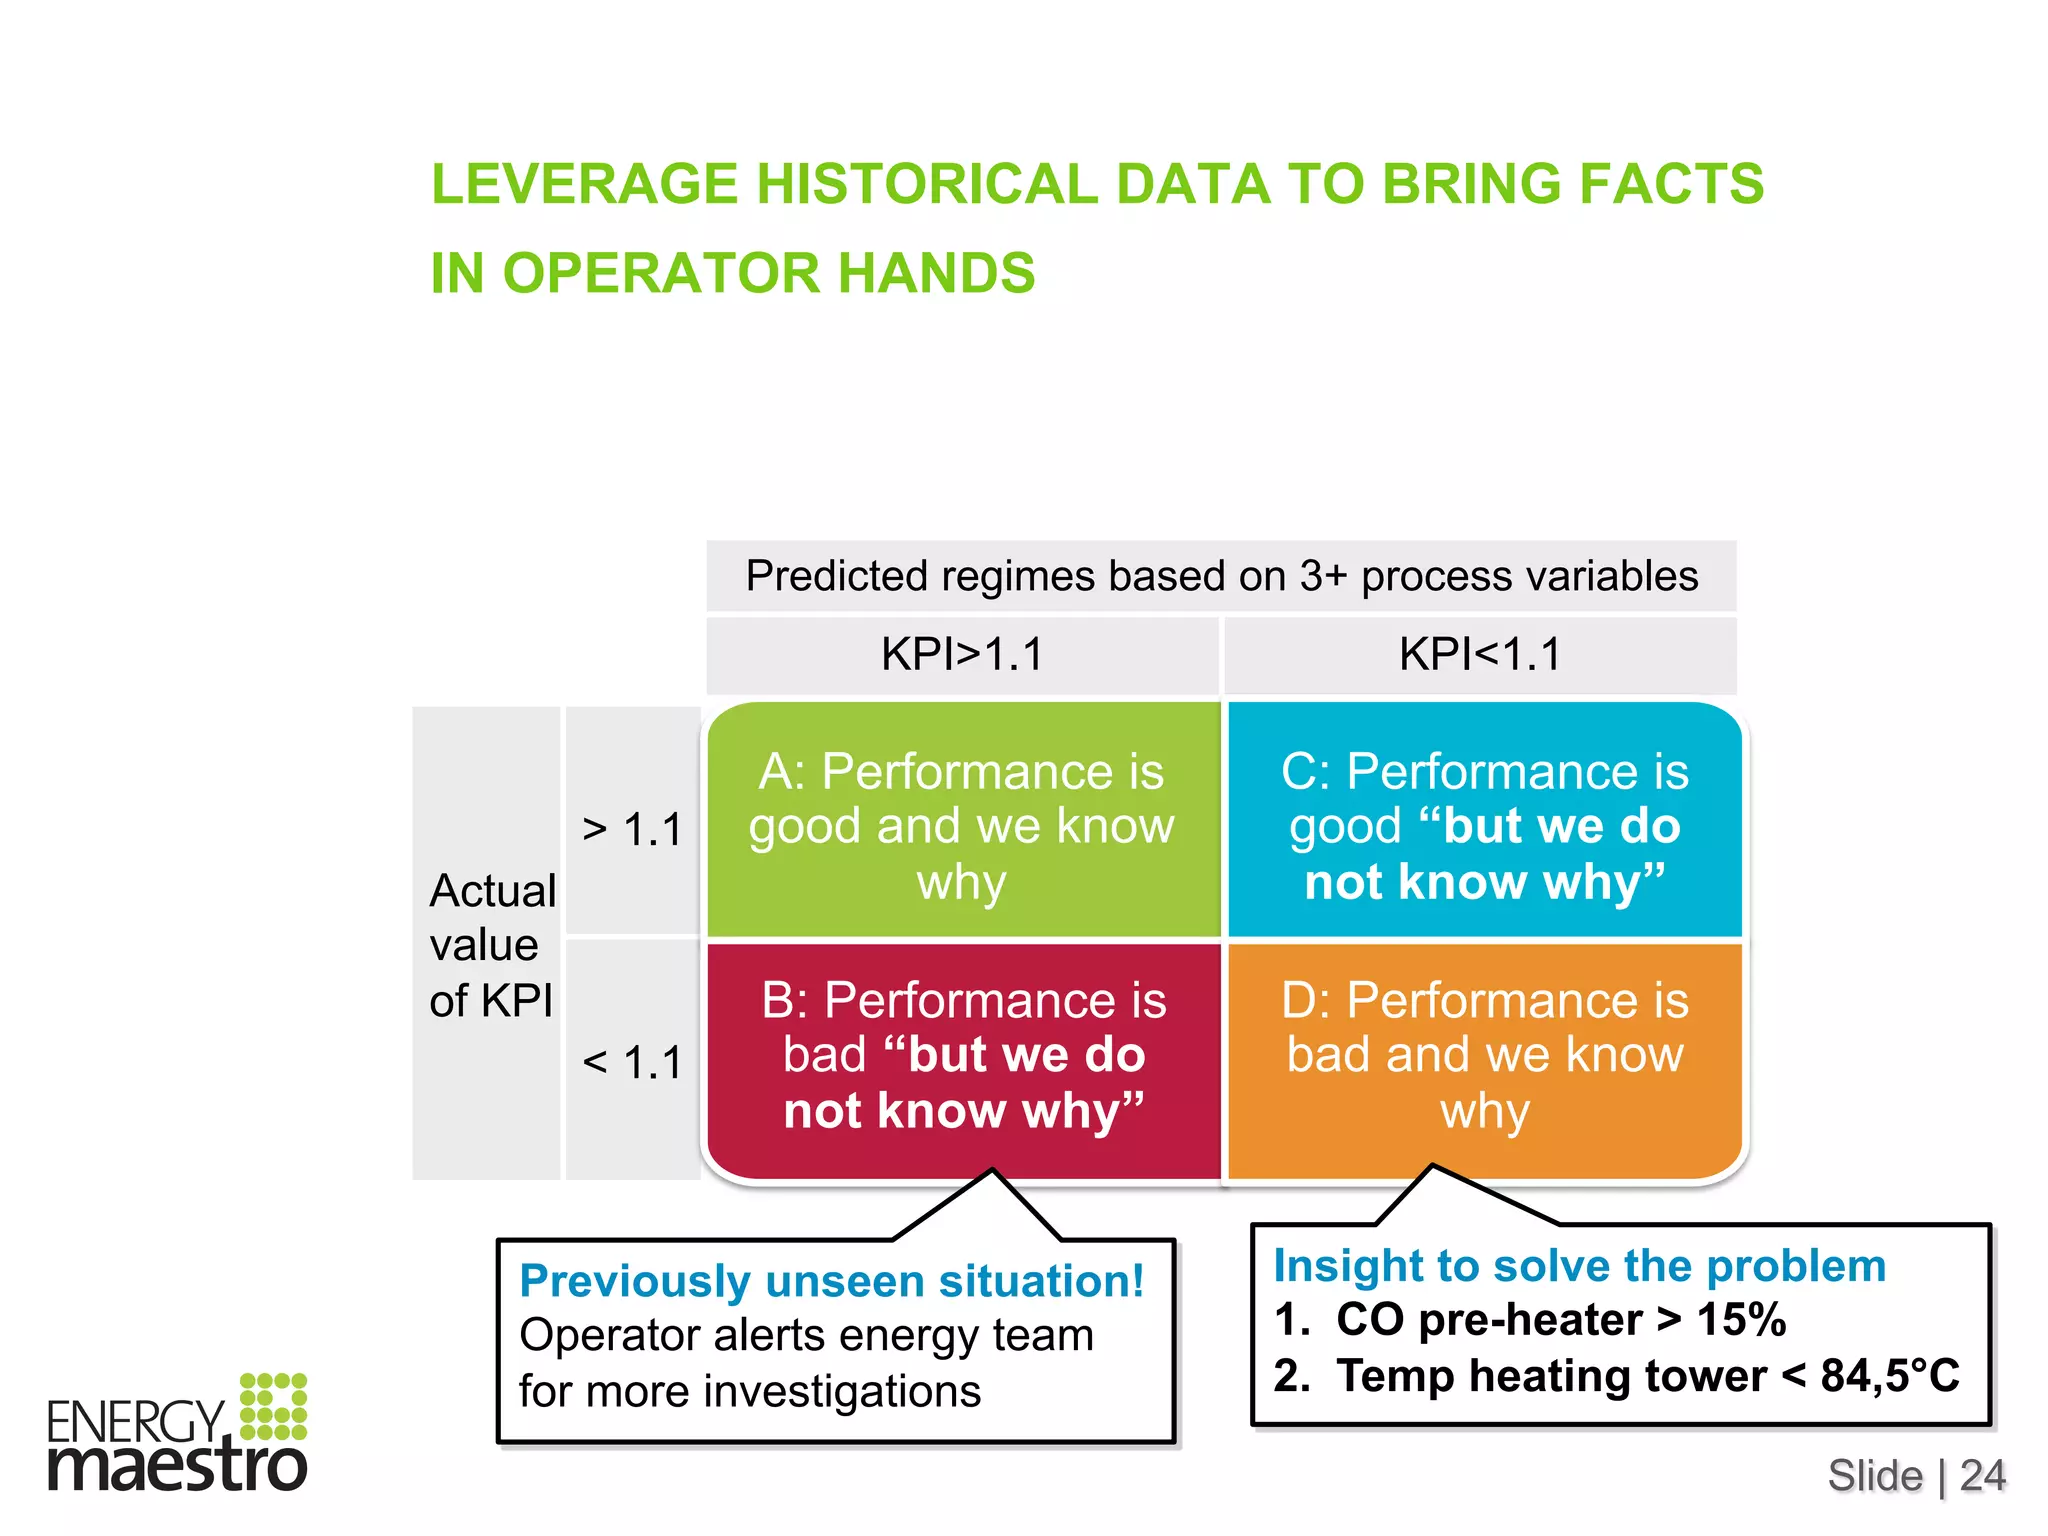
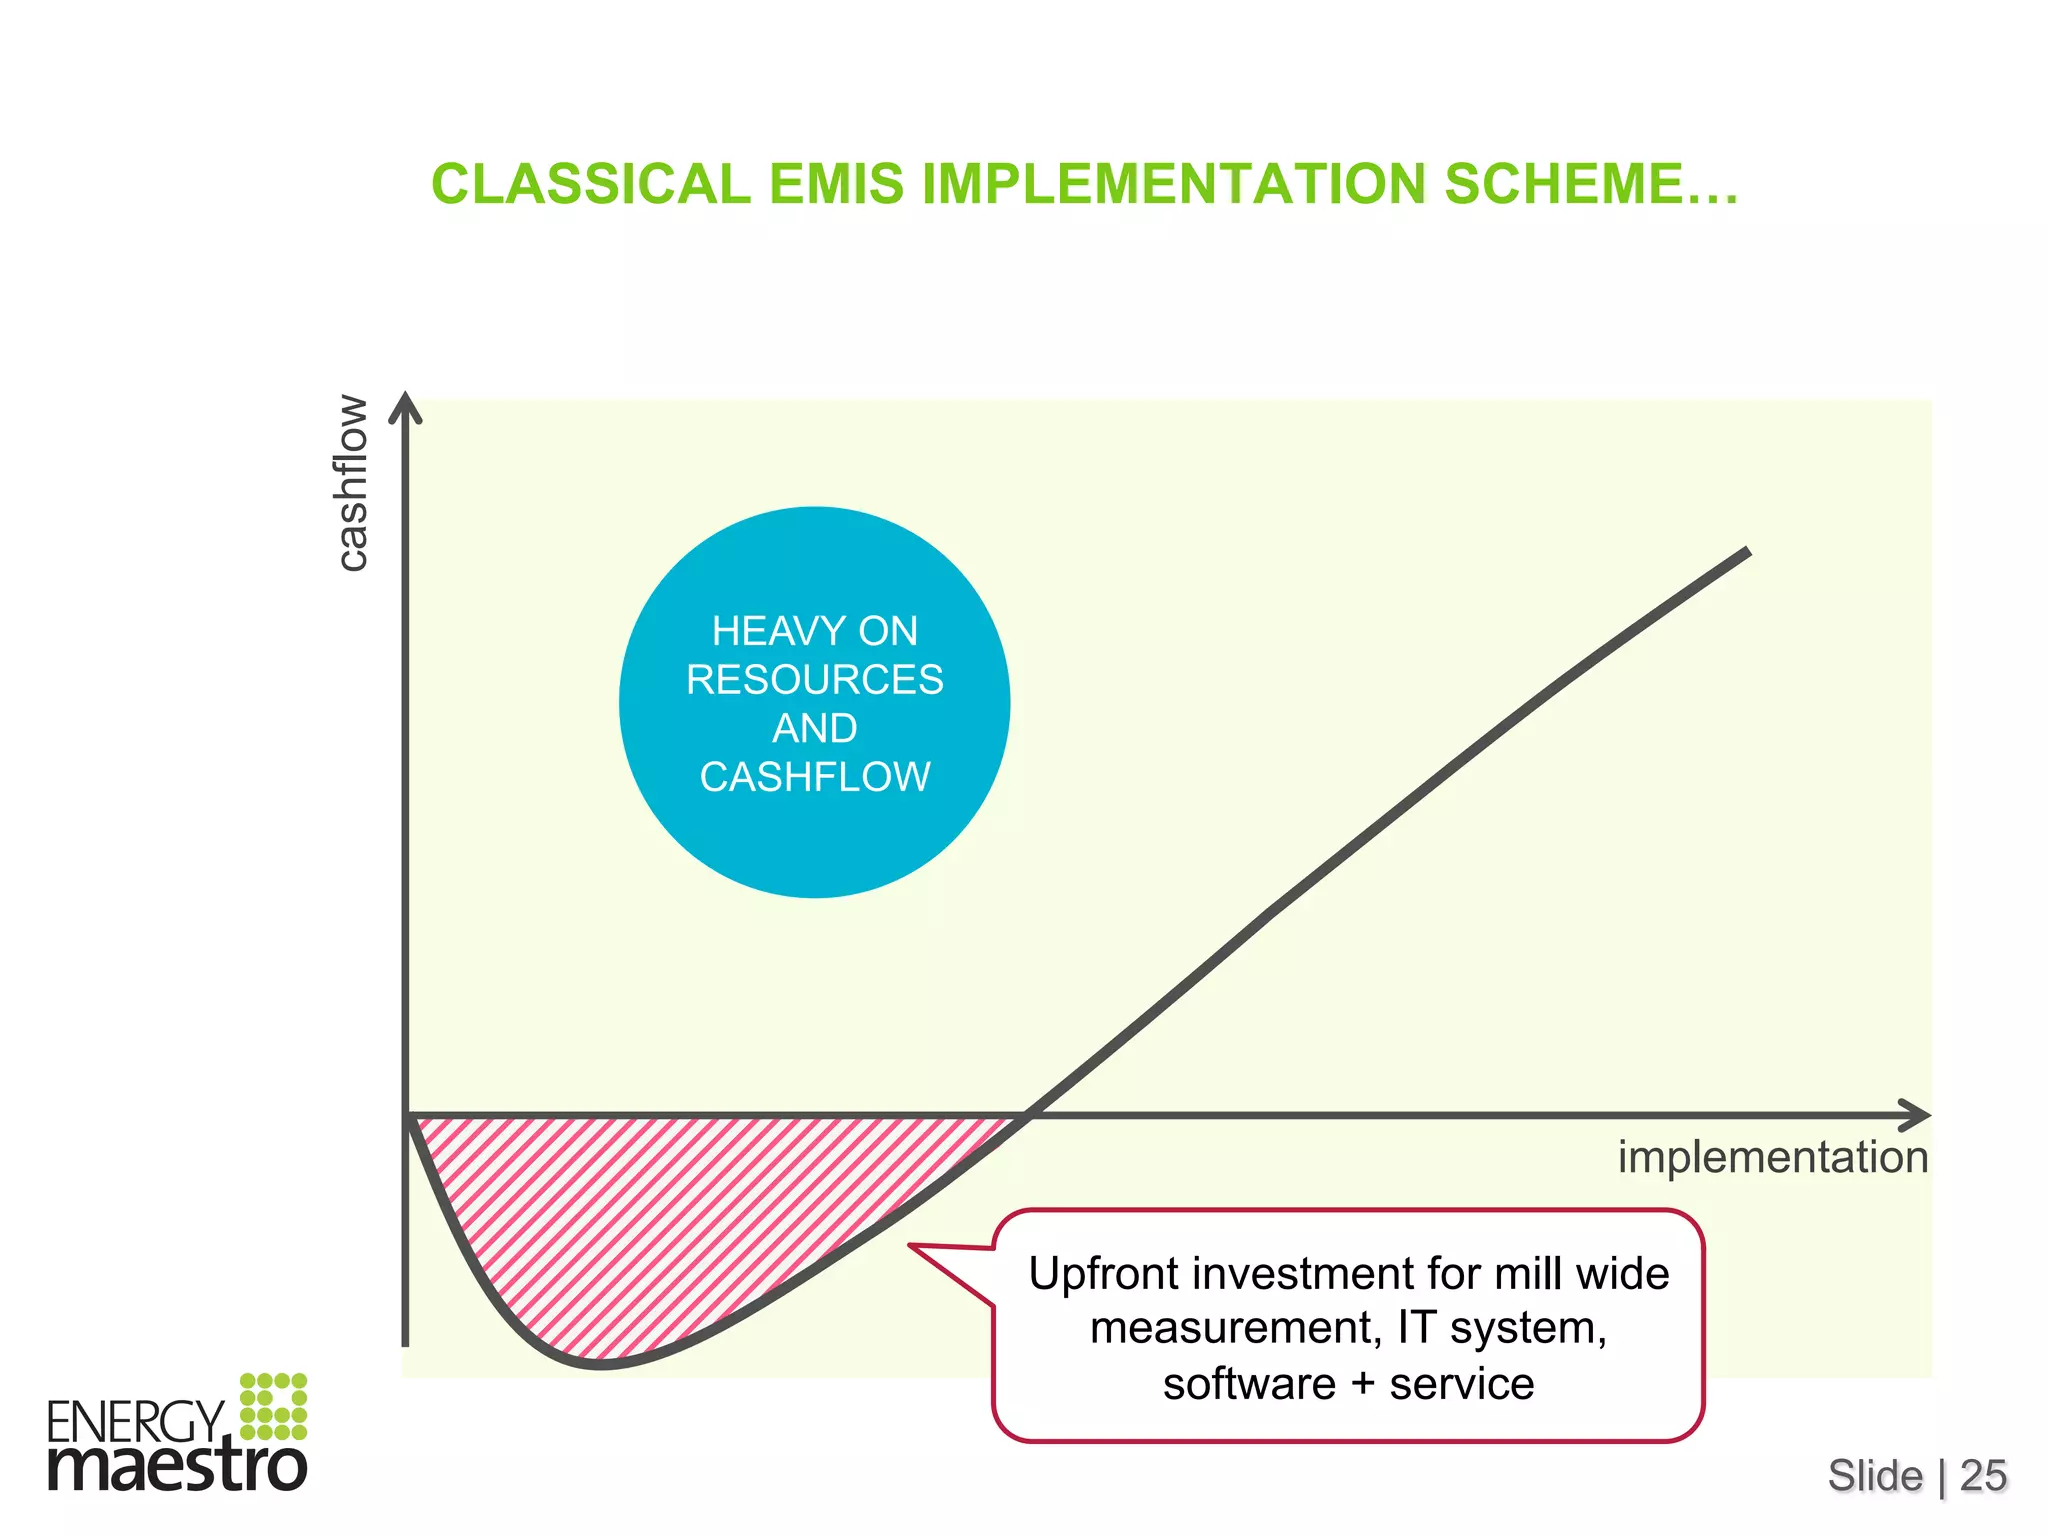
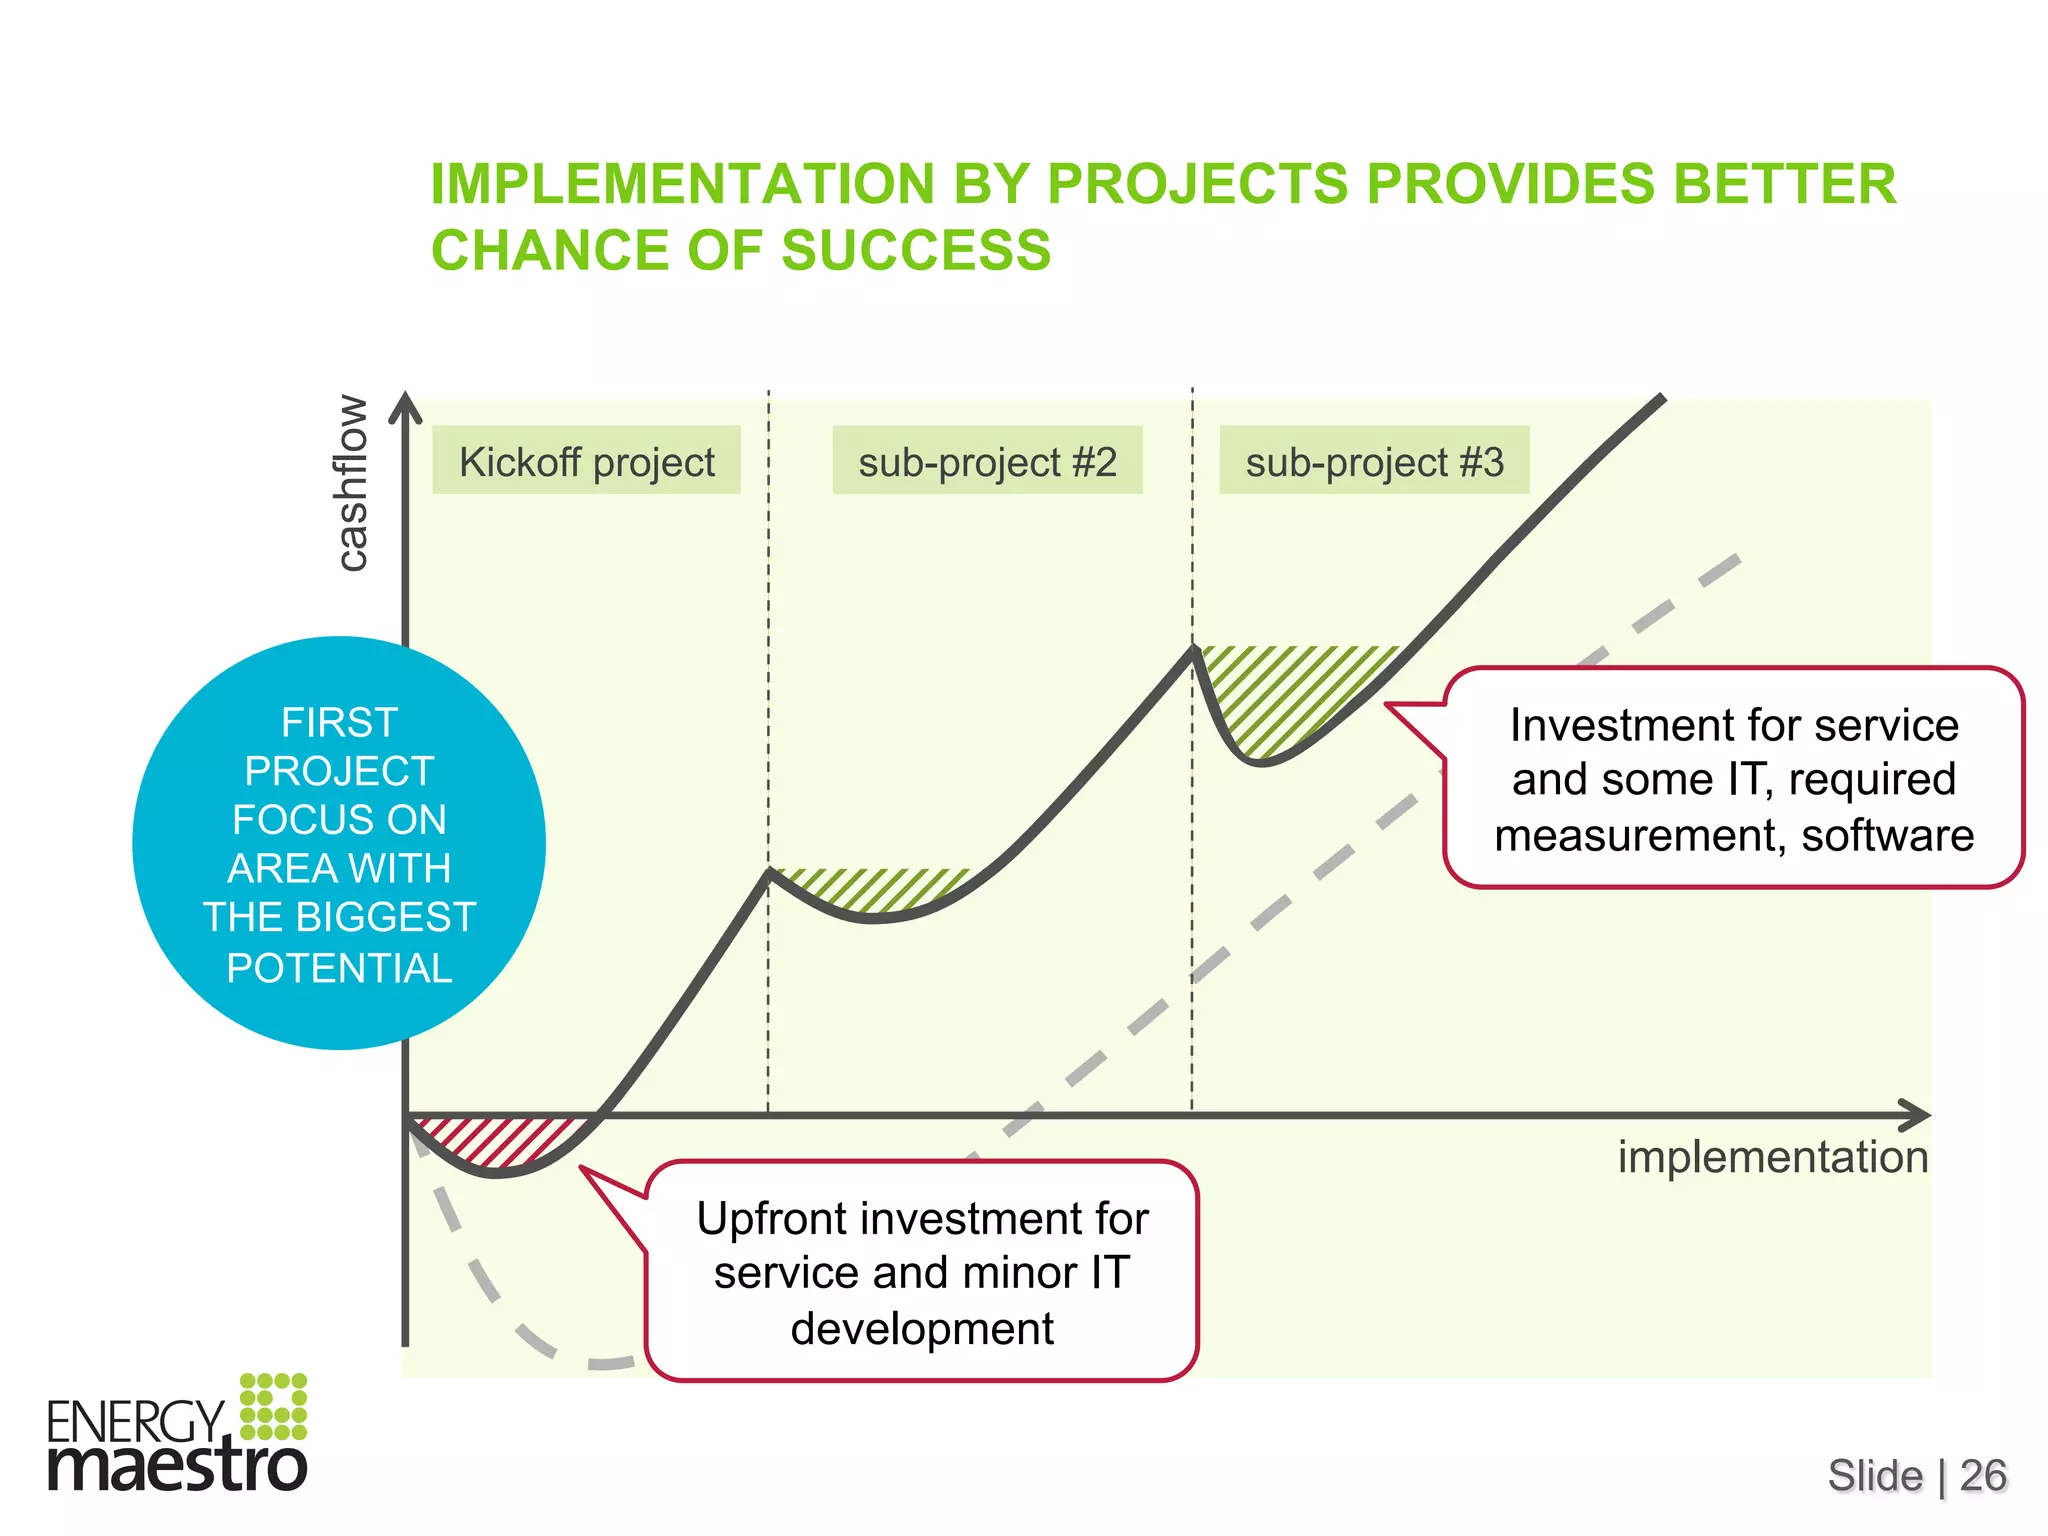
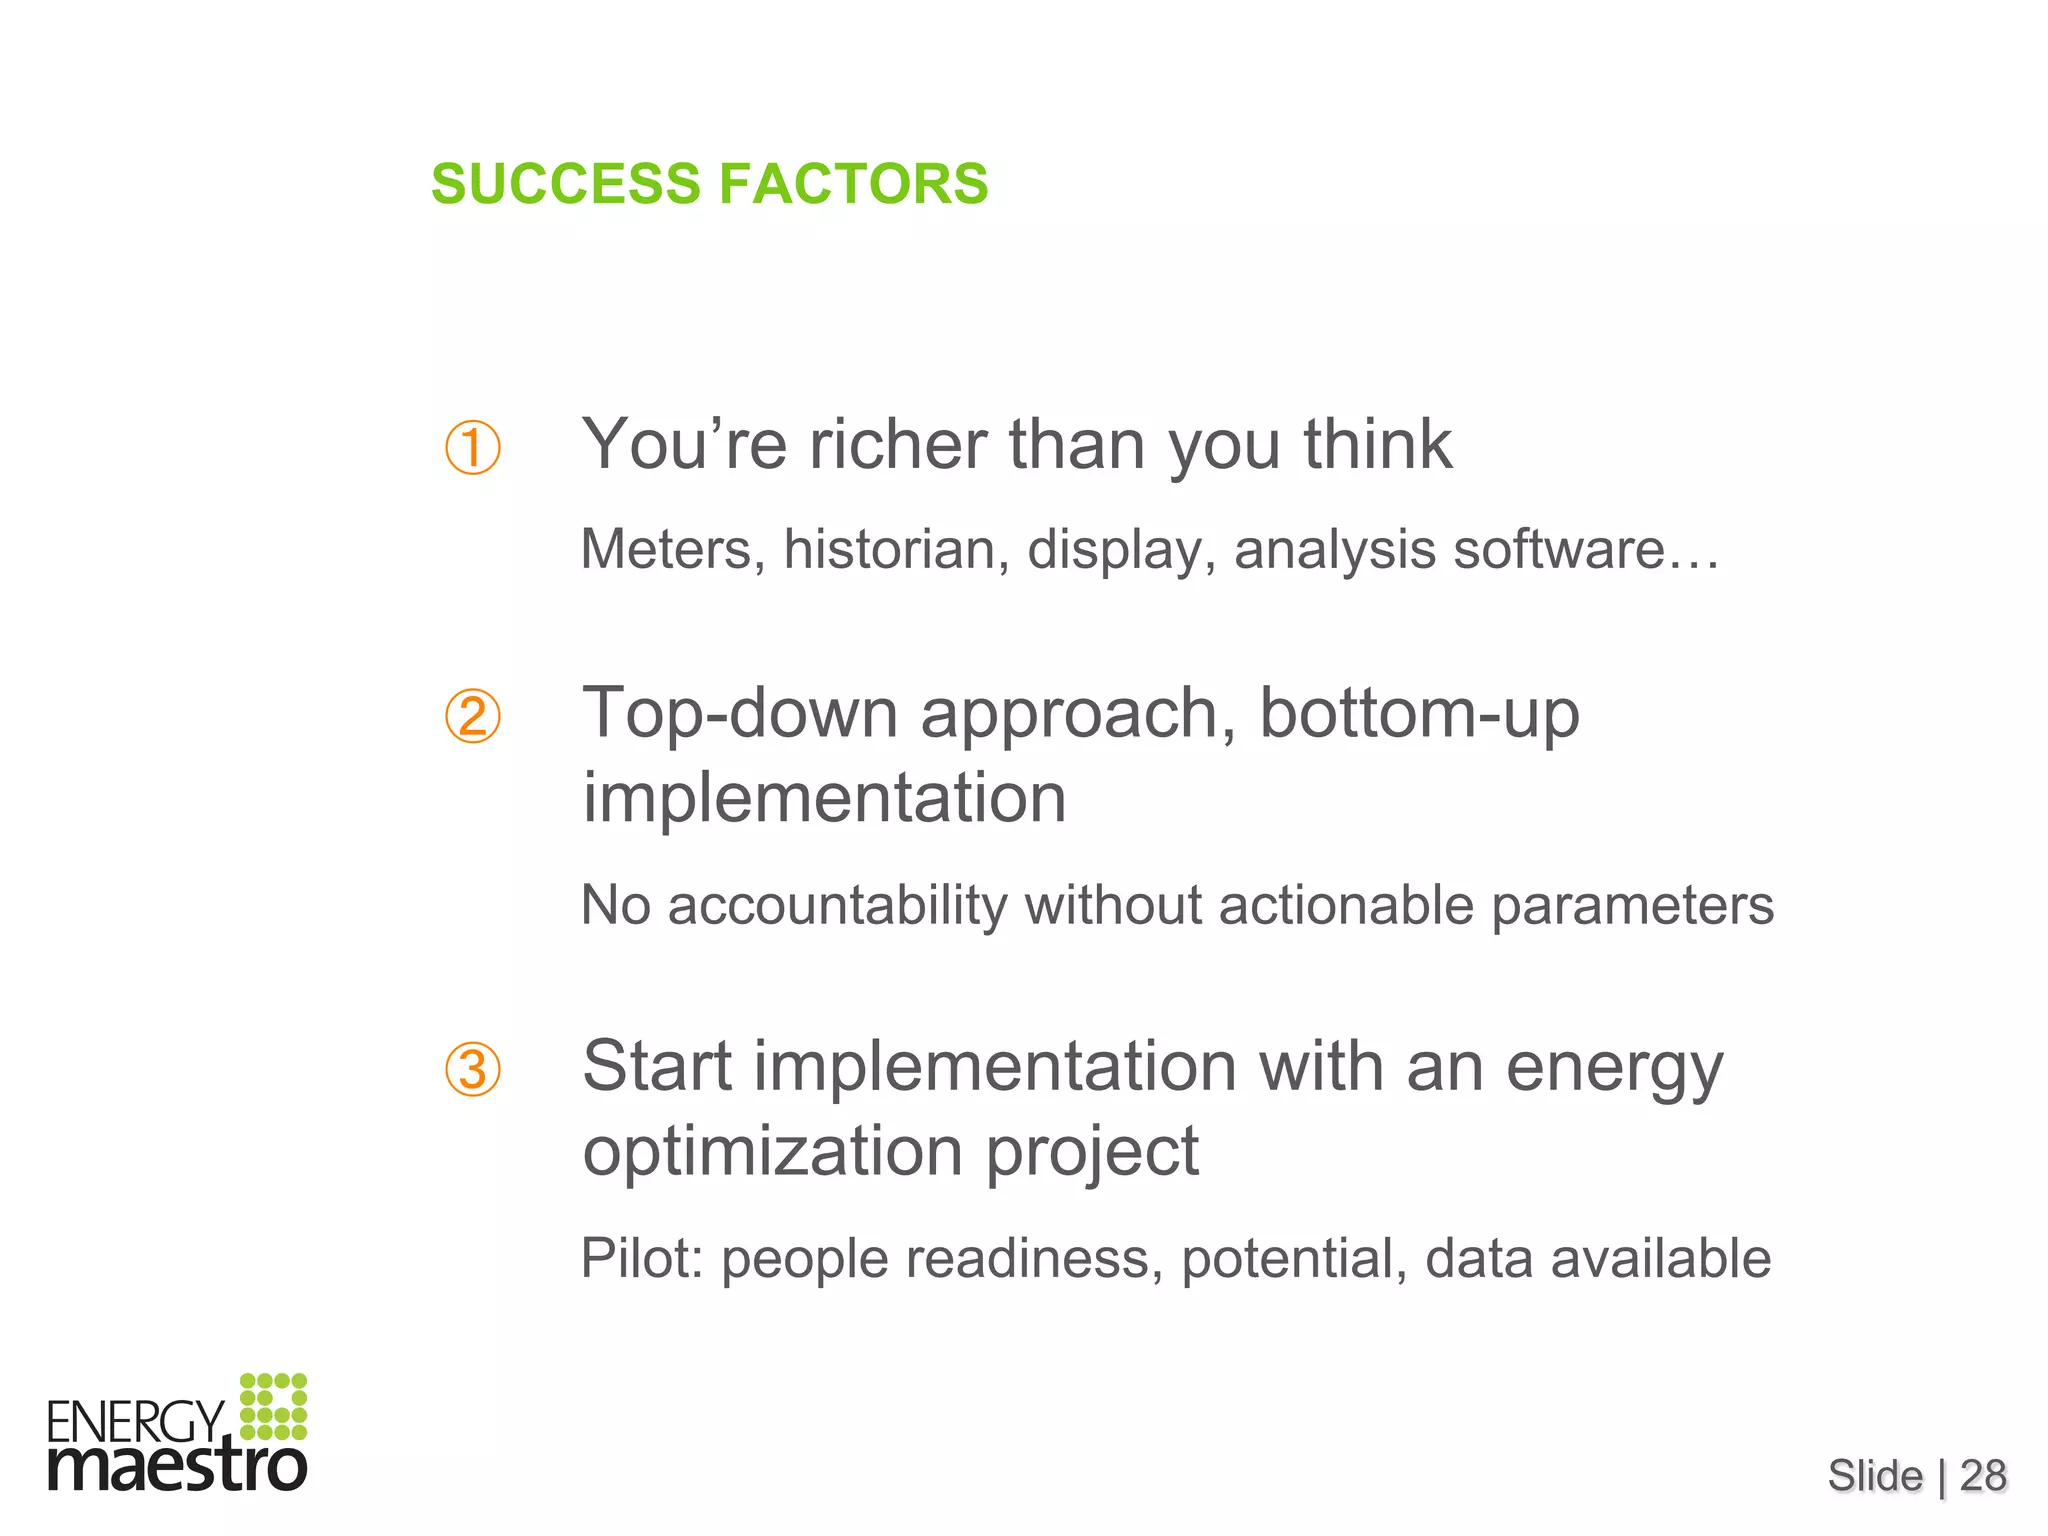
Energy management systems and ISO 50 001 are making the buzz these days. They promise huge benefits and significant savings. So why is there so few real implementation in industry, particularly in heavy industry. Experiences in pulp and paper industry give some answers and suggest some solutions...
2. Slide | 2
“WALK THE TALK”…
… LET’S HAVE A LOOK AT MY EMIS AT HOME
No needs for new
insulation
Good practice:
reduce setpoint in Fall
TOOLS TO
TRACK MY
ENERGY
BILL
3. Slide | 3
SUCCESS FACTORS
① You’re richer than you think
Meters, historian, display, analysis software…
② Top-down approach, bottom-up
implementation
No accountability without actionable parameters
③ Start implementation with an energy
optimization project
Pilot: people readiness, potential, data available
4. Slide | 4
WHY DON’T YOU HAVE
AN ENERGY MANAGEMENT
SYSTEM YET?
and should you?
Sebastien Lafourcade, Pepite Technologies
5. Slide | 5
WHY AN ENERGY MANAGEMENT SYSTEM?
“We have built a
new biomass
boiler”
“We know what to
do, we have a
project list”
“We are looking at
energy everyday”
What do you do to
secure return on
investment?
What is your game
plan to implement
and sustain?
Do you quickly
take actions?
6. Slide | 6
THE 5 KEY DRIVERS FOR ENERGY PERFORMANCE
Driver Best practice we have seen
How do you ensure that
recommendations are followed?
Going to the rootcauses (identify all the
drivers and their combinations) and
addressing impacts on production and
quality
What tools do you use to
analyze process data?
Multivariate data analysis software
How do you ensure that gains
are sustained?
Max of 3 KPI per level with dynamic
target for smart monitoring
How do you empower operators
to sustain gains?
Involvement of operators at every step of
the problem solving and the data analysis
How do you build people
capability in the mills?
Self assessment tool and automated
troubleshooting tool
7. Slide | 7
EXPERIENCE WITH EMIS IN PULP AND PAPER
(OR MT&R, M&V, ISO50001…)
+ Several ongoing projects in N-A and Europe
Energy
audit
in
20+
mills
with
focus
on
data
availability
&
quality,
monitoring
capability
and
performance
gap
Par?cipa?on
in
Energy
Blitz
at
15+
mills
with
significant
and
sustainable
cost
reduc?ons
2 EMIS
implementation in
mills with different
situation, motivation,
and culture
High level
monitoring models
implemented in
5+ mills
8. Slide | 8
WHY SO LITTLE IMPLEMENTATION IN P&P?
Strengths Challenges
?
9. Slide | 9
LET’S LOOK AT TYPICAL ENERGY MANAGEMENT
SYSTEM GAP ANALYSIS
10. Slide | 10
GAP ANALYSIS REVEALS LOW LEVERAGE OF
ABUNDANT DATA AND IT INFRASTRUCTURE
11. Slide | 11
LOW CAPEX REQUIRED BECAUSE OF
EXISTING INFRASTRUCTURE
good level of
metering
$
S
E
G
D
historian
DCS
control room
engineering
management
corporate
PLC /
server
server
link to real time
external data
high level of
automation
most of the
mills have a
data historian
access to data and
information
data
analysis
software
reporting
system
✔ ✔
✔
✔
✔
✔✔
12. Slide | 12
ENERGY IS ALREADY IN PEOPLE MINDS
managers
engineers
supervisors
operators
Big cost
monitored
(ex TMP)
Energy
audits
Energy
projects
Awareness
campaign
Eyes on
benchmarks
High level
reporting
Energy
manager
13. Slide | 13
MILLS HAVE GOOD ORGANIZATIONAL ASSETS
Corporate
task force
Energy team/
manager
Green belt
programs
Process
knowledge
Continuous
improvement
Operation
challenges
Capability
building
Performance
management
14. Slide | 14
P&P: GOOD ASSETS FOR EMIS IMPLEMENTATION
Strengths Challenges
Organization
Eyes on
energy
Hardware/
software
15. Slide | 15
COMPLEX PROCESS INTERACTIONS CREATE A GAP
BETWEEN DATA AND ACTIONS
• Energy account centers
• EAC definition is easy… Effective EAC are challenging to
define!
• Targeting
• Rootcauses of variability are difficult to identify
• Targeting can become very complex
• Simple regression with production is ineffective
• Baseload definition does not really make sense
• Actions – “So what?”
• Lack of targets and actionable parameters
• Risk of displacing energy use
16. Slide | 16
WHO'S ACCOUNTABLE FOR WARM WATER SYSTEM?
PM1 shower
water tank
PM1 showersT
Steam makeup
Variability reduction can represent up to a $500,000/year savings
L
Fresh water
PM1 condenser
PM1 economizers Hot water
tank
Kraft mill hot water
TMP water heater
TMP cooling duties
mill excess warm water
PM2 economizers
PM cooling duties
PM effluent
heat exchanger
T
17. Slide | 17
TYPICAL TARGETING IS NOT PRACTICAL
Predicting performance
during start-ups or
shutdowns is irrelevant
Predicting
“baseload” is
irrelevant for
continuous
process
This is the only area
where we need
performance equation
18. Slide | 18
HUMAN CHALLENGES FOR EMIS IMPLEMENTATION
• Focus on production
• Operations are production-oriented, not cost-focused
• Accountability for energy costs
• Problem solving culture
• Problem solving is based on opinions and experience
rather than on facts
• Lack of targets and actionable parameters
• Resources
• Competition with other energy project for $ and people
• Lean - “Not another hat”
19. Slide | 19
ELECTRICITY VS. STEAM
Thermal
Electrical – without
TMP / GWD
Electrical
TMP / GWD
KPI structure Complex Groups of EAC Often in place
Metering vs.
EAC and KPI
Good
Not complete
Not consistent
Good
Targeting Complex More typical
APC with focus on
quality
EMIS
implementation
Complex
(interactions)
Complex
(actionable param.)
Complex
(culture)
Variability
reduction
opportunity
High Low Medium to high
Load
management
opportunity
Depends on
marginal fuel
Depends on the
market
Part of it already
captured
20. Slide | 20
WHAT CAN WE DO NOW?
Strengths Challenges
Gap between data
and actions
Operation culture
Problem solving
culture
Resources
Organization
Focus on energy
Hardware/software
21. Slide | 21
SUCCESS IS A MIX OF PROCESS EXPERTISE,
TECHNOLOGY AND PEOPLE ENGAGEMENT
The right tool to the right person at the right time
22. Slide | 22
“TURNING EVERYONE INTO A DECISION MAKER.
PUSH DECISION-MAKING DOWN TO THE LOWEST LEVEL”
-NUCOR
OperatorsSupervisorsManagers
Impactofdecisiononday-to-dayenergycost
Top
management
commitment
with global view
on cost control
Focus on
actionable
parameters in
the control
room
23. Slide | 23
EAC IS THE WAY YOU COUNT ENERGY BUT KPI
STRUCTURE IS THE WAY YOU MANAGE IT
Strategic goals
reduce cost by X M$, be energy self sufficient in 5 years, …
EAC#2 EAC#3 EAC#4EAC#1
M M M M
KPI KPI
KPI KPI KPI
KPI
KPI KPI
Tactical level
OperatorsSupervisorsManagers
Impactofdecisiononday-to-dayenergycost
mill manager: $ vs.
budget for the last 3
days on his blackberry
operator: % valve
opening vs. target
every hour on DCS
24. Slide | 24
LEVERAGE HISTORICAL DATA TO BRING FACTS
IN OPERATOR HANDS
Actual
value
of KPI
Predicted regimes based on 3+ process variables
> 1.1
< 1.1
KPI>1.1 KPI<1.1
A: Performance is
good and we know
why
C: Performance is
good “but we do
not know why”
B: Performance is
bad “but we do
not know why”
D: Performance is
bad and we know
why
Insight to solve the problem
1. CO pre-heater > 15%
2. Temp heating tower < 84,5°C
Previously unseen situation!
Operator alerts energy team
for more investigations
25. Slide | 25
CLASSICAL EMIS IMPLEMENTATION SCHEME…
Upfront investment for mill wide
measurement, IT system,
software + service
cashflow
implementation
HEAVY ON
RESOURCES
AND
CASHFLOW
26. Slide | 26
IMPLEMENTATION BY PROJECTS PROVIDES BETTER
CHANCE OF SUCCESS
cashflow
implementation
Upfront investment for
service and minor IT
development
FIRST
PROJECT
FOCUS ON
AREA WITH
THE BIGGEST
POTENTIAL
Investment for service
and some IT, required
measurement, software
Kickoff project sub-project #2 sub-project #3
27. Slide | 27
APPROACH TO SOLUTION – TYPICAL PROJECT
Kick
off
session
• KPI
structure
• Workshops
with
operators
and
stakeholders
• Process
understanding
• Data
collec?on
Data
analysis
• Explora?on
• Rootcause
analysis
(mul?variate
data
analysis)
• Modeling
Implementa3on
prepara3on
• Test
and
valida?on
of
the
model
off
line
• Programming
of
equa?ons
and
dashboard
• Repor?ng
structure
Implementa3on
• Operators
training
• Stakeholder
training
• Closing
session
Immediate actions
taken based on
performance gap
analysis
• Awareness
• Capability building
of plant people
• First decisions,
first savings
• Better knowledge
of operation
• Optimization rules
of the process
$$$
$$$
$$$
28. Slide | 28
SUCCESS FACTORS
① You’re richer than you think
Meters, historian, display, analysis software…
② Top-down approach, bottom-up
implementation
No accountability without actionable parameters
③ Start implementation with an energy
optimization project
Pilot: people readiness, potential, data available