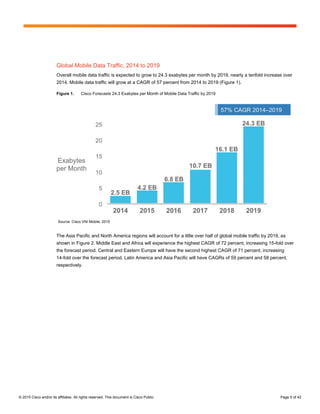
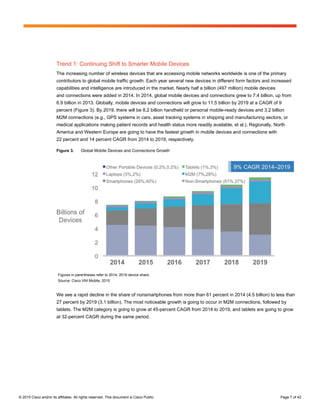
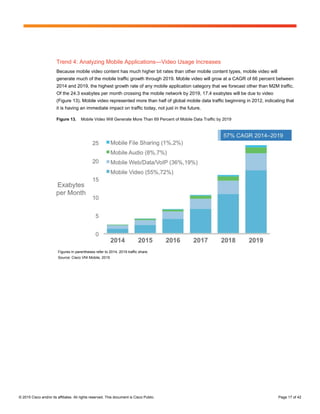
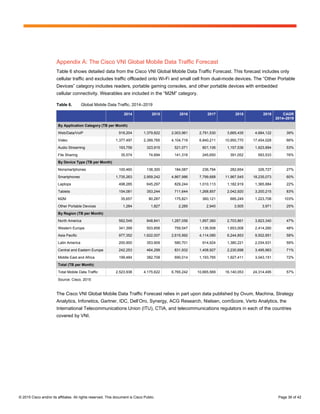
Global mobile data traffic grew 69% in 2014, reaching 2.5 exabytes per month. Smartphones accounted for the majority (88%) of the nearly 500 million new mobile connections added. Mobile video traffic exceeded 50% of total traffic for the first time in 2012 and grew to 55% by the end of 2014. The document projects that global mobile data traffic will increase nearly tenfold between 2014 and 2019, reaching 24.3 exabytes per month driven primarily by increased smartphone and mobile video usage.

![© 2015 Cisco and/or its affiliates. All rights reserved. This document is Cisco Public. Page 2 of 42
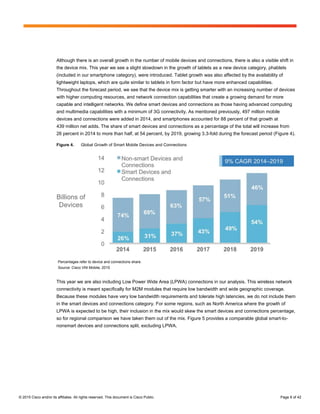
Globally, smart devices represented 26 percent of the total mobile devices and connections in 2014; they
accounted for 88 percent of the mobile data traffic. (For the purposes of this study, smart devices refers to mobile
connections that have advanced multi-media/computing capabilities with a minimum of 3G connectivity.) In 2014,
on an average, a smart device generated 22 times more traffic than a non-smart device.
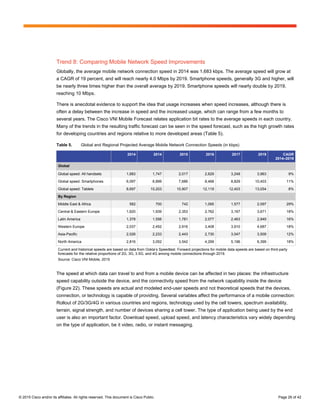
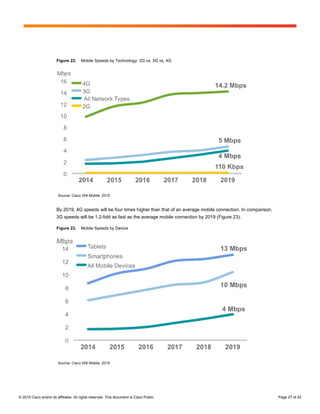
Mobile network (cellular) connection speeds grew 20 percent in 2014. Globally, the average mobile network
downstream speed in 2014 was 1,683 kilobits per second (kbps), up from 1,387 kbps in 2013.
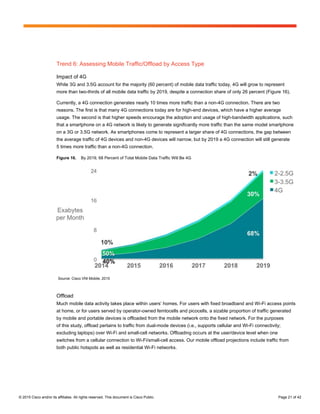
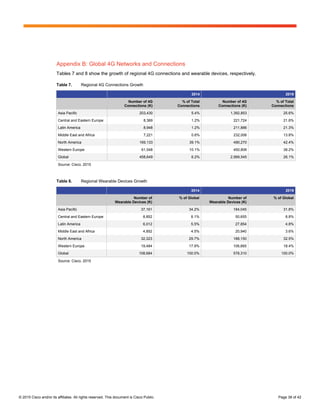
In 2014, a fourth-generation (4G) connection generated 10 times more traffic on average than a
non-4G connection. Although 4G connections represent only 6 percent of mobile connections today, they already
account for 40 percent of mobile data traffic.
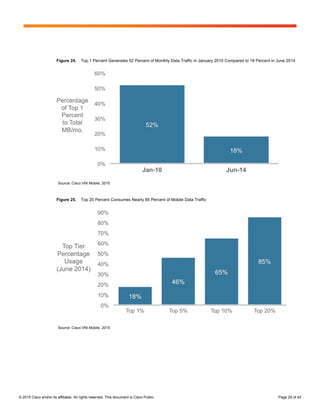
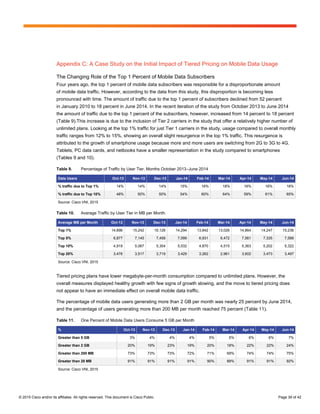
The top 1 percent of mobile data subscribers generated 18 percent of mobile data traffic, down from
52 percent at the beginning of 2010. According to a mobile data usage study conducted by Cisco, the top
20 percent of mobile users generated 85 percent of mobile data traffic, and the top 1 percent generated 18 percent.
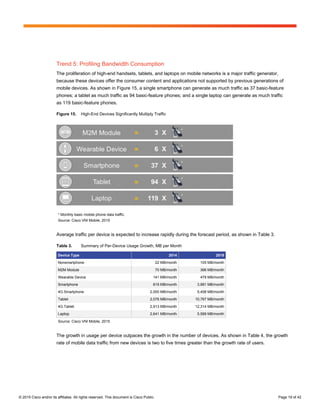
Average smartphone usage grew 45 percent in 2014. The average amount of traffic per smartphone in 2014
was 819 MB per month, up from 563 MB per month in 2013.
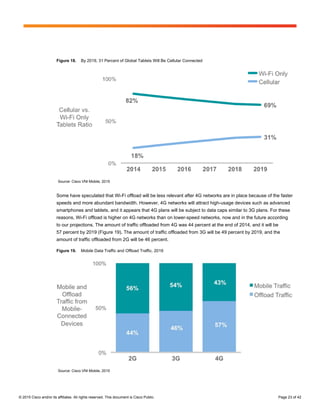
Smartphones represented only 29 percent of total global handsets in use in 2014, but represented
69 percent of total global handset traffic. In 2014, the typical smartphone generated 37 times more mobile
data traffic (819 MB per month) than the typical basic-feature cell phone (which generated only 22 MB per month
of mobile data traffic).
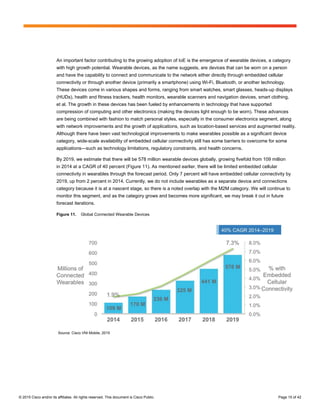
Globally, there were nearly 109 million wearable devices (a sub-segment of the machine-to-machine
[M2M] category) in 2014 generating 15 petabytes of monthly traffic.
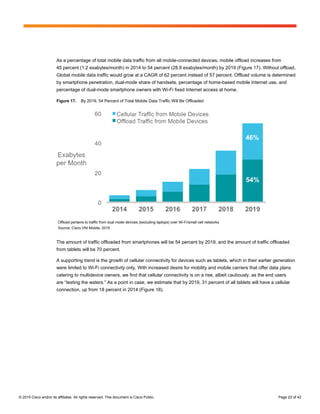
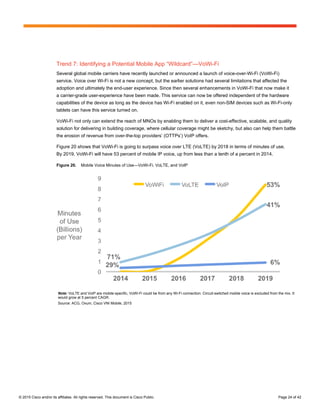
Globally, 46 percent of total mobile data traffic was offloaded onto the fixed network through Wi-Fi or
femtocell in 2014. In 2014, 2.2 exabytes of mobile data traffic were offloaded onto the fixed network each month.
Without offload, mobile data traffic would have grown 84 percent rather than 69 percent in 2014.
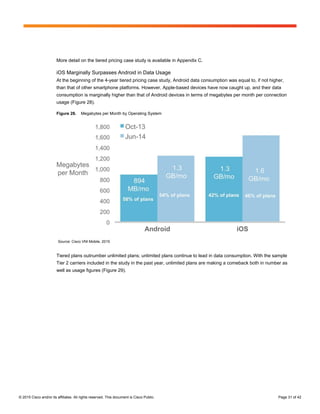
Per-user iOS mobile devices (smartphones and tablets) data usage marginally surpassed that of Android
mobile devices data usage. By the end of 2014, average iOS consumption exceeded average Android
consumption in North America and Western Europe.
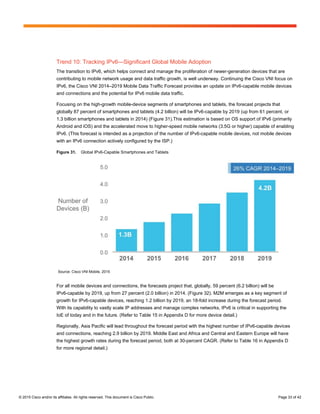
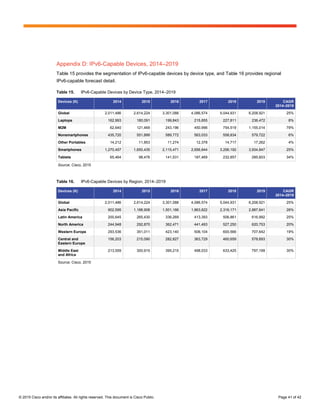
In 2014, 27 percent of mobile devices were potentially IPv6-capable. This estimate is based on network
connection speed and OS capability.
In 2014, the number of mobile-connected tablets increased 1.6-fold to 74 million, and each tablet generated
2.5 times more traffic than the average smartphone. In 2014, mobile data traffic per tablet was 2,076 MB per
month, compared to 819 MB per month per smartphone.
There were 189 million laptops on the mobile network in 2014, and each laptop generated 3.2 times more
traffic than the average smartphone. Mobile data traffic per laptop was 2.6 GB per month in 2014.
Average nonsmartphone usage doubled to 22 MB per month in 2014, compared to 11 MB per month in
2013. Basic handsets still make up the vast majority of handsets on the network (68 percent).](https://image.slidesharecdn.com/whitepaperc11-520862-150721215906-lva1-app6892/85/White-paper-c11-520862-2-320.jpg)