
Recommended
Recommended
More Related Content
What's hot
What's hot (20)
Viewers also liked
Similar to Texto 1 gaston 2000 pattern biodiversity
Similar to Texto 1 gaston 2000 pattern biodiversity (20)
More from Carlos Alberto Monteiro
More from Carlos Alberto Monteiro (20)
Recently uploaded
Recently uploaded (20)
Texto 1 gaston 2000 pattern biodiversity
- 1. insight review articles 220 NATURE | VOL 405 | 11 MAY 2000 | www.nature.com B iodiversity, the variety of life, is distributed heterogeneously across the Earth. Some areas teem with biological variation (for example, some moist tropical forests and coral reefs), others are virtually devoid of life (for example, some deserts and polar regions), and most fall somewhere in between. Determining why these differences occur has long been a core objective for ecologists and biogeographers. It constitutes a continuing, an important, and to many an enthralling, challenge. Indeed, the past decade has seen a veritable explosion of studies documenting broad-scale (geographical) spatial patterns in biodiversity, seeking to explain them, and exploring their implications. The reasons for this interest are twofold. First, it reflects increased opportunity provided by improvements in available data and analytical tools, the former resulting mostly from extensive collation of existing specimen and species occurrence records, the establishment of dedicated distribution-mapping schemes, and the use of remote-sensing technology (to measure vegetation and other environmental variables). Second, it reflects concern over the future of biodiversity, and the resultant need to determine its current status, to predict its likely response to global environmental change, and to identify the most effective schemes for in situ conservation and sustainable use. Many of these issues can be addressed satisfactorily only by resolving the historical mismatch between the fine resolution of study plots in ecological field work (typically a few square metres) and, by comparison, the poor resolution of land-use planning and models of environmental change. A host of global patterns of spatial variation in biodiversity has been explored (Fig. 1). This includes patterns in hotspots and coldspots (highs and lows) of diversity (includ- ing comparisons between biological realms and between biogeographical regions), variation with spatial scale (for example, species–area relation- ships and relationships between local and regional richness) and along gradients across space or environmen- tal conditions (for example, latitude, longitude, altitude, depth, peninsulas, bays, isolation, productivity/energy and aridity1,2 ). Although several differ- ent levels of organization (genes to ecosystems) of biological variation can be distinguished, most analyses of spatial variation concern biodiversity as measuredbythenumberofspeciesobservedorestimatedto occur in an area (species richness). This results from wide- spreadrecognitionofthesignificanceofthespeciesasabio- logical unit, and from the practical issues of the ease and magnitude of data acquisition. Consideration of spatial variation in other measures of biodiversity, particularly thoseconcerningthedifferencebetweenentitiesratherthan simplytheirnumbers,hasbeenremarkablysparse(withthe possible exception of patterns in body size and morpholo- gy). Thus, although much attention has been paid to latitu- dinalvariationinspeciesrichness,littleisknownaboutvari- ation in the diversity of genes, individuals or populations alonglatitudinalgradients. The growth of interest in broad-scale spatial variation in biodiversity has been particularly striking with regard to four areas of enquiry: latitudinal gradients in species rich- ness, species–energy relationships, relationships between local and regional richness, and taxonomic covariance in species richness. In this review, the progress being made in each of these areas will be used to substantiate four broader cross-cutting observations about global patterns of biodi- versity: respectively, that no single mechanism adequately explains all examples of a given pattern, that the patterns observed may vary with spatial scale, that processes operat- ing at regional scales influence patterns observed at local ones, and that the relative balance of causal mechanisms means that there will invariably be varia- tions in and exceptions to any given pat- tern. Latitudinal gradients in species richness Highproportionsofterrestrialandfresh- water species occur in the tropics. Moving from high to low latitudes the average species richness within a sam- pling area of a given size increases, as has been documented for a wide spectrum of taxonomic groups (including groups as different as protists, trees, ants, woodpeckers and primates) for data across a range of spatial resolutions3,4 . Such gradients in species richness may be steep (for a given area, tropical assemblages are often several times morespeciosethantemperateones),and have been a persistent feature of the Global patterns in biodiversity Kevin J. Gaston Biodiversity and Macroecology Group, Department of Animal and Plant Sciences, University of Sheffield, Sheffield S10 2TN, UK (e-mail: k.j.gaston@sheffield.ac.uk) To a first approximation, the distribution of biodiversity across the Earth can be described in terms of a relatively small number of broad-scale spatial patterns. Although these patterns are increasingly well documented, understanding why they exist constitutes one of the most significant intellectual challenges to ecologists and biogeographers. Theory is, however, developing rapidly, improving in its internal consistency, and more readily subjected to empirical challenge. CONSERVATIONINTERNATIONAL © 2000 Macmillan Magazines Ltd
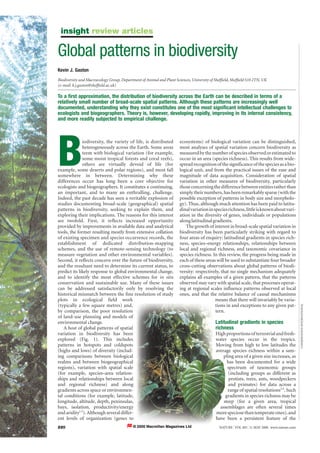
- 2. history of biodiversity5,6 . In the marine environment, open-ocean pelagic and deep-sea taxa also show broad latitudinal gradients in speciesrichness,butsomedebatecontinuestosurroundevidencefor shallow-watersystems,particularlyfornon-calcareoustaxa7 . The growing number of increasingly refined analyses of latitudi- nal gradients in species richness has begun to suggest some impor- tant nuances to this pattern, although the extent of their generality remains uncertain. Thus, it seems that declines in richness with latitude may be faster in the Northern than in the Southern Hemisphere8,9 , and that peaks in richness may not lie actually at the Equator itself but some distance away10,11 . Although poorly docu- mented, such latitudinal asymmetries would be unsurprising given that these exist also in contemporary climate, in historical climatic events,andinthelatitudinalcomplexitiesofthegeometryandareaof landandocean. Indeed, the latitudinal gradient in species richness is a gross abstraction. Any underlying pattern is disrupted, sometimes markedly, by variation in species richness with other positional variables (for example, longitude, elevation and depth), and environmental ones (for example, topography and aridity). Thus, the detailed pattern of change with latitude depends on where one looks,reflectingthegenerallycomplexpatternsofspatialvariationin species richness. This indicates that consideration of latitudinal gradients in richness in isolation from other gradients might not be the most profitable way forward. In as much as latitude per se (and likewise other positional variables) cannot be a determinant of speciesrichness,butonlyacorrelateofnumbersofpotentiallycausal environmental factors, this is doubtless correct. Nonetheless, more thananyotherpatternthelatitudinalgradientinspeciesrichnesshas held an enduring fascination for biologists, particularly because of the obviously striking diversity of many tropical floras and faunas whencontrastedwiththeircounterpartsathighlatitudes. The latitudinal gradient in species richness, however complex it might be, is a consequence of systematic spatial variation in the balance of speciation and the immigration of species, which add species to an area, and of the extinction and emigration of species, which take them away. For very large areas, the effects of speciation andregionalorglobalextinctionwillpredominate,andimmigration andemigrationwillbelessimportant.Morethan25differentmecha- nisms have been suggested for generating systematic latitudinal variation in these processes2 , commonly emphasizing reasons as to why the tropics are highly speciose (although there is no a priori expectation that either tropical or temperate zones in any sense represent an ‘unusual’ condition12 ). These include explanations based on chance, historical perturbation, environmental stability, habitatheterogeneity,productivityandinterspecificinteractions. Manyofthesemechanismsarenotmutuallyexclusive,andothers merely offer different levels of explanation. Nonetheless, to some, en masse they have been perceived to constitute a gordian knot. Two recentattemptstocutitconcerntheimportanceofthephysicalstruc- ture of the Earth. First, null models that assume no environmental gradients, but merely a random latitudinal association between the size and placement (midpoint) of the geographical ranges of species, predict a peak of species richness at tropical latitudes13 . This occurs because when the latitudinal extents of species in a given taxonomic group are bounded to north and south — perhaps by a physical con- straint such as a continental edge or perhaps by a climatic constraint such as a critical temperature or precipitation threshold — then the insight review articles NATURE | VOL 405 | 11 MAY 2000 | www.nature.com 221 Figure 1 Spatial patterns in species richness. a, Species–area relationship: earthworms in areas ranging from 100 m2 to >500,000 km2 across Europe76 . b, Species–latitude relationship: birds in grid cells (~ 611,000 km2 ) across the New World44 . c, Relationship between local and regional richness: lacustrine fish in North America (orange circles, large lakes; blue circles, small lakes)61 . d, Species–elevation relationship: bats in Manu National Park & Biosphere Reserve, Peru77 . e, Species–precipitation relationship: woody plants in grid cells (20,000 km2 ) in southern Africa78 . Numberofspecies NumberofspeciesNumberofspecies Loglocalnumberofspecies Log(numberofspecies+1) 1.8 1.4 1.0 0.6 0.2 –0.2 1,400 1,200 1,000 800 600 400 200 0 600 500 400 300 200 100 0 –5 –3 –1 1 3 5 0.8 1.0 1.2 1.4 1.6 1.8 2.0 2.2 –80 –60 –40 –20 0 20 40 60 0 0 200 400 600 800 1,000 1,200 1,400 500 1,000 1,500 2,000 2,500 3,000 3,500 Log area Log regional number of species Latitude Annual precipitation (mm) Elevation (m)°N °S 1.4 1.2 1.0 0.8 0.6 0.4 0.2 0.0 120 100 80 60 40 20 0 a c b d e © 2000 Macmillan Magazines Ltd
- 3. numberofwaysinwhichrangescanbedistributedchangessystemat- ically between the bounds. Thus, whereas species with latitudinal midpoints midway between the bounds can extend a little or a long way before those bounds are encountered, those with midpoints close to the bounds can extend only a little way before this occurs. A null model has been wanting from discussions of latitudinal gradients in species richness. The ‘mid-domain’ model is thus likely to stimulate much interest. It is also likely to be most applicable for groups whose distributions are genuinely limited by a physical boundary (for example, those of large islands such as Madagascar), although its extension to two spatial dimensions is problematic, given the longitudinal variation in land and ocean area. The application of the model to other kinds of constraints is more ques- tionable, as the position of those constraints that are recognized will bedependentontheinclusivenessofthesetofspeciesconsidered. The second attempt to explain latitudinal gradients in species richnessbasedonthephysicalstructureoftheEarthconcernstherole of area (its importance has long been entertained14,15 and recently brought to prominence16,17 ). The tropics have a larger climatically similar total surface area than any other ecoclimatic zone. This is because: (1) the surface area of latitudinal bands decreases towards the poles; (2) the temperature gradient between the Equator and the poles is nonlinear (the mean being relatively constant between approximately20ᑻNand20ᑻS);and(3)theregionsofsimilarclimate immediately north and south of the Equator abut. It has been contended that, for a given species richness, larger mean geographi- cal-range sizes of species in the tropics result from the large area (which is not to be confused with any observed pattern in mean rangesizesatdifferentlevelsofrichness),andthatthesetranslateinto higher speciation rates (presuming larger ranges have higher probabilities of speciation) and lower extinction probabilities (presuming larger ranges have lower probabilities of extinction)16,17 . As a consequence, tropical regions have greater numbers of species thanextratropicalones. Area is almost certainly an important contributor to latitudinal gradients in species richness (indeed, area effects have a pervasive influence on patterns of biodiversity). However, tests of the ‘area model’ have been limited (and often tangential), and have seldom sought the signal of the influence of area on latitudinal gradients when other factors have been controlled for. Moreover, as a sole explanation the area model is insufficient. To account fully for a latitudinal gradient in species richness (rather than simply for the greater richness of the tropics) the model requires that ecoclimatic zones decline systematically in area moving from the Equator towards the poles. However, they do not do so (ecoclimatic zones at high latitudes tend to be large10,17 ). Three possible explanations have been advanced for why a latitudinal gradient in species richness might nonetheless be expressed: (1) low productivity/energy availability at high latitudes reduces the species richness they would gain as a result of area alone10,17 ; (2) zonal bleeding of tropical species into extratropical regions smoothes out species-richness gra- dients18,19 ; and (3) high insight review articles 222 NATURE | VOL 405 | 11 MAY 2000 | www.nature.com localclimaticvariabilityathighlatitudeseffectivelyincreasesthearea of ecoclimatic zones that species can actually occupy, because it requiresthatindividualshavebroadenvironmentaltolerances3 . The observation that area alone is insufficient as a determinant of latitudinal gradients in species richness could equally be made about almost any other factor that has been proposed as being important (although critical tests are typically lacking). This highlights an issue thathasbeencentraltomuchofthedebateaboutthecauseofthisand other global patterns in biodiversity, namely the assumption that whereapatterniscommontomanytaxaitmustresultfromthesame single mechanism — “wherever there is a widespread pattern, there is likely to be a general explanation which applies to the whole pattern”20 . To argue for a single primary cause may be to expect from ecological interactions a simplicity for which there is little evidence. There is no necessary reason why latitudinal gradients exhibited by taxa as distinct as protozoa and mammals, and in environments as structurallydifferentasthedeepseaandtropicalforests,needbegen- erated in the same way, whatever the attractions of Occam’s razor. Increasingly it seems that patterns in biodiversity are likely to be generated by several contributory mechanisms12,21 . The strongest and most general may be those where all the different mechanisms pull in the same direction22 . It is instructive that although numerous mechanisms for latitudinal gradients in species richness have been identified, and rather few processes that would oppose such a trend, nosinglemechanismhasofitselfprovensufficient. Species–energy relationships One factor thought to be important in modulating any effect of the physicalstructureoftheEarthindetermininglatitudinalgradientsin species richness is the relationship between the number of species in an area and ambient available (‘usable’) environmental energy. (This energy is usually estimated from models or indirectly from other variables, and often used interchangeably with ‘net primary productivity’.)Theformandcauseofthisrelationshiparesomeofthe most hotly debated topics in the study of global patterns in biodiver- sity, with many fundamental issues as yet unresolved. Much of the discussion centres on the influence of spatial scale on observed relationships. At a relatively local scale (spatial resolution and extent), there is a marked tendency for a general hump-shaped relationship between species richness and available energy, with species richness increas- ing from low to moderate levels of energy and then declining again towards high levels of energy when a sufficient range of energy values is sampled16,17,23 . At least across temperate to polar areas, at geographical scales there is substantial evidence for a broadly posi- tive monotonic relationship between species richness and energy availabilitytobecommon10,24–33 (Fig.2).Thebestcorrelatesforplants tendtobemeasuresofbothheatandwater(suchasactualevapotran- spiration and net primary productivity), whereas for terrestrial, and perhaps marine, animals the best correlates are measures of heat (such as mean annual temperature and potential evapotranspira- tion)28,29,34 . For example, whereas the species richness of trees in temperate Europe, eastern North America and East Asia increases with primary productivity27 , the richness of butterflies and birds in areas of Britain increases with the temperature during the appropri- ate season25,26 , and the species richness of amphibians, reptiles, birds and mammals in areas of North America increases with annual potential evapotranspiration (estimated as a measure of the net atmospheric energy balance, independent of water availability28 ). The form taken by species–energy relationships at geographical scales, when extended to include subtropical and tropical areas, or at least to include the fullest range of variation in available energy (which may not be the same thing), remains unclear. There is evidence to suggest that they remain broadly positive and monoton- ic, that they become mildly or strongly hump-shaped, and that they begin to break down altogether10,32,35–37 ; the answer may depend criticallyonthemeasureofenergyusedandthetaxonconcerned. CONSERVATIONINTERNATIONAL © 2000 Macmillan Magazines Ltd
- 4. Any contingency of the gross or more detailed form of patterns in biodiversity on the spatial extent and dispersion of sampling units is not restricted to species–energy relationships. Indeed, the almost ubiquitous positive relationship between the numbers of species in an area and the size of that area (the species–area relationship) may itself vary in form with the absolute sizes of areas, their spatial rela- tionships (for example, isolation), and their latitudinal position38,39 ; this is often forgotten when attempting to control for differences in area in analyses of global patterns of biodiversity. Reconciliation of the patterns in biodiversity that are observed at different scales may provide significant insights into their determinants. If this is to be achieved, it is important to ensure that the scale of sampling and the scale of processes that are postulated to explain patterns in species richness are closely matched. One criticism of some discussion of species–energyrelationshipsatbroadscaleshasbeenthatthishasnot been done; curiously, this has been interpreted, by different parties, as yielding species–energy relationships that may be misleadingly strong or misleadingly weak40–42 . Matching scales of sampling and processes is more readily achievable at local scales, and constitutes one of the most significant obstacles to testing mechanisms over broaderareas. Although other explanations have been offered, the processes resulting in a broadly positive relationship between species richness and energy availability at geographical scales (and at low-to- moderate energy levels at more local scales) are believed to be reasonablystraightforward.Greaterenergyavailabilityisassumedto enable a greater biomass to be supported in an area. In turn, this enables more individual organisms to coexist, and thus more species at abundances that enable them to maintain viable populations. The result is an increase in species richness with energy availability. This assumes a basic equivalence between species in their energetic requirements at different levels of energy availability43 . Although there is some evidence in animal systems that average densities and bodysizesofspeciesinanareadecreaseasenergyavailabilityincreas- es (that is, energy is divided more finely44 ), this will tend to enhance thespecies–energyrelationshipprovidedthesetrendsaresufficiently markedcomparedwiththescalingofmetabolicratetobodymass. There are important similarities between this ‘more-individuals model’45 and the area model as explanations of variation in species richness44 . First, both to some degree concern variation in solar energy (and water availability), with the level and availability of this energy source being important in the former case, and the spatial extentofagivenlevel(asreflectedinanecoclimaticzone)inthelatter. If ecoclimatic zones vary in available energy, then observed species–energy relationships (and those between richness and lati- tude) may reflect the joint effects of their area and this availability37 . Second, the area model assumes that area influences richness through its effect on geographical-range size, and the more- individuals hypothesis that energy influences richness through its effect on population size. There is a general, positive, interspecific relationship between total population size (or local density) and size of geographical range46 . Any factor that increases one of these variables will also be likely to increase the other. Both mechanisms thereforedepend,ineffect,onsomefactorthatispositedtoinfluence the biomass available to be worked on by the processes of speciation and extinction, which will be a product of both area and available energy per unit area29,47 . Presumably, it is for this reason that small areastendtobespeciespoorhoweverhightheirenergyinput,where- aslargeareastendtobespeciespoorifthereislowenergyinput. Assuming that species–energy relations are causal and that a more-individuals model is operating, then it is unlikely that the path of causality is simple. Levels of available energy may constrain the amount of biomass that is achieved in an area, but characteristics of the biosphere, and particularly those of vegetation, are themselves known to be key influences on climate, including temperature and precipitation48 . For example, the coupling of an atmospheric model and a simple land-surface scheme has indicated that coastal defor- estation in West Africa has been a significant contributor to the observed drought in the region49 ; this deforestation has resulted in a number of species being threatened with extinction50 . Complex pat- terns of causality suggest an important connection between species–energy theory and debates over the ecosystem function of biodiversity51,52 . Even accepting that paths of causality may be complex, there are some potentially significant difficulties with a more-individuals model. 1. The assumption that the number of individual organisms increases with available energy and total biomass may not apply to plants, for which there is evidence that as standing crop increases the numbers of adult individuals per unit area actually declines (and their size increases), which should tend to reduce species richness rather than increase it35 . However, this argument is based in large part on findings from monospecific stands of species differing substantially in their architecture, and it is unclear to what extent it generalizes to multispecies stands and systems that are structurally more similar (for example, temperate compared with tropical forests). Evidence as to how overall biomass and numbers of individuals change with species richness in animal systems is scant, evenforwell-knowngroupssuchasbirds,andisplaguedbyapaucity insight review articles NATURE | VOL 405 | 11 MAY 2000 | www.nature.com 223 Summer temperature (°C) NumberofspeciesNumberofspecies 0 20 40 60 80 8 10 12 14 16 Sea surface temperature (°C) Potential evapotranspiration (mm yr –1) 100 200 300 400 500 600 700 800 900 1,000 5 10 15 20 25 30 Squarerootofnumberofspecies –0.5 0.5 1.5 2.5 3.5 4.5 0 400 800 1,200 1,600 2,000 a b c Figure 2 Species–energy relationships. a, Mean monthly summer temperature (ᑻC) and richness of breeding birds in Britain (grid cells of 10 km ǂ 10 km)33 . b, Mean annual sea surface temperature and richness of eastern Pacific marine gastropods (bands of 1ᑻ latitude)10 . c, Potential evapotranspiration (mm yr–1 ) and richness of Epicauta beetles (Meloidae) in North America (grid cells of 2.5ᑻ ǂ 2.5ᑻ south of 50ᑻ N, 2.5ᑻ ǂ 5ᑻ north of 50ᑻ N)31 . © 2000 Macmillan Magazines Ltd
- 5. of strictly comparable studies from areas differing markedly in speciesrichness. 2. Many taxa use such a small proportion of the total energy available in an area, or at least of the energy that is being measured, that it seems unlikely that detectable relationships with species richness would arise (especially given the likely magnitude of measurement errors). Thus, although species richness of birds tends toincreasewithavailableenergy,avianassemblagesmay,directlyand indirectly, commonly exploit only a small proportion of the primary productioninalocality.(Theaviancommunityoftheforestedwater- sheds of the Hubbard Brook Experimental Forest has an average ingestion rate which represents 0.17% of ecosystem net annual productivity53 .) 3. In its simplest form, the more-individuals model ignores the likelyeffectsoftemporalvarianceinenergylevelsonspeciesrichness. High average levels of energy may not result in large numbers of species if they are accompanied by high temporal variability in those levels. The relationship between levels of available energy and their variance may be broadly different between some terrestrial and marine systems (negative in the former, positive in the latter), perhaps explaining why even at very broad spatial scales high richness may not be associated with high productivity in marine systems37 . 4. At regional scales, levels of species richness have not been produced directly by present environmental conditions, as processes ofspeciationandextinctiondonotoperateonthesetimescales.Ifthe more-individuals model is to apply this must mean that present environmentalconditionsareagoodproxyforpastones,oratleastof relativedifferencesintheconditionsindifferentareas. Alternatives to the more-individuals model have been advanced to explain positive species–energy relationships. These have been basedparticularlyonvariationwithenergyinlevelsofconstraintson geographical ranges, specialization, population growth rates and numberoftrophiclevels45 .Foremostistheideathattherelationships may reflect physiological constraints on the distribution of species, with energy availability capturing factors that limit distributions as a resultofmetabolicconsiderations30 . In the absence of strong support for any of these alternative explanations, difficulties with the more-individuals model fuel growing speculation that at least some species–energy relationships may not be causal, and that energy availability may often be only a covariateofsomeotherfactorthatisactuallydrivingspeciesrichness. Bird richness may, for example, be responding to a second-order effect of greater vegetational complexity with increased available environmentalenergy.Likewise,recentworkhasshownthatwhereas sea surface temperature explained nearly 90% of geographical varia- tion in planktonic foraminiferal diversity throughout the Atlantic Ocean, this temperature was also correlated with temperatures at different depths. This indicates that the diversity may be controlled bythephysicalstructureofthenear-surfaceoceanandnotdirectlyby availableenergy32 . Continuingwiththistheme,therehasbeendebateastotherespec- tive roles of contemporary levels of energy and of historical factors in generatingglobalpatternsoftreespeciesrichnessinmoistforests.The debate has centred on the extent to which differences in richness between continents and between latitudes result from variation in annual actual evapotranspiration (a good, but not universal, predictor of primary productivity) or from long-term evolutionary andgeographicalprocesses40–42 .Thepracticalconstraintsonconduct- ing experiments at relevant scales mean that differentiating between hypotheses necessarily requires that they make divergent testable predictions, and even then may not enable the relative roles of differentfactorstobequantified.Historicalfactorshavedoubtlesshad a substantial role in shaping contemporary spatial patterns of biodiversity, but deriving such a priori predictions and quantifying the part played by history can often prove difficult. Molecular phylogenies, with estimated dates of diversification events, provide onerichsourceofdatafortestinghypothesesaboutthesignificanceof history. Relationships between local and regional richness In exploring global variation in biodiversity, we need to understand notonlytheimportanceofdifferencesinspatialscaleforthepatterns that are observed (for example, hump-shaped species–energy relationships at local scales and positive relationships at regional ones),butalsohowdiversityatonescalemightrelatetothatatanoth- er. Indeed, it is increasingly apparent that knowledge of the roles of pattern and process at different scales is at the very heart of an understandingofglobalvariationinbiodiversity. Two theoretical types of relationship have been contrasted betweenthelocalrichnessanassemblagemightattainandthespecies richness of the region in which that assemblage resides54 (Fig. 3). Localrichnessmaybedirectlyproportionalto,butlessthan,regional richness,followingaproportional-samplingmodel(typeI).Alterna- tively, as regional richness increases, local richness might attain a ceiling above which it does not rise despite continued increases in regionalrichness(typeII). Acknowledging a number of technical concerns55–57 , most real systems seem to exhibit an underlying type I relationship54,56,58 ; not uncommonly, regional richness explains a large proportion (>75%) of variance in local richness, and local richness constitutes a marked proportion (>50%) of regional richness. For example, type I rela- tionships have been documented for fig wasps and their parasitoids in southern and central Africa59 , tiger beetles in North America and in India60 , lacustrine fish in North America61 (Fig. 1c), and primates in Africa and in South America62 . The predominance of type I relationshipsissupportedbytheobservationthatsomespatialgradi- ents in species richness are documented both for localities and regions across those gradients (with obvious implications for the interpretationofregionalcollationsoffossilrecords). A recurrent problem in studies of spatial patterns in biodiversity hasbeentheconflationofpatternwithmechanism.Nonetheless,the preponderance of examples of type I relationships, particularly where habitat type has been kept constant, backed up with other evi- dence(forexample,thelimitedsupportforcommunityconvergence, density compensation and invasion resistance), indicates that there are not hard limits to levels of local richness63 . That is, local assem- blagesdonotseemtobesaturated,inthewayonemighthaveexpect- ed if ecological interactions (for example, competition, predation and parasitism) limited local richness. Three potential anomalies arise if this conclusion is correct. First, it suggests that although ecological interactions are known to be strong in some circum- stances,theymaytypicallynotbesufficienttohaveamarkedeffecton speciesrichness.Second,itmaybeatoddswiththemore-individuals insight review articles 224 NATURE | VOL 405 | 11 MAY 2000 | www.nature.com Regional species richness Localspeciesrichness Local richness = regional richness Type I Type II Figure 3 Relations between local and regional species richness, illustrating the form of type I and type II relationships and the limiting condition where local richness equals regional richness. © 2000 Macmillan Magazines Ltd
- 6. hypothesis as an explanation for positive species–energy relation- ships based on local site data, because this requires that energy levels limitthenumberofspeciesthatcanco-occur(throughlimitationon the number of individuals). And third, it seems at odds with the existence of marked regional (for example, latitudinal) variation in beta diversity, although this variation may be confounded by differ- ences in habitat composition. (Defining beta diversity as (S/Ȋ) – 1 (whereSisregionalandȊislocalrichness64 ),regionshavingthesame ratio of local-to-regional richness should have the same beta diversi- ty57 .) The marked growth in studies of global patterns in biodiversity is steadily resolving such apparent anomalies by examining multiple patterns for the same assemblage, and thus generating a more coherent picture of the inter-relations between them. But high-qual- ity data sets documenting at high resolution the occurrence of large numbersofspeciesoverextensiveareasaredesperatelyrequired. If most systems exhibit type I relationships between local and regional richness, then a prime driver of local richness seems to be regional richness. The importance of regional-scale phenomena for local-scale assemblage structure is a general one65 . A local communi- ty is assembled from a regional pool of species (this has variously been defined as the total pool of species in a region, or the pool of speciesintheregionthatisactuallycapableofcolonizingagivensite). Thesizeandstructureofthispoolareinfluencedbyregionalprocess- es, including the effects of the geophysical properties and history of theregion(itsage,geology,sizeandclimate),andbroad-scaleecolog- ical or evolutionary processes, such as species migrations, invasions, speciation and regional extinction55 . They set the species composi- tion and the abundance, body size and trophic structure of the pool fromwhichlocalcommunitiesdraw.Indeed,acoreissueinecologyis the extent to which local assemblages can be modelled accurately as random draws from regional species pools, or conversely the extent to which local factors modify the similarity of real assemblages to randomly simulated ones66 . Almost invariably such models can explain some, often much, and occasionally most of the basic structureoflocalassemblages44,66 .Localassemblagestructureandthe regionalcontextareinseparable. Recognitionoftheimportanceofregional-scaleprocessesandthe structure of the regional species pool to local community structure has led to the emergence of macroecology, which is concerned with understanding the abundance and distribution of species at large spatial and temporal scales44,67 . However, although regional pools doubtless are important in structuring local assemblages, they are perhaps best seen as contributing to, rather than determining, local assemblagestructure—localprocessesremainimportant.Resolving therelativecontributionsoflocalandregionalprocessesmayprovide akeytounderstandingglobalpatternsofbiodiversity55 ,butthisissue once again emphasizes that patterns in biodiversity are unlikely to haveasingleprimarycause. Taxonomic covariance in species richness Most major terrestrial and freshwater groups are more speciose in tropicalthantemperateregions,atlowelevationsthanathigh,andin forests than in deserts. One might therefore expect that the regional richness of different groups of organisms would covary positively and, because of the positive relationship between local and regional richness, local richness would do likewise. This would be important because it would simplify the development of an understanding of globalpatternsinbiodiversity. In practice, mismatches between the spatial occurrence of peaks in the richness of different groups have often been observed. For example, among trees, tiger beetles, amphibians, reptiles, birds and mammals, the 5% of land area across the United States and southern Canada in which the highest levels of species richness are attained overlap between some pairs of taxa, but this pattern is not a general one68 . Likewise, although the numbers of species in different, large andsimilar-sizedareasfortwogroupsareoftensignificantlycorrelat- ed, and may enable a very general impression of the patterns in richness of one group to be obtained from those of another, these correlations are frequently weak, of rather limited predictive value, and in some cases explained by latitudinal gradients in diversity68 (Fig. 4). These conclusions seem to hold at finer resolutions over more constrained areas. Thus, at a scale of 10 km ǂ 10 km squares, species-richareasfordifferenttaxainBritainfrequentlydonotcoin- cide69 . These areas are not distributed randomly, overlapping more oftenthanexpectedbychance,butstillataratherlowlevel.Likewise, different taxa are species poor or species rich in different areas of the northernregionofSouthAfrica70 . Where positive relationships are found between the species rich- nessoftwoormoregroups,thismayreflectpatternsofsamplingeffort (a complication plaguing many biodiversity studies), rather than any underlyingcovariance.Ifreal,thenthisdoesnotnecessarilyimplyany direct linkage between the richness of those groups. Covariance can occurbecauseoftrophicorotherrelations,butmightalsoresultfrom random effects, because groups share common determinants of rich- ness, or even because groups differ in determinants of richness but thesedeterminantsthemselvesexhibitspatialcovariance71 . The lack of strong positive covariance in the species richness of higher taxa is significant in that it constrains the extent to which observedpatternsinbiodiversitycanbeextrapolatedfromonegroup to another, and from exemplar groups to biodiversity at large (with implications for the planning and likely success of networks of insight review articles NATURE | VOL 405 | 11 MAY 2000 | www.nature.com 225 90 130 170 210 250 290 0 5 10 15 20 25 30 35 NumberoffrogspeciesNumberofbirdspecies 0 5 10 15 20 25 30 35 40 45 0 5 10 15 20 25 30 35 Numberofsnakespecies 5 10 15 20 25 30 35 40 0 5 10 15 20 25 30 35 Number of marsupial species Number of marsupial species Number of marsupial species a b c Figure 4 Relationships between species richness of different vertebrate groups (in grid cells of 240 km ǂ 240 km) across Australia. a, Birds; b, frogs; and c, snakes, with marsupials (from data in ref. 79). © 2000 Macmillan Magazines Ltd
- 7. protected areas). The latter is particularly important given that only ~15% of the total number of species estimated to be extant has been formally described taxonomically, that the distributions of most of these remain largely unknown (a high proportion are known from only a single locality72,73 ), and that species whose distributions are well documented are strongly biased with respect to their higher tax- onomic affinities. But such outcomes are inevitable, because of the multiple forces at work in structuring global patterns of biodiversity, andbecausetheparticularoutcomesobservedrestfundamentallyon the balance of those forces. Indeed, even where two groups exhibit similar spatial gradients in biodiversity there is substantial variation around those trends, and the details are seldom similar. In the extreme, some groups exhibit patterns of biodiversity that are entirelycontrarytothenorm.Forexample,severalmajortaxonomic groups exhibit peaks of species richness at high or mid-latitudes (for example, aphids, sawflies, ichneumonids, braconids, bees, various groups of freshwater invertebrates, marine amphipods, and procel- lariiforms1,74 ); exceptions to patterns of biodiversity tend to be observed more frequently at lower taxonomic levels than at higher levels. Which particular patterns are and are not expressed by a given taxon rest on contingencies (for example, physiology, dispersal ability,resourcerequirementsandevolutionaryhistory56 ). In conclusion Development of a markedly improved understanding of the global distribution of biodiversity is one of the most significant objectives for ecologists and biogeographers. Spatial heterogeneity in species richness, in particular, is an obvious feature of the natural world. An understanding of its determinants will impinge on applied issues of major concern to humankind, including the role of biodiversity in ecosystem processes, the spread of alien invasive species, the control of diseases and their vectors, and the likely effects of global environ- mentalchangeonthemaintenanceofbiodiversity. A substantial proportion of regional variation in species richness can be explained statistically in terms of a few environmental variables1 . This is, however, far from a predictive theory of species richness. It is the need to identify the contingencies involved in the expressionofpatternsinbiodiversity,andtoweightheirsignificance, that constitutes the real challenge to developing such a theory. The number of species is determined by the birth, death, immigration and emigration rates of species in an area. These rates in turn are determined by the effects of abiotic and biotic factors (the latter may be intrinsic or extrinsic to the organisms of concern) acting at local and regional scales. Although multiple factors doubtless contribute, if a factor influences biodiversity on one spatial axis (for example, latitude)thenitseemsreasonabletopresumethatallelsebeingequal it will do so along others where the factor also varies (for example, elevation). Thus, relationships between species richness and envi- ronmental energy have been found to be associated with latitudinal, elevational and depth gradients75 . If this were the whole story, patterns in richness would seem reasonably straightforward, if not easy, to predict. However, it is not simply the current states of these factors that are important but also their historical dynamics. These have shaped variations in the distribution of different groups of organisms, in their diversification, and hence the availability of species with different attributes to exploit opportunities provided by prevailing conditions. As such, the study of global patterns in biodiversitydemandsinsightsfromgeneticiststhroughtoecosystem ecologists. All concerned will need to remember that no single mechanism need adequately explain a given pattern, that observed patterns may vary with spatial scale, that processes at regional scales influence patterns observed at local ones, and that no pattern is withoutvariationsandexceptions. ss 1. Gaston, K. J. & Williams, P. H. in Biodiversity: A Biology of Numbers and Difference (ed. Gaston, K. J.) 202–229 (Blackwell Science, Oxford, 1996). 2. Brown, J. H. & Lomolino, M. V. Biogeography 2nd edn (Sinauer, Sunderland, MA, 1998). 3. Stevens, G. C. The latitudinal gradient in geographical range: how so many species co-exist in the tropics. Am. Nat. 133, 240–256 (1989). 4. Gaston, K. J. Biodiversity — latitudinal gradients. Prog. Phys. Geogr. 20, 466–476 (1996). 5. Stehli, F. G., Douglas, D. G. & Newell, N. D. Generation and maintenance of gradients in taxonomic diversity. Science 164, 947–949 (1969). 6. Crane, P. R. & Lidgard, S. Angiosperm diversification and paleolatitudinal gradients in Cretaceous floristic diversity. Science 246, 675–678 (1989). 7. Clarke, A. & Crame, J. A. in Marine Biodiversity: Patterns and Processes (eds Ormond, R. F. G., Gage, J. D. & Angel, M. V.) 122–147 (Cambridge Univ. Press, Cambridge, 1997). 8. Platnick, N. I. Patterns of biodiversity: tropical vs temperate. J. Nat. Hist. 25, 1083–1088 (1991). 9. Blackburn, T. M. & Gaston, K. J. Spatial patterns in the species richness of birds in the New World. Ecography 19, 369–376 (1996). 10. Roy, K., Jablonski, D., Valentine, J. W. & Rosenberg, G. Marine latitudinal diversity gradients: tests of causal hypotheses. Proc. Natl Acad. Sci. USA 95, 3699–3702 (1998). 11. Lyons, S. K. & Willig, M. R. A hemispheric assessment of scale dependence in latitudinal gradients of species richness. Ecology 80, 2483–2491 (1999). 12. Blackburn, T. M. & Gaston, K. J. A sideways look at patterns in species richness, or why there are so few species outside the tropics. Biodiv. Lett. 3, 44–53 (1996). 13. Colwell, R. K. & Hurtt, G. C. Nonbiological gradients in species richness and a spurious Rapoport effect. Am. Nat. 144, 570–595 (1994). 14. Terborgh, J. On the notion of favorableness in plant ecology. Am. Nat. 107, 481–501 (1973). 15. Osman,R.W.&Whitlatch,R.B.Patternsofspeciesdiversity:factorartifact? Paleobiology4,41–54(1978). 16. Rosenzweig, M. L. Species diversity gradients: we know more and less than we thought. J. Mamm. 73, 715–730 (1992). 17. Rosenzweig, M. L. Species Diversity in Space and Time (Cambridge Univ. Press, Cambridge, 1995). 18. Blackburn, T. M. & Gaston, K. J. The relationship between geographic area and the latitudinal gradient in species richness in New World birds. Evol. Ecol. 11, 195–204 (1997). 19. Rosenzweig, M. L. & Sandlin, E. A. Species diversity and latitudes: listening to area’s signal. Oikos 80, 172–176 (1997). 20. MacArthur, R. H. & Connell, J. H. The Biology of Populations (Wiley, New York, 1966). 21. Gaston, K. J. & Blackburn, T. M. A critique for macroecology. Oikos 84, 353–368 (1999). 22. Lawton, J. H. Patterns in ecology. Oikos 75, 145–147 (1996). 23. Rosenzweig, M. L. & Abramsky, Z. in Species Diversity in Ecological Communities (eds Ricklefs, R. E. & Schluter, D.) 52–65 (Univ. Chicago Press, Chicago, 1993). 24. Currie, D. J. & Paquin, V. Large-scale biogeographical patterns of species richness of trees. Nature 329, 326–327 (1987). 25. Turner, J. R. G., Gatehouse, C. M. & Corey, C. A. Does solar energy control organic diversity? Butterflies, moths and the British climate. Oikos 48, 195–205 (1987). 26. Turner, J. R. G., Lennon, J. J. & Lawrenson, J. A. British bird species distributions and energy theory. Nature 335, 539–541 (1988). 27. Adams, J. M. & Woodward, F. I. Patterns in tree species richness as a test of the glacial extinction hypothesis. Nature 339, 699–701 (1989). 28. Currie, D. J. Energy and large-scale patterns of animal- and plant-species richness. Am. Nat. 137, 27–49 (1991). 29. Wright, D. H., Currie, D. J. & Maurer, B. A. in Species Diversity in Ecological Communities (eds Ricklefs, R. E. & Schluter, D.) 66–74 (Univ. Chicago Press, Chicago, 1993). 30. Kerr, J. T., Vincent, R. & Currie, D. J. Lepidopteran richness patterns in North America. Ecoscience 5, 448–453 (1998). 31. Kerr, J. T. & Packer, L. The environmental basis of North American species richness patterns among Epicauta (Coleoptera: Meloidae). Biodiv. Conserv. 8, 617–628 (1999). 32. Rutherford, S., D’Hondt, S. & Prell, W. Environmental controls on the geographic distribution of zooplankton diversity. Nature 400, 749–753 (1999). 33. Lennon, J. J., Greenwood, J. J. D. & Turner, J. R. G. Bird diversity and environmental gradients in Britain: a test of the species-energy hypothesis. J. Anim. Ecol. (in the press). 34. Kerr, J. T. & Currie, D. J. The relative importance of evolutionary and environmental controls on broad-scale patterns of species richness in North America. Ecoscience 6, 329–337 (1999). 35. Tilman, D. & Pacala, S. in Species Diversity in Ecological Communities (eds Ricklefs, R. E. & Schluter, D.) 13–25 (Univ. Chicago Press, Chicago, 1993). 36. Gaston, K. J. & Blackburn, T. M. Mapping biodiversity using surrogates for species richness: macro- scales and New World birds. Proc. R. Soc. Lond. B 262, 335–341 (1995). 37. Chown, S. L. & Gaston, K. J. Patterns in procellariiform diversity as a test of species-energy theory in marine systems. Evol. Ecol. Res. 1, 365–173 (1999). 38. Martin, T. E. Species-area slopes and coefficients: a caution on their interpretation. Am. Nat. 118, 823–837 (1981). 39. Palmer, M. W. & White, P. S. Scale dependence and the species-area relationship. Am. Nat. 144, 717–740 (1994). 40. Latham, R. E. & Ricklefs, R. E. Global patterns of tree species richness in moist forests: energy- diversity theory does not account for variation in species richness. Oikos 67, 325–333 (1993). 41. Francis, A. P. & Currie, D. J. Global patterns of tree species richness in moist forests: another look. Oikos 81, 598–602 (1998). 42. Ricklefs, R. E., Latham, R. E. & Qian, H. Global patterns of tree species richness in moist forests: distinguishing ecological influences and historical contingency. Oikos 86, 369–373 (1999). 43. Cousins, S. H. Species richness and the energy theory. Nature 340, 350–351 (1989). 44. Gaston, K. J. & Blackburn, T. M. Pattern and Process in Macroecology (Blackwell Science, Oxford, in the press). 45. Srivastava, D. S. & Lawton, J. H. Why more productive sites have more species: an experimental test of theory using tree-hole communities. Am. Nat. 152, 510–529 (1998). 46. Gaston, K. J., Blackburn, T. M. & Lawton, J. H. Interspecific abundance-range size relationships: an appraisal of mechanisms. J. Anim. Ecol. 66, 579–601 (1997). 47. Wright, D. H. Species-energy theory: an extension of species area-theory. Oikos 41, 496–506 (1983). 48. Hayden, B. P. Ecosystem feedbacks on climate at the landscape scale. Phil. Trans. R. Soc. Lond. B 353, 5–18 (1998). 49. Zheng, X. Y. & Eltahir, E. A. B. The role of vegetation in the dynamics of West African monsoons. J. Clim. 11, 2078–2096 (1998). 50. Collar, N. J., Crosby, M. J. & Stattersfield, A. J. Birds to Watch 2: The World List of Threatened Birds (BirdLife International, Cambridge, 1994). 51. Schläpfer, F. & Schmid, B. Ecosystem effects of biodiversity: a classification of hypotheses and insight review articles 226 NATURE | VOL 405 | 11 MAY 2000 | www.nature.com© 2000 Macmillan Magazines Ltd
- 8. exploration of empirical results. Ecol. Appl. 9, 893–912 (1999). 52. Tilman, D. The ecological consequences of changes in biodiversity: a search for general principles. Ecology 80, 1455–1474 (1999). 53. Holmes, R. T. & Sturges, F. W. Avian community dynamics and energetics in a northern hardwoods ecosystem. J. Anim. Ecol. 44, 175–200 (1975). 54. Cornell, H. V. & Lawton, J. H. Species interactions, local and regional processes, and limits to the richness of ecological communities: a theoretical perspective. J. Anim. Ecol. 61, 1–12 (1992). 55. Huston, M. A. Local processes and regional patterns: appropriate scales for understanding variation in the diversity of plants and animals. Oikos 86, 393–401 (1999). 56. Lawton, J. H. Are there general laws in ecology? Oikos 84, 177–192 (1999). 57. Srivastava, D. S. Using local-regional richness plots to test for species saturation: pitfalls and potentials. J. Anim. Ecol. 68, 1–16 (1999). 58. Caley, M. J. & Schluter, D. The relationship between local and regional diversity.Ecology 78, 70–80 (1997). 59. Hawkins, B. A. & Compton, S. G. African fig wasp communities: undersaturation and latitudinal gradients in species richness. J. Anim. Ecol. 61, 361–372 (1992). 60. Pearson, D. L. & Juliano, S. A. in Species Diversity in Ecological Communities (eds Ricklefs, R. E. & Schluter, D.) 194–202 (Univ. Chicago Press, Chicago, 1993). 61. Griffiths, D. Local and regional species richness in North American lacustrine fish. J. Anim. Ecol. 66, 49–56 (1997). 62. Eeley, H. A. C. & Lawes, M. J. in Primate Communities (eds Feagle, J. G., Janson, C. & Reed, K. E.) 191–219 (Cambridge Univ. Press, Cambridge, 1999). 63. Cornell, H. V. Unsaturation and regional influences on species richness in ecological communities: a review of the evidence. Ecoscience 6, 303–315 (1999). 64. Whittaker, R. H. Vegetation of the Siskiyou mountains, Oregon and California. Ecol. Monogr. 30, 279–338 (1960). 65. Ricklefs, R. E. & Schluter, D. (eds) Species Diversity in Ecological Communities (Univ. Chicago Press, Chicago, 1993). 66. Gotelli, N. J. & Graves, G. R. Null Models in Ecology (Smithsonian Institution Press, Washington DC, 1996). 67. Brown, J. H. Macroecology (Univ. Chicago Press, Chicago, 1995). 68. Flather, C. H., Wilson, K. R., Dean, D. J. & McComb, W. C. Identifying gaps in conservation networks: of indicators and uncertainty in geographic-based analyses. Ecol. Appl. 7, 531–542 (1997). 69. Prendergast, J. R., Quinn, R. M., Lawton, J. H., Eversham, B. C. & Gibbons, D. W. Rare species, the coincidence of diversity hotspots and conservation strategies. Nature 365, 335–337 (1993). 70. van Jaarsveld, A. S. et al. Biodiversity assessment and conservation strategies. Science 279, 2106–2108 (1998). 71. Gaston, K. J. Biodiversity — congruence. Prog. Phys. Geogr. 20, 105–112 (1996). 72. Stork, N. E. in Biodiversity II: Understanding and Protecting our Biological Resources (eds Reaka-Kudla, M. L., Wilson, D. E. & Wilson, E. O.) 41–68 (Henry, Washington DC, 1997). 73. Andersen, M., Thornhill, A. & Koopowitz, H. in Tropical Forest Remnants: Ecology, Management, and Conservation of Fragmented Communities (eds Laurance, W. F. & Bierregaard, R. O. Jr) 281–291 (Univ. Chicago Press, Chicago, 1997). 74. Chown, S. L., Gaston, K. J. & Williams, P. H. Global patterns in species richness of pelagic seabirds: the Procellariiformes. Ecography 21, 342–350 (1998). 75. Rohde, K. Latitudinal gradients in species diversity: the search for the primary cause. Oikos 65, 514–527 (1992). 76. Judas, M. The species-area relationship of European Lumbricidae (Annelida, Oligochaeta). Oecologia 76, 579–587 (1988). 77. Patterson, B. D., Stotz, D. F., Solari, S., Fitzpatrick, J. W. & Pacheco, V. Contrasting patterns of elevational zonation for birds and mammals in the Andes of southeastern Peru. J. Biogeogr. 25, 593–607 (1998). 78. O’Brien, E. M. Climatic gradients in woody plant species richness: towards an explanation based on an analysis of southern Africa’s woody flora. J. Biogeogr. 20, 181–198 (1993). 79. Pianka, E. R. & Schall, J. J. in Ecological Biogeography of Australia Vol. 3 (ed. Keast, A.) 1677–1694 (Junk, The Hague, 1981). Acknowledgements I thank T. M. Blackburn, S. L. Chown, A. Clarke, S. Gaston, P. H. Warren, T. J. Webb and F. I. Woodward for generous discussion and comments, and J. J. D. Greenwood and the British Trust for Ornithology, D. Griffiths, J. T. Kerr, J. J. Lennon, E. M. O’Brien, B. D. Patterson and R. J. Whittaker for kindly providing data. K.J.G. is a Royal Society University Research Fellow. insight review articles NATURE | VOL 405 | 11 MAY 2000 | www.nature.com 227© 2000 Macmillan Magazines Ltd