Fullerton Securities' Weekly newsletter - 25th September 2010
1. Volume: 1 | Issue: 77| September 25, 2010
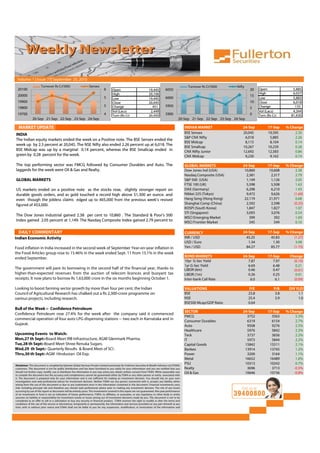
Turnover Rs Cr('000) Sensex Turnover Rs Cr('000) Nifty
20100 6 Open 19,445 6050 20 Open 5,885
High 20,106 High 6,037
20000 15
5 Low 19,445 6000 Low 5,885
19900 Close 20,045 10 Close 6,018
5 Change 451 5950 Change 133
19800 5
Vol (Lacs) 2,449 Vol (Lacs) 4,344
19700 4 Turn (Rs Cr) 20,450 5900 0 Turn (Rs Cr) 81,630
20-Sep 21-Sep 22-Sep 23-Sep 24-Sep 20-Sep 21-Sep 22-Sep 23-Sep 24-Sep
MARKET UPDATE INDIAN MARKET 24-Sep 17-Sep % Change
INDIA BSE Sensex 20,045 19,595 2.30
S&P CNX Nifty 6,018 5,885 2.26
The Indian equity markets ended the week on a Positive note. The BSE Sensex ended the
BSE Midcap 8,115 8,104 0.14
week up by 2.3 percent at 20,045. The NSE Nifty also ended 2.26 percent up at 6,018. The
BSE Smallcap 10,267 10,239 0.28
BSE Midcap was up by a marginal 0.14 percent, whereas the BSE Smallcap ended in CNX Nifty Junior 12,692 12,583 0.86
green by 0.28 percent for the week. CNX Midcap 9,230 9,162 0.74
The top performing sector was FMCG followed by Consumer Durables and Auto. The GLOBAL MARKETS 24-Sep 17-Sep % Change
laggards for the week were Oil & Gas and Realty. Dow Jones Ind (USA) 10,860 10,608 2.38
Nasdaq Composite (USA) 2,381 2,317 2.79
GLOBAL MARKETS S&P 500 (USA) 1,149 1,126 2.05
FTSE 100 (UK) 5,598 5,508 1.63
US markets ended on a positive note as the stocks rose, slightly stronger report on DAX (Germany) 6,298 6,210 1.43
durable goods orders, and as gold touched a record high above $1,300 an ounce. and Nikkei 225 (Tokyo) 9,472 9,626 (1.60)
even though the jobless claims edged up to 465,000 from the previous week's revised Hang Seng (Hong Kong) 22,119 21,971 0.68
figured of 453,000. Shanghai Comp (China) 2,592 2,598 (0.25)
KOSPI (South Korea) 1,847 1,827 1.07
STI (Singapore) 3,093 3,076 0.54
The Dow Jones industrial gained 2.38 per cent to 10,860 . The Standard & Poor's 500
MSCI Emerging Market 399 392 1.69
Index gained 2.05 percent at 1,149. The Nasdaq Composite Index gained 2.79 percent to MSCI Frontier Market 545 544 0.10
DAILY COMMENTARY CURRENCY 24-Sep 17-Sep % Change
Indian Economic Activity INR / USD 45.25 45.83 (1.27)
USD / Euro 1.34 1.30 3.08
Food inflation in India increased in the second week of September Year-on-year inflation in Yen / USD 84.27 85.77 (1.75)
the Food Articles group rose to 15.46% in the week ended Sept. 11 from 15.1% in the week
BOND MARKETS 24-Sep 17-Sep Change
ended September.
10yr G-Sec Yield 7.87 7.97 (0.10)
1yr G-Sec Yield 6.69 6.48 0.21
The government will pare its borrowing in the second half of the financial year, thanks to LIBOR (6m) 0.46 0.47 (0.01)
higher-than-expected revenues from the auction of telecom licences and buoyant tax LIBOR (1m) 0.26 0.25 0.01
receipts. It now plans to borrow Rs 1,63,000 crore in the six months beginning October 1. Inter-bank Call Rate 6.0 6.1 (0.09)
Looking to boost farming sector growth by more than four per cent, the Indian VALUATIONS P/E P/B DIV YLD
Council of Agricultural Research has chalked out a Rs 2,300-crore programme on BSE 23.8 3.8 1.1
various projects, including research. NSE 25.4 3.9 1.0
BSE500 Mcap/GDP Ratio 0.64
Bull of the Week :- Confidence Petroleum
SECTOR 24-Sep 17-Sep % Change
Confidence Petroleum rose 27.4% for the week after the company said it commenced
FMCG 3752 3563 5.3%
commercial operation of four auto LPG dispensing stations -- two each in Karnataka and in Consumer Durables 6319 6154 2.7%
Gujarat. Auto 9508 9276 2.5%
Healthcare 5976 5842 2.3%
Upcoming Events to Watch: Teck 3737 3656 2.2%
Mon,27 th Sept:-Board Meet IRB Infrastructure, AGM Glenmark Pharma. IT 5973 5844 2.2%
Tue,28 th Sept:-Board Meet Shree Renuka Sugars. Capital Goods 15842 15511 2.1%
Wed,29 th Sept:- Quarterly Results & Board Meet of SCI . Bankex 13914 13745 1.2%
Thru,30 th Sept:-AGM Hindustan Oil Exp. Power 3200 3164 1.1%
Metal 16652 16489 1.0%
Disclaimer: This document is compiled by Epitome Global Services Private Limited exclusively for Fullerton Securities & Wealth Advisors Ltd (FSWA)
PSU 10313 10242 0.7%
customers. This document is not for public distribution and has been furnished to you solely for your information and you are notified that you Realty 3696 3713 -0.5%
should not further copy, modify, use or distribute the information in any way unless you obtain written consent from FSWA. While reasonable care Oil & Gas 10646 10736 -0.8%
to compile the document but the accuracy and completeness cannot be guaranteed either by FSWA or any other person or entity associated with
it. The document is prepared only for your information and is not sufficient for making an investment decision. You should rely on your own
investigations and seek professional advice for investment decision. Neither FSWA nor any person connected with it, accepts any liability either
arising from the use of this document or due to any inadvertent error in the information contained in this document. Financial investments carry
risks including principal risk and therefore you should seek professional advice prior to making any investment decision. The risk of any losses
occurring by use of this report or document will be entirely yours. The investments covered in this report are not guaranteed. Also past performance
of an investment or fund is not an indication of future performance. FSWA, its affiliates, or associates, or any regulatory or other body or entity
assumes no liability or responsibility for investment results or losses arising out of investment decisions made by you. This document is not to be
considered as an offer to sell or a solicitation to buy any security or financial product. FSWA reserves the right to modify or alter the terms and
conditions of the use of this service or discontinue, temporarily or permanently, the information and services provided (or any part thereof) at any
time, with or without prior notice and FSWA shall not be liable to you for any suspension, modification, or termination of the information and
2. Volume: 1 | Issue: 77| September 25, 2010
COMMODITY 24-Sep 17-Sep Change % Change
Light Sweet Crude Oil gained 4.1 percent this week closing at $76.5 from $73.5 per
Crude Oil (USD/bbl) 76.5 73.5 3 4.1
barrel last week. Gold lost 0.2 percent closed at Rs 19,121 while Silver closed 1.3 Gold (Rs/10 gm) 19,121.0 19,151.0 (30) (0.2)
percent higher at Rs 32,702 in the Indian market respectively. Silver (Rs/kg) 32,702.0 32,281.0 421 1.3
SECTORAL ANALYSIS TOP PERFORMING SECTORS
Sectoral Performance Analysis BSE FMCG Price % Average
Gainers This Wk Prev. Wk Return Volume
BSE FMCG Colgate-Palm. 918 822 11.7 12,159
Hind. Unilever 315 282 11.6 1,50,171
The BSE FMCG index gained 5.3 percent for the week. The top gainer for the week
ITC 179 168 6.2 4,33,476
was Colgate Palmolive gaining 11.7 percent followed by HUL and ITC gaining 11.6
Tata Global 125 123 1.9 1,22,521
percent and 6.2 percent respectively. Tata Global and Nestle India gained 1.9
Nestle India 3291 3230 1.9 2,804
percent each.
BSE Consumer Durables Price % Average
BSE Consumer Durables Gainers This Wk Prev. Wk Return Volume
Gitanjali Gems 242 220 10.4 1,54,329
The BSE Consumer Durables Index gained 2.7 percent this week. The top gainers Blue Star 492 465 5.9 6,284
were Gitanjali Gems gaining 10.4 percent followed by Blue Star gaining 5.9 percent. Titan Inds. 3351 3199 4.8 10,068
Titan Industries gained 4.8 percent, V I P gained 0.5 percent and Bajaj Electrical V I P Inds. 537 534 0.5 1,22,371
gained 0.4 percent. Bajaj Electrical 299 298 0.4 33,932
BSE Auto BSE Auto Price % Average
Gainers This Wk Prev. Wk Return Volume
The BSE Auto Index gained 2.5 percent this week . The top gainer in this index was Maruti Suzuki 1481 1387 6.8 1,15,078
Maruti gaining 6.8 percent followed by Hero Honda gaining 6.6 percent. Tata Motors Hero Honda Motor 1865 1750 6.6 9,565
gained 3.4 percent . Other gainers were Exide Industries which gained 2.1 percent Tata Motors 1070 1036 3.4 1,67,908
Exide Inds. 163 160 2.1 1,21,897
while M & M and Cummins India gained 1.6 percent and 0.2 percent respectively.
M&M 690 679 1.6 68,669
Cummins India 747 746 0.2 1,64,553
BSE Healthcare BSE Healthcare Price % Average
Gainers This Wk Prev. Wk Return Volume
The BSE Consumer Durables Index gained 2.3 percent this week. The Top gainer in GlaxoSmithKline Pharma 2111 1957 7.9 2,136
this index was Glaxosmit Pharma gaining 7.9 percent followed by Ranbaxy Ranbaxy Labs. 570 534 6.8 85,510
Laboratories gaining 6.8 percent. Other gainers were Ipca Labs which gained 4.4 Ipca Labs. 306 293 4.4 12,986
percent, Apollo Hospitals which gained 4.0 percent and Lupin which gained 3.4 Apollo Hospitals 427 410 4.0 13,090
percent. Lupin 401 388 3.4 4,23,046
BSE Teck BSE Teck Price % Average
Gainers This Wk Prev. Wk Return Volume
The BSE Teck Index gained 2.2 percent this week . Top gainer in this index was Shree Sh.Ashtavinayak 31 28 10.1 49,52,428
Ashtavinayak gaining 10.1 percent followed by Tech Mahindra gaining 7.3 percent. D Tech Mahindra 773 720 7.3 20,884
B Corp gained 7.3 percent, Zee Entertainment gained 6.5 percent while other gainers D B Corp 286 267 7.3 7,121
were Wipro gaining 6.1 percent and Sterlite which gained 3.8 percent. Zee Entertainment 305 286 6.5 1,43,460
Wipro 446 420 6.1 79,926
Sterlite Tech. 100 96 3.8 1,04,340
This document is compiled by Epitome Global Services Private Limited exclusively for Fullerton Securities & Wealth Advisors Ltd (FSWA) customers. This document is not for public distribution and has been
furnished to you solely for your information and you are notified that you should not further copy, modify, use or distribute the information in any way unless you obtain written consent from FSWA. While
reasonable care to compile the document but the accuracy and completeness cannot be guaranteed either by FSWA or any other person or entity associated with it. The document is prepared only for your
information and is not sufficient for making an investment decision. You should rely on your own investigations and seek professional advice for investment decision. Neither FSWA nor any person connected
with it, accepts any liability either arising from the use of this document or due to any inadvertent error in the information contained in this document. Financial investments carry risks including principal risk
and therefore you should seek professional advice prior to making any investment decision. The risk of any losses occurring by use of this report or document will be entirely yours. The investments covered in
this report are not guaranteed. Also past performance of an investment or fund is not an indication of future performance. FSWA, its affiliates, or associates, or any regulatory or other body or entity assumes no
liability or responsibility for investment results or losses arising out of investment decisions made by you. This document is not to be considered as an offer to sell or a solicitation to buy any security or financial
product. FSWA reserves the right to modify or alter the terms and conditions of the use of this service or discontinue, temporarily or permanently, the information and services provided (or any part thereof) at
any time, with or without prior notice and FSWA shall not be liable to you for any suspension, modification, or termination of the information and services provided herein.
3. Volume: 1 || Issue: 77| |April 8, 2009 25, 2010
Volume: 1 Issue: 3 September
FII / MF ACTIVITY (Rs. Cr) 17-Sep 20-Sep 21-Sep 22-Sep 23-Sep
FII Cash Net 1715.8 1878.6 3312.8 1505.4 582.6
MF FII Sensex FII Index Futures 499 1277 -1517 -1717 -1000.4
FII Index Options 239 170 -986.42 -1339 -382.33
4000 20200 FII Stock Futures -124 -494.55 -618 -860 -758
FII Stock Options 8 9.8 -53.5 -17 -9.5
3000 20000 FII Net 2336 2841 138 -2428 -1568
Open Interest 207907 211074 213224 212777 213687
2000 19800 Mutual Fund -345 -208.8 -750 -450 -278
1000 19600 TURNOVER (Rs. Cr)
BSE NSE CASH NSE F&O
0 19400 60000
17-Sep 20-Sep 21-Sep 22-Sep 23-Sep
-1000 19200 40000
144638
156526
113549
145122
16169
17933
17059
14484
16012
5229
5432
5241
4597
5124
20000
-2000 19000
0
-3000 18800
20-Sep 21-Sep 22-Sep 23-Sep 24-Sep
MOVERS & SHAKERS
TOP 5 FRONTLINE GAINERS TOP 5 MIDCAP GAINERS TOP 5 SMALLCAP GAINERS
Name Rs % Name Rs % Name Rs %
Hind. Unilever 314.6 11.6% South Ind.Bank 24.65 16.8% Dunlop India 92.4 31.5%
HDFC 732.0 7.0% JSL Stain. 125.20 16.1% CCL Products 345.1 29.7%
Maruti Suzuki 1481.1 6.8% JSW Holdings 2067.25 14.9% Confidence Petro 18.6 27.4%
Hero Honda Motor 1865.2 6.6% Punj Lloyd 132.10 12.1% Henkel India 74.2 23.9%
ITC 178.8 6.2% GlaxoSmith C H L 2011.95 11.1% Gulf Oil Corpn. 106.9 20.0%
TOP 5 FRONTLINE LOSERS TOP 5 MIDCAP LOSERS TOP 5 SMALLCAP LOSERS
Name Rs % Name Rs % Name Rs %
Reliance Inds. 1001.7 -2.4% Financial Tech. 1221.00 -14.1% Resurgere Mines 2.3 -24.2%
Jindal Steel 692.7 -2.3% Geekay Finance 12.21 -11.5% Well Pack Paper. 66.1 -19.2%
JP Associates 121.2 -1.2% Redington India 83.95 -10.1% Gallantt Metal 32.0 -17.5%
Sterlite Inds. 172.4 -0.5% Trent 1043.35 -8.8% Tatia Global 22.0 -14.9%
ICICI Bank 1112.3 -0.3% Cox & Kings 580.55 -8.3% Indowind Energy 41.4 -13.9%
INSIDER UPDATES
No. of Shares Transacted Holding after
Company Name Acquirer Designation Transaction Date BUY/SELL
Quantity Transaction %
Akar Tools Ltd Kathiawad Investments Investor 16/08/2010 SELL 6000 0.91
Ankur Drugs and Pharma Ltd JM Financial Ventures Investor 30/08/2010 BUY 150000 0.08
Aries Agro Ltd S Ramamurthy CFO 30/08/2010 BUY 5000 5.67
Arms Paper Ltd Nigo Best Packs Investor 27/08/2010 SELL 581538 0.04
Asian Hotels (East) Ltd Forex Finance Investor 26/08/2010 BUY 1706250 0
B & A Ltd Hemendra Prasad Barooah Investor 25/08/2010 BUY 5094 6.94
Bajaj Hindusthan Ltd Shishir Bajaj Chairman & MD 25/08/2010 SELL 6004200 28.25
BMB Music & Magnetics Ltd K C Bokadia Promoter 24/08/2010 SELL 75000 26.32
Cadila Healthcare Ltd Nitin D Parekh CFO 19/08/2010 BUY 1250 26.04
Camlin Ltd Vidyadhar K Marathe Promoter 19/08/2010 SELL 5400 1.95
EID Parry India Ltd Suresh Krishnan Company Secretary 25/08/2010 SELL 100000 0.02
EIH Ltd P R S Oberoi Chairman & CEO 30/08/2010 BUY 2000000 0.66
Envair Electrodyne Ltd Shripad Mirashi Chairman & MD 20/08/2010 SELL 900 0.05
Frontline Securities Ltd Rakesh K Jain Chairman 20/08/2010 BUY 45790 52.78
Gitanjali Gems Ltd Mehul C Choksi Chairman & MD 25/08/2010 BUY 100000 4.14
GMR Industries Ltd EID Parry (India) Promoter 27/08/2010 BUY 10542993 44.98
Gujarat Ambuja Exports Ltd Manish Kumar Gupta Promoter 20/08/2010 SELL 32835 5.07
Gulshan Chemfill Ltd Mridula Jain Director 18/08/2010 BUY 2000 23.90
Havells India Ltd QRG Enterprises Promoter 27/08/2010 BUY 2219000 8.88
HDFC Bank Ltd Abhay Aima Director 26/08/2010 SELL 25000 0.66
Disclaimer: This document is compiled by Epitome Global Services Private Limited exclusively for Fullerton Securities & Wealth Advisors Ltd (FSWA) customers. This document is not for public distribution and has been furnished
to you solely for your information and you are notified that you should not further copy, modify, use or distribute the information in any way unless you obtain written consent from FSWA. While reasonable care to compile the
document but the accuracy and completeness cannot be guaranteed either by FSWA or any other person or entity associated with it. The document is prepared only for your information and is not sufficient for making an
investment decision. You should rely on your own investigations and seek professional advice for investment decision. Neither FSWA nor any person connected with it, accepts any liability either arising from the use of this
document or due to any inadvertent error in the information contained in this document. Financial investments carry risks including principal risk and therefore you should seek professional advice prior to making any
investment decision. The risk of any losses occurring by use of this report or document will be entirely yours. The investments covered in this report are not guaranteed. Also past performance of an investment or fund is not an
indication of future performance. FSWA, its affiliates, or associates, or any regulatory or other body or entity assumes no liability or responsibility for investment results or losses arising out of investment decisions made by you.
This document is not to be considered as an offer to sell or a solicitation to buy any security or financial product. FSWA reserves the right to modify or alter the terms and conditions of the use of this service or discontinue,
temporarily or permanently, the information and services provided (or any part thereof) at any time, with or without prior notice and FSWA shall not be liable to you for any suspension, modification, or termination of the
information and services provided herein.