Download as PDF, PPTX

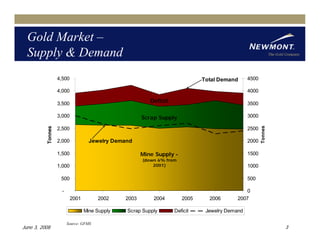
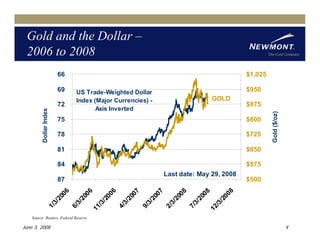
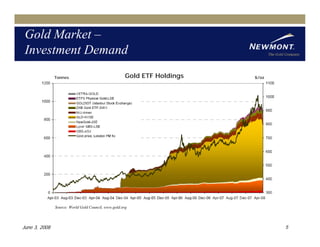
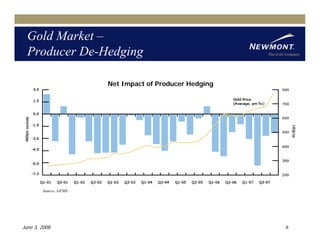
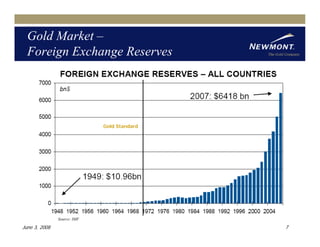
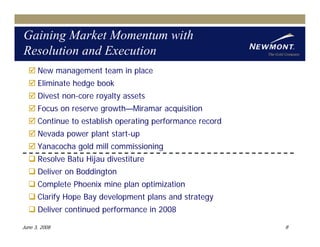
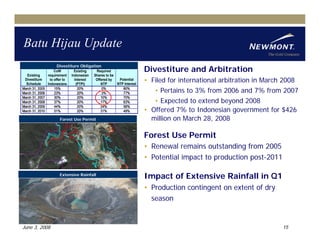

The document discusses the gold market and Barrick Gold Corporation's strategy. It provides an overview of gold supply and demand trends, the relationship between gold prices and the US dollar, growth in gold investment demand, reductions in producer hedging, and central banks accumulating gold reserves. It also outlines Barrick's plans to eliminate its hedge book, divest non-core assets, focus on reserve growth through acquisitions, improve operating performance, start up new projects, and resolve the divestiture of its Batu Hijau mine in Indonesia.